- 1School of Emergency Management, Nanjing University of Information Science and Technology, Nanjing, Jiangsu, China
- 2Collaborative Innovation Center on Forecast and Evaluation of Meteorological Disasters, Nanjing University of Information Science and Technology, Nanjing, Jiangsu, China
- 3Key Laboratory of Middle Atmosphere and Global Environment Observation, Chinese Academy of Sciences, Beijing, China
- 4Academy of Disaster Reduction and Emergency Management of Nanjing University of Information Science and Technology, Nanjing, Jiangsu, China
- 5Nanjing Xinda Institute of Safety and Emergency Management, Nanjing, Jiangsu, China
- 6Meteorological Observatory of Liaoning Province, Shenyang, China
- 7Institute of Atmospheric Environment, China Meteorological Administration, Shenyang, China
Using the air quality monitoring data from the Department of Ecology and Environment of Liaoning Province for the period from 2017 to 2022, the temporal and spatial changes in the concentrations of various air pollutants in the Liaoning region for the periods from 2017 to 2019 and 2020 to 2022 were analyzed by using the Evaluation on the meteorological condition index of PM2.5 pollution (EMI) and the ArcGIS Kriging Interpolation Method, and the contributions of pollution reduction to the changes in the air quality of the Liaoning region were assessed. The results show that after the implementation of emission reduction measures, the quality of the atmospheric environment in the Liaoning region has significantly improved, and the mean concentrations of PM2.5, PM10, SO2, NO2, CO and O3 are all reduced by a certain magnitude in the period 2020 to 2022 compared with the period 2017 to 2019; Based on the EMI index calculation, the average EMI index in Liaoning during the period 2020 to 2022 is about 1.7% lower than the average value of the region during the period 2017 to 2019, and the atmospheric dispersion conditions are relatively good; From the perspective of daily changes in pollutant concentrations, the trend of PM2.5 and PM10 concentrations changed from double peaks and single valleys to single peaks and single valleys, and there were no significant changes in the types of valleys for CO, SO2, NO2, and O3, whereas the peaks of O3 concentrations during the daytime were basically the same as in previous years, and the concentrations during the nighttime were slightly higher than in previous years. Classification by topographic areas revealed that the mean pollutant concentration for the period from 2017 to 2019 was more significant than the mean value for the period from 2020 to 2022, except for O3, where the air quality in the mountainous areas of Liaodong and Liaoxi was better than that of the Liaohe Plain, and regional classification by coastal and inland, where the air quality in the coastal areas was better than that of the inland areas.
1 Introduction
With the rapid economic and social development and the accelerating process of urbanization, air pollution has become one of the significant environmental threats to human health. The World Health Organization (WHO) estimates that about 7 million people globally die prematurely each year due to air pollution exposure, and the study “The Costs of Air Pollution” reports that air pollution has become the world’s fourth leading risk factor for premature death. In 2012, China issued the Ambient Air Quality Standard (GB3095-2012) (China Environmental Science Press, 2012), which added a concentration limit for PM2.5, and the State Council implemented the Action Plan for Prevention and Control of Air Pollution from 2013 to 2017, followed by the Three-Year Action Plan for Winning the Battle for the Blue Sky in 2018. Implementing the two paramount pollution prevention and control action plans has markedly improved China’s air quality. As the prevention and control of air pollution continues to advance, China’s emissions of significant pollutants continue to decline. Guo et al. (2023) reviewed the process of air pollution control in China, and the results suggest that health benefits will be realized by improving air quality and mitigating climate change; Zuo et al. (2023) used the Spearman rank correlation coefficient method to analyze the trend of ambient air quality in Ningxia from 2015 to 2020 and found that the ambient air quality composite index in Ningxia had a decreasing trend. Still, the decrease was insignificant, and the overall ambient air quality improved. Xiao-mei et al. (2021) analyzed the air quality and the heavy pollution process for the 2020 winter prevention and control period in the Beijing region, and based on the EMI index analysis, it was concluded that on the current emission base, even if there is a particular case of urban blockade, the reduction of emissions will cut down the peak of the pollution concentration. However, it is still insufficient to fully offset the effects of unfavorable meteorological conditions. Foreign scholars have also analyzed the changes in air pollutant concentrations for long periods. Sharma et al. (2020) studied and analyzed air pollutants in different regions of India over some time from 2017 to 2020, and due to the restriction of activities during the lockdown period, the average risk of exceeding the standard for PM was reduced by nearly 52% at the national level and simulated using the WRF-AERMOD model. The results show that even under unfavorable meteorological conditions, air quality will significantly improve. There are still fewer analyses of the relationship between urban topography and air pollutant concentrations, and most articles analyze them without removing the role of meteorological factors in the process. Although ambient air pollutants mainly come from the direct emissions of pollution sources, the environmental concentration of contaminants is also affected by the combination of multiple meteorological factors. Thus, to accurately assess the ecological effects of pollution reduction and the need to remove the interference of meteorological factors, this paper mainly focuses on the change in air pollutant concentrations in the Liaoning region from 2017 to 2022 and analyzes the trend and reasons for the difference.
2 Materials and methods
2.1 Study area and period
The research area of this paper is the Liaoning region. To minimize the impact of meteorological conditions on changes in air pollutant concentrations, we compared and analyzed air pollutant data from 2017 to 2019 with data from 2020 to 2022, of which the period from 2020 to 2022 due to the implementation of governmental preventive and control measures to form the typical limit of emission reduction scenarios, for the study of emission reduction under the air quality and its impact on the factors to establish the “natural laboratory.” This extreme emission reduction and environmental reduction together achieve “double emission reduction.” Hence, this paper calculates the average concentration of air pollutants in the two time periods and makes comparisons.
2.2 Presentation of air pollutant data
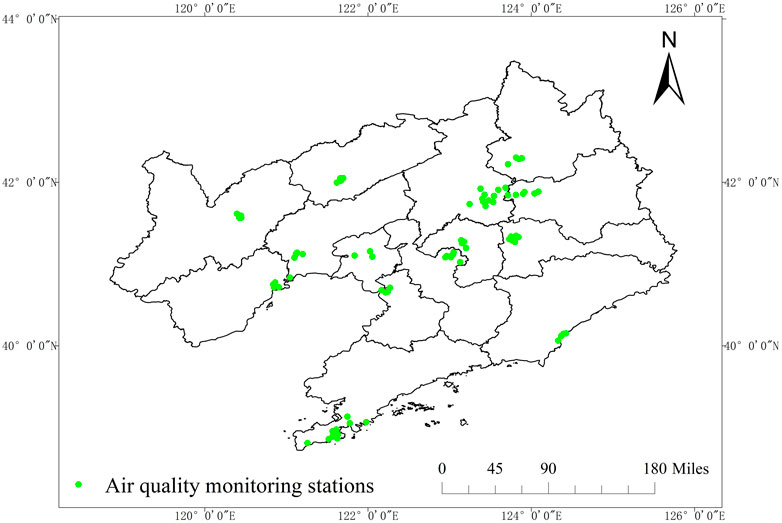
The adopted data were all obtained from the air quality monitoring information of 77 state-controlled stations of the Liaoning Provincial Department of Ecology and Environment. Figure 1 displays the distribution locations of state-controlled stations in Liaoning Province. The monitoring period was from 2017 to 2022. The types of atmospheric pollutants studied included particulate matter (PM2.5, PM10), sulfur dioxide (SO2), nitrogen dioxide (NO2), carbon monoxide (CO), and Ozone (O3).
2.3 Evaluation of meteorological condition index of PM2.5 pollution (EMI)
EMI is a dimensionless indicator that measures the contribution of meteorological conditions in the change of PM2.5 concentration. The calculation method of Evaluation on the meteorological condition index of PM2.5 pollution (EMI) used in this paper follows the meteorological industry standard of the People’s Republic of China (QX/T479-2019), which indicates the impact of meteorological elements on the change of air pollutant concentration through diffusion, transport, dry and wet deposition, and chemical transformation in a specific period without considering the evolution of emission sources (China Meteorological Administration, 2019). EMI is an indicator of the change in fine particulate matter (PM2.5) concentration due to changes in meteorological conditions. The EMI is calculated using a tracer approach, defined here as the dimensionless ratio of the average concentration of the tracer within the air column from the ground to 1,500 m altitude to a reference concentration. According to the PM2.5 concentration continuity equation, the concentration at time t can be obtained, which is related to the meteorological conditions of emission deposition, transport and diffusion, and the difference of EMI is the change of concentration due to the meteorological conditions under the assumption of constant PM2.5 emission rate in the same period in different years. The Eqs (1), (2) is as follows:
Where C is the average concentration of tracer in the gas column (ground to 1,500 m altitude); C0 is the upper limit (35 μg/m3) for the optimal level of PM2.5 concentration by the Ambient Air Quality Index Technical Regulation (HJ633-2012); The four sub-indices of
When comparing different periods with each other, the difference in EMI is the rate of change of the average aerosol concentration in the boundary layer due to meteorological conditions under constant emission conditions. Let the emissions of “period 1” and “period 0” be S1 and S0, respectively, the measured concentrations be O1 and O0, and the meteorological indices are EMI1 and EMI0, respectively. It is assumed that the contribution of meteorological factors to actual concentrations is linear and that the contribution of emissions to actual concentrations is also linear. That meteorological and emission factors are variably separable. Then, there is a fundamental relationship (3):
Then the rate of change of meteorological conditions (4) is:
The rate of change of pollutant concentration (5) is:
The rate of change of emissions is (6):
Finally (7):
This paper calculates Liaoning’s average EMI indices for two periods: 2017 to 2019 and 2020 to 2022. The differences in EMI indices between the two periods were compared to obtain the changes in meteorological elements and the contribution of emission reduction measures to the impact on air quality from 2020 to 2022.
2.4 ArcGIS Kriging interpolation
Kriging is a regression algorithm for spatial modeling and prediction (interpolation) of stochastic processes based on the covariance function, also known as spatial local interpolation, one of Geostatistics’ main elements (WU et al., 2006). Widely used in spatial statistical analysis, its basic theory is based on the semi-variational function for analysis, optimizing the unbiased optimal estimation of variables in a given space. ArcGIS 8 and above integrates geostatistics as a separate analytic extension module into the framework architecture of the ArcGIS software. In this paper, a comparative study of the concentration of air pollutants in various topographic areas of Liaoning Province uses the Kriging interpolation method in the GA module of ArcGIS software.
3 Results and discussions
Liaoning is an essential old industrial base in northeast China, and its heavy industrial structure has undoubtedly added to the already fragile ecological environment. The Liaoning Provincial Government has followed the policies of its superiors. It has issued the Implementation Program of Liaoning Air Pollution Prevention and Control Action Plan and the Three-Year Special Action Program for Pollution Prevention and Control in Liaoning Province, which put forward the planning time and route for the local air pollution control. With the implementation of specific emission reduction measures, local air quality has improved, and it is of great practical significance to study the time-varying characteristics and trends of pollutant concentrations in the atmosphere and analyze their influencing factors.
3.1 Changes in pollutant concentrations and meteorological conditions during emission reduction in Liaoning region
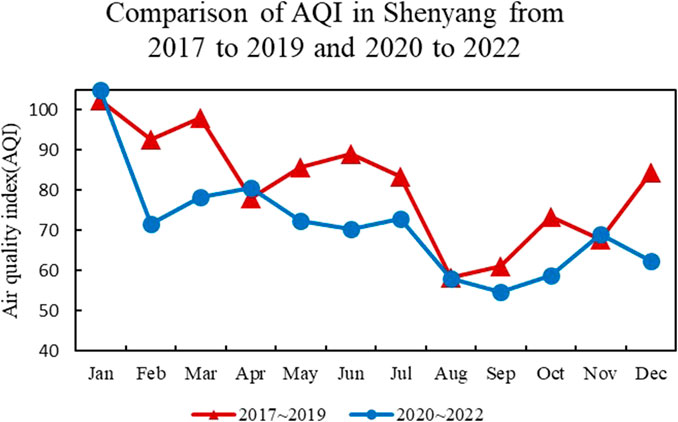
As the capital of Liaoning Province and a city of heavy industry, Shenyang is more affected by the emission reduction measures. Therefore, this article explores the impact of emission reduction measures on the city’s AQI. To analyze the AQI more comprehensively and objectively, the annual average data of the AQI from 2017 to 2019 and from 2020 to 2022 are selected here for comparison. The results show that by comparing the AQI of Shenyang City from 2017 to 2019 with that of 2020–2022 (Figure 2), it can be visualized that the AQI fluctuated wildly from 2017 to 2019. From 2020 to 2022, due to the implementation of the “double emission reduction” measures, the change of AQI is more moderate, and the AQI categories are primarily concentrated in excellent and good. This shows that during the “double emission reduction” period, the measures of reducing travel by residents and stopping production in factories have, to a certain extent, increased air quality and made it more stable. On the other hand, due to the increased use of coal and the increase of static weather in winter and spring seasons, and the high wind and sufficient precipitation in summer and fall seasons, the air quality of Shenyang City in different seasons during the two periods of time shows a trend of more severe pollution conditions in winter and spring, and better in summer and fall. In 2017–2019, the frequency of more than mild pollution in winter and spring was 4.84%, while the frequency of weather with more than mild pollution in summer and fall was 1.37%. From 2020 to 2022, the frequency of weather with more than mild pollution is 2.7% in winter and spring and 1.8% in summer and fall. As a result of the implementation of the “double emission reduction” measures, air quality improvement has been accelerated, and air pollution has changed from heavy pollution to light pollution, which will lead to an increase in the frequency of weather with more than light pollution during the period from 2020 to 2022.
A general overview of the atmospheric quality situation through the AQI can visualize the overall changes in air quality in Shenyang City over two periods. In this paper, monitoring data from a total of 77 state-controlled stations in Liaoning Province were selected. The changes in the annual average concentrations of each pollutant in Liaoning from 2017 to 2019 and from 2020 to 2022 were calculated and compared (Figure 3). The average concentrations of air pollutants PM2.5, PM10, SO2, NO2 and O3 in the period from 2020 to 2022 are 35.59 μg/m³, 58.86 μg/m³, 14.39 μg/m³, 26.13 μg/m³ and 88.85 μg/m³, respectively. The concentration of CO is 0.85 mg/m³. Comparing pollutant concentrations for the period 2020 to 2022 with those for the period 2017 to 2019, the PM2.5, PM10, SO2, NO2, CO, and O3 concentrations in 2020–2022 are reduced by about 13.8%, 15.5%, 36.4%, 10.1%, 9.7%, and 4.3%, respectively, compared with the average pollutant concentrations in 2017–2019. It can be seen that the implementation of the “double emission reduction” measures has significantly improved the air quality in Liaoning, which is consistent with the findings of Zhang Chunying and Yu Feng (YU et al., 2021; ZHANG, 2022). The concentrations of particulate pollutants PM2.5, PM10, and SO2 were significantly reduced. On the one hand, local particulate matter is generated from residues emitted by combustion during industrial production and automobile exhaust emissions. On the other hand, due to coal combustion for heating in the winter months, many tiny particles are generated, which are the vital source of the particles that constitute PM2.5 (Xing-liang et al., 2021). The concentration of particulate pollutants declined significantly after implementing of the “double emission reduction” measures in the local area due to factors such as the shutdown of factories, the warming of the weather, the intensification of atmospheric diffusion, and the reduction of coal heating. SO2 and NO2 are the primary pollutants originating from coal combustion and industry. SO2 is primarily generated from the exhaust gases of chemical and sulfuric acid plants, and NOx is generated from automobile exhaust and nitric acid production plants (SU et al., 2012; Li et al., 2019; WANG et al., 2021). NO2, as a representative pollutant of traditional photochemical smog, has a critical conversion function in tropospheric atmospheric chemistry, and environmental problems such as fog, haze, and acid rain all originate from NO2 (Han-li and WANG, 2005; Hong-qun and CUI, 2016; Zhou et al., 2016). During the “double emission reduction” period, due to the reduction of coal-fired operations in heavy industries and vehicle trips, the emission intensity was weakened, which to a certain extent resulted in the reduction of SO2 and NO2 concentrations, especially SO2, which had a clear downward trend after a series of emission reduction measures. O3 for these types of pollutants in the concentration of the slightest reduction of pollutants, which indicates that O3 pollution is still the current pollution control difficulty, the concentration of which is affected by various types of meteorological elements conditions (Xian-yu et al., 2020; ZHOU et al., 2023), the subsequent local authorities in the regional pollution prevention and control need to focus on O3 pollution prevention and control.
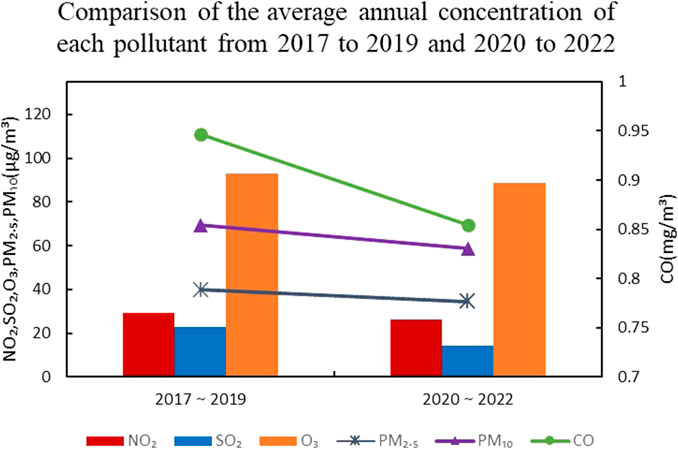
FIGURE 3. Comparison of the average annual concentration of each pollutant from 2017 to 2019 and 2020 to 2022.
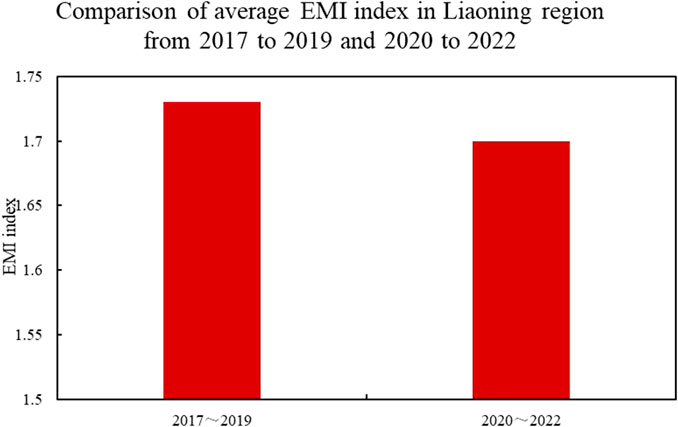
Under relatively stable air pollution emission sources, the variation of EMI index and PM2.5 concentration is mainly determined by meteorological conditions. This paper uses the EMI index in Liaoning explore the role of meteorological conditions in influencing the period from 2020 to 2022. The average EMI index for Liaoning province during the period from 2020 to 2022 is 1.7, which is about 1.7% lower than the average EMI index of 1.73 for the section during the period from 2017 to 2019 (Figure 4), and the atmospheric dispersion conditions are relatively good but flat. This shows that assuming that the air pollution emission sources remain unchanged, the average PM2.5 concentration in Liaoning during 2020–2022 should theoretically decrease by about 1.7% compared with the average PM2.5 concentration during 2017–2019, but in fact, the average PM2.5 concentration in Liaoning during 2020–2022 is only 35.59 μg/m³, a decrease of about 13.8% compared with the average PM2.5 concentration during 2017–2019, and the difference of 12.1% is the result of the “double emission reduction” of the government’s prevention and control measures and the corresponding air pollution emission reduction measures. Through the estimation, we get that the environmental reduction rate of air pollution is 3.715% during the period from 2017 to 2019, so we can speculate that the ecological reduction rate of air pollution is about 3.715% during the period from 2020 to 2022, and finally we get that the emission reduction rate brought by the governmental preventive and control measures is about 8.385%, which indicates that the air quality of Liaoning region will be significantly improved in 2020–2022 due to the implementation of the “double emission reduction” measures.
3.2 Changes in the daily pattern of pollutant changes during emission reduction in the Shenyang area
Since both meteorological conditions and emission sources influence the concentration of air pollutants, the values of meteorological elements and emission values are different for different periods (WU et al., 2016). This study, selected Shenyang city as a representative city of the Liaoning region to study the daily change pattern of pollutant concentration in Shenyang between 2017 and 2019 and between 2020 and 2022. As can be seen from the annual average hourly changes in Shenyang City’s concentrations of various pollutants from 2017 to 2019 versus 2020 to 2022 (Figure 5). During the period from 2020 to 2022, PM2.5 and PM10 concentrations show a double-peak and single-valley daily trend, with the peak of the day occurring around 9:00–10:00 a.m., and the valley of the day emerging around 16:00 as the top of the boundary layer lifts, which is mainly because of the large number of nitrogen oxides (NOx) emitted by motor vehicles in the morning rush hour to the atmosphere as well as the road dust, which makes particulate pollutants produced in large quantities. Whereas the period from 2017 to 2019 was mainly characterized by double peaks and double valleys peaking at around 9:00 to 10:00 a.m., followed by an increase in the intensity of afternoon sunshine and a decrease in relative humidity, the particulate pollutant concentrations reached a low value at around 16:00 to 17:00. At this point, due to the increase in traffic flow during the evening rush hour, coupled with a decrease in the height of the mixing layer, the pollutant accumulation intensified, and at the peak around 23:00 to 24:00 p.m. At night, due to the decrease in human activities, the pollutant concentration decreases slowly and changes slowly between 0:00 and 7:00 a.m. From 2020 to 2022, morning and evening work travel peaks are reduced. Although the lower height of the boundary layer at night is not conducive to the dispersion of air pollutants, fewer emissions from sources still result in lower nighttime concentrations of air pollutants. It can be seen that governmental prevention and control measures, as well as environmental protection and emission reduction measures, can change the daily change patterns of particulate pollutants, which is consistent with the findings of Cui Zhihao and Wang Aiping (CUI et al., 2021; WANG et al., 2021).
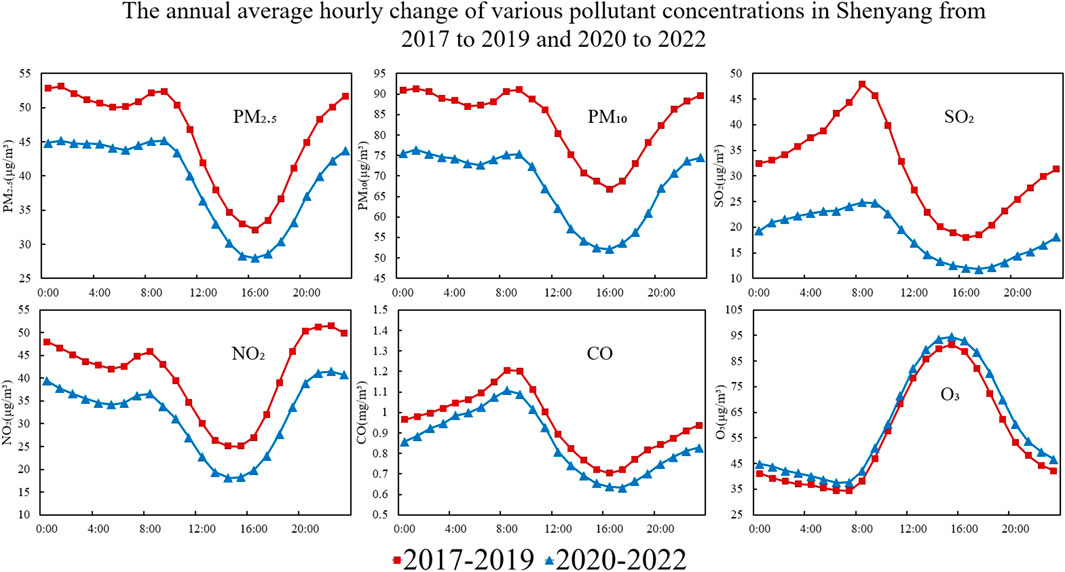
FIGURE 5. The annual average hourly change of various pollutant concentrations in Shenyang from 2017 to 2019 and 2020 to 2022.
The daily variation of CO and SO2 showed a double-valley, single-peak type and reached the pollution peak around 8:00 a.m. and the pollution valley around 16:00. Due to the implementation of the “double emission reduction” measures, it can be seen that the daily trend of SO2 concentration in the period from 2020 to 2022 is smoother. The average concentration is lower than that from 2017 to 2019. The sources of SO2 and CO are mainly from chemical and sulfuric acid industries, and the presence of low-level inversions during the pre-sunrise hours leads to the peak of the day at around 8:00 a.m. (XUE et al., 2006).
The daily variation of NO2 mainly shows a single valley with double peaks, especially around 8:00 a.m. and 21:00. NOx production is primarily associated with morning and evening traffic peaks and variations in boundary layer heights. Since NO2 is a precursor of O3 (Rui-na et al., 2022), the NO2 concentration will continue to deplete and decrease with the enhancement of solar radiation, reaching a trough around 15:00 to 16:00. A positive correlation can also be found between NO2 and PM2.5 (YIN et al., 2021). Comparing 2020–2022 with 2017–2019, it is evident that the concentration of NO2 is significantly lower than in the previous 4 years, which shows that the effect of “double emission reduction” measures on NOx is very obvious.
The daily variation of O3 mainly showed a monomodal pattern, high during the day and low at night, and peaked around 16:00 O3 production is closely related to photochemical reactions. In addition to the effects of meteorological conditions, ozone’s main precursors, such as NOX and VOCs, vary with human activities throughout the day. O3 concentrations generally reach their lowest values of the day just before sunrise, which is the accumulation phase of O3. Starting from 8:00 a.m., with the enhancement of solar radiation and temperature increase, the photochemical reaction that generates O3 is gradually strong, peaks at about 16:00 and then decreases with the reduction of solar radiation, and at night, O3 is consumed by atmospheric photochemical reaction and accumulation near the surface, so that the concentration is at a low level (SUN et al., 2021; Wei-jie et al., 2022), with minor small fluctuations and a tendency to flatten out. Comparing 2020 to 2022 with 2017–2019, O3 concentrations during the period from 9:00 a.m. to 12:00 p.m. are essentially similar to those in 2017–2019, but at around 20:00, the concentrations during 2020–2022 are slightly higher than those in 2017–2019, but in general, O3 concentrations during 2020–2022 are higher than the O3 concentrations during the 2017–2019 period.
3.3 Spatial variation of pollutant concentrations in Liaoning during the abatement period
To visualize the spatial changes in the concentrations of each air pollutant in Liaoning, this paper examines the concentrations in different spatial locations using statistical methods. It uses the Kriging interpolation method to compare the distribution of pollutant concentrations during the period of emission reduction in Liaoning Province.
3.3.1 Comparison of concentrations of various air pollutants in mountainous and hilly areas of Liaoning Province
The topography of Liaoning Province is roughly mountainous and hilly with two compartments in the east and west, descending towards the central plains and tilting towards the Bohai Sea in the shape of a horseshoe (WANG et al., 2015) (Figure 6). In this paper, we typing the topographic regions of Liaoning Province into Liaodong hilly area, Liaohe plain area, and Liaoxi hilly area by categorizing the topographic regions belonging to each city in Liaoning Province, and compared the distribution of pollutant concentrations in each part. From a spatial point of view, the attention of air pollutants in the mountainous and hilly areas of Liaodong and Liaoxi is generally lower than that in the Liaohe Plain, with the air quality in the mountainous and hilly regions of Liaodong being better than that in the central and western parts of Liaoning.
Due to the influence of the hilly barrier on the left and right of Liaoning, the central plain area of Liaoning Province tends to have a large proportion of static winds and minor wind frequency, and air pollutants are not easy to diffuse (WANG et al., 2011); at the same time, the topography of the Liaohe Plain area is flat and open, and it is also China’s important coal chemical and iron and steel bases, and the dense distribution of urban high-rise buildings in the plain area causes vortexes to be generated by the airflow in a small area, which hinders the diffusion of air pollutants, resulting in the air pollutant concentration of the Liaohe Plain area is high compared to that of the hilly areas on either side all the year round; On the other hand, since there are fewer factories and cities in the hilly areas of Liaoning, the emissions in the hilly areas will be slightly higher only in certain small areas where there is a dense distribution of cities, mines or factories in the hilly areas.
Analyzing the air pollutant concentration data from the Liaoning Provincial Department of Ecology and Environment, the results show that the concentrations of PM2.5 and PM10 in Liaoning are mainly higher in the central plains and western hills than in the eastern plains. The overall pollution in Liaoning Province from 2017 to 2019 is relatively severe. After a period of “double emission reduction,” air pollution is significantly reduced. O3 concentration showed a gradient change (Figure 7), i.e., Liaoxi mountainous and hilly area > Liaohe plain area > Liaodong mountainous and hilly area, in which the values of O3 concentration in the Liaoxi mountainous and hilly area and the Liaohe plain area did not differ much. From the distribution of O3 concentration (Figure 8), it can be seen that from 2017 to 2019, the O3 high pollution area is mainly distributed in the Liaohe Plain area, which Dalian, Yingkou, and Panjin represent, and the ozone concentration can reach 610 μg/m3 on a single day. The main reason for this is that the Liaohe Plain area, as a better economic development area in Liaoning Province, is densely populated and industrially developed, and human activities brought about by higher population density will emit a large number of air pollutants (HAN et al., 2021; Wang, 2021; Rui-feng et al., 2022; XIE et al., 2022); On the other hand, the Liaohe Plain is surrounded by hills on both the east and west sides and the air pollutants generated in the plain area itself have been coiled in the sky for a long time. In contrast, the air pollutants transmitted from the tip of Beijing-Tianjin-Hebei in the southwest and from the direction of Heilongjiang and Jilin in the north are gathered in the plain area (CHENG et al., 2017), which leads to the high concentration of air pollutants in the Liaohe Plain area. From 2020 to 2022, O3 concentrations in the Liaoxi mountainous and hilly areas and the Liaohe Plain soared high. O3, as a secondary pollutant, is generated by the photochemical oxidation of VOCs catalyzed by nitrogen-oxygen and hydroxyl radicals (KeJacobHong et al., 2018; Shi et al., 2021). The reason for the increase in O3 concentrations between 2020 and 2022 is related to the following: First of all, during the “double emission reduction” period, NO2 and NO concentrations decrease, NO2 decreases to reduce the nitrogen-oxygen radicals in the air, and NO decreases to inhibit its titration effect on O3, which reduces the consumption of O3; Secondly, during the “double emission reduction” period, decreasing concentrations of particulate pollutants lead to an increase in solar radiation, which promotes the production of O3 through photochemical reactions (Liu et al., 2013; APS et al., 2020); Although the atmospheric environment will show a gradual improvement from 2020 to 2022 due to the implementation of the “double emission reduction” measures, the ozone concentration will still increase due to unfavorable meteorological conditions in recent years. Significant differences in the impacts of “double emission reduction” measures on the emissions of different pollutants are evident. In addition to O3, emissions of NO2 and SO2 show an overall decreasing trend after the adoption of the “double emission reduction” measures, which is mainly due to the decrease in the intensity of activities of transportation sources as a result of the “double emission reduction” measures, leading to the reduction of motor vehicle tailpipe emissions.
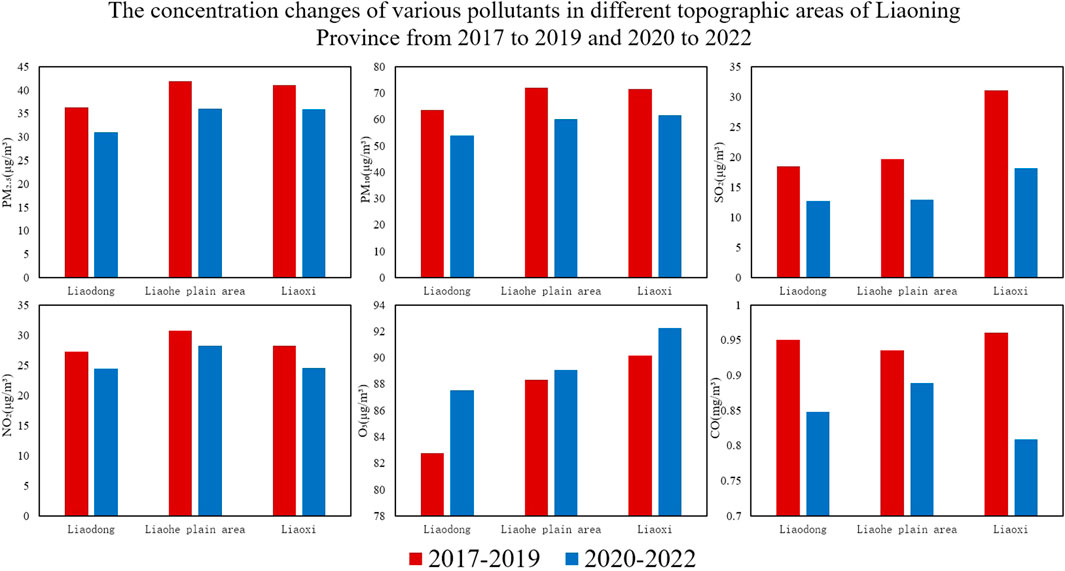
FIGURE 7. The concentration changes of various pollutants in different topographic areas of Liaoning Province from 2017 to 2019 and 2020 to 2022.
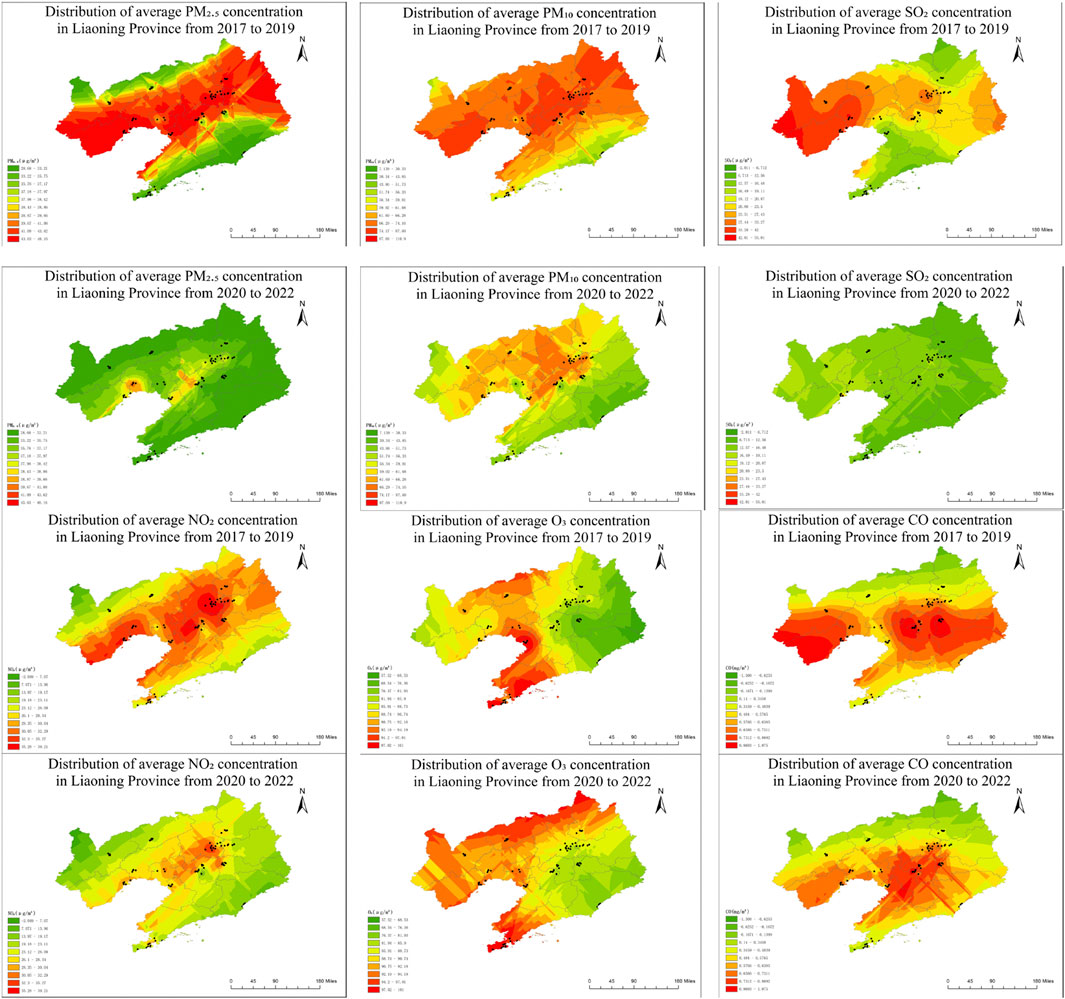
FIGURE 8. Comparison of concentration distribution of various pollutants in Liaoning Province in 2017∼2019 and 2020∼2022.
3.3.2 Comparison of the concentration of each pollutant in coastal and inland areas of Liaoning Province
In this paper, we categorize the coastal and inland areas of Liaoning Province (coastal regions include Dalian, Dandong, Jinzhou, Yingkou, Panjin, and Huludao; the inland regions have Shenyang, Anshan, Fushun, Benxi, Fuxin, Liaoyang, Tieling, and Chaoyang), and calculate the changes in the concentrations of different atmospheric pollutants in the coastal and inland regions in the years from 2020 to 2022, and from 2017 to 2019, to study the impacts of the “double emission reduction” on the atmospheric pollutants of coastal as well as inland regions. From the graphical results (Figures 8, 9), geographically, the concentrations of PM2.5, PM10, and CO in inland areas are higher than those in coastal regions, while the concentrations of NO2 and SO2 in coastal and inland regions are the same, regardless of whether the period is 2020–2022 or 2017–2019. However, after the “double emission reduction” measures, the concentrations of PM2.5, PM10, NO2, CO, and SO2 are all on a downward trend, and the concentrations of pollutants in inland regions are generally higher than those in coastal regions. The O3 concentration before and after the “double emission reduction” is lower inland than in coastal regions. The reasons for this are analyzed as follows:
(1) The concentration of air pollutants in the inland regions of Liaoning Province is generally higher than the coastal regions, on the one hand, because the inland areas themselves have more significant pollution emissions; on the other hand, due to the coastal regions of the sea breeze is larger, the air circulation speed is fast and has a more significant amount of discharge of the sea as a source of cleanliness, self-purification ability is strong, purification and decomposition of atmospheric pollutants, and the proximity of the ocean has high humidity and rainfall so that the concentration of atmospheric pollutants in coastal regions is generally lower than that of the inland regions (ZENG et al., 2020; XUE et al., 2021).
(2) The main reason for the longer duration of O3 pollution in the coastal urban regions of Liaoning Province is that the implementation of the “double emission reduction” measures, the shutdown of factories, and the reduction of transportation by residents have reduced the concentration of aerosols in the atmosphere, which leads to the enhancement of solar radiation. The formation of near-surface O3 is closely related to the photochemical reactions induced by solar radiation, leading to higher levels of O3 concentration. On the other hand, coastal regions are subject to the influence of sea and land breezes. During the daytime, ozone is generated in warmer land areas and transported to the oceans as the upwelling reaches a certain altitude. However, after the whole day, the ozone in the sea does not decrease without depletion. At night, it is still transported by the sea-land winds and sinks on the land where the temperature is lower, resulting in an increase in ozone concentration in the coastal area at night.
(3) From the observation of the results, the concentrations of NO2 and SO2 before and after the “double emission reduction” measures are the same in the coastal and inland regions. NO2, SO2 is the primary source of air pollutants produced by burning coal, oil, and the coastal cities of Dalian, Dandong, Yingkou and Panjin in Liaoning Province are important oil, natural gas and ore energy gathering places in Liaoning Province, and the distribution of heavy industrial factories is also high. Hence, NO2, SO2, is a class of air pollutants produced by a more significant number. However, the coastal regions have a “purification” advantage. The overall view of the concentration of this type of pollutant is still basically the same as the inland regions. However, vehicle emissions are significantly reduced after a period of “double emission reduction” measures due to the shutdown of factory residents to minimize travel, so NO2 and SO2, a class of air pollutants in 2017–2019, are higher than the 2020–2022 concentrations.
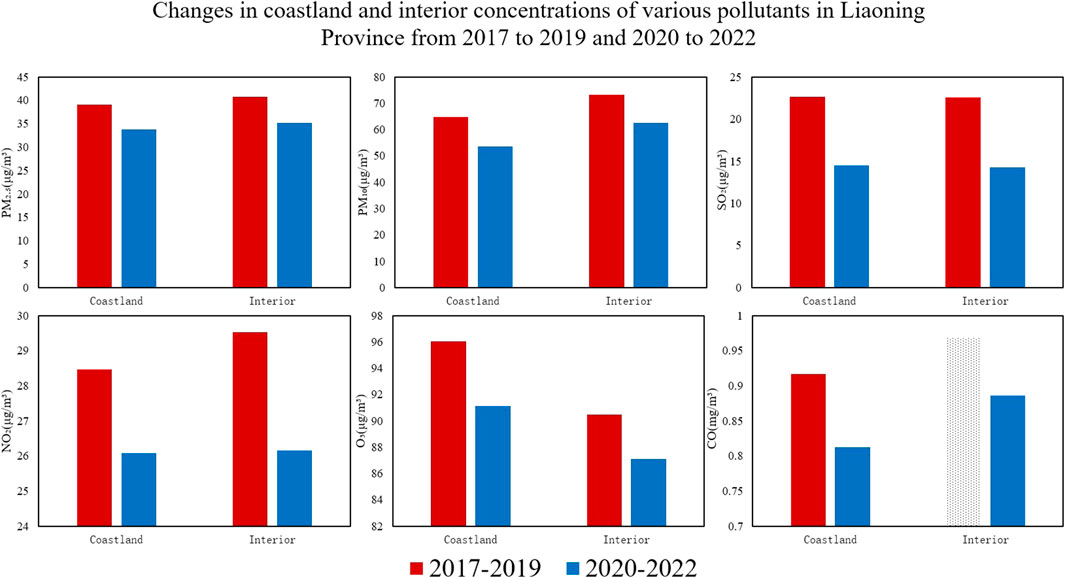
FIGURE 9. Changes in coastland and interior concentrations of various pollutants in Liaoning Province from 2017 to 2019 and 2020 to 2022.
4 Conclusion
Liaoning Province, a typical heavy industrial province in Northeast China, was selected as the study area to analyze the changes in the concentrations of various pollutants in Liaoning Province during the period of emission reduction and to analyze them in conjunction with the measures related to emission reduction, the topographic conditions of Liaoning Province itself, and the main functions of the city, and finally to obtain the following conclusions:
(1) According to the analysis of the EMI index in the Liaoning region, the provincial average EMI index in the Liaoning region during the period from 2020 to 2022 is 1.7, which is about 1.7% lower than the average EMI index of 1.73 in the area from 2017 to 2019, indicating that the atmospheric dispersion conditions in the period are better as compared with those from 2017 to 2019. The reduction rate of PM2.5 concentration due to the government’s prevention and control measures, as well as the corresponding environmental protection and emission reduction measures, is about 12.1%, and the emission reduction rate due to the government’s prevention and control measures can be estimated to be about 8.385%. As a result of the “Double Emission Reduction” period, during which residents are restricted from traveling and factories are shut down, the PM2.5, PM10, SO2, NO2 and CO concentrations in the Liaoning region during the period from 2020 to 2022 will be reduced by about 8.3%, 14.4%, 14.2%, and 12.2%, and 1.8%, respectively, compared with the average pollutant concentrations in the same period during the previous 4 years, and O3 concentration increased by 6%. Air quality improves significantly in Liaoning.
(2) By analyzing the daily changes in the concentrations of air pollutants in Shenyang, a typical city in the Liaoning region, it is concluded that during the period from 2020 to 2022, the daily trend of the concentrations of the particulate pollutants PM2.5 and PM10 in Shenyang changed from a double-peak single-valley to a single-peak single-valley. In contrast, the types of valleys of CO, SO2, NO2, and O3 concentrations did not change significantly. The concentration of NO2 is considerably lower than that from 2017 to 2019 due to the implementation of the “double emission reduction” measures, while the concentration of O3 is similar to that from 2017 to 2019 during the daytime. Still, at night, the concentration in the period from 2020 to 2022 is slightly higher than that from 2017 to 2019. Still, in general, the concentration of O3 in the period from 2020 to 2022 is higher than the concentration of O3 in the period from 2017 to 2019.
(3) By categorizing the topographic regions of Liaoning Province, it is found that the concentrations of air pollutants in the mountainous and hilly areas of Liaodong and Liaoxi are generally lower than those in the Liaohe Plain and that the concentrations of air pollutants in the coastal areas are generally lower than those in the inland regions. However, after a period of “double emission reduction”, the concentrations of all air pollutants except ozone in each region showed a decreasing trend.
Data availability statement
The raw data supporting the conclusion of this article will be made available by the authors, without undue reservation.
Author contributions
JW: Data curation, Writing–original draft. KR: Data curation, Writing–original draft, Writing–review and editing. HS: Data curation, Software, Writing–review and editing. CZ: Data curation, Writing–review and editing. XL: Writing–review and editing. YW: Software, Writing–review and editing.
Funding
The author(s) declare financial support was received for the research, authorship, and/or publication of this article. This research supported by the National Natural Science Foundation of China (41905026); National Natural Science Foundation of China (41505120); Natural Science Foundation of Jiangsu Province (BK20170945); Talent Start-up Fund of Nanjing University of Information Science and Technology (2016r028); The 63rd Batch of China Postdoctoral Science Foundation in General (2018M631554); The Cultivation of High-level Talents of Jiangsu 333 Project funding; Young Talent foundation of Liaoning Meteorological Bureau (Y201601); Doctoral foundation of Liaoning Meteorological Bureau (D201502).
Conflict of interest
The authors declare that the research was conducted in the absence of any commercial or financial relationships that could be construed as a potential conflict of interest.
Publisher’s note
All claims expressed in this article are solely those of the authors and do not necessarily represent those of their affiliated organizations, or those of the publisher, the editors and the reviewers. Any product that may be evaluated in this article, or claim that may be made by its manufacturer, is not guaranteed or endorsed by the publisher.
References
Aps, , Badm, C. E. A., Agathokleous, E., Feng, Z., Xu, X., Paoletti, E., et al. (2020). Amplified ozone pollution in cities during the COVID-19 lockdown. Sci. Total Environ. 735, 139542. doi:10.1016/j.scitotenv.2020.139542
Cheng, L., Wang, S., Gong, Z., Qi, YANG, and Wang, Y. (2017). Pollution trends of ozone and its characteristics of temporal and spatial distribution in Beijing-Tianjin-hebei region. Environ. Monit. China 33 (01), 14–21. doi:10.19316/j.issn.1002-6002.2017.01.03
China Environmental Science Press (2012). GB3095-2012. Ambient air quality standard. Beijing, China: China Environmental Science Press.
China Meteorological Administration (2019). QX/T 479-2019 Evaluation on meteorological condition index of PM2.5 pollution (EMI). QX/T 479-2019 (Beijing, China: China Meteorological Administration).
Cui, Z.-H., Cheng-ming, L. I., Zhao-xin, D. A. I., and Cheng-xu, L. I. U. (2021). Analysis on the changes of air pollutant concentrations in dongying city during COVID-19 period. Sichuan Environmrnt 40 (05), 54–60. doi:10.14034/j.cnki.schj.2021.05.009
Guo, C., Gao, Y., Fan, J., Yuan, X., Wu, R., and Xu, J. (2023). Research progress on health benefits of collaborative management of air pollution and climate change in China. Res. Environ. Sci. 36 (11), 2040–2049. doi:10.13198/j.issn.1001-6929.2023.09.09
Han, J., Wang, J., Zhong, L. I., Wang, K., Bai, X., and Gu, Y. (2021). Variation characteristics of ozone concentration and its influencing factors in Hohhot. J. Arid Land Resour. Environ. 35 (12), 73–78. doi:10.13448/j.cnki.jalre.2021.328
Han-li, C., and Wang, J.-N. (2005). Exploring the total emission control of nitrogen oxides in China. Res. Environ. Sci. 18 (5), 107–110.
Hong-qun, M. A., and Cui, L.-H. (2016). Meta-analysis on health effects of air pollutants(SO2 and NO2)in the Chinese population. Occup. Health 32 (8), 1038–1044. doi:10.13329/j.cnki.zyyjk.2016.0288
KeJacobHong, L. D. J. L., Shen, L., Zhang, Q., and Bates, K. H. (2018). Anthropogenic drivers of 2013-2017 trends in summer surface ozone in China. Proc. Natl. Acad. Sci. U. S. A. 116 (2), 422–427. doi:10.1073/pnas.1812168116
Li, K., Jacob, D. J., Liao, H., Shen, L., Zhang, Q., and Bates, K. H. (2019). Anthropogenic drivers of 2013–2017 trends in summer surface ozone in China. Proc. Natl. Acad. Sci. 116 (2), 422–427. doi:10.1073/pnas.1812168116
Liu, H., Wang, X. M., Pang, J. M., and He, K. B. (2013). Feasibility and difficulties on China new air quality standard compliance: PRD case of PM2.5 and ozone from 2010 to 2025[J]. Atmos. Chem. Phys. 13 (8), 20923–20959. doi:10.5194/acpd-13-20923-2013
Rui-feng, M. A., Jing-hong, X. V., and Liang-zheng, Y. A. N. (2022). Spatio-temporal changes and influencing factors of ozone in the central area of Dalian during 2013-2018. J. Meteorology Environ. 38 (3), 75–84.
Rui-na, G. A. O., Yin-chuan, S. U. N., He-jiang, Z. U. O., Na, G. A. O., and Dai, W. (2022). Variation and relationship of criteria air pollutants in Yinchuan. J. Meteorology Environ. 38 (1), 33–39.
Sharma, S., Zhang, M., Anshika, , Gao, J., Zhang, H., and Kota, S. H. (2020). Effect of restricted emissions during COVID-19 on air quality in India. Sci. Total Environ. 728, 138878. doi:10.1016/j.scitotenv.2020.138878
Shi, Z., Song, C., Liu, B., Lu, G., Xu, J., Van Vu, T., et al. (2021). Abrupt but smaller than expected changes in surface air quality attributable to COVID-19 lockdowns. Sci. Adv. 7 (3), eabd6696. doi:10.1126/sciadv.abd6696
Su, H., Yin, Y., Zhu, B., Wang, Z.-F., Li, J., and Pan, X.-L. (2012). Numerical simulation and sensitive factors analyse for dry deposition of SO2 and NO2 in Bohai Rim area of China. China Environ. Sci. 32 (11), 1921–1932.
Sun, R., Zhang, H., Wang, S., and Wei, Y. (2021). Temporal and spatial distribution of ozone in typical cities of yangtze river delta region and its correlation with meteorological factors. J. Atmos. Environ. Opt. 16 (6), 483–494.
Wang, A.-P., Zhu, B., Qin, W., Yan-hong, Q. I. N., Xue, Y., and Xiao-hui, L. I. U. (2021). Air quality in Nanjing during COVID-19 lockdown period. China Environ. Sci. 41 (7), 3088–3095. doi:10.19674/j.cnki.issn1000-6923.20210223.026
Wang, L. (2021). Analysis of typical ozone pollution processes in Liaoning Province. J. Green Sci. Technol. 23 (22), 167–169+172. doi:10.16663/j.cnki.lskj.2021.22.045
Wang, Y.-S., Dong-sheng, J. I., Jin-yuan, X. I. N., Hu, B., and Wang, W.-J. (2011). Characteristics of atmospheric pollutants in Tianjin binhai new area during autumn and winter. China Environ. Sci. 31 (07), 1077–1086.
Wang, L., Ren, Q., and Yang, S. (2015). Study on terrain classification standard and zoning scheme of Liaoning Province. J. Liaoning Normal Univ. Nat. Sci. Ed. 38 (03), 391–398.
Wei-jie, L. I., Hu-jia, Z., Chen, Q.-L., Lin-chang, A. N., Zhang, J., and Wang, X.-X. (2022). Variation characteristics of air pollutants in Sichuan region during January-March of 2020. J. Meteorology Environ. 38 (1), 15–22.
Wu, Y.-H., He-ming, B. A. I., Shi, H.-D., Xi-cang, L. I., Gao, C.-X., and Hai-qing, S. (2016). Assessing the influence of weather conditions on the change of air quality in hohhot. Arid Zone Res. 33 (02), 292–298. doi:10.13866/j.azr.2016.02.10
Wu, X., Du, Q., Xu, Z., and Cai, Z. (2006). Design and algorithm optimization of complex linear symbol. Geomatics Inf. Sci. Wuhan Univ. 31 (7), 632–635.
Xian-yu, Y., Yi, J.-J., Lu, Y.-Q., Zhi-hong, L. I. U., Wang, S.-G., Lu, S.-H., et al. (2020). Characteristics and formation mechanism of a severe O3 episode in Chengdu and surrounding areas. China Environ. Sci. 40 (5), 2000–2009. doi:10.19674/j.cnki.issn1000-6923.2020.0226
Xiao-mei, Y. I. N., Zi-ming, L. I., Qiao, L., Xiang-xue, L. I. U., Guo, H., Jin, W. U., et al. (2021). Effect analysis of meteorological conditions on air quality during the winter COVID-19 lockdown in Beijing. China Environ. Sci. 41 (5), 1985–1994. doi:10.19674/j.cnki.issn1000-6923.2021.0209
Xie, J.-H., Li, S., and Xiao, Z.-Y. (2022). Investigating the temporal and spatial variabilities of total ozone over China for the past 50 years. China Environ. Sci. 42 (7), 2977–2987. doi:10.19674/j.cnki.issn1000-6923.20220221.011
Xing-liang, A. I., Guo-jun, S., Jiang, X.-Q., Yu, J.-J., and Dan-yang, F. (2021). Impacts of the COVID-19 pandemic on air quality in Xianyang. China Environ. Sci. 41 (7), 3106–3114. doi:10.19674/j.cnki.issn1000-6923.20210331.004
Xue, M., Wang, Y., Sun, Y., Hu, B., and Wang, M. (2006). Measurement on the atmospheric CO concentration in Beijing. Environ. Sci. 27 (02), 200–206. doi:10.13227/j.hjkx.2006.02.002
Xue, Y., Zhang, P., and Liu, L. (2021). Analysis of distribution characteristics and influencing factors of air pollutants in typical coastal eities. Energy Environ. Prot. 35 (05), 94–101.
Yin, H., Tan, J.-L., Wang, J.-Y., Hong-quan, L. I., Lei, X. I., Wu, B., et al. (2021). Analysis of PM2.5 concentration changes and transmission characteristics in Huzhou city. J. Meteorology Environ. 37 (5), 20–26.
Yu, F., Li, X., Li, J., Hua, X., Chen, Q., Li, H., et al. (2021). Effects of corona virus disease 2019 on air quality in guanzhong basin. J. Shaanxi Univ. Sci. 39 (04), 28–39.
Zeng, P., Xin, C.-L., Shi, Y. U., Zhu, H.-Y., and Qi, L. I. U. (2020). Analysis of PM2.5 sources and potential source areas of typical industrial city in spring and winter: a case study in Liuzhou. China Environ. Sci. 40 (9), 3781–3790. doi:10.19674/j.cnki.issn1000-6923.2020.0423
Zhang, C. (2022). The effect of COVID-19 epidemic prevention and control on the emission reduction of air pollutants in qinhuangdao city. J. Xingtai Polytech. Coll. 39 (01), 81–86.
Zhou, C. Y., Li, Q., Wang, Z. T., Gao, Y. H., Zhang, L. J., Chen, H., et al. (2016). Spatio–temporal trend and changing factors of tropospheric NO2 column density in Beijing-Tianjin-Hebei region from 2005 to 2014. Natl. Remote Sens. Bull. 20 (3), 468–480. doi:10.11834/jrs.20165087
Zhou, J.-P., Yuan, B., Yu-wen, P., Su-xia, Y., Jin, L. I., Liu, S.-L., et al. (2023). Simulation of the coupling relationships between ecosystem services and human well-being in Chongqing. China Environ. Sci. 43 (5), 2198–2209. doi:10.19674/j.cnki.issn1000-6923.20230111.001
Keywords: air quality, EMI index, Kriging interpolation, emission reduction measures, topographic impacts
Citation: Wang J, Ren K, Su H, Zhou C, Li X and Wang Y (2024) Analysis of air quality changes and causes in the Liaoning region from 2017 to 2022. Front. Environ. Sci. 12:1344194. doi: 10.3389/fenvs.2024.1344194
Received: 25 November 2023; Accepted: 17 January 2024;
Published: 14 February 2024.
Edited by:
Andrew Hursthouse, University of the West of Scotland, United KingdomReviewed by:
Zhe Wang, Chinese Academy of Sciences (CAS), ChinaDuanyang Liu, Chinese Academy of Meteorological Sciences, China
Copyright © 2024 Wang, Ren, Su, Zhou, Li and Wang. This is an open-access article distributed under the terms of the Creative Commons Attribution License (CC BY). The use, distribution or reproduction in other forums is permitted, provided the original author(s) and the copyright owner(s) are credited and that the original publication in this journal is cited, in accordance with accepted academic practice. No use, distribution or reproduction is permitted which does not comply with these terms.
*Correspondence: Hang Su, Y2hhcmxpZV9nbmFAMTYzLmNvbQ==
 Jinhu Wang1,2,3,4,5
 Kejin Ren