 Amanda M. Vieillard1
 Peter Girguis
 Robinson W. Fulweiler
95% of researchers rate our articles as excellent or good
Learn more about the work of our research integrity team to safeguard the quality of each article we publish.
Find out more
BRIEF RESEARCH REPORT article
Front. Environ. Sci. , 05 July 2024
Sec. Biogeochemical Dynamics
Volume 12 - 2024 | https://doi.org/10.3389/fenvs.2024.1340416
Salt marshes provide many important ecosystem services, key among them being carbon sequestration. However, a large degree of uncertainty remains in salt marsh carbon budgets, particularly during colder months of the year when salt marsh microbial and vegetative activity is assumed to dormant. We also lack data on urban systems. In this study, we used an easily portable carbon dioxide sensor package to directly measure net carbon dioxide (CO2) fluxes throughout the winter in a temperate, urban salt marsh. We sampled across the dormant season both on normal (cold) temperature days and on days that were anomalously warm (defined here as air temperatures 2.8°C above the long-term average). We demonstrated that median (±mad) daytime CO2 fluxes doubled on the warm days, compared to cold days (1.7 ± 2 mmol m−2 h−1, 0.7 ± 1.3 mmol m−2 h−1, respectively). We also show that net CO2 emissions scaled with soil temperature. The high day-to-day variability, however, implies that infrequent or sparse measurements cannot sufficiently capture the temporal dynamics of dormant season salt marsh net CO2 fluxes. The magnitude of the net CO2 source from our sampling during the dormant season leads us to hypothesize that, as mean annual temperatures continue to increase, dormant season CO2 emissions from salt marshes will increasingly offset growing season carbon dioxide uptake. This change compromises the carbon sequestration capacity, and therefore the climate mitigation potential of these ecosystems. Future studies should focus on quantifying the impact of dormant season CO2, and other greenhouse gases on salt marsh carbon budgets.
Salt marshes are important ecosystems which deliver a wealth of services such as critical habitat provision, storm surge protection, and pollution filtration (e.g., De Groot et al., 2012). Compared to other coastal wetlands and forested terrestrial ecosystems, salt marshes also have the highest global average carbon accumulation rate of ∼250 g C m−2 y−1 (Ouyang and Lee, 2014). Despite their importance, these are some of the most degraded systems on earth, with approximately half of all salt marshes having been lost in the last ∼200 years worldwide (Silliman et al., 2009, Campbell et al., 2022). Salt marsh degradation is driven by a variety of human activities including major hydrological alterations, such as ditching and draining, as well as pollution exposure from excess nutrients and heavy metals (Bergbäck et al., 2001, Verhoeven et al., 2006; Davidson et al., 2010; Mitsch and Hernandez, 2013). Additionally, salt marshes are losing their ability to migrate in response to sea level rise because they are increasingly bounded by impervious human infrastructure (Fitzgerald and Hughes, 2019). This is especially true for urban salt marshes, which are even more heavily impacted and degraded. Further, urban marshes are vastly understudied relative to their rural counterparts, so the impacts of anthropogenic stressors on urban marshes remain poorly understood (Macreadie et al., 2013; Doroski et al., 2019).
Over the last decade, renewed attention has focused on salt marshes as part of a major push to understand coastal blue carbon capacity, that is the ability of marine ecosystems to capture and store carbon (e.g., Macreadie et al., 2013; Crooks et al., 2018; Bertram et al., 2021). Marshes have the potential to sequester and store large quantities of carbon from the atmosphere. In fact, vegetated coastal ecosystems (e.g., salt marshes, mangroves, and seagrasses), account for 50% of the total carbon buried in marine sediments (Duarte et al., 2013). The carbon sequestration capacity of a salt marsh is the result of a combination of various processes. There is the carbon stored within the salt marsh which includes carbon taken up through photosynthesis and stored as biomass as well as captured allochthonous organic carbon, the carbon released from the marsh to the atmosphere (as carbon dioxide (CO2) or methane), riverine carbon input, and any lateral flux out of the marsh into surrounding water. It is the balance of these processes that determines if a salt marsh is a net sink or net source of carbon. However, the magnitudes of these fluxes remain an area of uncertainty due to the highly variable nature of salt marsh systems and the difficulty in capturing high spatial or temporal resolution data (McLeod et al., 2011; Rosentreter J. A. et al., 2021; Gallagher et al., 2022).
Most of our understanding of greenhouse dynamics in temperate salt marshes is based on measurements made during the growing season (e.g., Emery and Fulweiler, 2014; Al-Haj and Fulweiler, 2020; Rosentreter J. et al., 2021). In temperate salt marshes, the growing season is between May and October (or October to March in the Southern hemisphere), and for a variety of ecological and logistical reasons, we tend to collect fluxes of CO2 and other greenhouse gasses during this period. Ecologically, these decisions are based on the idea that metabolism scales with temperature, thus little respiration activity is expected in the colder winter months (e.g., Thamdrup et al., 1998; Kostka et al., 2002). Further, the lack of living salt marsh vegetation and the weak winter sun also means minimal photosynthetic activity. Logistically, sampling in colder months can be challenging for many of reasons, for example, where this study took place, ice and snow cover may limit access to the salt marsh surface. Thus, few studies of dormant season CO2 fluxes from salt marshes have been published. However, despite preconceptions, the few existing studies highlight the potential for salt marshes to be a source of CO2 during this period (Table 1).
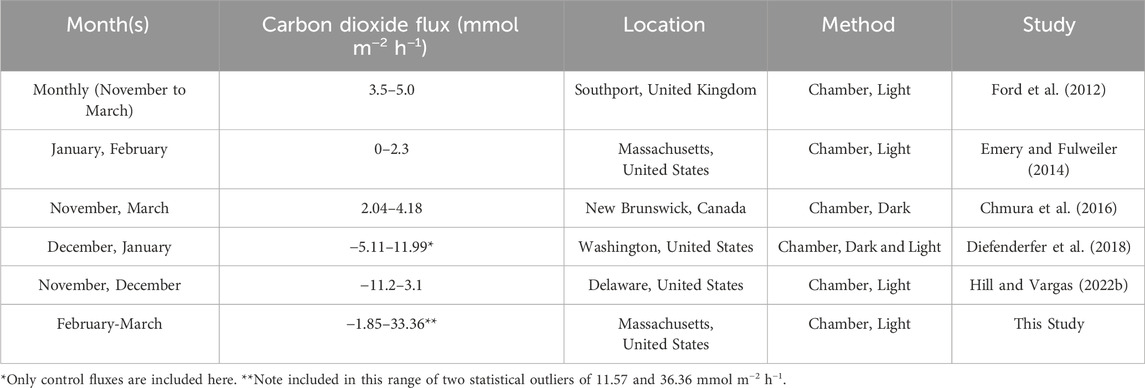
Table 1. Examples of dormant season carbon dioxide fluxes as measured with chambers from temperate salt marshes. Note that the method and frequency of sampling differs across studies.
While the prevailing view is that little metabolic activity occurs in salt marshes outside of the growing season, there is reason to think this is not always the case. Over 40 years ago Teal and Teal (1983) noted that warm winter days can increase the temperature of the surface of the salt marsh up to 27°C. Terrestrial studies highlight the insulating power of snowpack and increased respiration under it, allowing a buildup of CO2 (Bubier et al., 2002; Lupascu et al., 2018). The snow itself may also act as a barrier impeding the escape of CO2 to the atmosphere, keeping emissions low when snow cover is intact (Pedron et al., 2022). Today, climate change is leading to warming temperatures throughout the year, with many temperate areas experiencing disproportionately more warming in the winter months (NOAA, 2023). Additionally, in the northeast United States winter temperatures are becoming more variable with cold days often followed by multiple warm days, thus increasing the potential CO2 generation during a season we normally consider metabolically dormant (Fan et al., 2015).
The goal of this study was to quantify daytime CO2 fluxes from an urban temperate salt marsh during the dormant season and to examine how the marsh responds to warm days during this otherwise cold period. We hypothesized that in general daytime CO2 fluxes from the dormant marsh would be low, but not zero, and that they would increase as the salt marsh warmed. To test these hypotheses, we conducted a series of closed chamber flux measurements on an urban salt marsh in Boston, MA (United States) between February and April 2022.
This study was conducted at the Belle Isle Marsh Reserve in Boston, MA, United States of America. Belle Isle is the largest remaining salt marsh in the city of Boston, where over 80% of native salt marshes have been lost (Bromberg and Bertness, 2005). Here we use the U.S. census definition of “urban” meaning within the boundaries of a city or town with a population of 50,000 or more. This marsh falls within the boundaries of the city of Boston, population ∼650,000 (census.gov). This is an urban ecosystem that is bounded by dense human development, and approximately 30% of the marsh area has been restored from industrial and commercial use since the late 1970s (Massachusetts Department of Conservation and Recreation, Supplementary Figure S1). To capture the impact of warming winters on marsh CO2 dynamics, we took daytime flux measurements roughly twice weekly from the beginning of February through the beginning of April 2022, totaling 15 sampling days.
According to NOAA, the winters in this study region were, on average, 5°F warmer than normal in 2021. We therefore used this as the threshold for “warm days” and have converted it to degrees Celsius to meet scientific notation standards. Sample days were evenly distributed between normal temperature days, or days which fell within the 1981–2010 average temperature range (National Weather Service, 2021), and warm days which were at least 2.8°C (i.e., 5°F) warmer than the 1981–2010 average. We used the daily air temperatures from the National Weather Service station at Boston Logan International Airport, which is located within Boston Harbor, and is just 3.3 km away from the study site. We measured salt marsh soil temperature at 5 cm depth using a soil temperature probe (Sunleaves).
Triplicate carbon dioxide fluxes were measured in two marsh zones, high marsh (42° 23′20″N, 70° 59′29″W) and low marsh (42° 23′18″N, 70° 59′22″W). In the high marsh Spartina patens was the dominant vegetation species, whereas the low marsh was dominated by Distichlis spicata interspersed with Spartina alterniflora (short form). The high marsh site is approximately 1.1 m above sea level, while the low marsh is approximately 0.6 m above sea level. The mean tidal range is range 2.9 m, therefore at high tide the low marsh is fully flooded, while the high marsh site only flood during spring tides. We chose representative high and low marsh sites for this research, and haphazardly chose chamber placement within these zones each sampling trip. We also took flux measurements in the middle of the day between 10 a.m. and 3 p.m. All sampling took place when the salt marsh was exposed and not inundated with tidal water. On average sampling took place within 6.5 h of last high tide, though this ranged from 1 to 11 h.
We measured CO2 concentrations in this study using an affordable, easily portable (<0.8 kg) sensor package (Supplementary Material) similar to those used previously for experimental CO2 monitoring (Bastviken et al., 2015; Chen and Markham, 2020). Briefly, a small, non-dispersive infrared CO2 sensor (K30, Sensair) and a weather-proof temperature and humidity sensor (SHT-30, Adafruit) were coupled to a microcontroller (Uno Rev3, Arduino) with data logging shield (1,141, Adafruit) and programed to record CO2 concentration, temperature, and humidity every 3 s. The sensor system was housed in a waterproof container and internal pumps pulled air in from the outside over the CO2 sensor. We calibrated the sensor before each deployment with a two-point calibration by connecting the sensor inflow to helium and 400 ppm CO2 standard tanks per manufacturer specifications (SenseAir). The digital sensors were then adjusted to calibration data using GasLab software (CO2meter.com). These sensors were ground-truthed against the more widely used cavity ringdown mass spectrometer (G2508, Picarro) and found to have good agreement (Supplementary Information, Supplementary Figure S2).
To measure CO2 fluxes, sensor packages were placed inside domed, acrylic chambers (25.4 cm diameter by 20.3 cm tall). Chambers were pushed approximately 1 cm into the marsh surface (or snow surface if there was consistent snow cover), sealing off 9.4 L of air. Sensors then recorded the CO2 concentration, temperature, and humidity every 3 s during 10-min incubations. Multiple incubations were conducted each day as our objective was to deploy triplicate samples in the high and low marsh during each sampling event. CO2 concentrations were consistently linear with time throughout the study, allowing us to use a linear regression to calculate net CO2 fluxes. We calculated net CO2 flux using the rate of change in CO2 concentration over the course of the incubation, temperature corrected and normalized to chamber volume and surface area, yielding fluxes in mmol m−2 h−1. The slope of this linear relationship was used in the flux calculation, provided that p > 0.05 (Brannon et al., 2016; Eq. (1)). If p < 0.05, the flux was reported as net zero. The minimum detectable flux for these sensors was found to be 0.072 mmol m−2 h−1 (Supplemental Information) and any flux smaller than this (absolute value) was designated as non-detect (ND). These are net fluxes and are equivalent to net ecosystem exchange (NEE): positive fluxes are indicative of net CO2 release (respiration) while negative fluxes indicate net CO2 uptake (photosynthesis).
All data analysis was done in R v.4.3.2 (R Core Team, 2023). We considered statistical tests significant when p ≤ 0.05. Packages EnvStats (Millard, 2013), outliers (Komsta, 2022), ggpmisc (Aphalo, 2024), and ggplot2 (Wickham, 2016) were used for statistical analyses and data visualization.
Temperatures during the sampling period (February 2–4 April 2022) were highly variable and often much warmer than 1981–2010 normals (National Weather Service, 2021; Figure 1). Soil temperature on sampling days were also variable with air and soil temperatures ranging from −7–19°C and −1–13°C, respectively. Sensor package temperature measured outside the sample chambers was significantly correlated with the mean daily air temperature recorded at the National Weather Service station at Boston Logan International Airport (Supplementary Figure S3). Sensor package temperature was on average 4°C higher than the maximum recorded daily temperature at Boston Logan International Airport. We are unsure of the reason for the discrepancies between the two air temperature sensors. We suspect it may be due to the location of the temperature probes–where the weather station is recording air temperature above the ground, while the sensor package temperature sensors are measuring at the ground level. Regardless the strong correlation suggests the data are comparable.
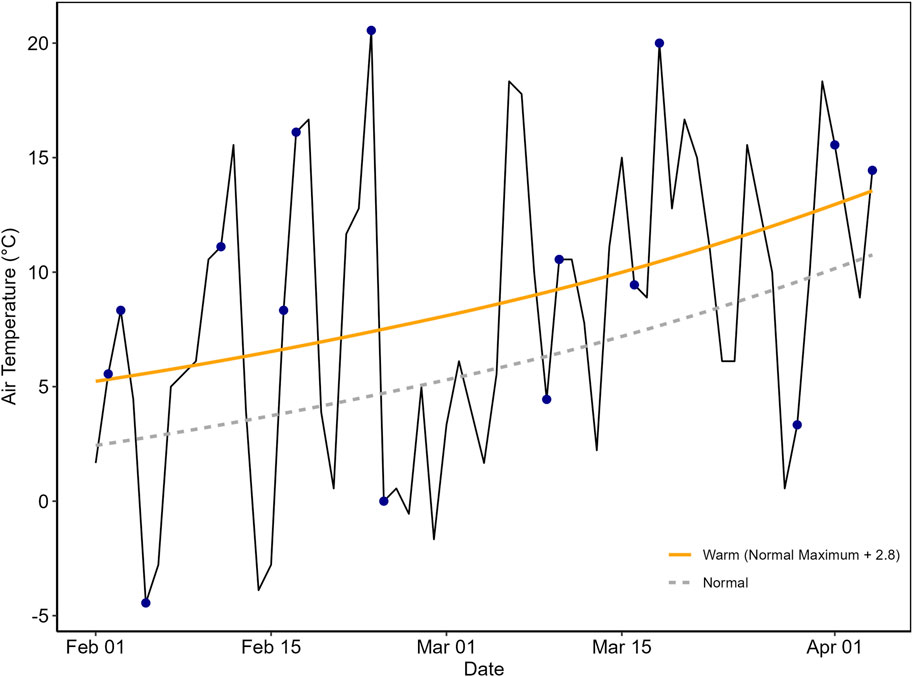
Figure 1. Air temperature variation over the course of this study showing daily high temperature (solid black line), average normal high temperature (1981–2010, dashed grey line), warm days which we defined here as at least 2.8°C warmer than the 1981–2010 average (yellow line), and sampling dates (blue circles). Dates are listed as day of year (2022). In this study 10 out of the 15 sampling events occurred on days that were above long-term average temperatures.
Soil temperature was strongly correlated to maximum daily air temperature as recorded at the National Weather Service station at Boston Logan International Airport (r = 0.80, p = 0.0005) and to the sensor package temperature outside the sample chambers (r = 0.73, p = 0.003).
Net CO2 fluxes across the salt marsh soil-air interface in this study ranged from −1.85–36.61 mmol m−2 h−1, and fluxes from the high and low marsh were not significantly different (p = 0.4958) from each other (Figure 2A) On one occasion (March 29), we measured two high CO2 fluxes of 11.57 and 36.61 mmol m−2 h−1. A Rosner test and the interquartile range method identified these values as outliers, so we removed them from further analysis. However, we note that although these points were a statistical outliers, we have no reason to think they are necessarily measurement errors so we have retained these values in the dataset and provide them in the figure and table captions.
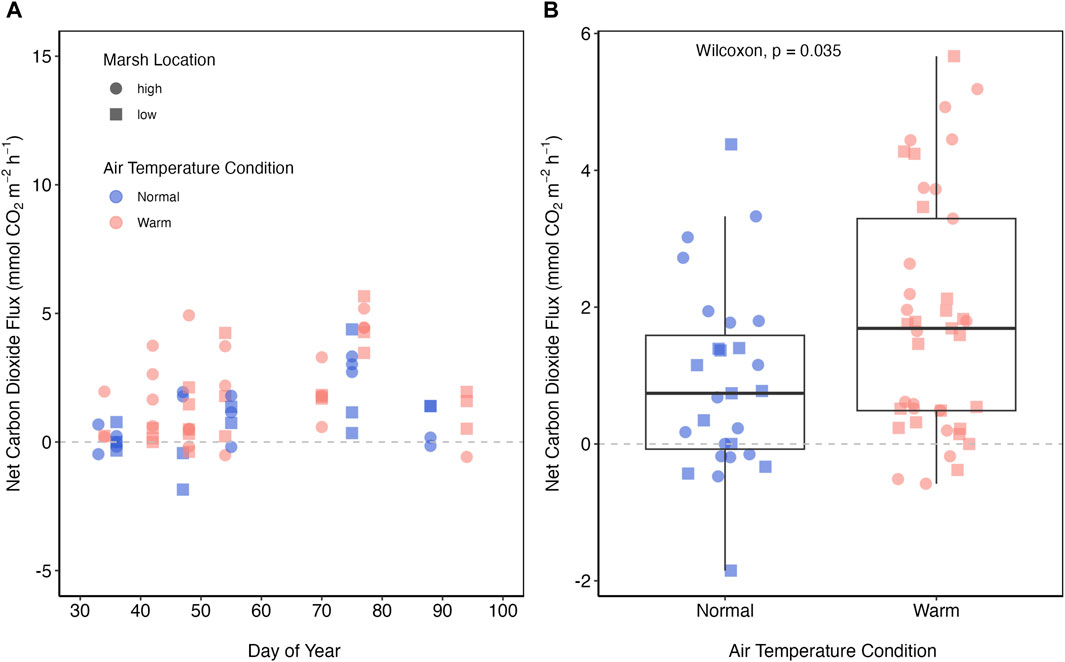
Figure 2. (A) Fluxes of carbon dioxide (mmol m−2 h−1) across the salt marsh-atmosphere interface and the days of the year sampled in this study (2022). (B) A comparison of carbon dioxide fluxes between normal (i.e., typical cold days; blue) and warm (i.e., days that are at least 2.8°C warmer than the 1981–2010 average; pink). Data from the high (circle) and low (square) marsh sites are also shown. There is no statistical difference between carbon dioxide fluxes from the low or high marsh. Two statistical outliers of 11.57 and 36.36 mmol m−2 h−1 are removed from this figure.
We captured CO2 fluxes on both normal and warm days throughout this study period and typically within a few days of each other (Figure 2A). We observed that median (±mad) CO2 fluxes from normal days were more than 2x lower than those from the warm days (0.74 (±1.3) mmol m−2 h−1, 1.69 (±2.0) mmol m−2 h−1, respectively; Figure 2B). We also observed a significant positive linear relationship between soil temperature and CO2 flux (Figure 3A; R2 = 0.33, p < 0.001). This relationship appears slightly stronger for the low marsh compared to the high marsh (Figure 3B).
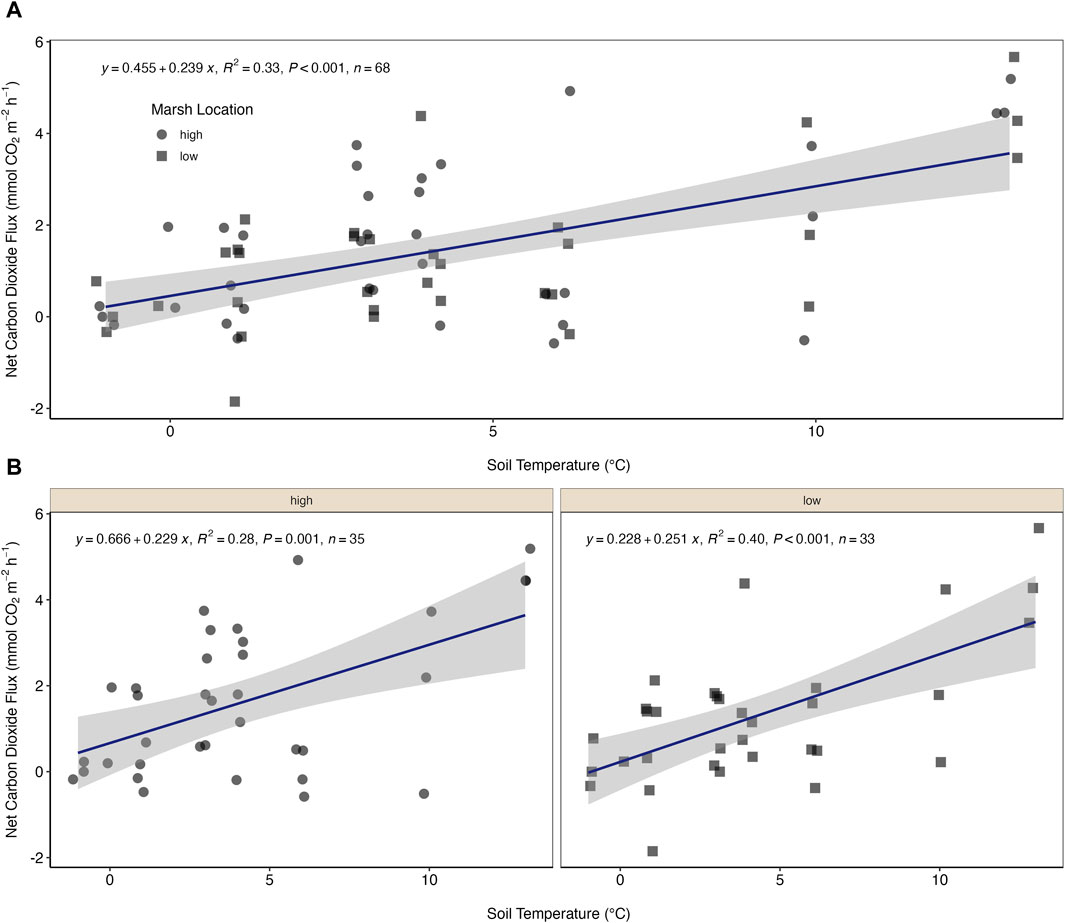
Figure 3. (A) Fluxes of carbon dioxide (mmol CO2 m−2 h−1) across the salt marsh-atmosphere interface as a function of soil temperature for the high (closed circles) and low (closed squares) marsh. (B) Fluxes of carbon dioxide (mmol CO2 m−2 h−1) across the salt marsh-atmosphere interface as a function of soil temperature separated by marsh location. Two statistical outliers of 11.57 and 36.36 mmol m−2 h−1 are removed from this figure.
Given the gaps in our understanding of salt marsh carbon dynamics, we examined daytime CO2 fluxes during the dormant season in an urban, temperate marsh using a chamber and a low-cost portable sensor package. We found that net CO2 fluxes were dominated by net emissions, regardless of sampling location (i.e., high or low marsh, Figure 2A). We also found that, as hypothesized, net CO2 fluxes were lower on normal (i.e., cold) days compared to the anomalous warm days (Figure 2B). The range of fluxes observed in this study are comparable to those reported for nearby salt marshes (Emery and Fulweiler, 2014; Forbrich and Giblin, 2015; Emery et al., 2019), and to other dormant season salt marsh CO2 fluxes measured using similar methods (Table 1). They are also on par with dormant season CO2 fluxes reported from salt marsh eddy co-variance measurements across a variety of conditions (Tonti et al., 2018; Huang et al., 2020; Arias-Ortiz et al., 2021; Chu et al., 2021; Vázquez-Lule and Vargas, 2021). Eddy co-variance measurements offer an excellent way to measure long-term, continuous CO2 fluxes, however they are expensive, and require significant expertise to maintain and conduct the data analysis (Rosentreter et al., 2023). Here we demonstrate that chambers equipped with low-cost sensor package can also capture dormant season CO2 fluxes. Additionally, this study contributes to mounting evidence that non-growing season months have a quantifiable and relevant impact on salt marsh net carbon budgets.
The current marsh sampling paradigm heavily biases salt marsh greenhouse gas data toward the growing season carrying over the assumption that, due to low temperatures and correspondingly low respiration rates, winter and early spring greenhouse gas fluxes are negligible. The result is a limited understanding of carbon and greenhouse gas dynamics in salt marshes, with snapshots often being used as representatives for an entire season. However, this study illustrates that, while dormant season CO2 fluxes are highly variable, they are larger and more dynamic than the existing paradigm would suggest (Table 1; Figure 2). Further, we have demonstrated that the timing and frequency of sampling matters. Single or scattered sampling is insufficient to capture these dynamics and thus understand how they impact carbon storage and budgets.
To illustrate the potential impact on a salt marsh carbon budget we can compare the median daytime carbon dioxide uptake during the active growing season (June to August) from a nearby salt marsh (median = −10.96 mmol m−2 h−1, Emery and Fulweiler, 2014), to the median normal (0.74 ± 1.3 mmol m−2 h−1) and warm (1.69 ± 2.0 mmol m−2 h−1) fluxes observed here. There are 92 days in this period, and if we assume that CO2 uptake occurs in the 12 daylight hours of those days, then we would estimate a net, daytime carbon dioxide uptake of 12,100 mmol m-2 for those 3 months. If we similarly assume a non-growing season period of 92 days, 12 daylight hours, and normal temperatures we estimate a release of 817 mmol m−2, or under warm conditions a release of 1866 mmol m−2 per dormant season. This back of the envelope calculation demonstrates that even during the normal dormant season the marsh is source of carbon dioxide that would decrease growing season, daytime carbon dioxide uptake by ∼7%. However, under warm conditions, like those we anticipate seeing increasingly in the future, dormant season carbon dioxide release would decrease carbon dioxide uptake during the growing season by 15%. Of course, this is a simplistic calculation that does not account for numerous variables across space and time–including the full-time range of the growing season, nighttime respiration, carbon dioxide fluxes during other parts of the year, or when the marsh is inundated. However, it does illustrate the importance of quantifying carbon dioxide fluxes across the whole year. Additionally, it is important to note that these percentages would change drastically on any given day we sampled—from augmenting growing season CO2 uptake by ∼1% to reducing it by >100% (Figure 2). These natural variations in carbon dioxide flux are substantial, and clearly underscore the need for higher temporal resolution sampling to adequately assess the carbon dynamics in salt marshes during the entire year.
Further, in this study we clearly demonstrate that the relationship between temperature and respiration holds through the dormant season for both the high and low marsh (Figure 3). We hypothesize then that warming temperatures in winter and early spring can be expected to further increase carbon emissions from temperate salt marshes. The variability and scarcity of cold weather data leaves a gap in our ability to model and predict the consequences of continued warming. However, our work and others suggest that, among its many known consequences, climate change is also likely to change and limit the dormant season carbon storage capacity of temperate blue carbon ecosystems such as salt marshes. Increasing temperatures lead to increased microbial respiration, resulting in increased carbon emissions as well as accelerated depletion of soil organic carbon stocks (Campbell et al., 2022). This shift could not only potentially change marshes from net sinks to net sources of carbon, but also diminish their capacity for long-term carbon storage in their anoxic sediments, as has been observed in other systems (Natali et al., 2019; Pedron et al., 2022). Additionally, it is worth noting that the predictive power of the CO2 flux versus soil temperature is low, indicating that there are other factors driving these fluxes. Anomalously warm winter events and warmer dormant seasons in general are happening in concert with many other changes to salt marshes including rising sea level, increased atmospheric CO2 concentrations, and nutrient pollution. The combined impact of these stressors will alter salt marsh production in the growing season, and very likely the dormant season response to temperature. For example, Koop-Jakobsen and Dolch (2023) recently used mesocosms to demonstrate that increased temperature and CO2 concentration alters above and below ground biomass differently, and that the response varied with both vegetation type and marsh location. All together it is clear that capturing the blue carbon capacity of salt marshes, and other blue carbon systems, is complicated and dynamic (Gallagher, 2023), but higher temporal resolution data throughout the year will certainly help fill the existing knowledge gaps.
As temperate and polar regions continue to experience disproportionately warmer winters (NOAA, 2023), a climate induced change in marsh carbon storage may result in reduced natural climate change mitigation potential. A recent study estimated the current, global carbon storage of blue carbon ecosystems, such as salt marshes, to be worth $190.7 ± 30 bn USD annually, with the United States having the second largest blue carbon storage potential in the world (Bertram et al., 2021). Therefore, the diminishing capacity of temperate marshes to sequester and store carbon will not only have devastating ecological effects but can also have both national and global economic consequences.
Annual temperatures within the last decade are the hottest on record worldwide (Lenssen et al., 2019; NASA and GISTEMP, 2023; NOAA, 2023). This unprecedented warming is having a range of impacts on ecological systems. Here we show that CO2 fluxes from a temperate urban salt marsh ecosystem responds rapidly to short-term warming events. This study also demonstrates that in addition to needing more and higher resolution dormant season measurements for better salt marsh carbon budgets, we now must also take in account the impact winter and early spring warming will have on the blue carbon capacity of salt marshes, and by extension their ability to help mitigate the devastating effects of climate change. Additionally, while we focused on carbon dioxide here, we anticipate nitrous oxide and methane, two other powerful greenhouse gases may also exhibit similar responses to warming temperatures (Gallagher, 2023). For example, laboratory incubation studies revealed that increased temperature caused a dramatic rise in salt marsh N2O fluxes (Comer-Warner et al., 2024). We anticipate methane emissions would also increase with temperature but to what degree likely depends on site specific conditions like water levels and carbon to nitrogen content of soils (Al-Haj and Fulweiler, 2020; Hu et al., 2024). Overall, this study highlights that dormant season may no longer be metabolically quiet. We hope this study motivates future research on salt marsh greenhouse gas cycling in non-growing season months.
The raw data supporting the conclusions of this article will be made available by the authors, without undue reservation.
AV: Conceptualization, Data curation, Formal Analysis, Investigation, Methodology, Visualization, Writing–original draft, Writing–review and editing. PG: Funding acquisition, Writing–review and editing. RF: Funding acquisition, Writing–review and editing, Conceptualization, Data curation, Formal Analysis, Investigation, Methodology, Project administration, Resources, Supervision, Visualization, Writing–original draft.
The author(s) declare that financial support was received for the research, authorship, and/or publication of this article. Support for this work and for AV and RF was provided by the National Science Foundation (Grant #1940085). Participation from PG was supported by the National Science Foundation (Grant #1940100).
We would like to thank Belle Isle Marsh Reservation and Sean Riley for granting access to this study site, as well as Dr. Matthew Evans (Wheaton College) and Dr. Cathleen Wigand (EPA) for access to Picaro instrumentation for sensor validation. We appreciate the manufacturing help and guidance from the Engineering Product Innovation Center at Boston University. We thank Dr. Zara Mirmalek with whom we had numerous helpful conversations about sensor package development and sharing as well as how we and others access technology. We thank Dr. Lena Champlin for her helpful comments on this manuscript. We thank Vera Farcus for her research support. This work would not have been possible without field support provided by Nia Bartolucci, Rebecca Adler, Renee Lee, Rhone-Ann Huang, Catherine Mahoney, Melissa Hagy, and Alexandra Geisser. Finally, we thank Sawyer Balint for help with Figure 1 R code.
The authors declare that the research was conducted in the absence of any commercial or financial relationships that could be construed as a potential conflict of interest.
All claims expressed in this article are solely those of the authors and do not necessarily represent those of their affiliated organizations, or those of the publisher, the editors and the reviewers. Any product that may be evaluated in this article, or claim that may be made by its manufacturer, is not guaranteed or endorsed by the publisher.
The Supplementary Material for this article can be found online at: https://www.frontiersin.org/articles/10.3389/fenvs.2024.1340416/full#supplementary-material
1981-2010 Climate Normals Information (2021). 1981-2010 Climate Normals Information. Available at: https://www.weather.gov/jan/climatenormals1981-2010 (Accessed January 20, 2022).
Al-Haj, A. N., and Fulweiler, R. W. (2020). A synthesis of methane emissions from shallow vegetated coastal ecosystems. Global Change Biology 26 (5), 2988–3005.
Aphalo, P. (2024). ggpmisc: Miscellaneous Extensions to 'ggplot2'_. R package version 0.5.6. Available at: https://CRAN.R-project.org/package=ggpmisc.
Arias-Ortiz, A., Oikawa, P. Y., Carlin, J., Masqué, P., Shahan, J., Kanneg, S., et al. (2021). Tidal and Nontidal Marsh Restoration: A Trade-Off Between Carbon Sequestration, Methane Emissions, and Soil Accretion. Biogeosciences 126 (12), e2021JG006573. doi:10.1029/2021JG006573
Bastviken, D., Sundgren, I., Natchimuthu, S., Reyier, H., and Gålfalk, M. (2015). Technical Note: Cost-efficient approaches to measure carbon dioxide (CO2) fluxes and concentrations in terrestrial and aquatic environments using mini loggers. Biogeosciences. Copernicus GmbH 12 (12), 3849–3859. doi:10.5194/bg-12-3849-2015
Bergbäck, B., Johansson, K., and Mohlander, U. (2001). Urban metal flows–a case study of Stockholm. Review and Conclusions. Water, air soil Pollut. Focus. Springer 1 (3), 3–24. doi:10.1023/a:1017531532576
Bertram, C., Quaas, M., Reusch, T. B. H., Vafeidis, A. T., Wolff, C., and Rickels, W. (2021). The blue carbon wealth of nations. Nat. Clim. Change 11 (8), 704–709. doi:10.1038/s41558-021-01089-4
Brannon, E. Q., Moseman-Valtierra, S. M., Rella, C. W., Martin, R. M., Chen, X., and Tang, J. (2016). Evaluation of laser-based spectrometers for greenhouse gas flux measurements in coastal marshes. Limnol. Oceanogr. Methods 14 (7), 466–476. doi:10.1002/lom3.10105
Bromberg, K. D., and Bertness, M. D. (2005). Reconstructing New England salt marsh losses using historical maps. Estuaries 28 (6), 823–832. doi:10.1007/BF02696012
Bubier, J., Crill, P., and Mosedale, A. (2002). Net ecosystem CO2 exchange measured by autochambers during the snow-covered season at a temperate peatland. Hydrol. Process. 16 (18), 3667–3682. doi:10.1002/hyp.1233
Campbell, A. D., Fatoyinbo, L., Goldberg, L., and Lagomasino, D. (2022). Global hotspots of salt marsh change and carbon emissions. Nature 612 (7941), 701–706. doi:10.1038/s41586-022-05355-z
Chen, H., and Markham, J. (2020) “Using microcontrollers and sensors to build an inexpensive CO2 control system for growth chambers,” in Applications in Plant Sciences. doi:10.1002/aps3.11393
Chmura, G. L., Kellman, L., Van Ardenne, L., and Guntenspergen, G. R. (2016). Greenhouse gas fluxes from salt marshes exposed to chronic nutrient enrichment. PloS one 11 (2), e0149937. doi:10.1371/journal.pone.0149937
Chu, X., Han, G., Wei, S., Xing, Q., He, W., Sun, B., et al. (2021). Seasonal not annual precipitation drives 8-year variability of interannual net CO2 exchange in a salt marsh. Agric. For. meteorology 308, 108557. doi:10.1016/j.agrformet.2021.108557
Comer-Warner, S. A., Ullah, S., Dey, A., Stagg, C. L., Elsey-Quirk, T., Swarzenski, C. M., et al. (2024). Elevated temperature and nutrients lead to increased N2O emissions from salt marsh soils from cold and warm climates. Biogeochemistry 167 (1), 21–37. doi:10.1007/s10533-023-01104-0
Crooks, S., Windham-Myers, L., and Troxler, T. G. (2018). “Defining blue carbon: the emergence of a climate context for coastal carbon dynamics,” in A blue carbon primer (CRC Press), 1–8. doi:10.1201/9780429435362-1
Davidson, E. A., Savage, K. E., Bettez, N. D., Marino, R., and Howarth, R. W. (2010). Nitrogen in runoff from residential roads in a coastal area. Water, Air, and Soil Pollut. 210 (1), 3–13. doi:10.1007/s11270-009-0218-2
De Groot, R., Brander, L., van der Ploeg, S., Costanza, R., Bernard, F., Braat, L., et al. (2012). Global estimates of the value of ecosystems and their services in monetary units. Ecosyst. Serv. 1 (1), 50–61. doi:10.1016/j.ecoser.2012.07.005
Diefenderfer, H. L., Cullinan, V. I., Borde, A. B., Gunn, C. M., and Thom, R. M. (2018). High-frequency greenhouse gas flux measurement system detects winter storm surge effects on salt marsh. Glob. change Biol. 24 (12), 5961–5971. doi:10.1111/gcb.14430
Doroski, A. A., Helton, A. M., and Vadas, T. M. (2019). Greenhouse gas fluxes from coastal wetlands at the intersection of urban pollution and saltwater intrusion: a soil core experiment. Soil Biol. Biochem. 131, 44–53. doi:10.1016/j.soilbio.2018.12.023
Duarte, C. M., Losada, I. J., Hendriks, I. E., Mazarrasa, I., and Marbà, N. (2013). The role of coastal plant communities for climate change mitigation and adaptation. Nature climate change, 3 (11), 961–968.
Emery, H. E., Angell, J. H., and Fulweiler, R. W. (2019). Salt marsh greenhouse gas fluxes and microbial communities are not sensitive to the first year of precipitation change. J. Geophys. Res. Biogeosciences 124 (5), 1071–1087. doi:10.1029/2018jg004788
Emery, H. E., and Fulweiler, R. W. (2014). Spartina alterniflora and invasive Phragmites australis stands have similar greenhouse gas emissions in a New England marsh. Aquat. Bot. 116, 83–92. doi:10.1016/J.AQUABOT.2014.01.010
Fan, F., Bradley, R. S., and Rawlins, M. A. (2015). Climate change in the northeast United States: an analysis of the NARCCAP multimodel simulations. J. Geophys. Res. Atmos. 120 (20), 10–569. doi:10.1002/2015jd023073
Fitzgerald, D. M., and Hughes, Z. (2019). Marsh processes and their response to climate change and sea-level rise’. doi:10.1146/annurev-earth-082517
Forbrich, I., and Giblin, A. E. (2015). Marsh-atmosphere CO2 exchange in a New England salt marsh. J. Geophys. Res. Biogeosciences 120 (9), 1825–1838. doi:10.1002/2015jg003044
Ford, H., Garbutt, A., Jones, L., and Jones, D. L. (2012). Methane, carbon dioxide and nitrous oxide fluxes from a temperate salt marsh: Grazing management does not alter Global Warming Potential. Coast. Shelf Sci. 113, 182–191. doi:10.1016/j.ecss.2012.08.002
Gallagher, J. B. (2023). An opinion on BlueCAM an Australian blue carbon method to estimate climate change mitigation benefits of coastal wetland restoration by Lovelock et al. Restor. Ecol. 31 (8), e13859. doi:10.1111/rec.13859
Gallagher, J. B., Zhang, K., and Chuan, C. H. (2022). A re-evaluation of wetland carbon sink mitigation concepts and measurements: a diagenetic solution. Wetlands 42 (3), 23. doi:10.1007/s13157-022-01539-5
Hill, A., and Vargas, R. (2022a). Carbon dioxide and methane chamber flux data from temperate S. alterniflora salt-marsh. Figshare. Dataset. doi:10.6084/m9.figshare.20099321.v1
Hill, A. C., and Vargas, R. (2022b). Methane and carbon dioxide fluxes in a temperate tidal salt marsh: comparisons between plot and ecosystem measurements. J. Geophys. Res. Biogeosciences 127 (7), e2022JG006943. doi:10.1029/2022jg006943
Hu, H., Chen, J., Zhou, F., Nie, M., Hou, D., Liu, H., et al. (2024). Relative increases in CH4 and CO2 emissions from wetlands under global warming dependent on soil carbon substrates. Nat. Geosci. 17, 26–31. doi:10.1038/s41561-023-01345-6
Huang, Y., Chen, Z., Tian, B., Zhou, C., Wang, J., Ge, Z., et al. (2020). Tidal effects on ecosystem CO2 exchange in a Phragmites salt marsh of an intertidal shoal. Agric. For. Meteorology 292–293, 108108. doi:10.1016/j.agrformet.2020.108108
Komsta, L. (2022). Outliers: tests for outliers_. R. package version 0.15. Available at: https://CRAN.R-project.org/package=outliers.
Koop-Jakobsen, K., and Dolch, T. (2023). Future climate conditions alter biomass of salt marsh plants in the Wadden Sea. Mar. Biodivers. 53 (3), 41. doi:10.1007/s12526-023-01347-y
Kostka, J. E., Roychoudhury, A., and Van Cappellen, P. (2002). Rates and controls of anaerobic microbial respiration across spatial and temporal gradients in saltmarsh sediments. Biogeochemistry 60 (1), 49–76. doi:10.1023/a:1016525216426
Lenssen, N., Schmidt, G. A., Hansen, J. E., Menne, M. J., Persin, A., Ruedy, R., et al. (2019). Improvements in the GISTEMP uncertainty model. J. Geophys. Res. Atmos. 124 (12), 6307–6326. doi:10.1029/2018JD029522
Lupascu, M., Czimczik, C. I., Welker, M. C., Ziolkowski, L. A., Cooper, E. J., and Welker, J. M. (2018). Winter ecosystem respiration and sources of CO2 from the high Arctic tundra of Svalbard: response to a deeper snow experiment. J. Geophys. Res. Biogeosciences 123 (8), 2627–2642. doi:10.1029/2018jg004396
Macreadie, P. I., Hughes, A. R., and Kimbro, D. L. (2013). Loss of “blue carbon” from coastal salt marshes following habitat disturbance. PLOS ONE. 8 (7), e69244. doi:10.1371/JOURNAL.PONE.0069244
McLeod, E., Chmura, G. L., Bouillon, S., Salm, R., Björk, M., Duarte, C. M., et al. (2011). A blueprint for blue carbon: toward an improved understanding of the role of vegetated coastal habitats in sequestering CO2. Front. Ecol. Environ. 9 (10), 552–560. doi:10.1890/110004
Mitsch, W. J., and Hernandez, M. E. (2013). Landscape and climate change threats to wetlands of North and Central America. Aquat. Sci. 75 (1), 133–149. doi:10.1007/s00027-012-0262-7
NASA and GISTEMP (2023). GISS surface temperature analysis (GISTEMP) verstion 4. Available at: https://data.giss.nasa.gov/gistemp/(Accessed May 22, 2022).
Natali, S. M., Watts, J. D., Rogers, B. M., Potter, S., Ludwig, S. M., Selbmann, A. K., et al. (2019). Large loss of CO2 in winter observed across the northern permafrost region. Nat. Clim. Change 9 (11), 852–857. doi:10.1038/s41558-019-0592-8
National Weather Service (2021). U.S. Climate Normals: 1981-2010—Boston Logan Intl AP, MA. Version v1.0.0. Available at: https://www.ncei.noaa.gov/access/us-climate-normals/#dataset=normals-monthly&timeframe=81&location=MA&station=USW00014739.
NOAA (2023). Climate at a glance. Available at: https://www.ncei.noaa.gov/access/monitoring/climate-at-a-glance/global/mapping.
Ouyang, X., and Lee, S. Y. (2014). Updated estimates of carbon accumulation rates in coastal marsh sediments. Biogeosciences 11 (18), 5057–5071. doi:10.5194/bg-11-5057-2014
Pedron, S. A., Welker, J. M., Euskirchen, E. S., Klein, E. S., Walker, J. C., Xu, X., et al. (2022). Closing the winter gap—year-round measurements of soil CO2 emission sources in arctic tundra. Geophys. Res. Lett. 49 (6), e2021GL097347. doi:10.1029/2021gl097347
R Core Team (2023). R: a language and environment for statistical computing_. Vienna, Austria: R Foundation for Statistical Computing.
Rosentreter, J., Borges, A. V., Deemer, B. R., Holgerson, M. A., Liu, S., Song, C., et al. (2021b). Half of global methane emissions come from highly variable aquatic ecosystem sources. Nat. Geosci. 14 (4), 225–230. doi:10.1038/s41561-021-00715-2
Rosentreter, J. A., Al-Haj, A. N., Fulweiler, R. W., and Williamson, P. (2021a). Methane and nitrous oxide emissions complicate coastal blue carbon assessments. Glob. Biogeochem. Cycles 35 (2), e2020GB006858. doi:10.1029/2020gb006858
Rosentreter, J. A., Laruelle, G. G., Bange, H. W., Bianchi, T. S., Busecke, J. J., Cai, W. J., et al. (2023). Coastal vegetation and estuaries are collectively a greenhouse gas sink. Nat. Clim. change 13 (6), 579–587. doi:10.1038/s41558-023-01682-9
Silliman, B. R., Grosholz, E. D., and Bertness, M. D. (2009). Human impacts on salt marshes: a global perspective. Univ of California Press.
Thamdrup, B., Hansen, J. W., and Jørgensen, B. B. (1998). Temperature dependence of aerobic respiration in a coastal sediment. FEMS Microbiol. Ecol. 25 (2), 189–200. Temperature dependence of aerobic respiration in a coastal sediment. doi:10.1016/s0168-6496(97)00095-0
Tonti, N. E., Gassmann, M. I., and Pérez, C. F. (2018). First results of energy and mass exchange in a salt marsh on southeastern South America. Agric. For. meteorology 263, 59–68. doi:10.1016/j.agrformet.2018.08.001
Vázquez-Lule, A., and Vargas, R. (2021). Biophysical drivers of net ecosystem and methane exchange across phenological phases in a tidal salt marsh. Agric. For. Meteorology 300, 108309. doi:10.1016/j.agrformet.2020.108309
Verhoeven, J. T. A., Arheimer, B., Yin, C., and Hefting, M. (2006). Regional and global concerns over wetlands and water quality. Trends Ecol. Evol. 21 (2), 96–103. doi:10.1016/j.tree.2005.11.015
Keywords: winter biogeochemistry, blue carbon, climate change, portable sensors, greenhouse gas, carbon dioxide
Citation: Vieillard AM, Girguis P and Fulweiler RW (2024) Dormant season warming amplifies daytime CO2 emissions from a temperate urban salt marsh. Front. Environ. Sci. 12:1340416. doi: 10.3389/fenvs.2024.1340416
Received: 17 November 2023; Accepted: 11 June 2024;
Published: 05 July 2024.
Edited by:
Cyril Marchand, University of New Caledonia, FranceReviewed by:
Phillip Williamson, University of East Anglia, United KingdomCopyright © 2024 Vieillard, Girguis and Fulweiler. This is an open-access article distributed under the terms of the Creative Commons Attribution License (CC BY). The use, distribution or reproduction in other forums is permitted, provided the original author(s) and the copyright owner(s) are credited and that the original publication in this journal is cited, in accordance with accepted academic practice. No use, distribution or reproduction is permitted which does not comply with these terms.
*Correspondence: Robinson W. Fulweiler, cndmQGJ1LmVkdQ==
Disclaimer: All claims expressed in this article are solely those of the authors and do not necessarily represent those of their affiliated organizations, or those of the publisher, the editors and the reviewers. Any product that may be evaluated in this article or claim that may be made by its manufacturer is not guaranteed or endorsed by the publisher.
Research integrity at Frontiers
Learn more about the work of our research integrity team to safeguard the quality of each article we publish.