 Anqi Li
 Zhenkai Zhang
 Zenglin Hong1,3,4*
 Lei Liu
 Tariq Ashraf
- 1School of Land Engineering, Chang’an University, Xi’an, China
- 2Shaanxi Satellite Application Center for Natural Resources, Shaanxi Institute of Geological Survey, Xi’an, China
- 3Satellite Remote Sensing Center, China-SCO Geoscience Research Center, Xi’an, China
- 4Shaanxi Urban Geology and Underground Space Engineering Technology Research Center, Xi’an, China
- 5National Engineering Laboratory for Integrated Aero-Space-Ground-Ocean Big Data, Application Technology, Shaanxi Provincial Key Laboratory of Speech Image Information Processing, School of Computer Science, Northwestern Polytechnical University, Xi’an, China
- 6School of Earth Science and Resources, Chang’an University, Xi’an, China
- 7The 41st Institute of the Fourth Academy of CASC, Xi’an, China
With a large population and rapid urbanization, there are still many challenges to optimize the ecological-agricultural-urban space. Here, taking Yulin City, situated on the Loess Plateau of China as a case in point, we explored the spatial suitability evaluation of ecological-agricultural-urban space. Building upon the Chinese government’s concept of “resource and environmental carrying capacity and territorial development suitability evaluation” (hereinafter referred to as “double evaluation”), this study applies machine learning to the planning of ecological-agricultural-urban space. It explores an intelligent evaluation method for land space patterns using multi-source data. Based on the random forest (RF) algorithm and geographic information system (GIS), resulting in evaluated spatial patterns for ecological-agricultural-urban in the Yulin area. The results showed the constructed random forest models achieved an accuracy of 93% for ecology, 90% for agriculture, and 92% for urban space in Yulin City on the test dataset. By means of suitability analysis, the results indicated that the extremely important ecological space were predominantly located in the southwestern and eastern regions of the study area, while suitable space for agricultural production were primarily scattered throughout the southeast. In contrast, suitable space for urban construction were concentrated mainly in the central part of the study area. The use of machine learning has proven to be effective in addressing multicollinearity among spatial evaluation factors across three different areas. By eliminating human subjectivity in weight assignment during evaluation, it introduces fresh perspectives for land space planning and status assessment. These findings may offer support for the scientific delineation of ecological-agricultural-urban space (three districts and three lines) in China.
1 Introduction
Territorial space encompasses the geographical area that falls under the jurisdiction and sovereignty of a nation, comprising land, inland waters, territorial sea, and airspace. It serves as the crucial environment for the nation’s existence and survival. Rational development and efficient land space utilization is the primary objective in each country’s spatial strategy and policy. Achieving the optimization of various types of territorial space holds significant practical importance for developing countries (Wu et al., 2021a). The structural optimization of land space has emerged as a pressing issue in the domains of geography and resource science (Wang et al., 2022a). The “double evaluation” proposed by the Chinese government in 2019 addresses various aspects of territorial planning, including urban planning (Foley et al., 2005; Verburg et al., 2009; Li et al., 2021), rural planning (Ou et al., 2021), and land planning (Gao et al., 2010; Reidsma et al., 2011; Yu et al., 2022), as well as the dynamic evolution characteristics of these plans (Reidsma et al., 2011; LIU et al., 2017). Within the context of “double evaluation,” the “land space suitability evaluation” aims to establish the pattern distribution of ecological-agricultural-urban space (Wang et al., 2019).
In China, researchers have investigated the optimization of regional patterns based on suitability evaluation utilizing the ecological-agricultural-urban space, providing practical evaluation concepts for the scientific arrangement of ecological space, agricultural space, and urban space (Zhou et al., 2017; Dan, 2019; Huang, 2019; LI et al., 2020). Previous studies in this area have utilized traditional mathematical models and comprehensive overlay analysis methods (Xia and Zhai, 2022). For instance, ZHANG et al. (2018) developed a multi-objective programming model to optimize territorial space in Yantai City, China. Li et al. (2021) employed the entropy weight method to evaluate land use suitability in southwestern China’s ecological-agricultural-urban space of the karst region. Zhang et al. (2022) used geodetectors to analyze the driving mechanism behind the spatial change of ecological-agricultural-urban space. While these studies have made significant progress in the spatial zoning of ecological-agricultural-urban space, some issues remain. One concern is the subjective nature of setting evaluation factor weights, which heavily relies on artificial assignment and the expertise of individuals, leading to potential biases in the evaluation results (Lin et al., 2022; Wei et al., 2022; Xiao et al., 2022; Wang et al., 2023). Moreover, there are similarities in the spatial evaluation indicators of land space suitability evaluation, resulting in problems such as the intersection of evaluation elements and unclear logical relationships (Hao et al., 2019). For example, disaster indicators simultaneously evaluate agricultural and urban space and water and soil resource conditions are considered in both assessments (Tao et al., 2022). Howerer, the focus may differ among different studies. Addressing these challenges will enhance the effectiveness and objectivity of land space suitability evaluation. Land planning research commonly employs various methods, including qualitative analysis (Gao et al., 2010), linear model method (Reidsma et al., 2011; Das et al., 2015), and mathematical formula calculation method (Wei et al., 2022). Additionally, the CA-Markov model (Stewart and Janssen, 2014; Islam et al., 2018; Chaturvedi and de Vries, 2021), similarity weight (Abdullahi and Pradhan, 2018), logistic regression method (Mozumder et al., 2016), FLUS model (Wang et al., 2022a), geodetector (Ou et al., 2022), and geoscience information map (Wang et al., 2022b) have been utilized in land planning research. With the rapid development of artificial intelligence in recent years, machine learning has emerged as a prominent research tool in land planning (Sankarrao et al., 2021; Dong et al., 2022). Commonly used machine learning algorithms in land planning include random forest (RF) (Roy, 2021), support vector machine (SVM) (Marjanović et al., 2011), BP neural network (Hong et al., 2016; Aishwarya Devendran and Lakshmanan, 2017), gradient boosting decision tree (GBDT) (Xia and Zhai, 2022), Quadtree Algorithm (Xia et al., 2023), XGBoost (Huang et al., 2023) and various hybrid models (Gaur et al., 2020; Gharaibeh et al., 2020; Chaturvedi and de Vries, 2021). However, the application of machine learning in ecological-agricultural-urban space evaluation is still limited. Due to machine learning’s effectiveness in addressing multicollinearity among evaluation factors, this study introduces the RF algorithm to attempt to construct an evaluation method for ecological-agricultural-urban space.
In recent years, China is trying to scientifically delineate ecological space, agricultural space and urban space (three districts and three lines). Therefore, Yulin is located in a transitional zone between the Loess Plateau and the Mu Us Desert., possesses a delicate ecology and prominent contradictions among various land types, making it an ideal candidate for ecological-agricultural-urban space research. This study adopts the selection criteria of evaluation factors used in “land spatial suitability evaluation,” constructs data sets, performs algorithm modeling, and leverages GIS technology to represent the evaluation results spatially. The objectives of this study are as follows (Wu et al., 2021a): Apply machine learning to the three-districts division and attempt to resolve the issue of repetition in land space suitability evaluation indices (Wang et al., 2022a). Analyze the spatial distribution of ecological-agricultural-urban in Yulin City and explore an evaluation method for the land spatial pattern in the region (Li et al., 2021). Utilize the research findings to promote the coordinated development of various areas in Yulin City and to provide valuable insights for land and space planning and management in other regions.
2 Materials and methods
2.1 Study area
Yulin City (Figure 1) is situated in the northernmost region of Shaanxi Province, China, at the intersection of Shaanxi, Gansu, Ningxia, Inner Mongolia, and Shanxi provinces. It serves as the confluence of the Loess Plateau and the Mu Us Desert, functioning as a transitional zone between the Loess Plateau and the Inner Mongolia Plateau. Designated as a national historical and cultural city, Yulin also holds the status of a national ecological protection and construction demonstration city. The topography of Yulin City slopes from the west to the east, primarily bounded by the Great Wall. Its northern part constitutes the sandy grassland area on the southern edge of the Mu Us Desert, while the southern part lies in the heartland of the Loess Plateau. Yulin encompasses one city, 2 districts, and 9 counties, with a registered population of 3.8599 million. The area stretches 385 km from east to west and 263 km from north to south, with a total land area of 42,920.2 square kilometers. Yulin is a national energy base located in a desert region where abundant mineral resources and ecological fragility coexist, creating contrasts between different land types. Challenges include imbalances in industrial structure, regional development between the north and south, urban and rural development, known as the “three imbalances.”
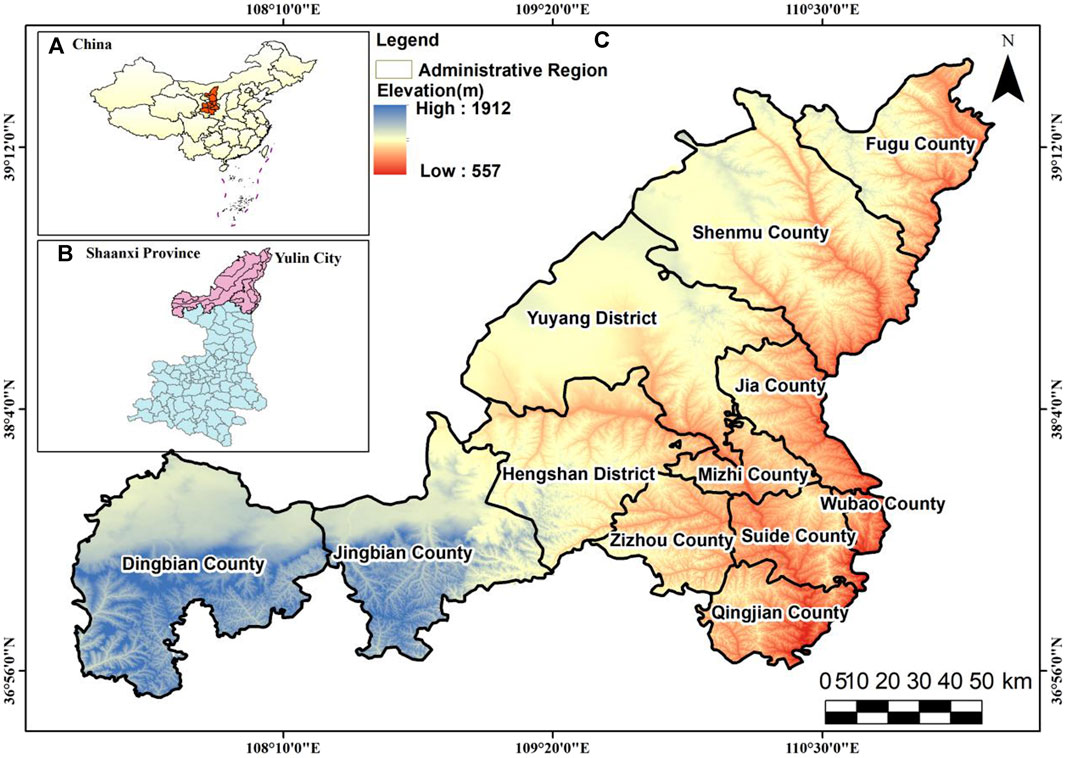
FIGURE 1. Location of Study area. (A) Administrative map of China (B) Administrative map of Shaanxi Province (C) Administrative map of Yulin City.
2.2 Research data
The data involved in this study mainly include basic geography (as depicted in Figures 2A–C), land resources (as illustrated in Figures 2D–F, I, S), natural resources (as shown in Figures 2H, K, L, T), location conditions (as depicted in Figures 2G, J), and social economy (as represented in Figures 2M–R). The sources of data are detailed in Table 1. Specifically, the land use data used in this study were obtained from the Resource and Environmental Science Data Center of the Chinese Academy of Sciences, with the land use types reclassified as cultivated land, forest land, grassland, water area, construction land, and unused land. Additionally, the data related to urban built-up areas, high-incidence areas of geological disasters, ecological protection red lines, natural protection areas, permanent bare farmland, and drinking water sources were derived from official records of Yulin City. The night lighting data used in this study is sourced from the paper data set by Wu et al. (2021b). The population data is obtained from the WorldPop database and is adjusted based on the population data from The 2020 Statistical Yearbook of Yulin City, following the correction method described in Liu and Hu (Liu and Hu, 2022). The terrain data is derived from the Geographic Data Space Cloud. The location condition data is sourced from the Open Street Map map, including vector data of railways, national, provincial, and county highways. Euclidean distance analysis is employed to generate distance distribution data from various types of roads. The precipitation data is obtained from the monitoring data of 1710 meteorological stations in Shaanxi Province in 2020, and the spatial distribution data of annual rainfall is formed using Kriging interpolation. Soil erosion and soil texture data are acquired from the Resource and Environmental Science Data Center of the Chinese Academy of Sciences (http://www.resdc.cn/). The socio-economic data in this paper expands the index system by incorporating multiple data sources and obtaining Points of Interest (POI) from the Tencent map development platform. Spatial data characterizing economic and social development are generated using point density analysis. To obtain Net Primary Productivity (NPP) data for the study area, image mosaicking, projection, and resampling were applied to MOD17A3HGF Version6.0 products. The spatial distribution data set of China’s Normalized Difference Vegetation Index (NDVI) is obtained from the Resource and Environmental Science Data Registration and Publishing System. All data in this study are based on the year 2020, and the coordinate system is unified into the CGCS2000 projection coordinate in ArcGIS10.8. The spatial scale of the evaluation unit is 30 m × 30 m.
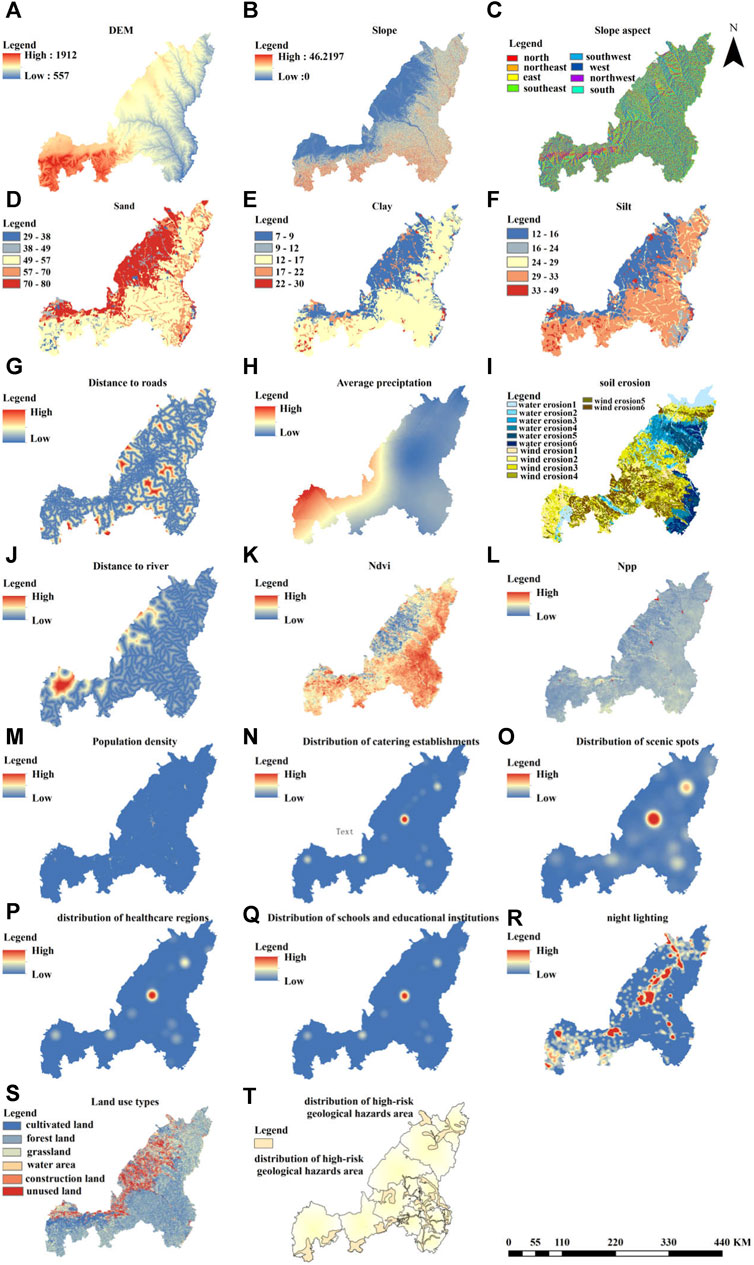
FIGURE 2. The experimental data samples in the study area. (A) DEM (B) Slope (C) Slope aspect (D) Sand (E) Clay (F) Silt (G) Distance to roads (H) Average preciptation (I) Soil erosion (J) Distance to river (K) Ndvi (L) Npp (M) Population density (N) Distribution of eatering establishments (O) Distribution of scenic spots (P) Distribution of healthcare regions (Q) Distribution of schools and educational institutions (R) Night lighting (S) Land use types (T) Distribution of high-riskgeological hazards area.
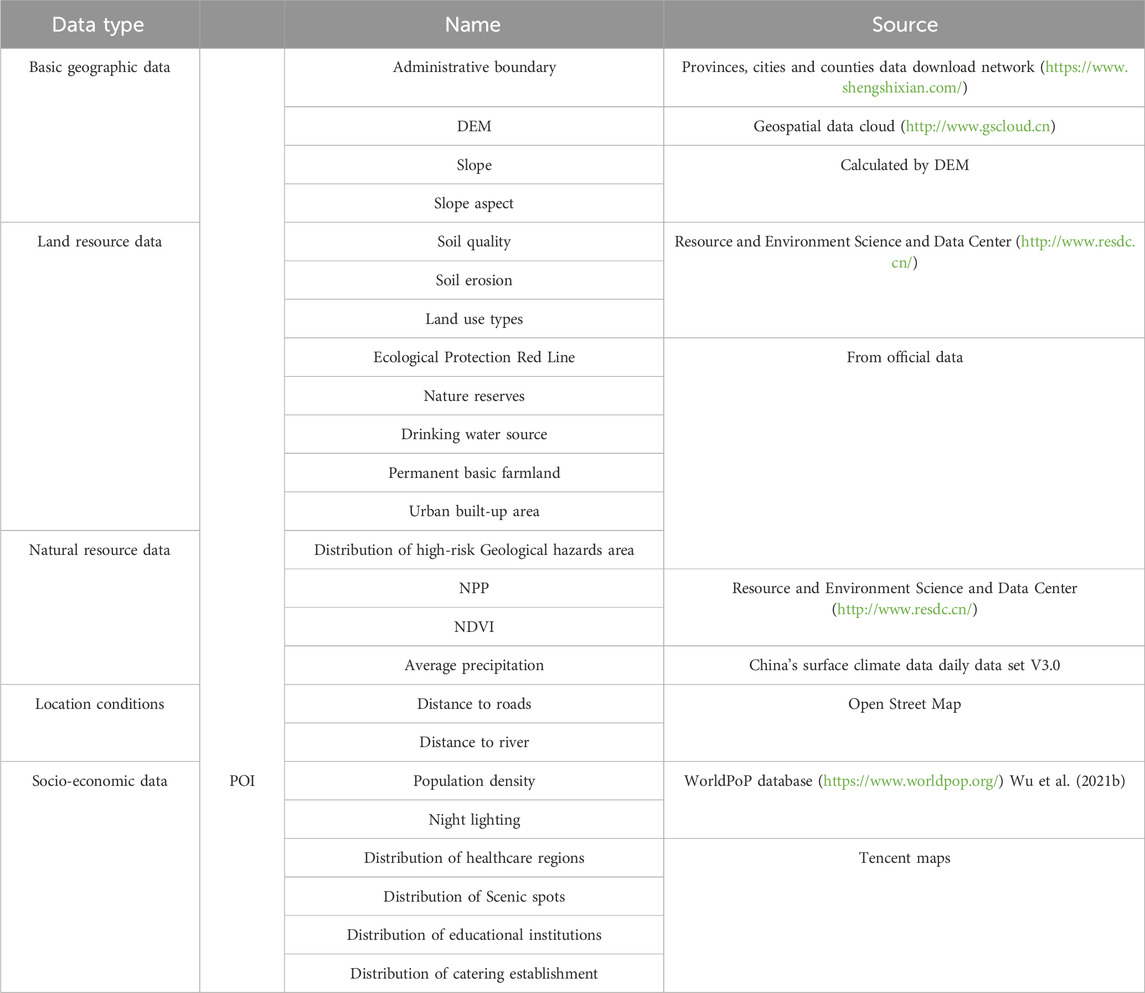
TABLE 1. Data source and description.
2.3 Research methods
2.3.1 The ecological-agricultural-urban spatial classification system
Based on the evaluation index system of land space suitability and considering the specific conditions of the study area, the evaluation index system is constructed to encompass three main aspects: ecological protection suitability, agricultural development suitability and urban development suitability.
Based on previous studies (Allam et al., 2015; Falasca et al., 2015; Bathrellos et al., 2017), the author has constructed the index system for each space, as shown in Table 2. Ecological space serves as the core carrier of the ecosystem and plays a crucial role in safeguarding ecological security and enhancing the regional living environment (Zheng et al., 2017). Numerous studies have assessed the significance of ecological protection based on ecosystem service functions and ecological vulnerability. The evaluation of regional ecological function mainly involves water conservation, biodiversity preservation, soil and water conservation, windbreak and sand fixation, and coastal ecological stability. On the other hand, the vulnerability of the regional ecological environment is assessed by factors such as soil erosion, land desertification, rocky desertification, and salinization. The combination of these two aspects helps to identify ecologically important areas. Considering the specific ecological conditions in Yulin City, this study selects certain evaluation factors to assess the importance of soil and water conservation and soil erosion sensitivity. These factors include soil erosion, soil texture, topography, rainfall, distance from water systems, vegetation net primary productivity, and vegetation coverage as the evaluation factors for ecological space.
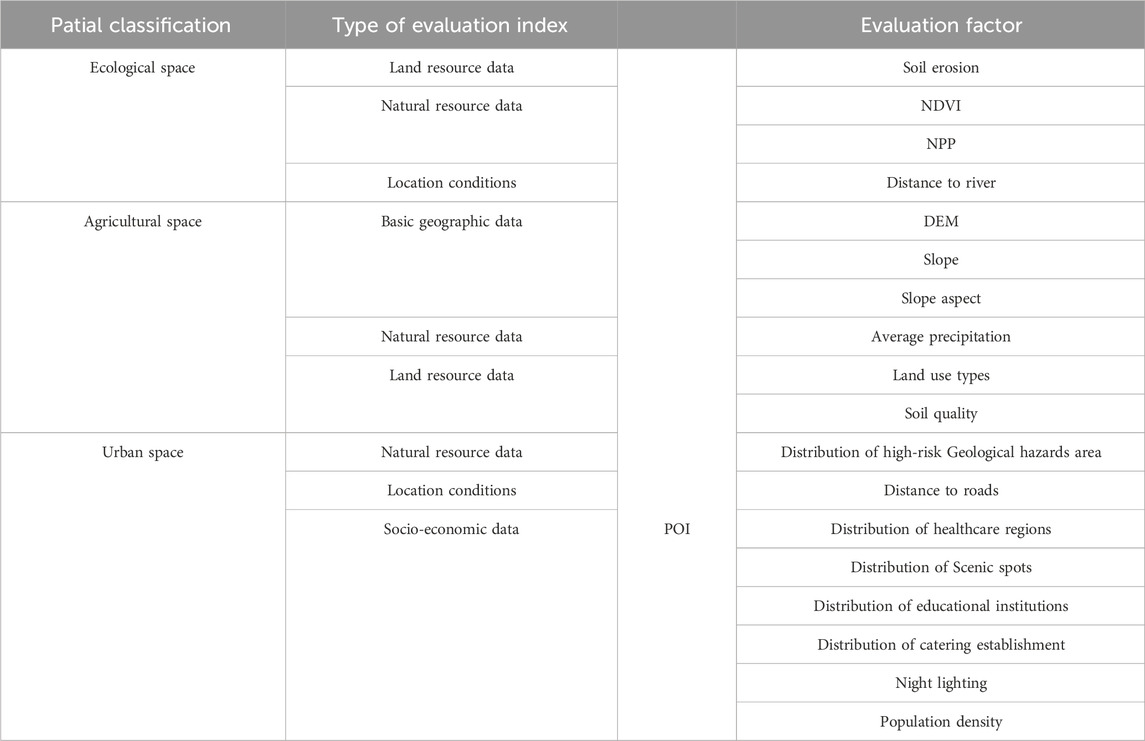
TABLE 2. The ecological-agricultural-urban space classification system.
Agricultural space is vital for agricultural production, farmers’ livelihoods, and rural ecology. It plays a crucial role in supporting and ensuring the implementation of food security strategies. The planning of agricultural space aims to achieve a compact and well-structured agricultural layout, providing accessible agricultural services (Zheng et al., 2017). Spatial planning, driven by the goal of food security, focuses on optimizing the regional agricultural pattern based on factors like cultivated land quality grade, soil environmental quality, soil beneficial elements, and geological conditions. Therefore, this study selects evaluation indices for agricultural space from four key aspects: land resources, water resources, climatic conditions, and environmental conditions. These indices include soil texture, rainfall, land use status, and distance from roads.
Urban space primarily serves as a hub for human production activities and residential areas. It encompasses building areas, under-construction areas, and a certain range of reserved space. Urban space constitutes the main concentration of regional economic and social resources. The quality of its use depends on the efficiency of space utilization, the availability of public service facilities, and the quality of the living environment. Considering the boundary and scale constraints of urban development, along with terrain, slope, geological disaster risks, and transportation location conditions, this study establishes the bottom-line constraints for land space development, which serves as a spatial foundation for rational urban and town planning. Consequently, the evaluation indicators for urban space suitability are chosen, emphasizing factors that significantly impact urban construction, including high-incidence areas of geological disasters, night lighting, distance from roads, population density, and various types of POI data, such as healthcare facilities, tourist attractions, educational institutions, and cultural venues. These indicators are crucial for characterizing urban spatial suitability.
2.3.2 Construction of the evaluation model of ecological-agricultural-urban space based on machine learning
The study area is divided into 47,683,386 evaluation units based on a 30 m × 30 m grid, as illustrated in Figure 3.
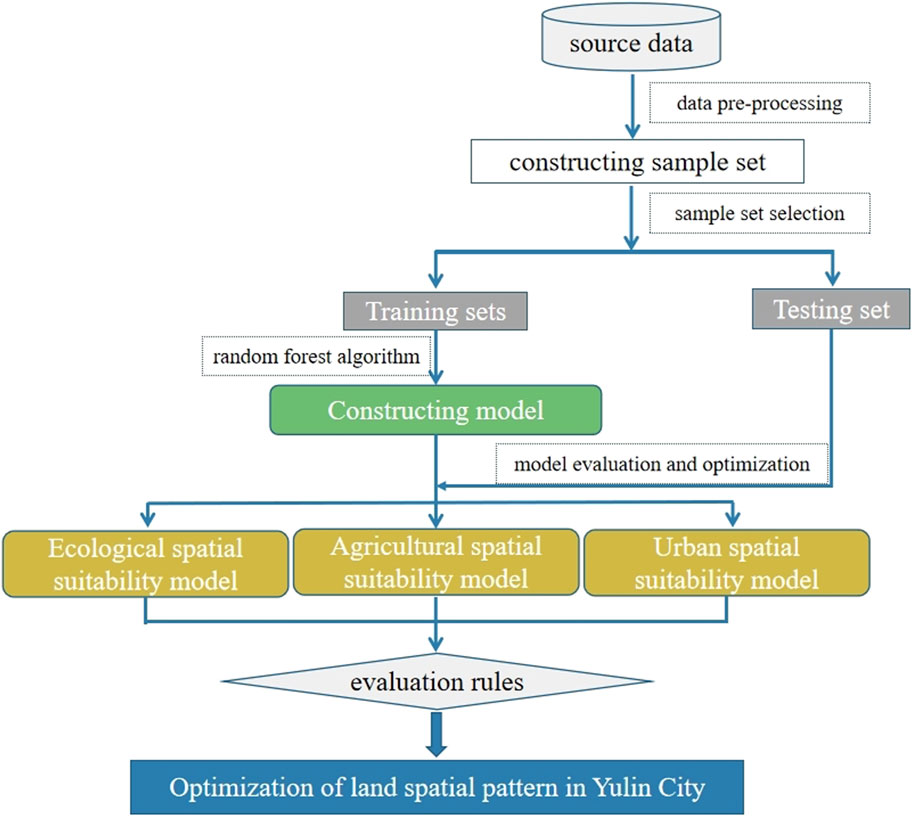
FIGURE 3. Technical flowchart of research.
Step 1. Construction of sample data sets. Supervised learning in machine learning is employed for modeling, necessitating the creation of positive and negative sample sets. For the ecological space suitability evaluation model, positive samples are derived from areas identified as ecological and important, such as the ecological protection red line, natural protection area, and drinking water source area, as designated by expert organizations under the Chinese government. Conversely, the urban built-up area, which is challenging to convert into ecological land, serves as negative samples for this evaluation. The positive sample count is 9,487,517, and the negative sample count is 8,566,318. For the agricultural spatial suitability evaluation model, permanent basic farmland is selected as positive samples, while the urban built-up area is used as negative samples. The positive sample count is 8,845,275, and the negative sample count is 9,208,560. Regarding the urban spatial suitability evaluation model, the built-up area serves as positive samples, while the negative samples include the ecological protection red line, natural protection area, drinking water source area, and permanent basic farmland. The positive sample count is 121,013, and the negative sample count is 242,026. Through the above steps, a comprehensive sample data set for evaluating the spatial suitability of the three types of areas is successfully constructed.
Step 2. Machine learning algorithm modeling. The sample set is divided into a training set and a test set in a 7:3 ratio. The random forest algorithm is applied to construct models on the training set, with subsequent evaluation using the test set. Fine-tuning of hyperparameters is performed to enhance the model’s performance and generalization ability. Ultimately, separate ecological space suitability evaluation, agricultural space suitability evaluation, and urban suitability evaluation models are established.
Step 3. The constructed models are utilized for evaluation. Using the trained models, the evaluation units across the entire region are individually assessed, and the results are presented in a probability form ranging from 0 to 1. Here, a value of 1 indicates the most suitable evaluation unit, while a value of 0 represents the least suitable. The probability results are then categorized using the natural breaks (jenks) method, This method applies a clustering approach, dividing data into different groups in a way that maximizes the similarity within each group while maximizing the dissimilarity between different groups. The significance of its application lies in the fact that there are natural (non-artificially set) turning points or breakpoints in any sequence of numbers. These natural turning points have statistical significance (JC et al., 2013; Liu et al., 2023). Therefore, by utilizing the statistical significance of these turning points, the corresponding numerical values can serve as reference values for suitability levels. For ecological suitability evaluation, divisions are made into extremely important, important, and generally important categories. For agricultural suitability evaluation, the divisions are suitable, moderately suitable, and unsuitable. Lastly, for urban suitability evaluation, the categories are suitable, moderately suitable, and unsuitable.
Step 4. spatial representation of the evaluation results. Utilizing the calculations from the three models, each evaluation unit will obtain suitability evaluation results for ecological space, agricultural space, and urban space, respectively. In accordance with the requirements of land space suitability evaluation, ecological space is considered more important than agricultural space, and agricultural space is given higher importance than urban space. In the actual application of land space, it is necessary to reserve some flexible areas for construction beyond the planned scope. In these areas, the original state is maintained until utilization, and development can be carried out based on demand during the development process. Flexible space ensures the orderly expansion of construction land in the region, avoiding the squeezing of agricultural and ecological spaces simultaneously, and meeting the needs of regional development. Consequently, the following evaluation rules are established: extremely important ecological space > important ecological space > suitable agricultural space > moderately suitable agricultural space > suitable urban space > moderately suitable urban space. If an evaluation unit is classified as moderately important ecological space, unsuitable agricultural space, and unsuitable urban space, it is designated as a flexible area, as illustrated in Figure 4. Following the outlined evaluation rules, the GIS method is employed to express the evaluation results of each evaluation unit spatially, resulting in the formation of a spatial suitability grade distribution map for ecological-agricultural-urban space. This map displays the distribution of suitability grades for ecological, agricultural, and urban spaces across the study area.
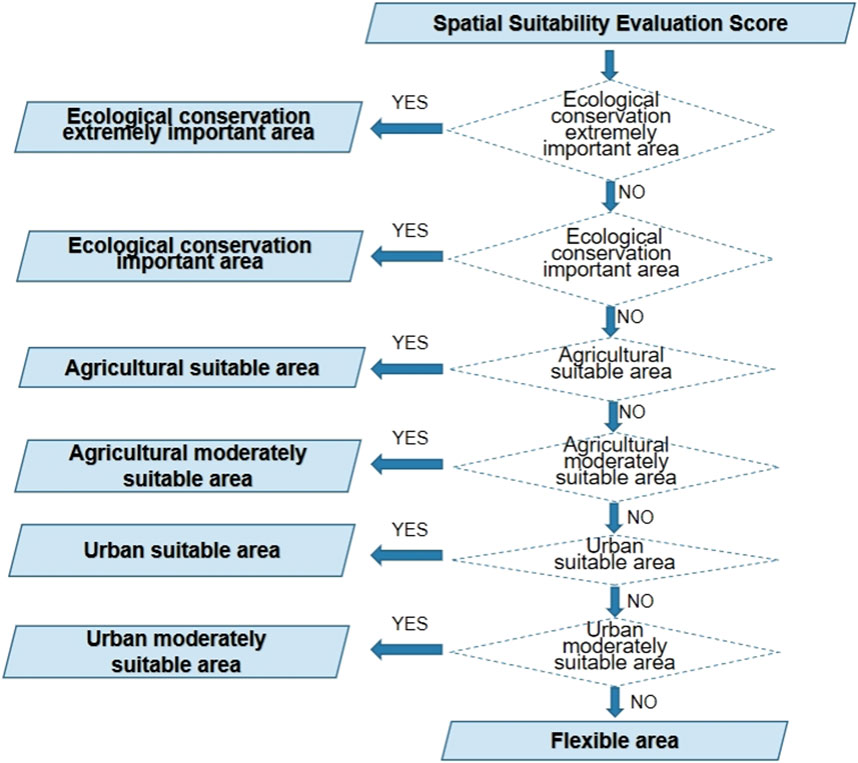
FIGURE 4. Evaluation rules.
2.3.3 Random forest model
The random forest model was introduced by Breiman (Breiman, 2001) and is a machine learning algorithm based on classification trees. The random forest has unique characteristics such as easy implementation, strong interpretability, and effectively addressing collinearity and overfitting issues commonly encountered in other machine learning algorithms. Additionally, the random forest can evaluate the importance of variables and possesses a robust prediction capability. The random forest algorithm obtains the final result by constructing and combining multiple decision trees, as illustrated in the Figure 5. These decision trees are not required to have high classification accuracy. Ultimately, the decisions of all decision trees are determined through voting, akin to a group of experts convening and voting after a discussion. The process of the random forest algorithm begins by randomly selecting n samples with replacement from the original training set to construct the first decision tree using the bootstrap sampling method. This process continues until a decision tree can no longer be split, indicating its completion. The above steps are repeated M times to create M decision trees, forming a random forest. In this study, the hyperparameters of the three random forest models were set to 50, and the calculation formula for the model is as Eq. 1:
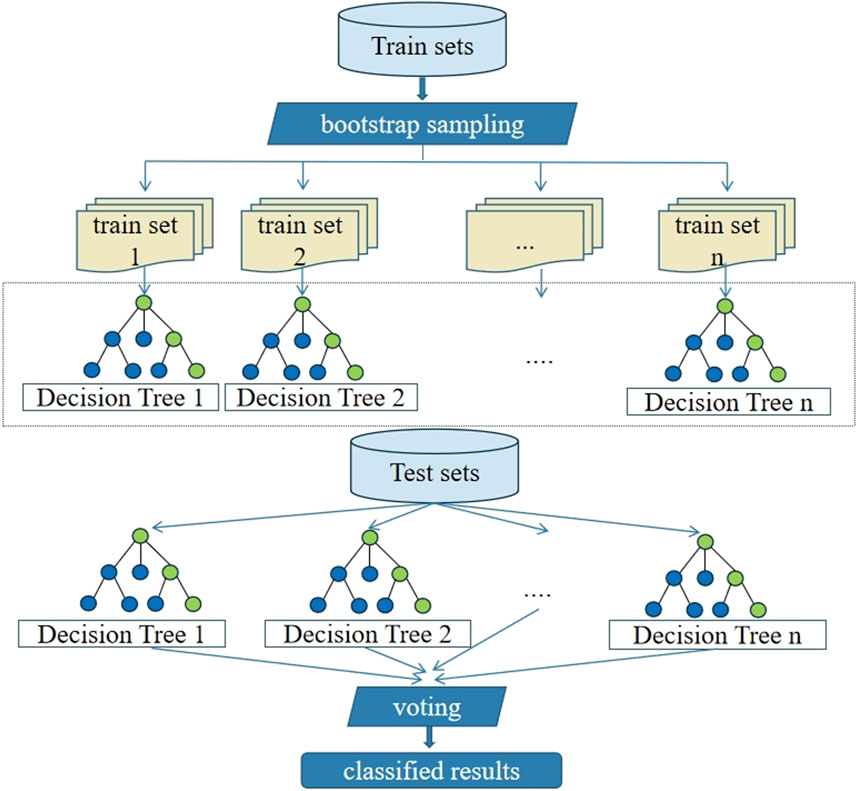
FIGURE 5. Random forest model diagram.
Where
2.3.4 Classification accuracy verification
The “ecological-agricultural-urban” spatial evaluation model is examined in this study to determine its quality and application utilizing a variety of accuracy evaluation indices. Model evaluation is a crucial aspect of assessing the accuracy and credibility of the machine learning model. The evaluation methods employed in this study include classification indicators based on the confusion matrix, as well as the Receiver Operating Characteristic (ROC) curve and Area Under the Curve (AUC). These metrics provide quantitative assessments of the model’s accuracy and performance.
(1) Confusion matrix
The confusion matrix is utilized to evaluate the model’s performance in classifying positive and negative samples, providing insights into its predictive ability (Sun et al., 2019). Table 3 presents the confusion matrix, where Ture Negatives (TN) represents the number of negative samples correctly predicted as negative, False Positives (FP) indicates the number of negative samples incorrectly predicted as positive, False Negatives (FN) denotes the number of positive samples incorrectly predicted as negative, and True Positives (TP) represents the number of positive samples correctly predicted as positive.
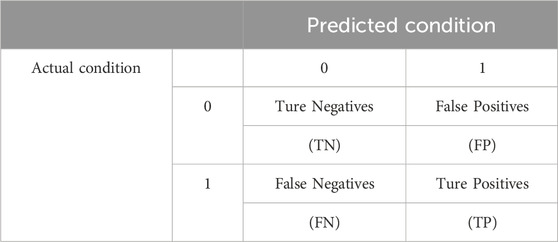
TABLE 3. Confusion matrix.
Based on the confusion matrix, several indicators can be calculated to characterize the model’s classification performance. This study utilizes the following indicators: Precision, Recall, and F1, with the corresponding calculation expressions (as in Eqs 2–4):
(2) ROC curve and AUC
The ROC curve is a method proposed by Spackman to evaluate the performance of binary classification prediction models obtained by different machine learning algorithms (Fawcett, 2006). The ROC curve has the False Positive Rate (FPR) on the horizontal axis, representing the proportion of incorrectly predicted negative samples to all negative samples. The True Positive Rate (TPR) is on the vertical axis, representing the proportion of correctly predicted positive samples to all positive samples. The corresponding calculation expressions are shown in Eqs 5, 6. A ROC curve closer to the upper left corner indicates a larger area under the curve and better performance of the model (Chen and Wu, 2017; Keykhay-Hosseinpoor et al., 2020).
3 Results
3.1 Modeling results
In this study, the sample set was randomly divided into a training set and a test set, with 70% of the data used as the training set and 30% as the test set. The machine learning modeling was conducted using the Python programming language, with data preprocessing performed using the Pandas library, and the Scikit-learn library was utilized to call the machine learning algorithm. The Random Forest (RF) algorithm was chosen for modeling, and the hyper-parameter n_estimators of the three models was set to 50, which means that each algorithm generated 50 decision trees by default. After training the models with the training set, the evaluation models were tested on the test set to obtain the confusion matrix (Table 4) and ROC curve (Figure 6). Table 4 shows the accuracy of the ecological, agricultural, and urban space models, which are 93%, 90%, and 92%, respectively. The ecological model achieved the highest accuracy among the three. The recall rate measures the model’s ability to identify positive samples correctly, and all three models demonstrated high recall rates, with the urban space model achieving an impressive 99% recall rate. The F1 score, which comprehensively considers precision and recall, indicated good overall performance for the three models, as shown in the figure below.
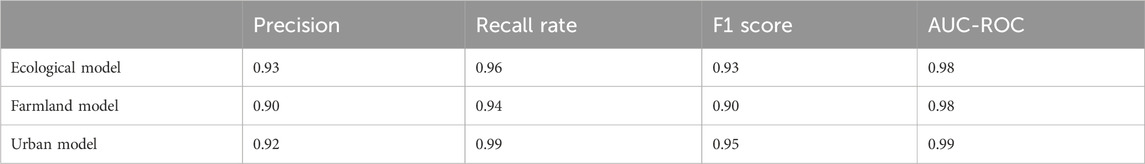
TABLE 4. Performance comparison graph of models.
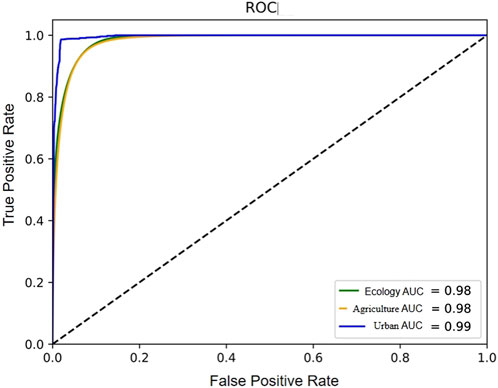
FIGURE 6. ROC curve graph for “ecology-agriculture-urban” spatial Random Forest model.
The AUC is a crucial evaluation metric used to assess the performance of the ROC curve. It ranges from 0 to 1, and the closer the value is to 1, the better the model’s performance and generalization ability. In this study, the AUC values of the three Random Forest (RF) models were found to be 0.98, 0.98, and 0.99, respectively. These high AUC values indicated that the models had strong generalization ability and can could be effectively used for prediction and evaluation.
As the model’s performance indicators were already close to the optimal state (value of 1), no further optimization of the model hyperparameters was required. Based on a comprehensive analysis of the above model performance evaluation indicators, the Random Forest algorithm was selected as this study’s ecological-agricultural-urban spatial evaluation model.
3.2 The suitability analysis of ecological-agricultural-urban space
3.2.1 Evaluation of the importance of ecological space
In Yulin City, the extremely important area of ecological protection covers 10,647.48 square kilometers, which accounts for 24.77% of the total land area. This area is mainly situated in the loess hilly-gully regions of Yulin, Dingbian County, the southern part of Jingbian County, and the eastern part of Shenmu (Figure 7). It includes significant nature reserves, wetlands, and water sources, as well as other vital natural protection areas in the city. Additionally, there are 23,578.33 square kilometers of important areas for ecological protection, making up 54.85% of the total land area in the entire region. These areas are primarily distributed in regions other than the extremely important ecological protection areas, such as the loess gully region, and areas sensitive to land desertification and soil erosion, including Jiaxian, Hengshan, Mizhi, and Zizhou. Furthermore, there are 8,760.95 square kilometers of generally important areas for ecological protection, accounting for 20.38% of the total land area in the entire region. These areas are moderately distributed in the northern part of Yulin City, where it meets the Mu Us Desert, as well as in the urban areas of various districts and counties and surrounding townships.
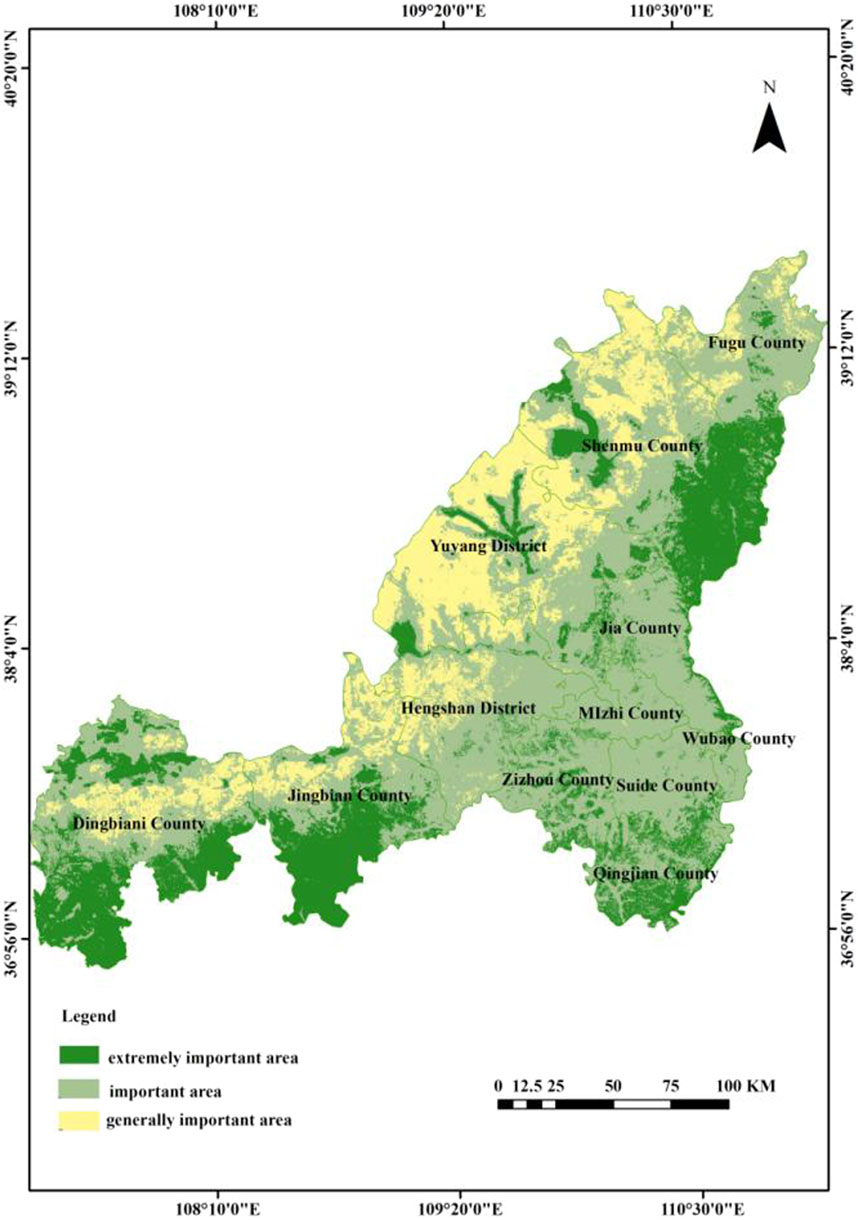
FIGURE 7. Distribution of ecological importance level.
3.2.2 Suitability evaluation of agricultural space
The suitable area for agricultural production in Yulin City covers 617.32 square kilometers, which accounts for only 1.44% of the total area in the region, indicating a relatively low proportion. These suitable areas are scattered in the northern region of the Great Wall, including Yuyang, Hengshan, Fugu, Dingbian, and Jingbian. These areas have flat terrain, good soil texture, and favorable farming conditions (Figure 8). Most of the cultivated land in Yulin City is located in the moderately suitable area, covering an area of 16,347.83 square kilometers, accounting for 38.03% of the total area in the region. These areas are primarily scattered in the southeastern part of Yulin City. On the other hand, there are 15,974.13 square kilometers of unsuitable areas for agricultural production, making up 35.76% of the total area in the region.
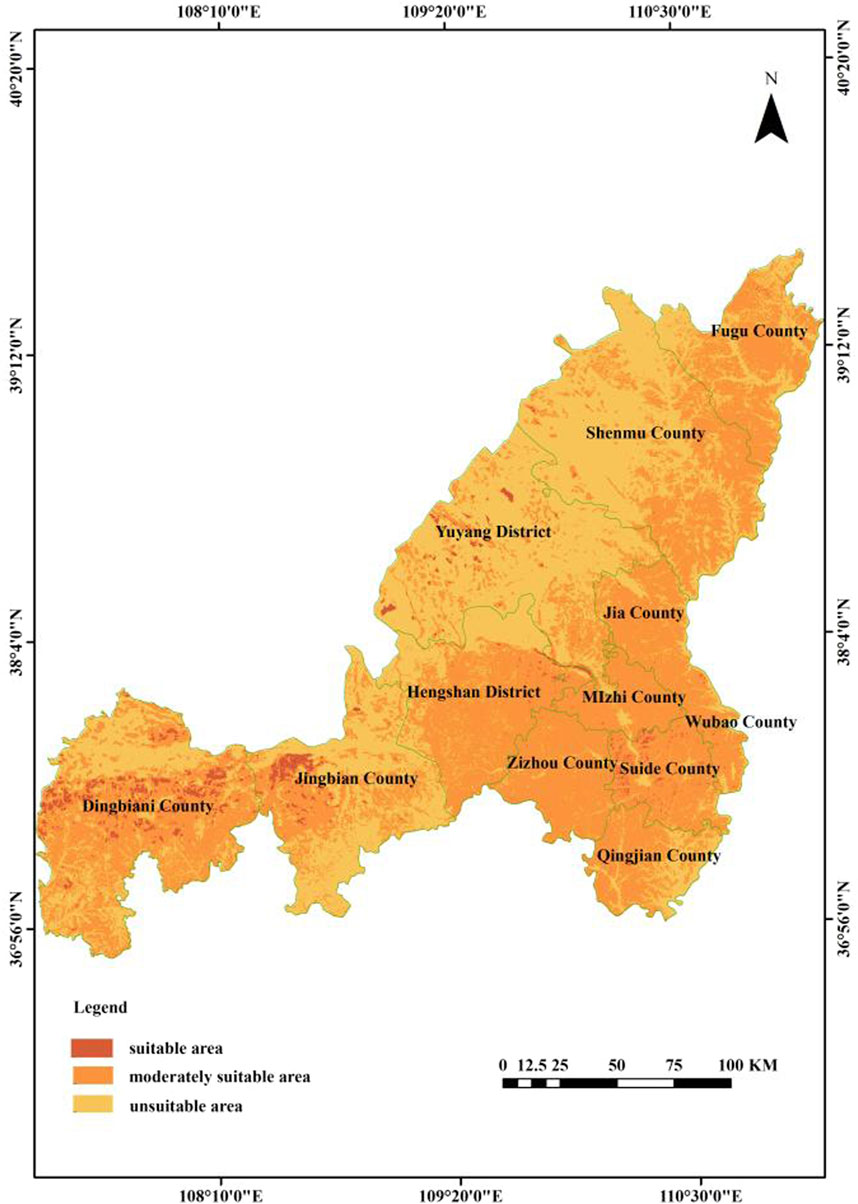
FIGURE 8. Agricultural suitability grade distribution map.
3.2.3 Suitability evaluation of urban space
The suitable area for urban construction in Yulin City covers 11,991.80 square kilometers, accounting for 27.9% of the total area in the region. These areas are mainly concentrated in the central part of Yulin City (see Figure 9). There is also a moderately suitable area for urban construction, which spans 15,994.31 square kilometers, making up 37.21% of the total area in the region. These areas are primarily distributed in districts and counties such as Yuyang, Hengshan, Shenmu, Fugu, Jingbian, and Dingbian. However, certain regions located in the loess gully area, characterized by steep slopes, significant topographic relief, and concentrated sandy land, are considered unsuitable for urban construction. These unsuitable areas span 3,735.84 square kilometers, representing 8.69% of the total area in the region.
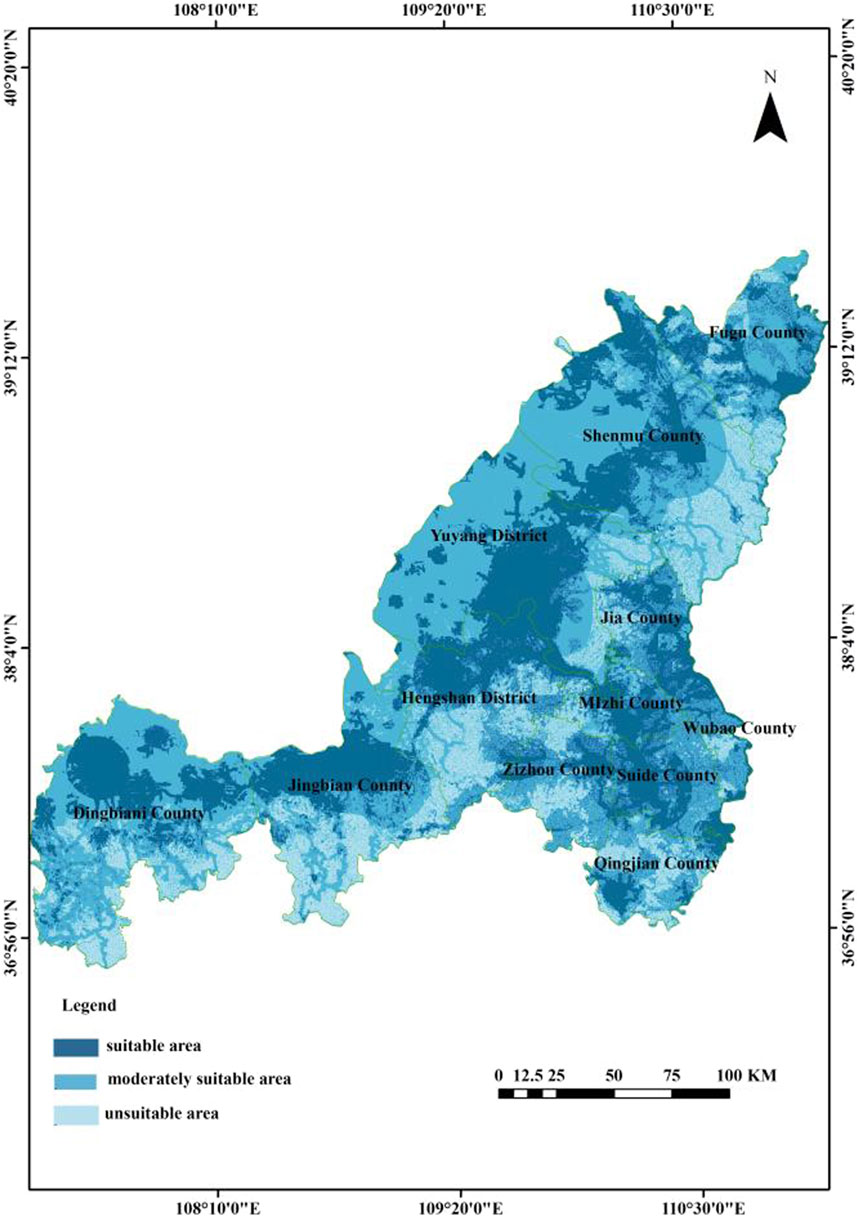
FIGURE 9. Urban suitability grade distribution map.
3.2.4 The overall evaluation results
Upon merging the three types of space, this study retains the optimal evaluation results for each space. Following the principle of “ecological space > agricultural space > urban space,” as proposed by the technical requirements of “double evaluation,” the evaluation results are divided into seven categories based on the suitability level of each district, as shown in Table 5. The ecologically important areas are mainly scattered in the central and eastern parts of the study area. Moderately suitable areas for agriculture are found in the western, southeastern, and northeastern parts of Yulin City. Most of the urban moderately suitable areas are concentrated in the northern region of Yulin City, with Hengshan and the northern part of Yuyang having the highest concentration. Because we established areas unsuitable for both urban and agricultural spaces as flexible areas in our evaluation rules, flexible areas are more densely distributed near the junction of Hengshan and Jingbian in this study. These areas consist predominantly of grasslands and undeveloped land, showing lower suitability for both urban construction and agricultural production spaces. Additionally, due to constraints imposed by the suitability of other regions, flexible areas sporadically scatter in the transition zones of the three spatial categories. These regions can serve as potential areas for development and utilization when different needs arise within the study area (Figure 10).
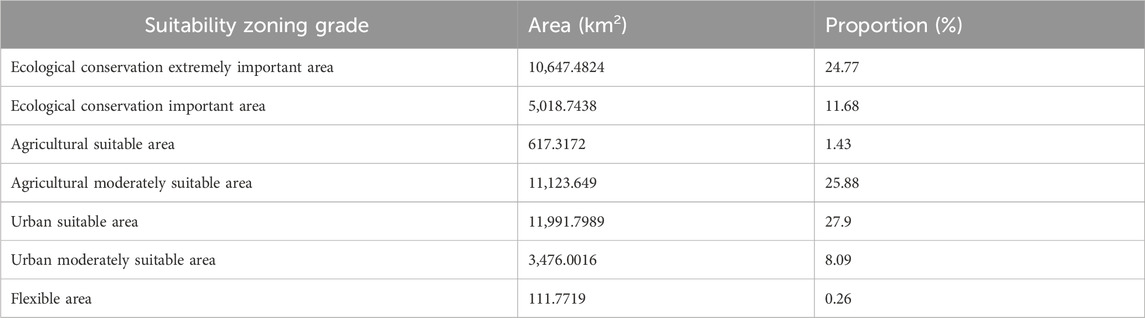
TABLE 5. The summary table of the overall evaluation results in Yulin City.
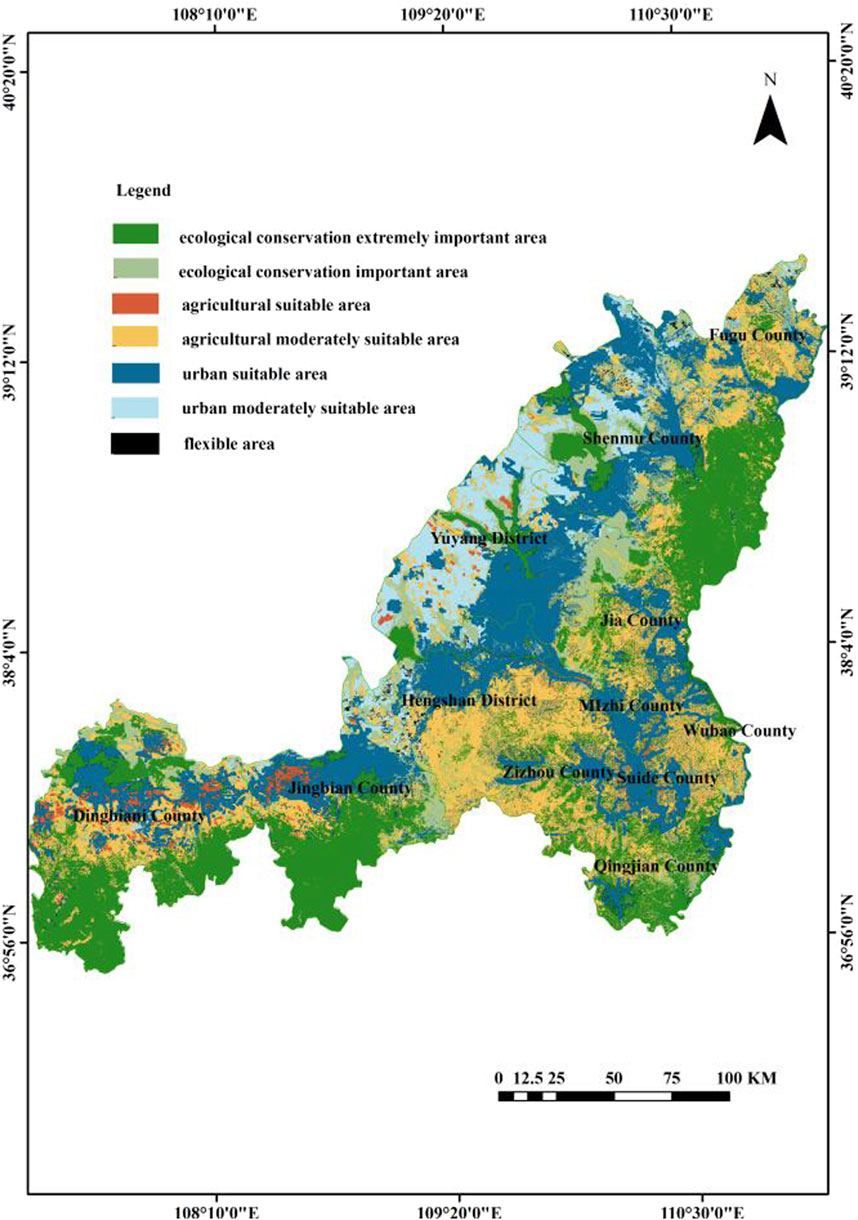
FIGURE 10. The summary map of the overall evaluation results in Yulin City.
3.3 Characteristics of the evaluation factors in the ecology-agriculture-urban model
Figure 11 shows that the ecological random forest model identifies rainfall as the most influential factor in the model, followed by terrain. This suggests a critical need to enhance the utilization of water resources and prioritize water conservancy safety. Enhancing water resource conservation and building better drainage and flood control infrastructure are crucial measures in advancing sustainable development in Yulin City. Implementing these strategies will aid in mitigating the difficulties presented by the scarcity of water resources and safeguard the ecological and human health of the municipality in the long run.
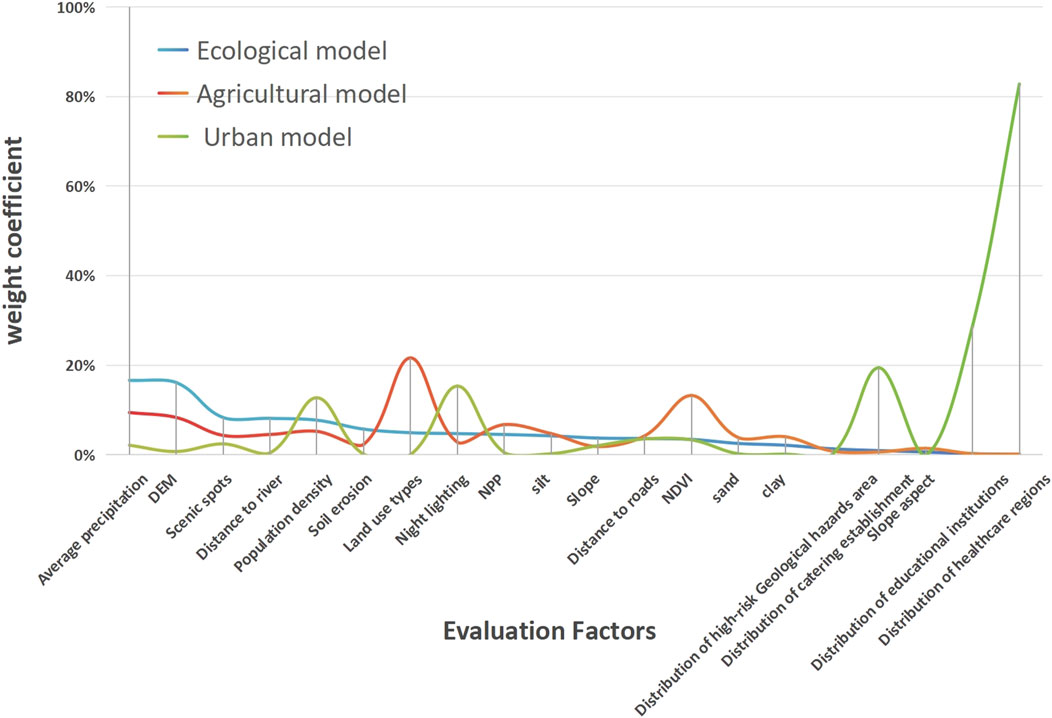
FIGURE 11. Contribution of ecology-agriculture-urban model evaluation factors.
The random forest agriculture model highlights the significant influence of land use status and vegetation coverage on the model. In most areas of Yulin City, forest land and unused land are dominant land use types, with cultivated land primarily concentrated in Jingbian and Dingbian areas. These regions boast flat terrain, good soil texture, and favorable farming conditions. It is critical to contemplate the need to adapt the agricultural structure in the northern part of the study area in line with economic development and regional characteristics. In the eastern region, where numerous ecological zones are present, special attention should be given to the construction of ecological agricultural areas. Overall, promoting sustainable agricultural practices and addressing the challenges posed by water resources and terrain will be crucial for enhancing the quality and productivity of agricultural land in Yulin City. Additionally, maintaining a balance between economic development and ecological conservation is essential for long-term regional prosperity and ecological stability.
The urban model reveals that social and economic factors, such as healthcare, science and education schools, and catering establishments, have the most significant impact on the model. The remarkable progress in Yulin City’s development and construction is evident, with the suitable area accounting for 27.9% of the total region, closely mirroring the distribution of nighttime light and population density. The main concentration of suitable areas is in Yuyang, Dingbian, Shenmu, Fugu, and other districts and counties. However, Yulin City also faces certain challenges and shortcomings in its development and construction. The city’s economic growth heavily relies on natural resources, leading to a monopolized industrial structure and increasing policy, security, and ecological environment constraints on industrial development. Furthermore, the existing industrial type in Yulin City exerts significant pressure on the ecological environment and water resources. To address these issues, it is recommended to bolster regional innovation cooperation and invest in scientific and technological innovation. Emphasizing the development of green industries and advocating for sustainable practices will contribute to the city’s economic diversification and environmental protection efforts.
4 Discussion
Within the framework of ecological civilization construction, scientific rationality and the efficient and effective utilization of land resources are fundamental prerequisites for land spatial planning. Land spatial development suitability assessment should be based on standards of ecological security, efficient resource utilization, and sustainability. Land spatial suitability assessment serves as a means to analyze the baseline conditions of land space. Scientific suitability assessment can provide strong support for guiding land spatial planning.
The current “double evaluation” policy proposes the possibility of targeted supplementation and improvement of the indicator system. With the application of big data technology, numerous scholars have focused on expanding the indicator system, particularly emphasizing the integration of Point of Interest (POI) data into suitability assessments. This enrichment of the social dimension of the indicator system enhances its regional specificity. In terms of indicator selection, our study, similar to the research of Lu (Lu, 2021), incorporates POI data into urban space indicators. Building upon this foundation, we present a more comprehensive suitability assessment indicator system, which additionally includes data such as nighttime light and population density. Similarly, Li and Guo (Li and Guo, 2023) assesses the suitability of campsite locations in Xinjiang using POI data. However, our study diverges by employing the RF algorithm to calculate indicator weights, replacing the combined method of subjective and objective evaluations used by others. Thus, drawing inspiration from the research paradigm of big data, our study further expands the indicator system for land spatial suitability assessment.
This study utilizes machine learning techniques to address spatial planning within the context of “ecological-agricultural-urban” settings. It aims to provide a data-driven approach to spatial planning research by investigating intelligent optimization strategies using a variety of data sources. In the realm of machine learning algorithms, Li et al. (2023) compared machine learning Random Forest (RF) and deep learning Deep Neural Network (DNN) models to assess the land quality of agricultural land in Guangdong Province, China. The research findings indicated that the RF method exhibits higher stability and achieves superior model accuracy across diverse test datasets. Similarly, Wang et al. (2021) focused on Xiangzhou City, Hubei Province, constructing a comprehensive assessment indicator system for arable land quality in the region. Three models-Entropy Weight (EW), Backpropagation Neural Network (BPNN), and Random Forest (RF)-were selected for training, with the study similarly demonstrating the superior performance of the RF model. RF method can effectively decompose indicators with nonlinear relationships to the evaluated object into linear relationships of leaves, determining the weights of indicators in the operational process, and providing higher interpretability of indicators, leading to more favorable evaluation results. This study, centered on the three-zone spatial assessment in the context of land spatial patterns, produces the final results of suitability assessment, forming different levels of suitability classifications. The principles underlying the decision trees in RF, akin to the classification process, share common ground with the study’s fundamental principles. Additionally, the RF model, requiring separate processing of data and samples, eliminates the need to calculate evaluation weights, reducing potential biases in suitability results resulting from the subjective allocation of indicators. This approach ensures the scientific rigor of the assessment. This offers new insights for optimizing land spatial patterns at the city and county levels, with clearly defined zoning evaluation factors and a scientific zoning approach.
However, due to data collection limitations, our study’s data acquisition is not comprehensive enough, especially regarding the inadequate collection of water resource data. Furthermore, the dynamic and temporal aspects of land use and cover are not incorporated into the spatiotemporal dimension. In the future, we intend to explore the incorporation of dynamic changes in land use into the optimization of land spatial patterns in land spatial planning research.
5 Conclusion
This research primarily focuses on enhancing the “double evaluation” factor composition system for land use planning. The study collects a diverse array of geoscience data and develops a comprehensive index system for evaluating the suitability of land based on its geographical characteristics, thus enhancing the existing assessment index system for ecological protection, agricultural suitability, and suitability for construction land. The ongoing discussion in Yulin City focuses on optimizing the regional spatial pattern, which has led to the separation of the territory into seven distinct areas: ecologically important area, important area, agricultural suitable area, general, suitable area, urban suitable area, urban general, suitable area, and elastic space. These areas account for 24.77%, 11.68%, 1.43%, 25.88%, 27.9%, 8.09%, and 0.26% of the total area, respectively. Notably, the central and northern parts of the study area offer favorable geographical and local conditions, making them most suitable for urban functional area development (i.e., urban suitable areas and urban general suitable areas). Meanwhile, the general suitable areas for agriculture are predominantly located in the southern part of the study area, with suitable areas for agriculture scattered in the western part. The study suggests adjusting the agricultural structure in the north based on economic development and regional characteristics. Additionally, in the eastern region with numerous ecological areas, particular attention should be given to constructing ecological agricultural areas. The connectivity of ecological space is notably high in the southeast, southwest, and northeast regions. Conversely, the flexible area is dispersed near the intersection of Hengshan and Jingbian, primarily consisting of grassland and unutilized land. The study’s findings contribute to a better understanding of land space planning and provide valuable insights for sustainable development and ecological protection in Yulin City. This study uses the RF algorithm for artificial intelligence evaluation. The accuracy of the constructed RF ecological, agricultural, and urban models on the test set reached 93%, 90%, and 92%, respectively. By adopting the machine learning model as a suitability evaluation method, this research effectively addresses issues related to cross-cutting evaluation elements and unclear logical relationships in “suitability evaluation.” The RF model is not constrained by the scale of data, exhibiting high accuracy in predictive tasks. It can also identify the contribution of variables to the outcome based on a limited sample size, achieving the classification process with small errors. This capability addresses complex and nonlinear evaluation problems. Simultaneously, through the analysis of the features of the ecological-agricultural-urban model evaluation factors, it was found that factors such as rainfall, land use, and healthcare have the most significant impact on the ecological, agricultural, and urban spaces in the study area, respectively. Combining these findings with regional development characteristics, relevant recommendations have been proposed. The scientific delimitation of ecological-agricultural-urban space in this research provides valuable support for optimizing the land spatial pattern and serves as a reference for land spatial planning and management in other regions. It holds significance for future land spatial planning and current situation assessments. The use of machine learning in this context demonstrates its potential to improve land planning processes, providing a more objective and efficient evaluation approach. The research findings do indeed contribute to advancing land spatial planning practices, fostering sustainable development, and promoting ecological civilization construction.
Data availability statement
The original contributions presented in the study are included in the article/Supplementary materials, further inquiries can be directed to the corresponding authors.
Author contributions
AL: Conceptualization, Writing–original draft, Writing–review and editing. ZZ: Conceptualization, Software, Writing–review and editing. ZH: Project administration, Writing–review and editing. LiL: Software, Writing–review and editing. LeL: Writing–review and editing. TA: Writing–review and editing. YL: Software, Writing–review and editing.
Funding
The author(s) declare that no financial support was received for the research, authorship, and/or publication of this article.
Conflict of interest
The authors declare that the research was conducted in the absence of any commercial or financial relationships that could be construed as a potential conflict of interest.
Publisher’s note
All claims expressed in this article are solely those of the authors and do not necessarily represent those of their affiliated organizations, or those of the publisher, the editors and the reviewers. Any product that may be evaluated in this article, or claim that may be made by its manufacturer, is not guaranteed or endorsed by the publisher.
References
Abdullahi, S., and Pradhan, B. (2018). Land use change modeling and the effect of compact city paradigms:integration of GIS-based cellular automata and weights-of-evidence techniques. Environ. Earth Sci. 77, 251. doi:10.1007/s12665-018-7429-z
Aishwarya Devendran, A., and Lakshmanan, G. (2017). Urban growth prediction using neural network coupled agents-based cellular automata model for sriperumbudur taluk, Tamil nadu, India. Egypt. J. Remote Sens. Space Sci. doi:10.1016/j.ejrs.2017.12.004
Allam, A., Fleifle, A., Tawfik, A., Yoshimura, C., and El-Saadi, A. (2015). A simulation-based suitability index of the quality and quantity of agricultural drainage water for reuse in irrigation. Sci. TOTAL Environ. 536, 79–90. doi:10.1016/j.scitotenv.2015.07.029
Bathrellos, G. D., Skilodimou, H. D., Chousianitis, K., Youssef, A. M., and Pradhan, B. (2017). Suitability estimation for urban development using multi-hazard assessment map. Sci. TOTAL Environ. 575, 119–134. doi:10.1016/j.scitotenv.2016.10.025
Chaturvedi, V., and de Vries, W. T. (2021). Machine learning algorithms for urban land use planning: a review. URBAN Sci. 5, 68. doi:10.3390/urbansci5030068
Chen, Y., and Wu, W. (2017). Mapping mineral prospectivity using an extreme learning machine regression. ORE Geol. Rev. 80, 200–213. doi:10.1016/j.oregeorev.2016.06.033
Dan, W. (2019). Land space optimization based on SuperLearner and cellular automata model: a case study of anhua county, hunan Province. China: China University of Geosciences.
Das, B., Singh, A., Panda, S. N., and Yasuda, H. (2015). Optimal land and water resources allocation policies for sustainable irrigated agriculture. LAND USE POLICY 42, 527–537. doi:10.1016/j.landusepol.2014.09.012
Dong, H., Huang, Q., Zhang, F., Lu, X., Zhang, Q., Cao, J., et al. (2022). Path of carbon emission reduction through land use pattern optimization under future scenario of multi-objective coordination. Front. Env. SCI-SWITZ. 10, 10. doi:10.3389/fenvs.2022.1065140
Falasca, S., Pitta-Alvarez, S., and Del, F. C. (2015). Salvadora persica agro-ecological suitability for oil production in Argentine dryland salinity. J. Article; Res. Support, Non-U.S. Gov't 538, 844–854. doi:10.1016/j.scitotenv.2015.08.082
Fawcett, T. (2006). An introduction to ROC analysis. PATTERN Recogn. Lett. 27, 861–874. doi:10.1016/j.patrec.2005.10.010
Foley, J. A., DeFries, R., Asner, G. P., Barford, C., Bonan, G., Carpenter, S. R., et al. (2005). Global consequences of land use. SCIENCE 309, 570–574. doi:10.1126/science.1111772
Gao, Q., Kang, M., Xu, H., Jiang, Y., and Yang, J. (2010). Optimization of land use structure and spatial pattern for the semi-arid loess hilly–gully region in China. CATENA 81, 196–202. doi:10.1016/j.catena.2010.03.002
Gaur, S., Mittal, A., Bandyopadhyay, A., Holman, I., and Singh, R. (2020). Spatio-temporal analysis of land use and land cover change: a systematic model inter-comparison driven by integrated modelling techniques. Int. J. REMOTE Sens. 23, 9229–9255. doi:10.1080/01431161.2020.1815890
Gharaibeh, A., Shaamala, A., Obeidat, R., and Al-Kofahi, S. (2020). Improving land-use change modeling by integrating ANN with Cellular Automata-Markov chain model. HELIYON 6, e05092. doi:10.1016/j.heliyon.2020.e05092
Hao, Q., Deng, L., and Feng, Z. M. (2019). Carrying capacity reconsidered in spatial planning: concepts, methods and applications. J. Nat. Resour. 34, 2073–2086. doi:10.31497/zrzyxb.20191005
Hong, H., Pradhan, B., Jebur, M. N., Bui, D. T., Xu, C., and Akgun, A. (2016). Spatial prediction of landslide hazard at the luxi area (China) using support vector machines. Environ. EARTH Sci., 71–75. doi:10.1007/s12665-015-4866-9
Huang, H. Y. (2019). A method research of urban expansion simulation model based on super learning algorithm: a case study of anhua county, hunan Province. China: China University of Geosciences.
Huang, Q., Tan, C., and Yang, B. (2023). Research on the evaluation method of ecotourism suitability in subtropical regions based on XG-boost algorithm. J. Geo-information Sci.
Islam, K., Rahman, M. F., and Jashimuddin, M. (2018). Modeling land use change using cellular automata and artificial neural network: the case of chunati wildlife sanctuary, Bangladesh. Ecol. Indic. 88, 439–453. doi:10.1016/j.ecolind.2018.01.047
Jc, A., Yang, S., Li, H., Zhang, B., and Lv, J. (2013). “RESEARCH ON GEOGRAPHICAL ENVIRONMENT UNIT DIVISION BASED ON THE METHOD OF NATURAL BREAKS (JENKS),” in ISPRS/IGU/ICA joint workshop on borderlands modelling and understanding for global sustainability (Beijing, China: Pub Place). Year Published.
Keykhay-Hosseinpoor, M., Kohsary, A., Hossein-Morshedy, A., and Porwal, A. (2020). A machine learning-based approach to exploration targeting of porphyry Cu-Au deposits in the Dehsalm district, eastern Iran. ORE Geol. Rev. 116, 103234. doi:10.1016/j.oregeorev.2019.103234
Li, C., and Guo, C. (2023). Location suitability evaluation and spatial optimization of self-driving camps in Xinjiang. SUSTAINABILITY-BASEL 15, 10820. doi:10.3390/su151410820
Li, L., Liu, L., Peng, Y., Su, Y., Hu, Y., and Zou, R. (2023). Integration of multimodal data for large-scale rapid agricultural land evaluation using machine learning and deep learning approaches. GEODERMA 439, 116696. doi:10.1016/j.geoderma.2023.116696
Li, S., Zhao, X., Pu, J., Miao, P., Wang, Q., and Tan, K. (2021). Optimize and control territorial spatial functional areas to improve the ecological stability and total environment in karst areas of Southwest China. LAND USE POLICY 100, 104940. doi:10.1016/j.landusepol.2020.104940
Li, X. R., Chen, F. Y., Lin, A. W., and Zou, Z. G. (2020). Driving mechanism of tea plantation expansion using a random forest regression model. J. Ecol. Rural Environ. 36, 44–52. doi:10.19741/j.issn.1673-4831.2019.0334
Lin, G., Jiang, D., Fu, J., and Zhao, Y. (2022). A review on the overall optimization of production–living–ecological space: theoretical basis and conceptual framework. LAND-BASEL 11, 345. doi:10.3390/land11030345
Liu, J. L., Liu, Y. S., and Li, Y. R. (2017). Classification evaluation and spatial-temporal analysis of "production-living-ecological" spaces in China. ACTA Geogr. SIN. 72, 1290–1304.
Liu, T., and Hu, W. P. (2022). Spatial pattern, aging suitability, and equality of medical and residential care facilities in Guangdong Province: an evaluation based on spatial accessibility. Trop. Geogr. 42, 1993–2006. doi:10.13284/j.cnki.rddl.003597
Liu, T. W., Xu, L. J., Yuan, K., and Yan, W. X. (2023). Constant volume method of shared bicycle parking area based on natural break point method. J. Wuhan Univ. Technol. Transp. Sci. Eng. 47, 992–997.
Lu, Y. M. (2021). Research on the spatial pattern of Gaoling District based on machine learning suitability evaluation. Xi'an, China: Chang’an University.
Marjanović, M., Kovačević, M., Bajat, B., and Voženílek, V. (2011). Landslide susceptibility assessment using SVM machine learning algorithm. Eng. Geol. 123, 225–234. doi:10.1016/j.enggeo.2011.09.006
Mozumder, C., Tripathi, N. K., and Losiri, C. (2016). Comparing three transition potential models: a case study of built-up transitions in North-East India. Comput. Environ. Urban Syst. 59, 38–49. doi:10.1016/j.compenvurbsys.2016.04.009
Ou, D. H., Zhang, Q., Qin, J., Gong, S. Q., Wu, Y. J., and Zheng, Z. S. (2021). Classification system for county-level territorial space using spatiotemporal heterogeneity and dynamic coupling of land use and functionality. Trans. Chin. Soc. Agric. Eng. 37, 284–296.
Ou, M., Li, J., Fan, X., and Gong, J. (2022). Compound optimization of territorial spatial structure and layout at the city scale from "Production-Living-Ecological" perspectives. INT J ENV RES PUB HE. J. Article; Res. Support, Non-U.S. Gov't, 20. doi:10.3390/ijerph20010495
Reidsma, P., König, H., Feng, S., Bezlepkina, I., Nesheim, I., Bonin, M., et al. (2011). Methods and tools for integrated assessment of land use policies on sustainable development in developing countries. LAND USE POLICY 28, 604–617. doi:10.1016/j.landusepol.2010.11.009
Roy, B. (2021). A machine learning approach to monitoring and forecasting spatio-temporal dynamics of land cover in Cox's Bazar district, Bangladesh from 2001 to 2019. Environ. challenges 5, 100237. doi:10.1016/j.envc.2021.100237
Sankarrao, L., Ghose, D. K., and Rathinsamy, M. (2021). Predicting land-use change: intercomparison of different hybrid machine learning models. Environ. Modell. Softw. 145, 105207. doi:10.1016/j.envsoft.2021.105207
Stewart, T. J., and Janssen, R. (2014). A multiobjective GIS-based land use planning algorithm. Comput. Environ. Urban Syst. 46, 25–34. doi:10.1016/j.compenvurbsys.2014.04.002
Sun, T., Chen, F., Zhong, L., Liu, W., and Wang, Y. (2019). GIS-based mineral prospectivity mapping using machine learning methods; a case study from Tongling ore district, eastern China. ORE Geol. Rev. 109, 26–49. doi:10.1016/j.oregeorev.2019.04.003
Tao, J., Lu, Y., Ge, D., Dong, P., Gong, X., and Ma, X. (2022). The spatial pattern of agricultural ecosystem services from the production-living-ecology perspective: a case study of the Huaihai Economic Zone, China. LAND USE POLICY 122, 106355. doi:10.1016/j.landusepol.2022.106355
Verburg, P. H., van de Steeg, J., Veldkamp, A., and Willemen, L. (2009). From land cover change to land function dynamics: a major challenge to improve land characterization. J. Environ. MANAGE 90, 1327–1335. doi:10.1016/j.jenvman.2008.08.005
Wang, J., Liu, H., Liu, P., and Chang, G. (2023). An evaluation of the spatial rationality of provincial territory: a case study of Gansu Province. Environ. Sci. Pollut. R. 30, 18268–18284. doi:10.1007/s11356-022-23258-4
Wang, L., Zhou, Y., Li, Q., Xu, T., Wu, Z., and Liu, J. (2021). Application of three deep machine-learning algorithms in a construction assessment model of farmland quality at the county scale: case study of Xiangzhou, Hubei Province, China. Agriculture 1, 72. doi:10.3390/agriculture11010072
Wang, S., Qu, Y., Zhao, W., Guan, M., and Ping, Z. (2022a). Evolution and optimization of territorial-space structure based on regional function orientation. LAND-BASEL 11, 505. doi:10.3390/land11040505
Wang, Y. F., Fan, J., and Zou, K. (2019). Territorial function optimization regionalization based on the integration of "Double Evaluation. Geogr. Res. 38, 2415–2429.
Wang, Y. N., Xiao, X., Pu, J. F., Wang, S., Wang, W. J., and Wang, W. (2022b). Spatial and temporal evolution characteristics of “production - LivingEcologicalSpace in yangtze river economic belt in past 40 Years”. Trans. Chin. Soc. Agric. Mach., 53.
Wei, L., Zhang, Y., Wang, L., Cheng, Z., and Wu, X. (2022). Obstacle indicators diagnosis and advantage functions zoning optimization based on "Production-Living-Ecological" functions of national territory space in jilin Province. Sustain. Basel, Switz. 14, 4215. doi:10.3390/su14074215
Wu, Q., Cui, F. P., Xiong, C., Huang, Y. Z., and Sun, C. (2021a). Classification and characterization of China national territorial spaces. Earth Sci. Front. 28, 256–262. doi:10.13745/j.esf.sf.2021.7.7
Wu, Y., Shi, K., Member, I., Chen, Z., Member, I., Liu, S., et al. (2021b). Developing improved time-series DMSP-OLS-like data (1992–2019) in China by integrating DMSP-OLS and SNPP-viirs. IEEE T Geosci. REMOTE 60, 1–14. doi:10.1109/tgrs.2021.3135333
Xia, C. H., and Zhai, G. F. (2022). Research on dynamic mechanism of territorial space evolution in yangtze river delta based on GBDT machine learning algorithm. Urban Dev. Stud. 29, 12–19.
Xia, J. N., Wei, W., Yin, L., Hong, M. Y., and Bu, L. M. (2023). Evaluation method of morphological efficiency for "three functional spaces" based on quadtree algorithm. J. Geo-information Sci. 25, 450–467. doi:10.12082/dqxxkx.2023.220386
Xiao, P., Xu, J., and Zhao, C. (2022). Conflict identification and zoning optimization of "Production-Living-Ecological" space. INT J ENV RES PUB HE. J. Article; Res. Support, Non-U.S. Gov't, 19. doi:10.3390/ijerph19137990
Yu, R., Qin, Y., Xu, Y., and Chuai, X. (2022). Study on the optimization of territory spatial 'urban-agricultural-ecological' pattern based on the improvement of 'production-living-ecological' function under carbon constraint. Int. J. Env. Res. PUB HE 19, 6149. doi:10.3390/ijerph19106149
Zhang, J. J., Gao, Y. L., Cai, Y. M., and ZhouW, Y. T. (2018). Spatial optimization on the municipal level based on "multiple planning integration":A case study of Yantai City. Prog. Geogr. 37, 1045–1054.
Zhang, K., Wei, W., Zhou, J., Yin, L., and Xia, J. N. (2022). Spatial-temporal evolution characteristics and mechanism of "Three-Function space" in the three-rivers headwaters' region from 1992 to 2020. J. Geo- Inf. Sci. 24, 1755–1770.
Zheng, M. B., Dai, Z., and Zho, J. Y. (2017). Three types of space and town, agriculture and health based on "multi-plan integration" Exploration of state boundary delineation method. Intell. City 3, 156. doi:10.19301/j.cnki.zncs.2017.08.100
Keywords: multisource data, machine learning, suitability evaluation, ecological-agricultural-urban spatial space, random forest
Citation: Li A, Zhang Z, Hong Z, Liu L, Liu L, Ashraf T and Liu Y (2024) Spatial suitability evaluation based on multisource data and random forest algorithm: a case study of Yulin, China. Front. Environ. Sci. 12:1338931. doi: 10.3389/fenvs.2024.1338931
Received: 15 December 2023; Accepted: 31 January 2024;
Published: 09 February 2024.
Edited by:
Jie Xiang, China Geological Survey, ChinaReviewed by:
Na Yang, Xi’an University of Science and Technology, ChinaHuaqi Wang, Xi’an Center of China Geological Survey, China
Copyright © 2024 Li, Zhang, Hong, Liu, Liu, Ashraf and Liu. This is an open-access article distributed under the terms of the Creative Commons Attribution License (CC BY). The use, distribution or reproduction in other forums is permitted, provided the original author(s) and the copyright owner(s) are credited and that the original publication in this journal is cited, in accordance with accepted academic practice. No use, distribution or reproduction is permitted which does not comply with these terms.
*Correspondence: Zhenkai Zhang, emhhbmd6aGVua2FpMTk4OEBmb3htYWlsLmNvbQ==; Zenglin Hong, aG9uZ3plbmdsaW4xOTYzQDE2My5jb20=