 Sara E. A. Johnson
 Hengchun Ye
 Eric J. Fetzer3
 Jingjing Li
94% of researchers rate our articles as excellent or good
Learn more about the work of our research integrity team to safeguard the quality of each article we publish.
Find out more
ORIGINAL RESEARCH article
Front. Environ. Sci., 03 April 2024
Sec. Atmosphere and Climate
Volume 12 - 2024 | https://doi.org/10.3389/fenvs.2024.1338678
This article is part of the Research TopicClimate-Environment Interactions under Global Warming, volume IIView all 10 articles
This study explores the relationship between water vapor and rainfall intensities over three tropical lands (Amazon Basin, Sahel, southern South America) and three tropical ocean regions (Atlantic Ocean, Indian Ocean, Niño 4). We utilized daily total column water vapor (TCWV) data from the Atmospheric Infrared Sounder (AIRS) and daily precipitation records from the Tropical Rainfall Measuring Mission (TRMM) Multi-satellite Precipitation. Over tropical land, precipitation shows higher sensitivity to changes in water vapor, with a well-sorted pattern of an increased occurrence of higher daily precipitation as TCWV increases. Precipitation intensity over the Sahel, in particular, is extremely responsive to TCWV change. Over tropical oceans, the precipitation intensity is less sensitive to water vapor, particularly in the Indian Ocean and Niño 4 where precipitation intensities above the 40th percentile are no longer responding to the increasing TCWV. Quantifying water vapor and precipitation intensity aids in forecasting the occurrence of precipitation between tropical land and oceans.
An increase in atmospheric water vapor content accompanying a warming climate will affect hydrological cycles on regional and global scales (Trenberth et al., 2003; Sun et al., 2007; O'Gorman and Schneider, 2009; Trenberth, 2011; Donat et al., 2016). Previous studies indicate that the precipitation intensity is closely controlled by the amount of atmospheric water vapor content over the middle and higher latitude lands (Sun et al., 2007; O'Gorman and Schneider, 2009; Muller, 2013; Ye et al., 2014; Ye et al., 2015). An increase in water vapor can also impact precipitation frequency, and duration (Trenberth et al., 2003; Sun et al., 2007; O'Gorman and Schneider, 2009; Trenberth, 2011).
In observational studies, water vapor plays a predominant role in precipitation intensity (Bevis et al., 1992; Troller et al., 2006; Holloway and Neelin, 2009; Van Baelen et al., 2011; Chen et al., 2017a; Zhang et al., 2018). Using historical observational records, Ye et al. (2014); Ye et al. (2015); Ye et al. (2017) found that higher atmospheric water vapor leads to more frequent higher precipitation intensity in all seasons over northern Eurasia. Liang et al. (2020) find that precipitation increases with water vapor, and water vapor stimulates precipitation occurrences over the Tibetan Plateau. The role of water vapor at different levels of the atmosphere on precipitation intensity and areal extent is, also, well studied using observations in Chen et al. (2017a); Chen et al. (2017b) and Radhakrishna and Rao (2021). Furthermore, increases in water vapor are key to the development of severe weather and heavy precipitation events (Van Baelen et al., 2011; Chen et al., 2017a; Zhang et al., 2018; Liang et al., 2020). These in situ studies detail the relationship between water vapor and precipitation intensity.
Studies utilizing satellite data also illustrate the relationship between water vapor and precipitation intensity (Bretherton et al., 2004; Ahmed and Schumacher, 2015; Schiro et al., 2016; Ahmed and Schumacher, 2017; Rushley et al., 2018; Roderick et al., 2019). Few studies have utilized Atmospheric Infrared Sounder (AIRS) to investigate the relationship between precipitation intensity and column water vapor (Roderick et al., 2019; Wang et al., 2021). Roderick et al. (2019) utilizes AIRS’s Integrated Water Vapor (IWV) and Surface Air Temperature (SAT) profiles along with rain gauge observations to investigate the rainfall-temperature scaling over Australia. They find that rainfall intensity increases with IWV (Bao et al., 2017; Roderick et al., 2019). Wang et al. (2021) utilize AIRS, Tropical Rainfall Measuring Mission (TRMM), and other satellite products to understand the spatial and temporal variations of water vapor, temperature, and precipitation in the Tibetan Plateau, finding a relationship of water vapor content with precipitation and temperature in most mountainous areas (Wang et al., 2021). Over the continental United States (CONUS) region, Radhakrishna et al. (2015) explored the role of water vapor in generating convection using the Global Navigation Satellite System (GNSS) and radar networking. Ahmed and Schumacher (2015), Ahmed and Schumacher (2017) utilized reanalysis water vapor and TRMM Precipitation Radar observations to investigate the moisture-precipitation relationship. Overall, satellite-derived measurements are valuable in identifying the precipitation-moisture relationship.
Geographic difference have been highlighted in studies of water vapor and precipitation relationships (Bretherton et al., 2004; Schiro et al., 2016; Ahmed and Schumacher, 2017). Bretherton et al. (2004) found that rainfall increases rapidly with water vapor in all tropical ocean regions. Higher mean tropospheric temperature influences precipitation over the West Pacific and Indian Ocean regions. Temperature, particularly daytime heating (Schiro et al., 2016; Ahmed and Schumacher, 2017), influences the precipitation-column water vapor (CWV) relationship differently over tropical ocean and land (Ahmed and Schumacher, 2017; Kuo et al., 2017; Schiro et al., 2018; Neelin et al., 2022). Due to environmental controls, tropical land regions tend to have a less steep precipitation-column water vapor moisture curve than ocean regions (Schiro et al., 2016; Ahmed and Schumacher, 2017). Therefore, it is essential to understand the water vapor and precipitation relationship considering the geographical difference between tropical land and ocean region.
Building on previous usage of satellite products, the first goal of this study is to determine if AIRS water vapor data and TRMM daily and monthly precipitation data can reproduce the moisture-precipitation relationship established in previous studies. There is still a need to understand geographic effects of tropical precipitation intensity response to moisture. Given their global coverage, satellite remote sensing products provide an opportunity to evaluate the role of water vapor on the precipitation intensity and occurrence throughout the Tropics. The second goal of this study is to exploit global, long-term AIRS and TRMM data sets to extend the moisture-precipitation relationships to unstudied regions and time periods. Thus far, the usage of AIRS data to analyze the precipitation-moisture relationship is limited. Here, we describe the water vapor-precipitation relationship using AIRS total column water vapor (TCWV) and TRMM precipitation at daily and monthly scales. Utilizing longer temporal scales will assist in understanding deep convection and the geographic variation in precipitation-moisture relationship. We highlight the geographical difference in the precipitation-moisture relationship and the occurrence of different precipitation intensity over tropical land and ocean. Providing knowledge on the precipitation-water vapor relationship at smaller local scales can also give more information on the local climate effects than a generalized large regional scale study. This is important because long-term precipitation can change rapidly over small scales, especially over varying topography.
This study considers three tropical ocean locations (Atlantic Ocean, Niño 4, and Indian Ocean), two tropical land regions (Sahel, Amazon Basin), and one subtropical land region (southern South America) (Figure 1). The coordinate extents of these six regions are listed in Table 1.
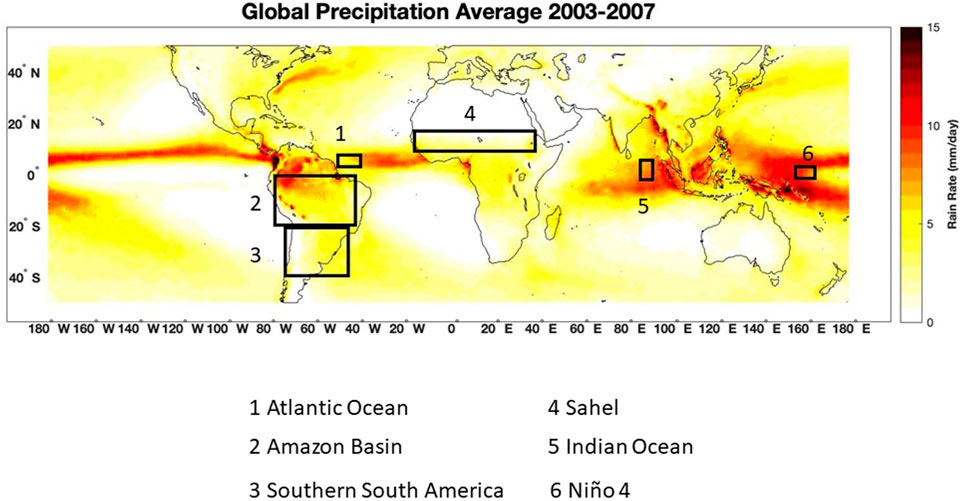
Figure 1. Study areas.

Table 1. The coordinates extents for six study locations.
The Atlantic Ocean, Indian Ocean, and the Pacific Ocean surrounding Kwajalein Island (Niño 4) were selected due to Bretherton et al. (2004) study on the relationship between relative humidity and precipitation averaged over four tropical ocean areas within 20°S-20°N. By selecting smaller areas, we would like to understand variations among different parts of the tropical ocean. For example, we selected Kwajalein Island, within the Niño 4 region, a well-researched area in the equatorial Pacific (Bretherton et al., 2004; Powell, 2019).
An Amazon location is selected based on Schiro et al. (2016) observations between precipitation and water vapor on shorter time scales, including 15-min, 30-min, and hourly intervals. We want to complement their studies by examining longer time scales of daily and monthly relationships. Including the southern part of South America (Chile, Argentina, Paraguay, Uruguay) assists us in understanding the relationship between water vapor and precipitation in a subtropical land region where little research was done.
We use Atmospheric Infrared Sounder (AIRS)/Advanced Microwave Sounding Unit (AMSU) Aqua Daily and Monthly Standard Physical Retrieval Version 6 Level 3 data (AIRX3STD/AIRX3STM) for TCWV (AIRS project, 2019). AIRS/AMSU is a part of the Aqua satellite, launched on 4 May 2002, by the National Aeronautics and Space Administration (NASA) (Chahine et al., 2006; AIRS project, 2019). At 705 km height in a sun-synchronous orbit, the satellite collects temperature and water vapor profiles to observe the global water and energy cycles, climate variation and trends, and the climate system’s response to increasing greenhouse gases (Tian et al., 2017). Measurements are collected once or twice daily for each location; descending (southward moving) orbits overpass any location at 1:30 a.m. local time and ascending orbit at 1:30 PM. The spatial coverage is global. AIRS retrievals are obtained at 45 km resolution at nadir in a swath about 1,500 km wide (Susskind et al., 2014). Level 3 data are gridded Level 2 swath retrieval products of geophysical variables and quality parameters, averaged and binned into 1x1-degree grid cells (Tian et al., 2017). The study utilizes AIRS daily total column water vapor (TCWV) averaged from daily observations of ascending and descending Level 3 gridded data sets.
AIRS retrievals are available for scenes with approximately 70% effective cloud fraction (the product of cloud coverage and infrared emissivity), or about 70% of all scenes observed (Susskind et al., 2014). AIRS retrievals include water vapor information for cloudy scenes because the cloud-clearing retrieval methodology combines information from nine 15 km-wide infrared scenes to remove the cloud contribution at 45 km (Susskind et al., 2014). As a result, the approximate 70% coverage for AIRS is far higher than typical clear sky occurrence of a few percent at 45 km scales (Guillaume et al., 2019). Cloud clearing, and the large number of AIRS channels provide information not obtainable with broad spectral satellite instrument (Fan et al., 2023). While some cloud types are rarely sampled by AIRS, including deep convective clouds (Yue et al., 2013), these occur infrequently and do not significantly affect the monthly TCWV statistics considered in this study (Wong et al., 2015). The effects of cloud-induce sampling in AIRS is also discussed in Tian et al. (2019). The climatology from AIRS is broadly consistent with other data sets (Schröder et al., 2018), except for small mean relative differences whose values are not know. Also, a 1 × 1 degree grid box contains approximately four 45-km wide AIRS observations, so only grid boxes with complete cloud cover will not contain AIRS information. Other studies have demonstrated the value of using AIRS water vapor to reconstruct high resolution datasets over the Tibetan Plateau (Wang et al., 2021) and Antarctica (Fan et al., 2023), and in moist convective environments over oceans (Abraham and Goldblatt, 2023). AIRS cannot not fully resolve the diurnal cycle, which can be as large as 10% or more of the mean state for tropical conditions (Radhakrishna et al., 2022). However, twice-daily samples of a sinusoid with diurnal period (24 h) average to zero, so do not affect the time mean values (though overtones of the diurnal period will alias onto lower frequencies). As Radhakrishna et al. (2022) show, the diurnal variability of TCWV is nearly sinusoidal of period 24 h, so diurnal sampling effects are small in AIRS TCWV. Together, cloud-induced sampling and diurnal effects will contribute an estimated 10% of the signal in monthly TCWV statistics from AIRS (Wong et al., 2015; Tian et al., 2019). In comparison, the climatological signals shown below can vary by an order of magnitude or more. In summary, the AIRS TCWV in this study is representative of the large-scale, slowly varying total water vapor, and its interactions with nearby convection at daily to monthly scales, but not water vapor within and under clouds where rain is occurring.
Precipitation data are from the 3B42 (Daily) and 3B43 (Monthly) Version 7 TRMM Multi-satellite Precipitation Analysis (TMPA) Rainfall Estimate Product 3B42/3B43 Version 7 (TRMM) (Huffman et al., 2010; Tropical Rainfall Measuring Mission TRMM, 2011). TRMM launched in November 1997 as a joint mission between NASA and the Japan Aerospace Exploration Agency to monitor and study tropical rainfall. The TRMM goal is to understand the distribution and variability of precipitation within the tropical climate system; and the interaction between water vapor, clouds, and precipitation (NASA, 2015). The 3B42 dataset is produced by merging satellite rainfall estimates with rain gauge data into gridded estimates. This product gives 3-hourly precipitation estimates using microwave, TRMM imager (TMI) precipitation, infrared, and rain gauge adjustments. 3B43 is a monthly version of the 3B42 dataset. For brevity, we address this dataset as TRMM. The spatial coverage of 3B42 (Daily) extends to the −50/+50 latitude and all longitudes. The temporal resolution is 3-hourly data. The spatial resolution is on a 0.25 × 0.25-degree grid. The TRMM satellite operated from 1997 to 2015 before transitioning to the Global Precipitation Measurement (GPM) satellite (TRMM. Goddard Space Flight Center Distributed Active Archive Center GSFC DAAC, 2015). For initial results, we select the beginning of 2003 to allow a one-year gap in data collection from the Aqua satellite, and before the transition to GPM. Given that these two daily data sets of water vapor and precipitation have different spatial resolutions, we take averages of all gridded values within each study area to derive daily values during their overlapping period of 1 January 2003, to 31 December 2007. This period overlaps a year after the start of AIRS in 2002 and before the end of TRMM to ensure consistency with our data.
Previous studies highlight the broader relationship between precipitation and column and vertical structures of water vapor (Bretherton et al., 2004; Holloway and Neelin, 2009; Holloway and Neelin, 2010; Muller, 2013; Schiro et al., 2016). In this study, we provide a localized approach to these connections over multiple tropical land and ocean areas at daily and monthly time scales. The monthly time scale examines the general relationship between the water vapor and precipitation over different parts of the tropical oceans and (sub)tropical land areas from a climatological perspective. The daily time scale reveals the in-depth relationship between the precipitation intensity and occurrences in response to the water vapor content simultaneously.
We plot monthly time series of TCWV and precipitation to examine the seasonality and visualize the variability of these two variables at each locality (Figures 2, 3). To quantify the rate of change in monthly mean precipitation intensity with TCWV, we adopt Ye et al. (2017) and Lenderink and Van Meijgaard (2008) calculation method for non-linear relationship (Eq. 1). It is an exponential regression used by fitting a least square linear regression to the logarithm of precipitation (Lenderink and Van Meijgaard, 2008; Ye et al., 2017):
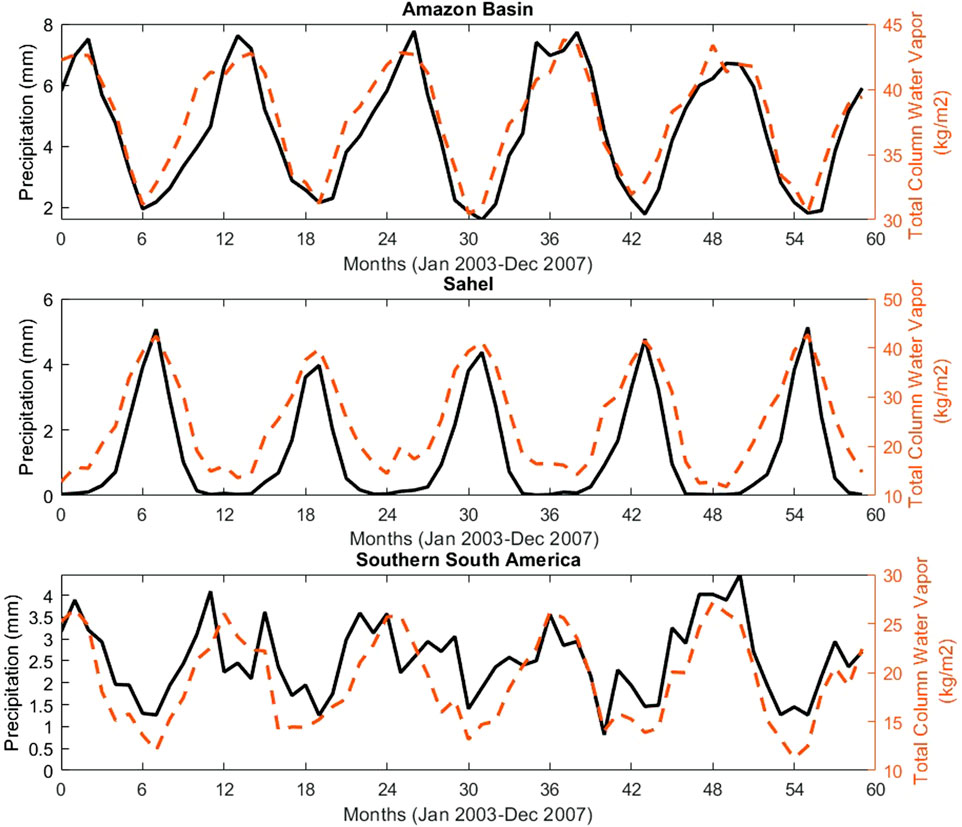
Figure 2. Time series of monthly precipitation and TCWV over three Land regions.

Figure 3. Time series of monthly precipitation and TCWV over three Ocean regions.
Where prate is the daily mean precipitation intensity in response to daily TCWV change, a is the constant rate of increase in daily precipitation intensity, and d(TCWV) is the change in total column water vapor. We applied a logarithmic operation on the equation and fit a least squared linear regression to obtain the rate of change in precipitation intensity with TCWV. After calculating the rate of change, we convert this into percent of change for clarity and easy comparison among different study sites and with other studies.
For an in-depth examination of the relationship between daily precipitation intensity and TCWV, we stratify daily precipitation intensity into five groups at each location: lower than 20th, 21st-40th, 41st-60th, 61st-80th, and higher than 80th percentiles (Table 2). Then, we pair each day with its corresponding daily TCWV and plot the distribution of occurrence of the five precipitation intensity groups based on their corresponding daily TCWV. This way, we visualize the distribution of daily precipitation intensity in response to the TCWV values for different locations. This information determines which precipitation intensity is most likely to occur at specific TCWV for different localities.

Table 2. Designates the groupings for the precipitation intensities based on percentiles.
Figure 2 presents the time series of monthly mean TRMM rainfall and AIRS TCWV for the land regions. For the Amazon region, there is a significant seasonal pattern of both precipitation intensity and TCWV, as shown in Figure 2. The wet season tends to occur in December-February and dry season during June-August. The peak precipitation coincides with peak TCWV. Similar to the Amazon, Sahel also depicts a seasonal pattern of precipitation and TCWV. The peak wet season appears to occur in June and the dry season in November to January. The TCWV and precipitation follow each other very closely as seasons progress, especially in the peak wet month of the year. After these wet months, the values drastically decrease when rainfall is low or not present during November and December months. The southern South America region (Figure 2) also displays seasonality, but with more variation in precipitation than Amazon Basin and Sahel. Southern South America TCWV shows much lower water vapor values but with a similar seasonal variation to that of Amazon.
Figure 3 illustrates a time series of monthly mean TRMM rainfall and AIRS TCWV over ocean regions. Compared to the land regions (Figure 2), the seasonality associated with the TCWV, and precipitation intensity appears to be much less evident in the ocean regions (Figure 3). In the Atlantic Ocean region, the peak of precipitation does not necessarily correspond to the peak of TCWV. Similarly, there is a difficulty discerning a seasonal pattern in TCWV and precipitation in the Indian Ocean and Niño 4 regions. There is more variability in the precipitation and TCWV compared to the land regions.
Figure 4 illustrates the relationship between TCWV and monthly mean precipitation intensity for land regions including Amazon, Sahel, and Southern South America. Sahel has the greatest rate of change in precipitation for 1 kg/m2 TCWV, there is an increase in monthly precipitation intensity, resulting in 19.48% change. This strong correspondence may be due to Sahel’s drier climate. The second greatest rate of change occurs in the Amazon region at 12.08%. The smallest rate of change occurs in the southern South American region at 6.49%. Sahel and southern South America have similar warm season climates; however, these regions have a difference in rate of change, illustrating the distinct precipitation processes regarding the precipitation-moisture response. Generally, we expect the rate of change in land location to be greater supported by other studies highlighting the large change over land (Ye et al., 2017).
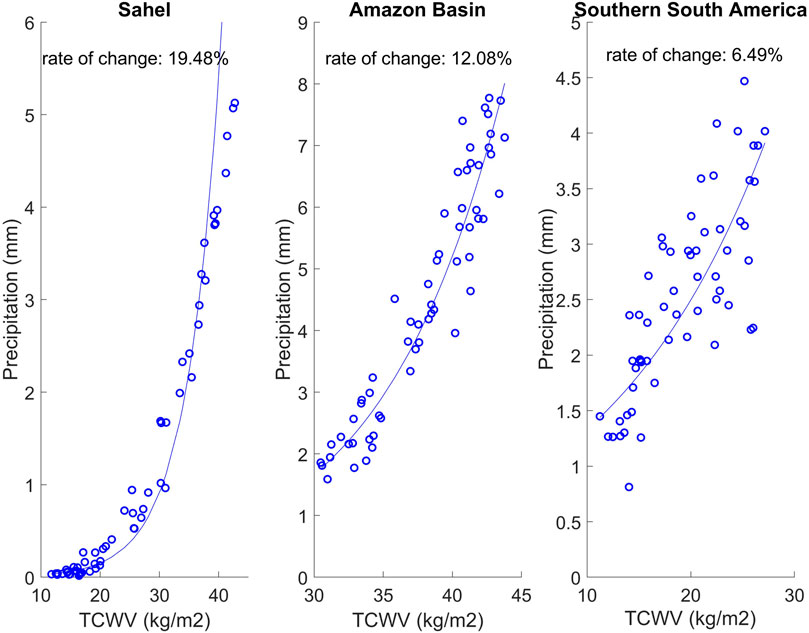
Figure 4. Monthly mean precipitation intensity versus TCWV at three Land regions.
Figure 5 shows the relationship between TCWV and monthly mean precipitation intensity for ocean regions including Atlantic Ocean, Indian Ocean, and Niño 4. Niño 4 has the largest rate of change at 13.05%, followed by the Atlantic Ocean at 10.4%. The Indian Ocean has the smallest rate of change at 2.82% with the largest spread of data points, depicting a weaker relationship between TCWV and precipitation intensity. This aligns with observations by Bretherton et al. (2004) that precipitation has a minimal response to water vapor in the Indian Ocean region compared to the other selected ocean regions.
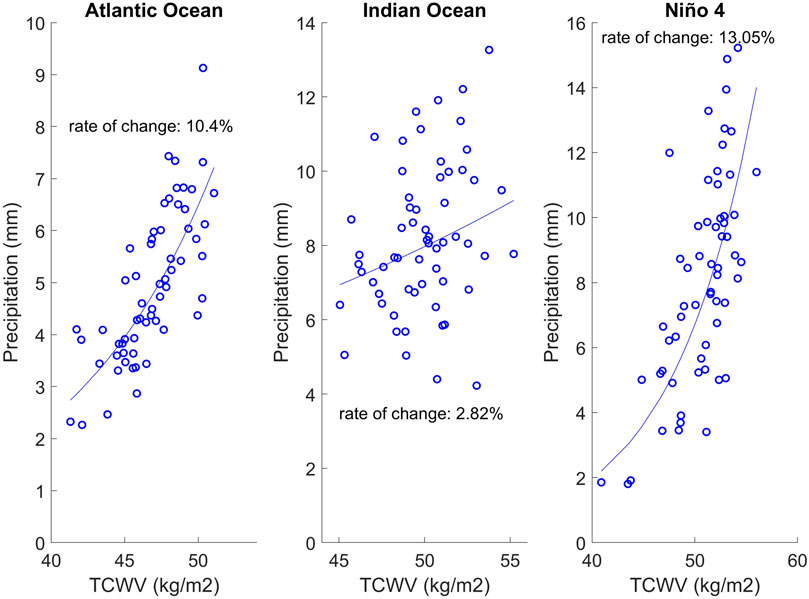
Figure 5. Monthly mean precipitation intensity versus TCWV at three Ocean regions.
Figure 6 illustrates the occurrence distribution of five different precipitation intensity groups in corresponding TCWV for six study regions. Table 3 provides each study region’s precipitation percentile values for five precipitation intensity groups. Based on the Amazon Basin results (Figure 6A), the higher the values of daily TCWV, the greater likelihood of higher precipitation intensity events. The lowest precipitation intensity below the 20th percentile (Group 1) peaks at TCWV of 31 kg/m2. The 21–40th percentile precipitation (Group 2), peaks at TCWV of 34 kg/m2. The precipitation intensity at 41–60th percentile (Group 3), peaks at 37 kg/m2. For precipitation intensity at 61–80th percentile (Group 4), the peak is at 39 kg/m2 TCWV. Lastly, precipitation intensity higher than 80th percentile (Group 5), peaks at 41 kg/m2 water vapor. The highest precipitation intensities (Group 5) show the narrowest distribution range for the Amazon Basin with no occurrence below 30 kg/m2 TCWV.
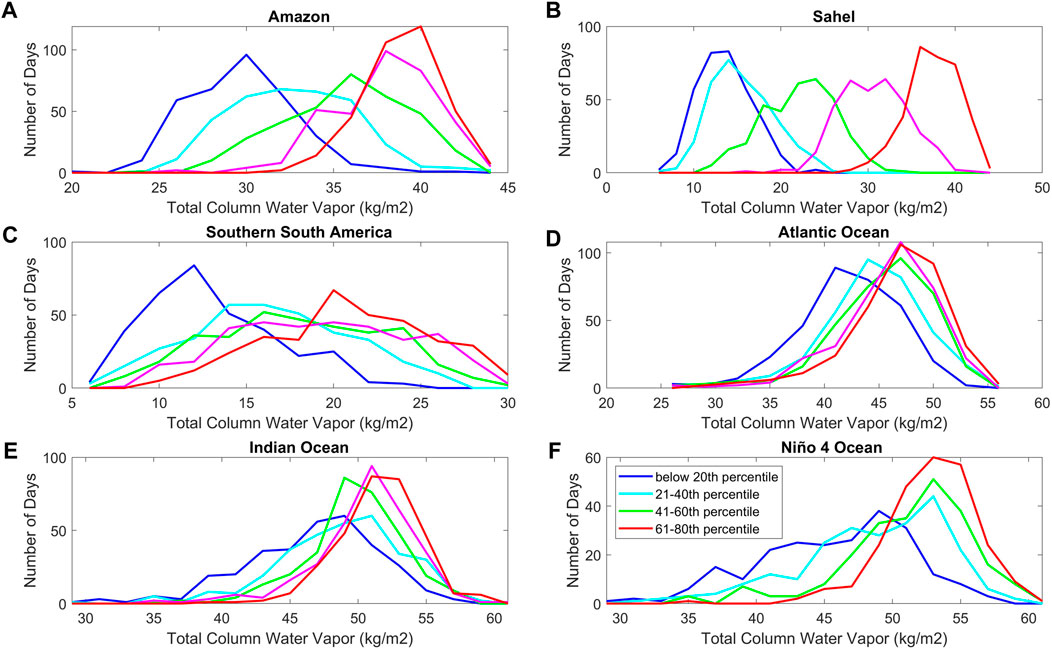
Figure 6. Distribution of ranked precipitation occurrence intensity versus TCWV for six study regions, including (A) Amazon, (B) Sahel, (C) Southern South America, (D) Atlantic Ocean, (E) Indian Ocean, and (F) Niño 4 Ocean.
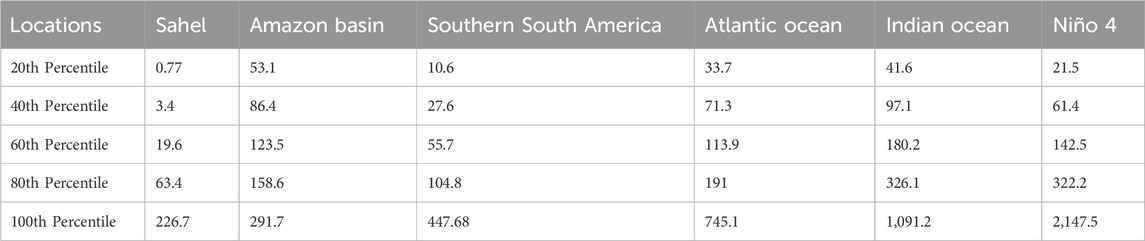
Table 3. Percentiles of daily precipitation values (in mm) for six regions in this study.
The occurrence of various daily averaged precipitation intensities in the Sahel region is shown in Figure 6B. This is the greatest sensitivity to water vapor of any region considered in this study. Compared to the Amazon Basin, the distribution of precipitation intensity is well separated based on water vapor, with very little overlap between lowest and highest percentiles, the blue and red curves, respectively. In Figure 6B, the lowest 20th percentile (Group 1), peaking at 13 kg/m2. The 21–40th percentile (Group 2) peaks at 14 kg/m2. For the 41–60th percentile (Group 3), the peak water vapor is 24 kg/m2. The water vapor peaks at 30 kg/m2 for the 61–80th percentile (Group 4). Water vapor peaks at 36 kg/m2 for the highest percentile rainfall occurrence (Group 5). The distribution shape is roughly similar among different groups, but with the top and bottom 20th percentile extremes being slightly narrower.
The precipitation intensity is less sensitive to water vapor in the southern South American region (Figure 6C). This result suggests high-intensity precipitation sometimes happens during very low value of TCWV, and that low-intensity precipitation days may have very high TCWV. However, the general shift from the lowest intensity group to the highest intensity group with increasing TCWV is still apparent. For Group 1, the water vapor value peaks at 12 kg/m2. Group 2 peaks at 15 kg/m2. The highest water vapor value for Group 3 is 16 kg/m2. Group 4 peaks at 21 kg/m2, Group 5 also peaks between 21 and 22 kg/m2.
Compared to the land regions, the precipitation over the Atlantic Ocean (Figure 6D), is less sensitive to TCWV, especially at higher intensity groups. The distributions of precipitation occurrence almost overlap among Groups 3, 4, and 5. They all peak at 47 kg/m2. The TCWV peaks at 40 kg/m2 for Group 1, and the Group 2 peaks at 44 kg/m2. This distribution suggests water vapor has little control of the precipitation intensity above the 40th percentile over the tropical Atlantic region.
The occurrence of precipitation intensity over the Indian Ocean (Figure 6E) is relatively unresponsive to the water vapor, as was seen over the Atlantic Ocean region (Figure 6D). The most likely values of TCWV associated with the following groups are: Group 1 at 47 kg/m2, Group 2 at 51 kg/m2, Group 3 at 49 kg/m2, and Group 4 and 5 at 50 kg/m2. The shape of distribution tends to narrow as water vapor increases, especially for Groups 3, 4, and 5.
The occurrence of different precipitation intensities in the Niño 4 region varies only slightly with TCWV (Figure 6F). This is consistent with other oceanic regions (Figures 6D, E), and contrasts with land regions (Figures 6A–C). Niño 4 Group 1 peaks at 49 kg/m2. The highest water vapor peak for Groups 2–5 is 53 kg/m2. There are very few differences in occurrence distributions between Groups 4 and 5. This distribution suggests that precipitation intensity occurrences higher than the 60th percentile do not respond to the TCWV change above a threshold of about 45 kg/m2.
The occurrence distribution for Niño 4 location (Figure 6F) is quite like that of the Indian Ocean (Figure 6E) but with even less response to water vapor. Niño 4 Group 1 peaks at low TCWV of 37 kg/m2 (Figure 6F) and spreads more broadly across the entire range of water vapor. Groups 2–5 peak at a similar value of around 54 kg/m2; however, the distribution becomes narrower as the precipitation intensity group increases.
This study expands previous knowledge on the relationships and geographic effects of tropical precipitation intensity response to TCWV utilizing satellite observations.
We find that the daily precipitation intensity over tropical lands has more sensitivity to TCWV than over tropical oceans. Results over tropical land detail a well-sorted pattern of increased occurrences of higher daily precipitation intensity as TCWV increases. Similarly, Liang et al. (2020) found that increases in precipitable water vapor accompany precipitation occurrence.
In Sahel, precipitation has the greatest sensitivity to water vapor change, where the rate of change is 19.48% per each 1 kg/m2 of TCWV increases at monthly time scale. The higher sensitivity to water vapor could be due to the arid climate of the Sahel. We also notice a seasonal component of rainfall and TCWV in the Sahel during June -September (Figure 2). If a dry environment is a factor in sensitivity, we would expect that the southern South American area would show similar behavior. However, rainfall is less sensitive to water vapor there, suggesting fundamentally different precipitation processes in the Sahel and southern South America.
For the study areas over the ocean, the precipitation intensity occurrence does not show strong response to water vapor, especially in the Indian Ocean and Niño 4 regions: a wider range of water vapor changes over the ocean regions does not appear to control precipitation intensities. Oceanic precipitation intensities above the 40th percentiles are insensitive to the increase of water vapor above threshold values. These are consistent with the smaller change rates of monthly precipitation intensities with TCWV between 2%–13.1% among these tropical ocean regions.
Daily data is necessary to examine the occurrence distributions for different precipitation intensities. We find precipitation intensity occurrences over land regions are more sensitive to water vapor changes compared to the ocean regions. These differences indicate that changes in water vapor impact precipitation differently over land and ocean. These relationships are further confirmed by the distribution of occurrences of precipitation intensity. Forecasts of precipitation over tropical land can rely on water vapor as a predictor of precipitation intensity and occurrence. The highest land precipitation intensity occurrences are associated with higher values of TCWV. Knowing the difference between precipitation intensities over (sub)tropical land and ocean may aid water resource planning. More importantly, this study contributes to understanding the precipitation-moisture over multiple scales.
The original contributions presented in the study are included in the article/Supplementary Material, further inquiries can be directed to the corresponding author.
SJ: Conceptualization, Data curation, Formal Analysis, Investigation, Methodology, Visualization, Writing–original draft, Writing–review and editing. HY: Conceptualization, Funding acquisition, Methodology, Supervision, Writing–review and editing. EF: Conceptualization, Funding acquisition, Methodology, Supervision, Writing–review and editing. JL: Conceptualization, Funding acquisition, Methodology, Supervision, Writing–review and editing.
The author(s) declare financial support was received for the research, authorship, and/or publication of this article. This research was funded by the NASA Minority University Research and Education Project (MUREP) Institutional Research Opportunity under Grant (NNX15AQ06A) and NASA’s Making Earth System Data Records for Use in Research Environments (MEaSUREs) program.
The authors would like to thank the support of NASA DIRECT-STEM, AIRS group at the Jet Propulsion Laboratory, California Institute of Technology, and colleagues.
The authors declare that the research was conducted in the absence of any commercial or financial relationships that could be construed as a potential conflict of interest.
All claims expressed in this article are solely those of the authors and do not necessarily represent those of their affiliated organizations, or those of the publisher, the editors and the reviewers. Any product that may be evaluated in this article, or claim that may be made by its manufacturer, is not guaranteed or endorsed by the publisher.
Abraham, C., and Goldblatt, C. (2023). Changes in relative humidity profiles over earth’s oceans in a warming climate: a satellite-data-based inference. J. Atmos. Sci. 80 (7), 1847–1866. doi:10.1175/jas-d-22-0119.1
Ahmed, F., and Schumacher, C. (2015). Convective and stratiform components of the precipitation-moisture relationship. Geophys Res. Lett. 42 (23). doi:10.1002/2015GL066957
Ahmed, F., and Schumacher, C. (2017). Geographical differences in the tropical precipitation-moisture relationship and rain intensity onset. Geophys Res. Lett. 44 (2), 1114–1122. doi:10.1002/2016gl071980
AIRS project (2019). Aqua/AIRS L3 daily standard physical retrieval (AIRS-only) 1 degree x 1 degree V7.0. Greenbelt, MD, USA: Goddard Earth Sciences Data and Information Services Center GES DISC. doi:10.5067/UO3Q64CTTS1U
Bao, J., Sherwood, S. C., Alexander, L. V., and Evans, J. P. (2017). Future increases in extreme precipitation exceed observed scaling rates. Nat. Clim. Change 7 (2), 128–132. doi:10.1038/nclimate3201
Bevis, M., Businger, S., Herring, T. A., Rocken, C., Anthes, R. A., and Ware, R. H. (1992). GPS meteorology: remote sensing of atmospheric water vapor using the global positioning system. J. Geophys Res. 97 (D14), 15787–15801. doi:10.1029/92jd01517
Bretherton, C. S., Peters, M. E., and Back, L. E. (2004). Relationships between water vapor path and precipitation over the tropical oceans. J. Clim. 17 (7), 1517–1528. doi:10.1175/1520-0442(2004)017<1517:rbwvpa>2.0.co;2
Chahine, M. T., Pagano, T. S., Aumann, H. H., Atlas, R., Barnet, C., Blaisdell, J., et al. (2006). AIRS improving weather forecasting and providing new data on greenhouse gases. Am. Meteorol. Soc. 87, 911–926. doi:10.1175/bams-87-7-911
Chen, B., Liu, C., and Mapes, B. E. (2017b). Relationships between large precipitating systems and atmospheric factors at a grid scale. J. Atmos. Sci. 74 (2), 531–552. doi:10.1175/jas-d-16-0049.1
Chen, B., Liu, Z., Wong, W. K., and Woo, W. C. (2017a). Detecting water vapor variability during heavy precipitation events in Hong Kong using the GPS tomographic technique. J. Atmos. Ocean. Technol. 34 (5), 1001–1019. doi:10.1175/jtech-d-16-0115.1
Donat, M. G., Lowry, A. L., Alexander, L. V., O’Gorman, P. A., and Maher, N. (2016). More extreme precipitation in the world’s dry and wet regions. Nat. Clim. Change 6 (5), 508–513. doi:10.1038/nclimate2941
Fan, R., Zeng, Z., Wang, X., Zhang, L., Cheng, W., and Ding, M. (2023). Comprehensive evaluation and comparison of AIRS, VASS, and VIRR water vapor products over Antarctica. J. Geophys Res. Atmos. 128 (23), e2023JD039221. doi:10.1029/2023jd039221
Guillaume, A., Kahn, B. H., Fetzer, E. J., Yue, Q., Manipon, G. J., Wilson, B. D., et al. (2019). Footprint-scale cloud type mixtures and their impacts on Atmospheric Infrared Sounder cloud property retrievals. Atmos. Meas. Tech. 12 (8), 4361–4377. doi:10.5194/amt-12-4361-2019
Holloway, C. E., and Neelin, D. J. (2009). Moisture vertical structure, column water vapor, and tropical deep convection. J. Atmos. Sci. 66 (6), 1665–1683. doi:10.1175/2008jas2806.1
Holloway, C. E., and Neelin, J. D. (2010). Temporal relations of column water vapor and tropical precipitation. J. Atmos. Sci. 67 (4), 1091–1105. doi:10.1175/2009jas3284.1
Huffman, G. J., Adler, R. F., Bolvin, D. T., and Nelkin, E. J. (2010). “The TRMM multi-satellite precipitation analysis (TMPA),” in Satellite rainfall applications for Surface hydrology (Netherlands: Springer), 3–22.
Kuo, Y. H., Neelin, J. D., and Mechoso, C. R. (2017). Tropical convective transition statistics and causality in the water vapor–precipitation relation. J. Atmos. Sci. 74 (3), 915–931. doi:10.1175/jas-d-16-0182.1
Lenderink, G., and Van Meijgaard, E. (2008). Increase in hourly precipitation extremes beyond expectations from temperature changes. Nat. Geosci. 18 (8), 511–514. doi:10.1038/ngeo262
Liang, H., Zhang, Y., Cao, L., and Cao, Y. (2020). Temporal relations between precipitable water vapour and precipitation during wet seasons based on nearly two decades of data from the Lhasa River valley, Tibetan Plateau. Int. J. Climatol. 40 (3), 1656–1668. doi:10.1002/joc.6293
Muller, C. J. (2013). Impact of convective organization on the response of tropical precipitation extremes to warming. J. Clim. 26 (14), 5028–5043. doi:10.1175/jcli-d-12-00655.1
NASA (2015). The tropical rainfall measuring mission (TRMM). NASA Glob. Precip. Meas. Mission. Available at: https://gpm.nasa.gov/missions/trmm
Neelin, J. D., Martinez-Villalobos, C., Stechmann, S. N., Ahmed, F., Chen, G., Norris, J. M., et al. (2022). Precipitation extremes and water vapor: relationships in current climate and implications for climate change. Curr. Clim. Change Rep. 8 (1), 17–33. doi:10.1007/s40641-021-00177-z
O'Gorman, P. A., and Schneider, T. (2009). The physical basis for increases in precipitation extremes in simulations of 21st-century climate change. Proc. Natl. Acad. Sci. U. S. A. 106 (35), 14773–14777. doi:10.1073/pnas.0907610106
Powell, S. W. (2019). Observing possible thermodynamic controls on tropical marine rainfall in moist environments. J. Atmos. Sci. 76 (12), 3737–3751. doi:10.1175/jas-d-19-0144.1
Radhakrishna, B., Fabry, F., Braun, J. J., and Van Hove, T. (2015). Precipitable water from GPS over the continental United States: diurnal cycle, intercomparisons with NARR, and link with convective initiation. J. Clim. 28 (7), 2584–2599. doi:10.1175/jcli-d-14-00366.1
Radhakrishna, B., and Rao, T. N. (2021). Diurnal variation of rainfall in the presence of large- and small-scale precipitating systems during different monsoon seasons over a complex terrain (gadanki) region. J. Appl. Meteorol. Climatol. doi:10.1175/jamc-d-20-0269.1
Radhakrishna, B., Rao, T. N., and Chandrakanth, G. S. V. (2022). Total column water vapor from INSAT-3D: assessments with ground-based GNSS receivers and GMI datasets at different temporal scales. IEEE Trans. Geosci. Remote Sens. 60, 1–8. doi:10.1109/tgrs.2022.3200716
Roderick, T. P., Wasko, C., and Sharma, A. (2019). Atmospheric moisture measurements explain increases in tropical rainfall extremes. Geophys Res. Lett. 46 (3), 1375–1382. doi:10.1029/2018gl080833
Rushley, S. S., Kim, D., Bretherton, C. S., and Ahn, M. S. (2018). Reexamining the nonlinear moisture-precipitation relationship over the tropical oceans. Geophys Res. Lett. 45 (2), 1133–1140. doi:10.1002/2017gl076296
Schiro, K. A., Ahmed, F., Giangrande, S. E., and Neelin, J. D. (2018). GoAmazon2014/5 campaign points to deep-inflow approach to deep convection across scales. Proc. Natl. Acad. Sci. 115 (18), 4577–4582. doi:10.1073/pnas.1719842115
Schiro, K. A., Neelin, J. D., Adams, D. K., and Lintner, B. R. (2016). Deep convection and column water vapor over tropical land versus tropical ocean: a comparison between the amazon and the tropical Western Pacific. J. Atmos. Sci. 73 (10), 4043–4063. doi:10.1175/jas-d-16-0119.1
Schröder, M., Lockhoff, M., Fell, F., Forsythe, J., Trent, T., Bennartz, R., et al. (2018). The GEWEX Water Vapor Assessment archive of water vapour products from satellite observations and reanalyses. Earth Syst. Sci. Data 10 (2), 1093–1117. doi:10.5194/essd-10-1093-2018
Sun, Y., Solomon, S., Dai, A., and Portmann, R. W. (2007). How often will it rain?. J. Clim. 20 (19), 4801–4818. doi:10.1175/jcli4263.1
Susskind, J., Blaisdell, J., and Iredell, L. (2014). Improved methodology for surface and atmospheric soundings, error estimates, and quality control procedures: the atmospheric infrared sounder science team version-6 retrieval algorithm. J. Appl. Remote Sens. 8, 084994. doi:10.1117/1.jrs.8.084994
Tian, B., Fetzer, E. J., and Manning, E. M. (2019). The atmospheric infrared sounder Obs4MIPs version 2 data set. Earth Space Sci. 6 (2), 324–333. doi:10.1029/2018ea000508
Tian, B., Manning, E., Fetzer, E., Olsen, E., and Wong, S. (2017). AIRS/AMSU/HSB version 6 level 3 product user guide.
Trenberth, K. (2011). Changes in precipitation with climate change. Clim. Res. 47 (1), 123–138. doi:10.3354/cr00953
Trenberth, K. E., Dai, A., Rasmussen, R. M., and Parsons, D. B. (2003). The changing character of precipitation. Bull. Am. Meteorol. Soc. 84 (9), 1205–1218. doi:10.1175/bams-84-9-1205
TRMM. Goddard Space Flight Center Distributed Active Archive Center (GSFC DAAC) (2015). The tropical rainfall measuring mission (TRMM) | NASA global precipitation measurement mission. Available at: https://gpm.nasa.gov/missions/trmm.
Troller, M., Geiger, A., Brockmann, E., Bettems, J. M., Bürki, B., and Kahle, H. G. (2006). Tomographic determination of the spatial distribution of water vapor using GPS observations. Adv. Space Res. 37 (12), 2211–2217. doi:10.1016/j.asr.2005.07.002
Tropical Rainfall Measuring Mission (TRMM) (2011). “Goddard Earth sciences data and information services center (GES DISC),” in TRMM (TMPA/3B43) rainfall estimate L3 1 month 0.25 degree x 0.25 degree V7. Available at: https://disc.gsfc.nasa.gov/datasets/TRMM_3B43_7/summary.
Van Baelen, J., Reverdy, M., Tridon, F., Labbouz, L., Dick, G., Bender, M., et al. (2011). On the relationship between water vapour field evolution and the life cycle of precipitation systems. Q. J. R. Meteorol. Soc. 137 (Suppl. 1), 204–223. doi:10.1002/qj.785
Wang, Z., Sun, M., Yao, X., Zhang, L., and Zhang, H. (2021). Spatiotemporal variations of water vapor content and its relationship with meteorological elements in the third Pole. Water 13 (13), 1856. doi:10.3390/w13131856
Wong, S., Fetzer, E. J., Schreier, M., Manipon, G., Fishbein, E. F., Kahn, B. H., et al. (2015). Cloud-induced uncertainties in AIRS and ECMWF temperature and specific humidity. J. Geophys Res. Atmos. 120 (5), 1880–1901. doi:10.1002/2014jd022440
Ye, H., Fetzer, E. J., Wong, S., Behrangi, A., Olsen, E. T., Cohen, J., et al. (2014). Impact of increased water vapor on precipitation efficiency over northern Eurasia. Geophys Res. Lett. 41 (8), 2941–2947. doi:10.1002/2014gl059830
Ye, H., Fetzer, E. J., Wong, S., Behrangi, A., Yang, D., and Lambrigtson, B. H. (2015). Increasing atmospheric water vapor and higher daily precipitation intensity over northern Eurasia. Geophys Res. Lett. 42 (21), 9404–9410. doi:10.1002/2015gl066104
Ye, H., Fetzer, E. J., Wong, S., and Lambrigtsen, B. H. (2017). Rapid decadal convective precipitation increase over Eurasia during the last three decades of the 20th century. Sci. Adv. 3 (1), e1600944. doi:10.1126/sciadv.1600944
Yue, Q., Fetzer, E. J., Kahn, B. H., Wong, S., Manipon, G., Guillaume, A., et al. (2013). Cloud-state-dependent sampling in AIRS observations based on CloudSat cloud classification. J. Clim. 26 (21), 8357–8377. doi:10.1175/jcli-d-13-00065.1
Zhang, F., Feng, P., Barriot, J. P., Hopuare, M., and Sichoix, L. (2018). “Correlation between integrated precipitable water vapor and precipitated water during the heavy rainfall event of february 2018 in the tahiti Island (South pacific),” in Proceedings of the 2018 International Conference on Earth Observations and Societal Impacts (ICEO&SI 2018), Hsinchu, Taiwan, 1–3 July 2018. Available at: https://www.researchgate.net/publication/325429291_Correlation_Between_Integrated_Precipitable_Water_Vapor_and_Precipitated_Water_During_the_Heavy_Rainfall_Event_of_February_2018_in_the_Tahiti_Island_South_Pacific.
Keywords: water vapor, precipitation intensity, AIRS, TRMM, tropics
Citation: Johnson SEA, Ye H, Fetzer EJ and Li J (2024) Satellite-observed precipitation and total column water vapor. Front. Environ. Sci. 12:1338678. doi: 10.3389/fenvs.2024.1338678
Received: 15 November 2023; Accepted: 15 March 2024;
Published: 03 April 2024.
Edited by:
Zhiyuan Hu, Sun Yat-sen University, ChinaReviewed by:
Jayanarayanan Kuttippurath, Indian Institute of Technology Kharagpur, IndiaCopyright © 2024 Johnson, Ye, Fetzer and Li. This is an open-access article distributed under the terms of the Creative Commons Attribution License (CC BY). The use, distribution or reproduction in other forums is permitted, provided the original author(s) and the copyright owner(s) are credited and that the original publication in this journal is cited, in accordance with accepted academic practice. No use, distribution or reproduction is permitted which does not comply with these terms.
*Correspondence: Sara E. A. Johnson, am9obnNvbi44OTk1QG9zdS5lZHU=
Disclaimer: All claims expressed in this article are solely those of the authors and do not necessarily represent those of their affiliated organizations, or those of the publisher, the editors and the reviewers. Any product that may be evaluated in this article or claim that may be made by its manufacturer is not guaranteed or endorsed by the publisher.
Research integrity at Frontiers
Learn more about the work of our research integrity team to safeguard the quality of each article we publish.