
94% of researchers rate our articles as excellent or good
Learn more about the work of our research integrity team to safeguard the quality of each article we publish.
Find out more
ORIGINAL RESEARCH article
Front. Environ. Sci., 09 April 2024
Sec. Environmental Economics and Management
Volume 12 - 2024 | https://doi.org/10.3389/fenvs.2024.1336322
This article is part of the Research TopicLow-Carbon Economy and Sustainable Development: Driving Force, Synergistic Mechanism, and Implementation PathView all 21 articles
 Chengxue Yu1
 Hongbo Zheng2*
As a critical engine for national economic growth, mega urban agglomerations have significant scale effects and economic and environmental spillover effects. This paper aims to study the green and low-carbon coordinated development of mega urban agglomerations to evaluate the country’s level of ecological civilization and its green and low-carbon development. The traditional research on green and low-carbon urban development tends to homogenize the redistribution theme, leading to significant errors in spatial allocation. This results in a lower accuracy of spatial distribution calculations for green development. Additionally, the research is constrained by data precision and methodology, making it challenging to measure the spatial differences in green and low-carbon development within urban clusters at the block level. This limitation hinders the ability to conduct detailed studies on the efficiency variations of green and low-carbon development in urban clusters. To achieve this aim, the study adopts the DPSR framework of the economic, resource, social, and ecological environment complex system and focuses on the Guangdong-Hong Kong-Macao Greater Bay Area in China. The study uses the entropy method, Gini coefficient method, and non-expected output super-efficiency SBM model to analyze the spatial effects and development efficiency of green and low-carbon development in this region from 2006 to 2020. The study results indicate that: (1) the overall level of green and low-carbon development in the Greater Bay Area is on the rise, with Shenzhen, Guangzhou, Foshan, and Zhuhai showing more stable development than other cities. Foreign direct investment and fixed asset investment in science and technology have significantly promoted green and low-carbon development. (2) The spatial differences in the region’s level of green and low-carbon development have narrowed trends, mainly due to differences between regions. However, well-developed cities such as Guangzhou and Shenzhen have taken the initiative to lead the development of other cities, fully leveraging their advantages in science and technology, geographical location, and other resources to promote the improvement of the external orientation of other cities. (3) The overall development efficiency of green and low-carbon in the Greater Bay Area is on the rise, with Guangzhou region showing overall stability, and Shenzhen region and Zhuhai region experiencing multiple ups and downs in their development. The three sub-regions show significant differences, but the balance and coordination of development have significantly improved. Finally, this study provides theoretical support for the future green and low-carbon development of urban clusters. It is advantageous for integrating the mainstream policy analysis framework of environmental economics with the complex adaptive systems of urban clusters. The research expands the boundaries of existing theoretical studies and offers new methodological approaches for interdisciplinary research. The study achieves a balance between the opportunity effects of green and low-carbon development and environmental policy constraints in super large urban clusters, effectively enhancing resource utilization efficiency in these clusters.
To balance the conflict between the environment and the economy, green and low-carbon development has become a globally recognized consensus. Many countries believe that green and low-carbon development is crucial for promoting economic and social transformation (Masuda et al., 2022). Urban agglomerations, as spatial carriers for promoting green and low-carbon development, can explore the relationship between regional sustainable development and green development efficiency, which can help optimize the structure and promote the coordinated development of urban agglomerations. The factors driving the development of urban agglomerations from regional economic entities to world-class scales are complex. As early as before 1945, Western countries had begun to study the development of urban agglomerations. In the 1950s, French geographer Jean Gottmann used the term “Megalpolis” to describe and analyze the densely populated area of cities on the northeast coast of the United States (He et al., 2019). The rise of world-class urban agglomerations often means rapid development of regional productivity, diversified regional economic structure, a significant increase in regional GDP, and the ability of regional economies to occupy a favorable position in a country or even the world economy. However, even in developed countries, there are contradictions between urban agglomeration construction and the green and low-carbon development. Currently, the development of Chinese urban agglomerations is mainly characterized by fast economic growth, high agglomeration efficiency, large functional radiation, and strong regional linkage, but its uneven development is gradually becoming apparent. Due to differences in resource endowments, geographical location, openness, innovation ability, talent attraction, and other aspects, the Guangdong-Hong Kong-Macao Greater Bay Area, including nine cities in Guangdong Province, Guangzhou, Shenzhen, Zhuhai, Foshan, Huizhou, Dongguan, Zhongshan, Jiangmen, and Zhaoqing, as well as the two special administrative regions of Hong Kong and Macao, has become one of the most open and economically active regions in China. It is also one of the world’s most open, innovative, and economically dynamic mega urban agglomerations, occupying an important strategic position in the development of the Chinese and even the world economy. However, the priority development of the Greater Bay Area has also brought about environmental problems such as high energy consumption and pollution. Therefore, studying the green and low-carbon development of the Greater Bay Area is not only a new attempt to promote the formation of a new pattern of comprehensive opening up in China’s new era, but also a new practice to promote the development of the “one country, two systems” policy. Upon reviewing existing literature, it is evident that current research is predominantly focused on the singular development of green and low-carbon initiatives in individual cities. Both research methods and approaches are tailored to the study of a single city, lacking a comprehensive understanding of inter-city dynamics. Existing green assessment studies tend to rely heavily on static analyses, with a noticeable absence of dynamic comparative analyses. Therefore, this paper strategically selects evaluation indicators and employs entropy method, Gini coefficient method, and non-expected output super-efficiency SBM model to analyze the spatiotemporal variations and green efficiency changes in the city clusters of the Guangdong-Hong Kong-Macao Greater Bay Area in China. On one hand, this approach aims to elevate the theoretical and methodological standards of domestic and international research on green efficiency, providing theoretical support for the economic development of city clusters in the Greater Bay Area. On the other hand, it facilitates a better understanding of the true state of green efficiency in the city clusters, delving into the patterns of green development in urban clusters. This research holds significant implications for China's shift in development paradigm and the enhancement of development quality in city clusters.
Green and low-carbon development has always been highly valued by Chinese and foreign scholars, experts, and governments. It is an economic growth and social development model that aims for efficiency, harmony, and sustainability, emphasizing economic growth and environmental protection, and making an important pillar of environmental protection for achieving sustainable development. Green and low-carbon development is a sign of China’s transition from rapid economic growth to high-quality development (Lin et al., 2015; Liu et al., 2019; Chengxue and Chen, 2021; Tan et al., 2022). Green and low-carbon development efficiency is used to measure the comprehensive development efficiency of the complex system constructed by the economy, society, and environment under the constraints of ecological environment capacity and resource-carrying capacity. It is an important manifestation of the coordinated relationship between the economy and the environment under the guidance of the green development concept. As the basic carrier and objective witness of green and low-carbon development, cities’ geographical location, resource endowment, and ecological environment differences will directly affect the efficiency of urban green development (Feng et al., 2020).
The higher the efficiency of green and low-carbon development, the lower the cost and the better the results in achieving green and low-carbon development goals, which can contribute to urban green and low-carbon development. Currently, as the spatial carrier of green and low-carbon development, cities are the key nodes of interaction between various elements such as nature, economy, society, and culture. Urban green and low-carbon development profoundly affect the pattern of green and low-carbon development in the country and even the world (Liu et al., 2019). As the main form of new urbanization, urban agglomerations are a high-level spatial organization form for urban development and economic activity aggregation. Its formation is the inevitable result of economic and urban natural evolution, and therefore, urban agglomerations are an important way to drive regional economic development (Liu and Qin, 2019; Lin and Memg, 2021). However, due to significant differences in ecological environment, resource endowment, technological progress, and industrial structure among urban regions, bring severe challenges to the coordinated improvement of urban green economic performance. With the continuous deepening of the implementation of the urban economic belt strategy, the mutual connection and spatial dependence between regions have been continuously enhanced, and spatial spillover effects have become an important factor that cannot be ignored in regional coordinated development (Pan, 2012; Zhang, 2016). At present, scholars take cities and urban agglomerations as research objects, measure their green and low-carbon development efficiency and regional disparities, and analyze their green and low-carbon development levels in terms of time and spatial characteristics. There is more and more relevant literature, and examining the influencing factors of urban green and low-carbon development efficiency has become an important research direction.
(1) In terms of the research scope, due to the differences in the spatial pattern of regional green and low-carbon development, the research scope has expanded from the national level of urban green and low-carbon development evaluation to inter-provincial differences, urban agglomerations, and economic zones. Under the macro environment of economic zones, urban agglomerations, or metropolitan areas (Meng et al., 2014; Guanghui et al., 2022; Ji et al., 2020), relevant research has involved multiple fields, such as the studies of Huang and Wu. (2019), Cheng et al. (2019), Cheng et al. (2019), Lu et al. (2020), Saurav et al. (2021), and Wang et al. (2022).
(2) In terms of the construction of indicator systems, researchers have begun to shift from single indicators to comprehensive evaluation with multiple indicators, starting from a comprehensive research dimension to construct a multi-angle indicator system, which is conducive to formulating differentiated urban green development strategies (Bin and Li, 2022). For example, Li et al. (2014) constructed the “Human Green and Low-Carbon Development Index” based on the two dimensions of socio-economic sustainable development and ecological resource and environmentally sustainable development, and calculated the green and low-carbon development index of 123 countries. Under the PSR framework, Wang (2015), Zhao and Wu. (2018), and Yuan et al. (2022) constructed a green and low-carbon development evaluation indicator system from the three levels of pressure, state, and response. Xiao et al. (2016), Shi et al. (2018), and Song and Xin. (2020) based on the DPSIR model, constructed a green and low-carbon development evaluation indicator system including five aspects: driving forces, pressures, states, impacts, and responses, evaluated and analyzed the green and low-carbon development status of the selected regions. Wang. (2015) constructed a resource-based city low-carbon transformation evaluation indicator system with 36 indicators from seven aspects: economic transformation, social transformation, resources, environment, energy consumption and emissions, low-carbon technology, and low-carbon policies.
(3) In terms of research methods, scholars have gradually shifted from single mathematical and statistical analysis to spatial analysis and geographic statistical analysis, and from single method measurement to the comprehensive application of multiple methods. These methods have provided a more comprehensive and in-depth understanding of urban green development. For example, (Wang et al., 2010; Wang and Huang, 2014; Zhou et al., 2020),the directional distance function of SBM has been used to measure the changes in green development efficiency of cities under the influence of resource and environmental factors. (Yan and Zhang, 2022).In addition, GIS visualization, and other methods have been used to systematically investigate the spatial non-uniformity, regional disparities, and dynamic evolution trends of green and low-carbon development. (Zheng et al., 2019).Social network analysis and exploratory spatial data analysis have been used to analyze the dynamic evolution of urban agglomeration economic networks. (Tan et al., 2022; Yang et al., 2022).Spatial econometric models have been used to explore the factors that affect the green development efficiency of different urban agglomerations. (Duan and Tang, 2022; Li et al., 2022; Mao et al., 2023; Ye and Chen, 2021).These researchers have combined fixed Malmquist-Luenberger (ML) index and slack-based measurement (SBM) models to analyze the changes in urban green development efficiency in time and space dimensions. (Yi et al., 2023).Furthermore, the difference model has been used to explore the mechanisms of carbon emission reduction and regional integration from multiple perspectives (Wang et al., 2023). The Spatial Durbin model, coefficient of variation, and other methods have been applied to analyze the overall differences, distribution dynamics, and convergence trends of green development in urban agglomerations.
From the perspective of the integrated development of the Guangdong-Hong Kong-Macao Greater Bay Area, some issues need to be addressed in existing research, such as the incomplete research framework and indicators, which need to be further expanded to meet Chinese maga urban agglomerations’ status. In addition, there is a lack of relevant research on the measurement of green and low-carbon development efficiency in the Guangdong-Hong Kong-Macao Greater Bay Area and its coordination study. Therefore, this paper combines the national strategic background of the integrated development of the Guangdong-Hong Kong-Macao Greater Bay Area to study the coordinated development efficiency of green and low-carbon in the region. As Hong Kong and Macao have a high ranking in green innovation efficiency within the Greater Bay Area, and their industrial scale is relatively small compared to other cities in the Greater Bay Area, with their advantages mainly concentrated in modern service industries such as tourism, finance, export processing, and gambling, and the proportion of the secondary industry is only about 3%, their development has had a relatively small impact on the environment. Therefore, Hong Kong and Macao have already met the requirements for green and low-carbon development (Dong et al., 2021).
While the studies mentioned above encompass provincial-level, prefectural-level cities, and urban clusters, there is limited research on the temporal dimensions of the city clusters in the Guangdong-Hong Kong-Macao Greater Bay Area. This gap makes it challenging to comprehensively identify the influencing factors of green development and deduce the spatiotemporal evolution characteristics of this city cluster. The scientific validity of indicator selection needs further clarification; otherwise, it may lead to biases in the results of efficiency assessments.In light of the aforementioned considerations, this paper selects the Guangdong-Hong Kong-Macao Greater Bay Area as the research focus to investigate the efficiency of collaborative green and low-carbon development. Given the relatively small industrial scale in the Hong Kong and Macao regions, with a concentration on modern service industries such as tourism, finance, export processing, and gaming, where the secondary industry contributes only about 3%, these regions have already met the requirements for green and low-carbon development (Dong et al., 2021). Consequently, this study ultimately chooses panel data from nine cities in the Greater Bay Area (excluding Hong Kong and Macao) for analysis.To better gauge the level of green and low-carbon development in the Greater Bay Area city cluster, we comprehensively review and summarize relevant studies. We select indicators from four dimensions: economic, social, resource, and environmental, to construct an evaluation index system for green and low-carbon development efficiency in the Greater Bay Area. Subsequently, we evaluate this system. Additionally, we divide the nine cities in the Greater Bay Area into three regions based on economic correlation, employing the Dagum Gini coefficient method to illustrate the differences in collaborative green and low-carbon development among the three regions. This method decomposes the differences into intra-regional and inter-regional components, quantifying the contributions of different sources to the overall differences.Efficiency assessment of green and low-carbon development is the optimal way to measure the balance between resource inputs and outputs, reflecting the comprehensive impact of various factors rather than the isolated outcomes of individual factors. Therefore, this paper concludes by using the non-expected super-efficiency SBM model to calculate the efficiency of green and low-carbon development. It explores the spatiotemporal evolution and variations in efficiency among the three regions of the Greater Bay Area, aiming to facilitate the coordinated development of the economy, society, and resource environment in the region. This endeavor contributes to both theoretical and practical aspects of ecological civilization construction.
The Chinese Sustainable Development Plan for Resource Cities (2013–2020) constructed a performance evaluation index system for green and low-carbon development of resource-based cities from three levels: economy, society, and environment (Smeets et al., 1999). In 1993, the European Environment Agency proposed the DPSIR model, which means that the driving force of the system leads to the generation of pressure, the pressure forces some changes in the system’s state, the changes in the state affect the system, and these effects prompt humans to make direct or indirect responses (Li et al., 2016; Li and Liu, 2015). However, due to the complexity of the factors affecting the green and low-carbon development of the Guangdong-Hong Kong-Macao Greater Bay Area, this article combines the DPSIR model with the actual situation of the Guangdong-Hong Kong-Macao Greater Bay Area and ultimately chooses the classic Driving Force-Pressure-State-Response (DPSR) theoretical framework to construct an evaluation index system for the green and low-carbon development of the Guangdong-Hong Kong-Macao Greater Bay Area from four dimensions: economy, society, resources, and environment. This framework can cover the elements needed for social, economic, resource, and environmental aspects and describe the complex causal relationships between systems. Therefore, the DPSR model is one of the widely used evaluation models in the evaluation of urban ecological sustainable development. The driving forces represent the fundamental causes of environmental issues, while pressures denote the direct impacts of these driving forces on the environment. Driving forces can include factors such as population growth and economic development, while pressures are the environmental stresses resulting from these driving forces, such as resource utilization, energy consumption, and pollution emissions. Environmental conditions reflect the quality and sustainability of the environment, such as waste disposal rates and the availability of water resources.The escalation of environmental pressures can lead to a deterioration in environmental conditions. For example, increased environmental pressures, such as pollution emissions, can result in water scarcity due to overutilization of water resources. These environmental conditions have implications for the responses of governments, societies, and individuals. Changes in environmental conditions may prompt attention and actions towards addressing environmental issues.Response measures exert an influence on driving forces; the implementation of environmental protection measures and policies can potentially alter the fundamental causes driving environmental issues. Combining the DPSR framework system, this article takes the green and low-carbon development efficiency level of the urban agglomeration as the first-level target layer, the second level as the criterion layer, including four categories of indicators: driving force (D), pressure(P), state (S), and response(R). Different criterion layers represent different processes, and the combination of the four criterion layers can reflect the green and low-carbon development level of the urban agglomeration comprehensively. The third level is the indicator layer, which involves 39 specific indicators in aspects such as resources, environment, population, economy, and society. These indicators were designed based on the principles of completeness, scientificity, and operability, and were obtained by synthesizing relevant literature from Chinese and foreign scholars (Li et al., 2016; Fu and Wu, 2016; Li et al., 2016; Ge et al., 2017; Ye et al., 2017; Yu et al., 2020; Li et al., 2022; Zheng et al., 2020; Yun et al., 2020). The evaluation index system for the green and low-carbon development of the Guangdong-Hong Kong-Macao Greater Bay Area constructed in this article is shown in Table 1.
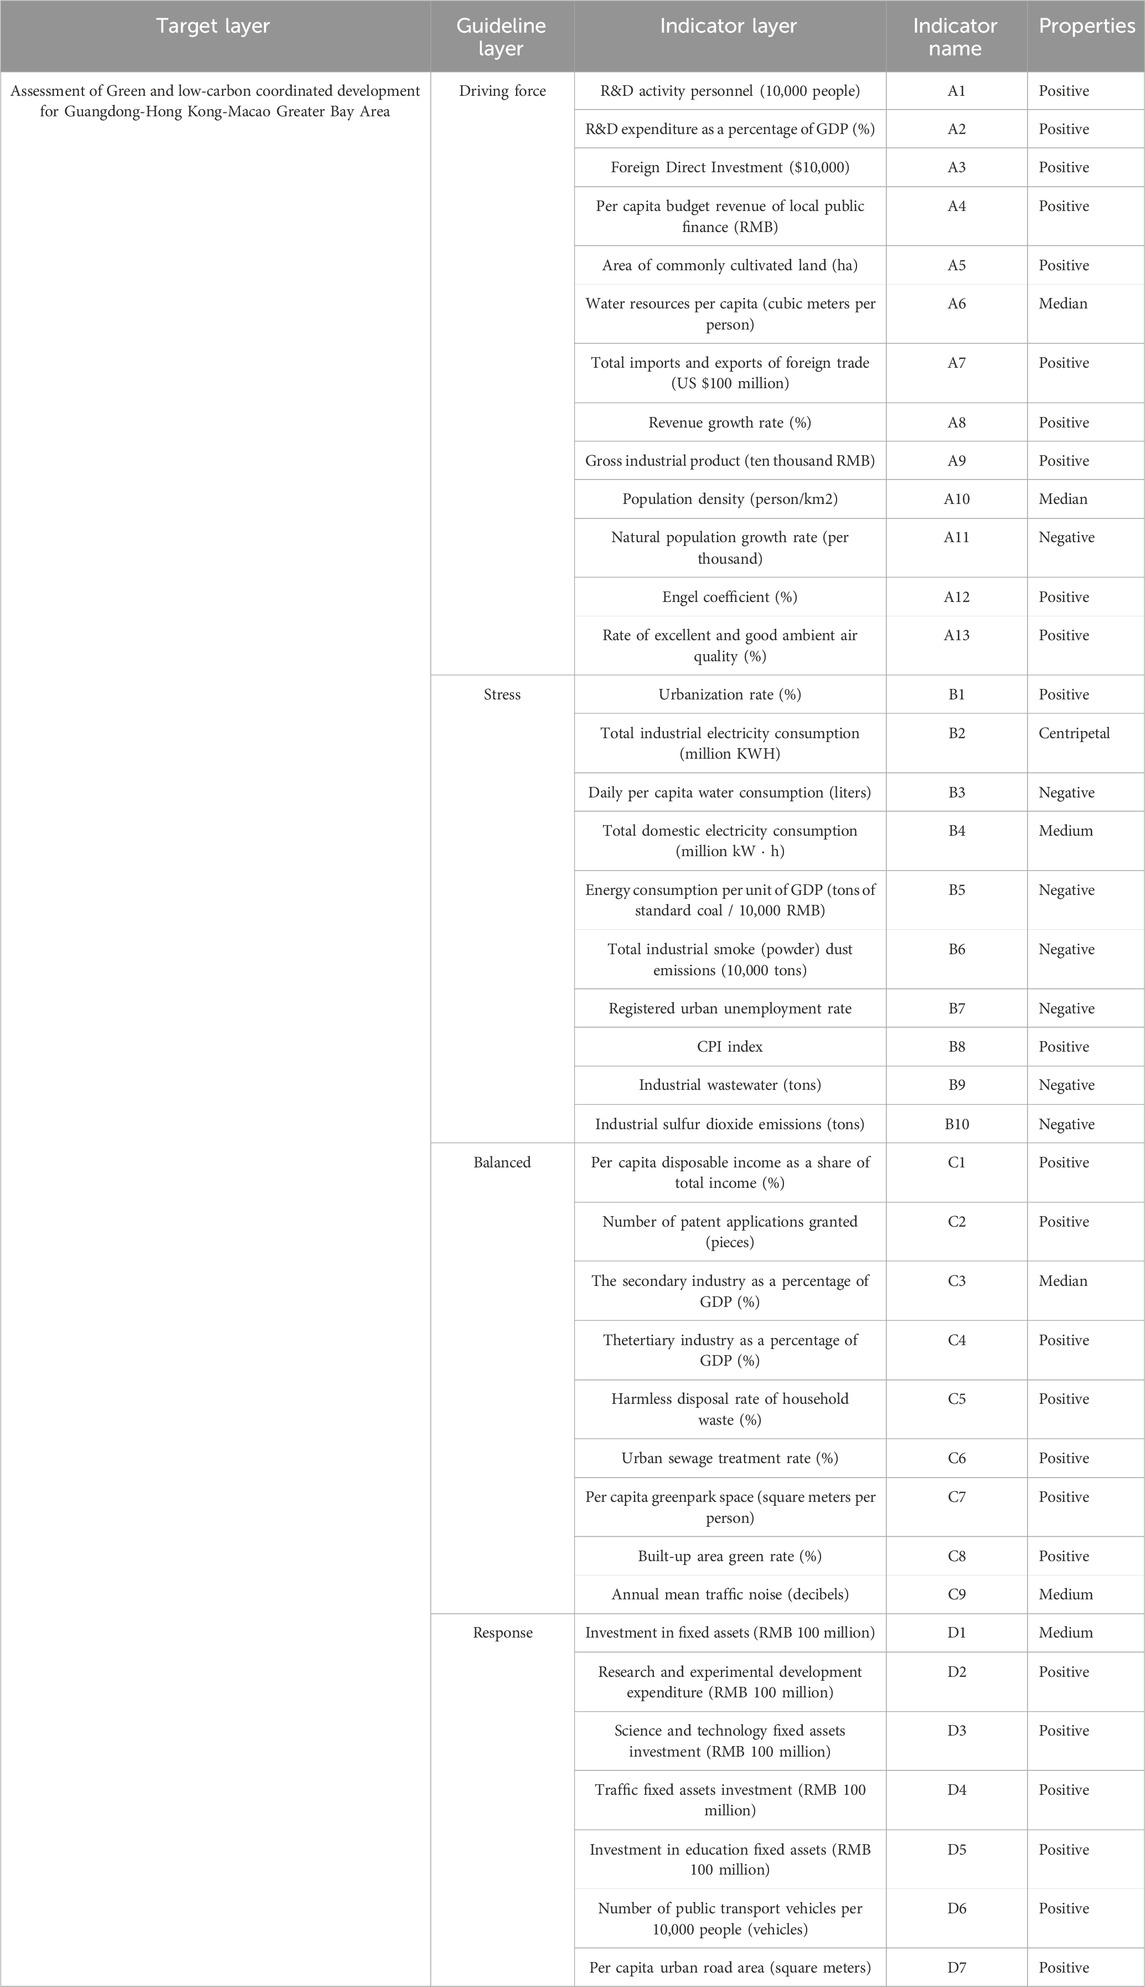
Table 1. The evaluation index system of the green and low-carbon development for the Guangdong-Hong Kong-Macao Greater Bay Area
The data were sourced from the statistical yearbooks and public reports of various cities in the Guangdong-Hong Kong-Macao Greater Bay Area for the years 2006–2020. This includes publications such as the “China Urban Construction Statistical Yearbook” and the “Guangdong Statistical Yearbook.” Local statistical yearbooks of nine cities, namely Guangzhou, Dongguan, Foshan, Huizhou, Jiangmen, Shenzhen, Zhaoqing, Zhongshan, and Zhuhai, were also utilized. In instances of missing data, interpolation methods were employed for completion, and the dataset underwent preprocessing to meet statistical requirements.
The process of standardization serves to eliminate data outliers and missing values, enhancing data integrity and credibility. Additionally, it facilitates easier data handling, reducing errors and uncertainties resulting from variations. This contributes to a more accurate measurement of the contribution of each indicator to the final outcome, leading to a better understanding of the extent of their impact. Overall, the impact of standardization on results is manifested in the improvement of model stability, interpretability, accuracy in measuring contributions, reduction of overfitting risks, and enhancement of predictive accuracy. These effects collectively ensure that the model adapts more effectively to the data, yielding reliable results.
Supposed,
(1) The standardization of positive indicators
The larger value of the positive indicator means the better ecological environment quality is. The standardization formula of the positive indicator is:
(2) Standardization of negative indicators
The greater value of negative indicators means the worse the quality of the ecological environment is. The standardization formula for negative indicators is as follows:
(3) Standardization of medium index
The medium indicator refers to the indicator closer to a specified value, the better the indicator. The standardized formula for the median index is:
(4) Determination of index weight
The methods for calculating weights include the Delphi method, Analytic Hierarchy Process (AHP), coefficient of variation method, and entropy weight method, among others. However, the Delphi method and AHP are subjective and may affect the objectivity of the evaluation results. Therefore, this study selected the entropy weight method to calculate the weights of the indicators. The entropy weight method is a commonly used objective weighting method. Generally, the larger the information entropy value, the more balanced the system’s structure, and the smaller the difference, the smaller the weight of the indicator, and vice versa. The steps for calculating weights using the entropy weight method are as follows:
Step 1. Determination of specific gravity
Step 2. Entropy calculation
Step 3. Coefficient of variation calculation
Step 4. Calculation of weight, denoted as a weight vector
By calculating the green and low-carbon development level for each city from 2006 to 2020, a quantitative basis can be provided. The calculation method of the comprehensive index of the green and low-carbon development levels is shown in Formula (8):
Where,
The role of the green and low-carbon development comprehensive index: (1) Panel regression is made on the secondary index data to explore the interaction mechanism; (2) It can be used as the input data to evaluate the efficiency model for urban green and low-carbon development.
The decomposition of regional disparities commonly employs the methods of the Theil index and Dagum Gini coefficient. However, due to the failure of the Theil index to consider the cross-distribution of sub-group samples, it has certain limitations. In contrast, the Dagum Gini coefficient method is utilized to reflect the concentration of economic and social phenomena in spatial distribution. A higher Dagum Gini coefficient indicates a higher spatial concentration and greater spatial imbalance (Dagum, 1997). The Dagum Gini coefficient is an improved version of the traditional Gini coefficient, capable of measuring disparities within each region, disparities between regions, as well as measuring overlap and density in regions, reflecting relative disparities. This method effectively addresses the issue of sample cross-over in traditional methods and helps identify the causes of regional disparities (Miao et al., 2021; Li et al., 2022). Consequently, this study employs the Dagum Gini coefficient method to assess the differences in the collaborative development of green and low-carbon initiatives in the Guangdong-Hong Kong-Macao Greater Bay Area.The overall Dagum Gini coefficient G can be divided into contributions from within-region disparities (Gw), net value differences between regions (Gnb), and super-variant density contributions (Gt). These components can reflect the differences in the level of green and low-carbon development within the Greater Bay Area, disparities in green and low-carbon development levels among regions, and the regional imbalances caused by the overlapping intersections between regions.
According to the definition of Dagum Gini coefficient, n represents the number of all cities. Considering the integrity of the data, the number of Guangdong-Hong Kong-Macao Greater Bay Area selected here is 9. Y represents the average of the green and low-carbon development level of the nine cities in the Guangdong-Hong Kong-Macao Greater Bay Area. k is the number of regions divided. In this paper, k =3. j(h) represents the region defined, i and r represent the cities in region j and h respectively, nj and nh represent the number of cities in region j and h respectively, and yji(yhr) represents the economical high-quality level of the city i(r) in region j(h). The Gini coefficient Gjj inside region j can be expressed as formula (9), and the Gini coefficient between region j and h can be described as formula (10):
yj(yh)said the area within the city green of j (h), the average development level of low carbon, | yji-yhr| said cities in the region j (h), I (r) of the absolute value of green low carbon development level difference. We define the following variables:
Where Qj represents the proportion of the number of cities in region j in the total number of cities; sj represents the sum of the green and low-carbon development levels of all cities in region j in the sum of nine cities. djh represents the difference of the green and low-carbon development levels between regions j and h, which can also be defined as the mathematical expectation of the sum of all sample values of yji-yhr>0 in regions j and h. qjh is the super variable first moment, representing the mathematical expectation of the sum of all the sample values of yhr-yji> 0 between region j and h; Djh is to measure the mutual influence of the green and low-carbon development levels between regions j and h in Guangdong-Hong Kong-Macao Greater Bay Area; Function F is the cumulative density function of the green and low-carbon development level of Guangdong-Hong Kong-Macao Greater Bay Area. Contribution G of intra-regional difference, contribution Gt of inter-regional net difference and contribution Gnb of super-variable density.
The presence of uncertainties, such as data collection gaps and completion challenges, often leads to suboptimal solutions for the originally sought objectives. Therefore, it is imperative to identify an optimization approach that mitigates the impact of data uncertainty on the optimization solution. In this study, we employ the super-efficiency Slacks-Based Measure (SBM) model, which effectively addresses the issue of data uncertainty.(Tone, 2001) introduced a novel Data Envelopment Analysis (DEA) model known as the SBM model. This model is characterized as a non-radial and non-oriented DEA model. The term “radial” implies proportional changes in inputs or outputs when evaluating efficiency, while “oriented” necessitates model selection based on inputs (assuming outputs remain constant) or based on outputs (assuming inputs remain constant). A drawback of the SBM model proposed by (Tone, 2001) is that the computed efficiency values are restricted to the (0, 1) range, with efficient Decision Making Units (DMUs) assigned a value of 1, and regions with values less than 1 considered inefficient. Consequently, it becomes challenging to compare efficient DMUs. In response to this limitation, (Tone, 2002) introduced the super-efficiency SBM model. The industrialization of production has elevated labor productivity, fostering increased economic and trade activities among nations. Simultaneously, industrial production inevitably generates a significant volume of pollutants, such as wastewater, emissions, and residues (referred to as undesirable outputs). Building upon the SBM model proposed by (Tone, 2001), (Tone, 2003) developed the Undesirable Outputs SBM model. Assuming there are n decision-making units, each comprising three elements: inputs, desirable outputs, and undesirable outputs (e.g., pollutants like wastewater, carbon dioxide, and particulate matter). Consequently, the most efficient production method for economic development is deemed to be green production: achieving more desirable outputs with fewer inputs and reducing undesirable outputs. The model by (Cheng, 2014) possesses advantages that effectively address the issue of non-comparability among efficient decision-making units, resolving the limitations of traditional SBM models in comparing and ranking decision-making units with efficiency values equal to 1. The calculation formulas are shown in formulas (19) to (24).
The entropy method is used to process 39 indicators in nine cities, and the weight calculation results are shown in Table 2, and the change trend of each secondary index is shown in Figures 1–4.
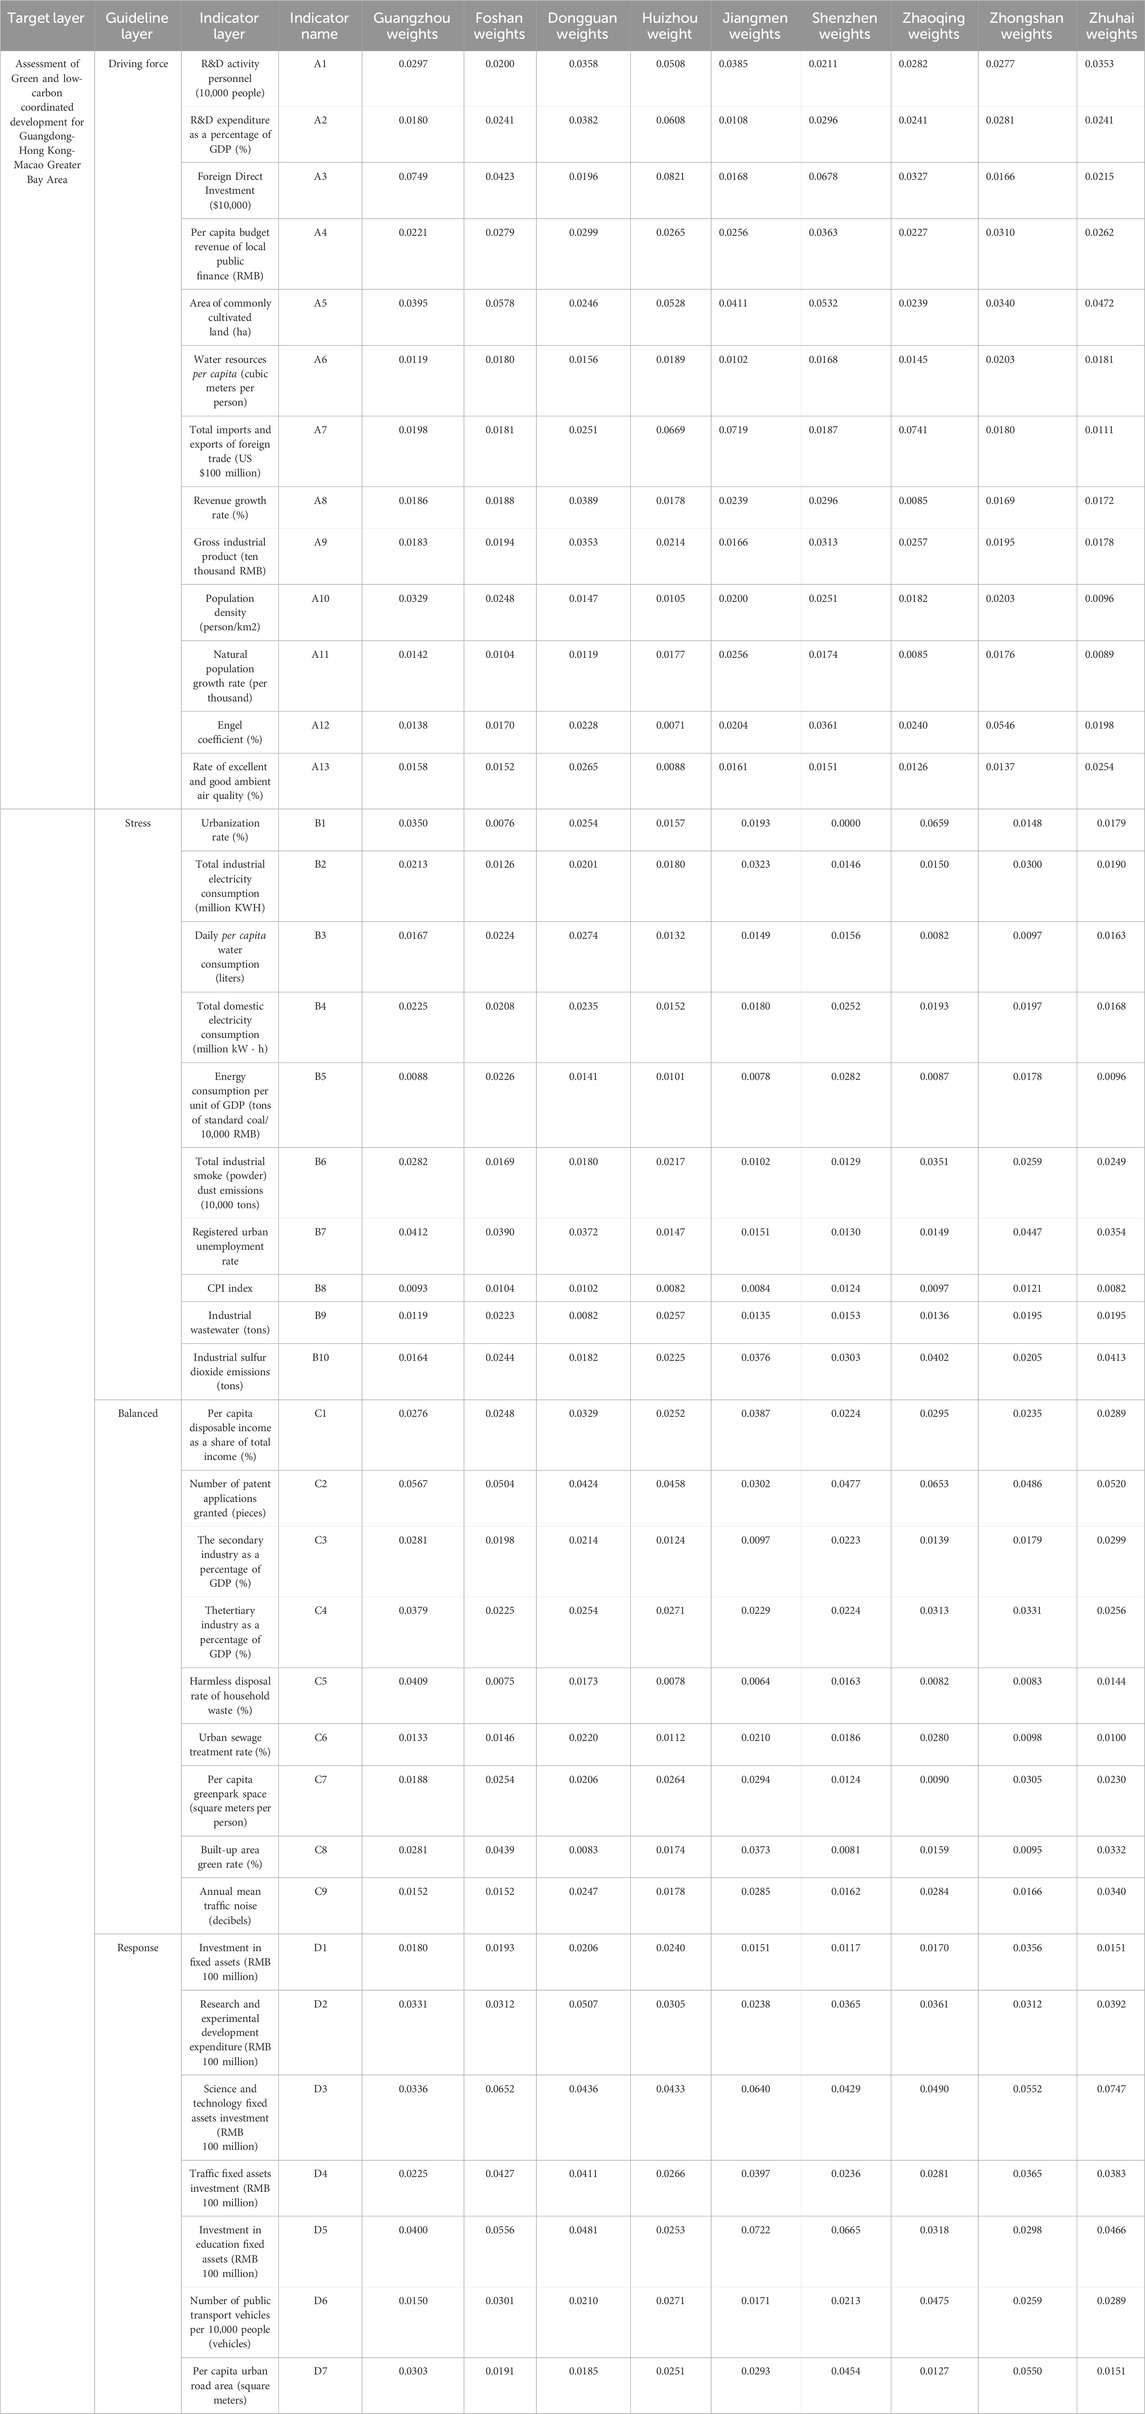
Table 2. Weights of 39 third-level indicators in nine cities.
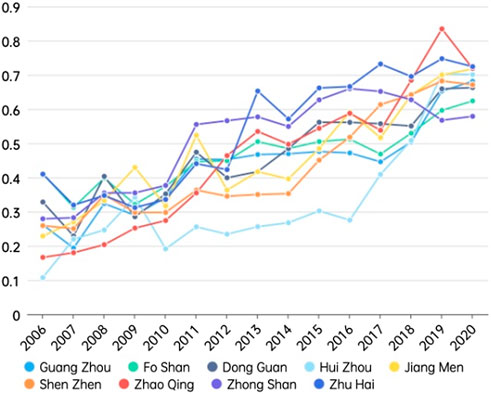
Figure 1. The trend of driving force indicators in nine cities of Guangdong, Hong Kong and Macao.
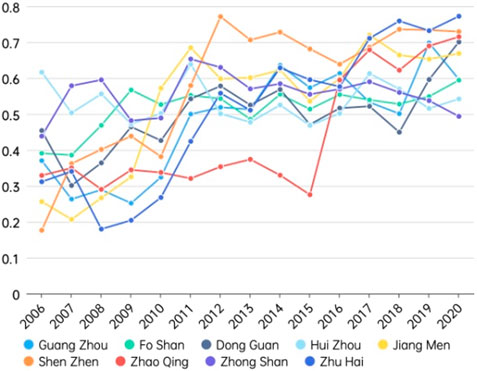
Figure 2. The trend of pressure indicators in nine cities of Guangdong, Hong Kong and Macao.
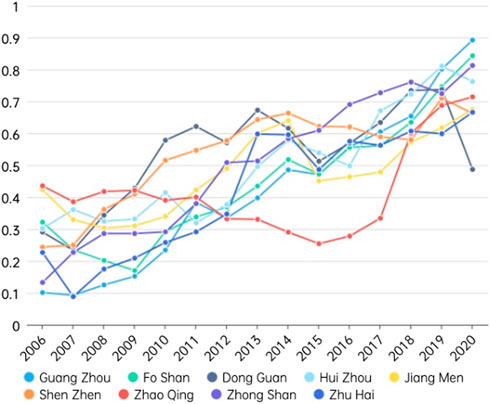
Figure 3. The trend of equilibrium indicators in nine cities of Guangdong, Hong Kong and Macao.
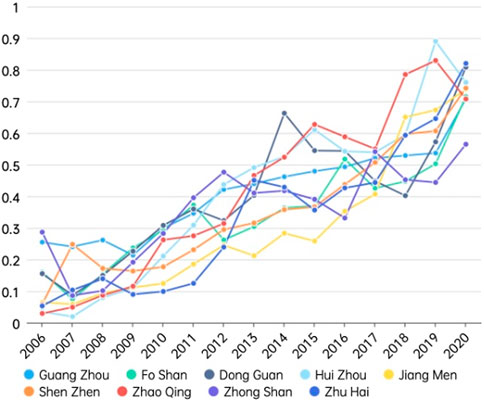
Figure 4. Response index trends of nine cities in Guangdong, Hong Kong and Macao.
From Figure 1, Figure 2, Figure 3, Figure 4, it can be observed that the driving force indicators of the nine cities show an overall upward trend. Zhaoqing experienced rapid growth in driving force indicators from 2017 to 2018, increasing from 0.538 to 0.834. This was mainly due to a significant increase in foreign direct investment, total import and export volume, and fiscal revenue growth rate. Specifically, foreign direct investment increased by 27 times year-on-year in 2018, and the total import and export volume increased by 4.12 times year-on-year in 2017.
Huizhou’s driving force indicators grew slowly from 2009 to 2015, mainly due to a significant decrease in the proportion of R&D funds to GDP in 2009 and a slow growth rate in the later period. Zhuhai experienced significant growth in 2012, mainly due to a significant increase in the number of R&D personnel, which increased by 25.3%. Overall, factors such as foreign trade, scientific research, and R&D play a crucial role in drivinga city’s green and low-carbon developmenty. The pressure system indicators show significant differences between different cities.
The fluctuation trends of pressure indicators in Huizhou, Zhongshan, Foshan, and Dongguan are relatively stable. Jiangmen, Shenzhen, Guangzhou, Zhuhai, and Zhaoqing experienced a sharp increase in pressure indicators at a certain point in time, followed by a gradual stabilization. Among them, Jiangmen’s pressure indicators showed a significant increase in 2009, which may be related to a large deviation between the total industrial electricity consumption and the ideal value.
Shenzhen experienced a significant increase in pressure indicators from 2010 to 2011, which may be mainly due to a large deviation between the total residential electricity consumption, total industrial electricity consumption, and the ideal value. Guangzhou’s pressure indicators showed a small but rapid increase in 2010, which may be related to the urbanization rate increase and total industrial electricity consumption. Zhuhai experienced a significant increase in pressure indicators from 2010 to 2011, mainly due to the increase in total industrial smoke (dust) emissions, total industrial electricity consumption, and industrial wastewater discharge caused by industrial development. Zhaoqing’s pressure indicators increased in 2015, mainly due to a significant increase in urbanization rate. The balanced indicators show an overall upward trend with fluctuations. However, Zhaoqing experienced a slight fluctuation and decline from 0.39 to 0.334 from 2010 to 2016, mainly due to a significant gap in patent applications and authorizations compared to other cities. Dongguan’s balanced indicators significantly decreased in 2019, which may be mainly due to the decrease in per capita park and green space area from 24.06 square meters/person to 19.2 square meters per person.
The overall trend of other cities is still positive. The response system shows an overall upward trend, indicating that the response capacity of the nine cities to the governance of green and low-carbon development is gradually improving. Dongguan’s response indicator score was 0.663 in 2013, much higher than in other cities. This is mainly due to the significant increase in various response capacity indicators, such as fixed asset investment, research and development expenditure, technology fixed asset investment, transportation fixed asset investment, education fixed asset investment, etc. Among them, the year-on-year growth rate of technology fixed asset investment reached 138.14%. Huizhou’s response indicator score was about 0.9 in 2018, higher than other cities. This is mainly due to the significant increase in technology fixed asset investment, which increased from 128 million yuan in 2017 to 1.018 billion yuan in 2018, a year-on-year increase of 6.95 times.
To reflect the inter-regional coordination relationship of green and low-carbon development among the nine cities more intuitively in the Guangdong-Hong Kong-Macao Greater Bay Area, this paper combined the nine cities into three regions based on spatial geography and Guangdong provincial policy guidelines. The Guangzhou region includes Guangzhou, Foshan, and Zhaoqing; the Shenzhen region includes Huizhou, Dongguan, and Shenzhen; and the Zhuhai region includes Jiangmen, Zhongshan, and Zhuhai; the scores and rankings of the secondary indicators of the three regions are shown in Table 3.
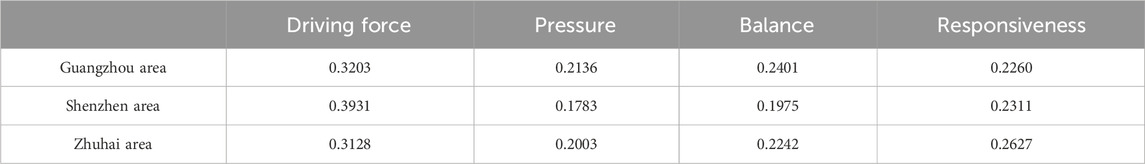
Table 3. Scores and rankings of secondary (criterion layer) indicators of three regions.
In terms of driving force indicators, the Shenzhen region ranks first with a score of 0.3931, indicating that this region has performed well in promoting urban development through factors such as per capita local public finance budget revenue, providing strong support for green and low-carbon development. These factors have driven green and low-carbon development in a positive direction. In terms of pressure indicators, Guangzhou ranks first with a score of 0.2136, indicating that the Zhuhai region is the city facing the greatest pressure in green and low-carbon development among the three regions, with a significant contradiction between fragile environment and economic and social development. In terms of balanced indicators, the Guangzhou region ranks first with a score of 0.2401, indicating that this region has done the best in balancing and coordinating green and low-carbon development, with the social and economic development tending to improve, the city’s air quality effectively improved, and the economic structure tending to be reasonable. In terms of response indicators, the Zhuhai region ranks first with a score of 0.2627, indicating that the government in this region has effectively implemented investment policies in green and low-carbon development governance. Under the government’s promotion, green and low-carbon development has been increasingly valued by all sectors of society, which has helped to maintain the optimal state of the response system.
After normalizing the tertiary indicators of the nine cities and multiplying them by their relative weights, the normalized data results of the secondary indicators can be obtained. Multiplying the normalized values of the secondary indicators by their corresponding weights, the normalized results of the primary indicators can be obtained, which is the green and low-carbon development value of the nine cities (view Table 4) and the changing trend (view Figure 5). This value can be used as a comprehensive development indicator to measure cities’ green and low-carbon development.
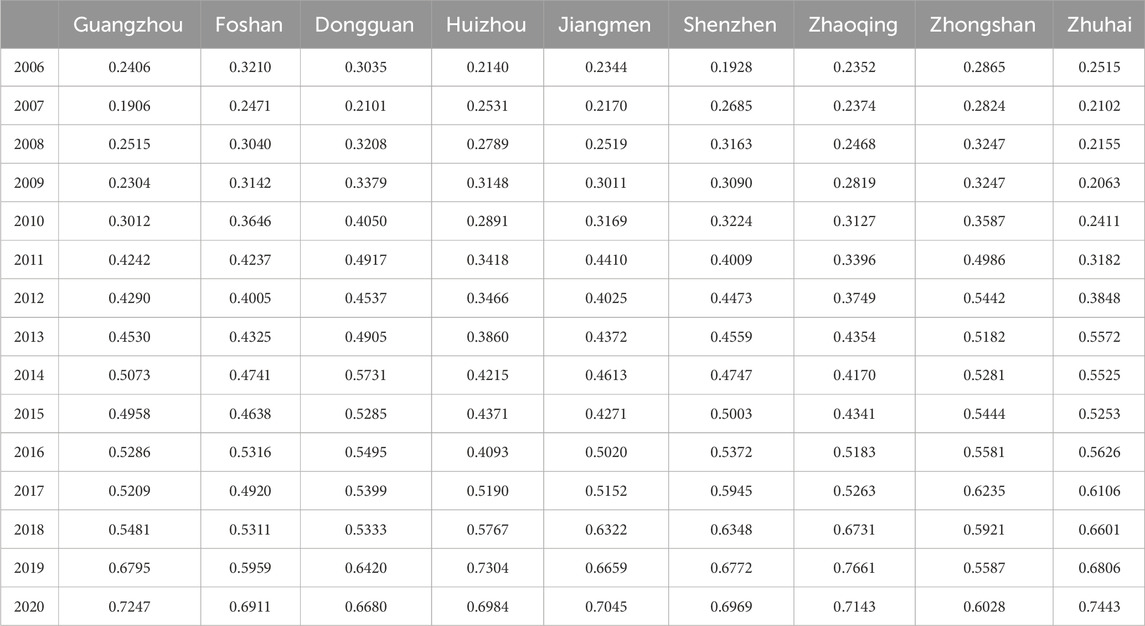
Table 4. The green and low-carbon development values of nine cities.
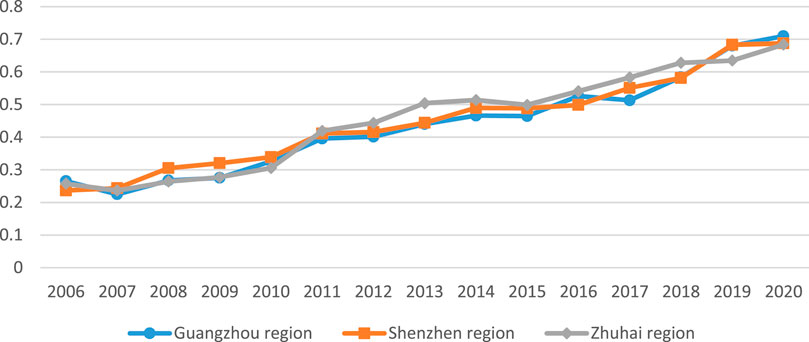
Figure 5. The green and low-carbon development values of the three regions.
As we can see from Table 4, the green and low-carbon development levels of the nine urban agglomerations in the Guangdong-Hong Kong-Macao Greater Bay Area showed an overall rising trend from 2006 to 2020. Shenzhen, Guangzhou, Foshan and Zhuhai’s green and low-carbon developments more stable than that of other cities. As of 2019, the green and low-carbon development values of the nine cities are as follows: Zhuhai > Guangzhou > Zhaoqing > Jiangmen > Huizhou > Shenzhen > Foshan > Dongguan > Zhongshan.
From Figure 5, it can be seen that the green and low-carbon development values of the three regions show a steady upward trend, indicating that Guangdong Province’s efforts to promote green and low-carbon transformation have achieved results. By formulating the opinions on implementing carbon peaking and carbon neutrality and the implementation plan for carbon peaking, accelerating the development of green and low-carbon industries, implementing green manufacturing projects and green transformation of key industries, promoting the circular development of industrial parks, Guangdong Province has made positive progress in green and low-carbon development. In addition, Guangdong Province has also accelerated the promotion and application of energy-efficient and energy-saving technology products, strengthened energy-saving work in key areas such as industry, construction, and public institutions, and improved the energy efficiency level of information infrastructure such as data centers and new communications. Meanwhile, Guangdong Province has also promoted the development of new energy transportation and inland clean shipping, promoted coal-to-gas and oil-to-gas conversion, and built a green and efficient transportation system. In terms of green and low-carbon buildings, Guangdong Province has successfully promoted the large-scale development of high-quality green buildings, comprehensively promoted the classification of household waste, launched actions to create green communities, green schools, and environmental education bases, and improved citizens’ awareness of ecological civilization. The successful implementation of these measures has promoted the economic development of the Guangdong-Hong Kong-Macao Greater Bay Area and improved the overall level of green and low-carbon development in the region.
The above results indicate that during the process of economic, social, and environmental transformation, the three regions of the Guangdong-Hong Kong-Macao Greater Bay Area show a certain similarity in the trend of green and low-carbon development during the same period, indicating that there is an inherent connection between the transformation and development of the three regions. To further reveal the differences in green and low-carbon development performance among the three regions, we use the Dagum Gini coefficient to measure the gap and sources of green and low-carbon development performance among Guangzhou, Shenzhen, and Zhuhai (view Table 5).
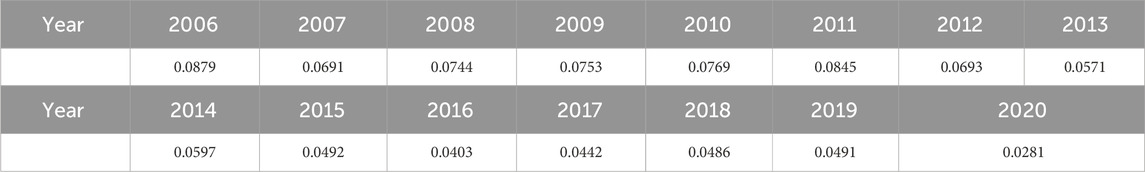
Table 5. Overall Gini coefficient.
According to Table 5, the overall Gini coefficient of the Guangdong-Hong Kong-Macao Greater Bay Area decreased from 0.0879 in 2006 to 0.0281 in 2020, a decrease of 68%. This indicates that during the research period, the spatial differences in the level of green and low-carbon development in the Greater Bay Area showed a downward trend. The development gap in green and low-carbon development in the Greater Bay Area is narrowing, and the coordinated development of green and low-carbon development in the urban agglomeration has achieved certain results. This is mainly due to the Greater Bay Area’s focus on resource endowment and functional positioning, accelerating the construction of a regional development pattern of “one core, one belt, and one zone”. In this process, the Greater Bay Area adheres to the concept that green mountains and clear waters are as valuable as nature, and has made extraordinary efforts to fight pollution prevention and control. The ecological environment quality has been greatly improved, and the air quality has been continuously improved for 8 years, with the average concentration of PM2.5 significantly reduced to 20 μg per cubic meter. The Greater Bay Area has become a national forest city cluster, and more and more people can enjoy the “ecological benefits”. However, there are differences in green and low-carbon development among the three regions (view Table 6; Table 7). Each city has also formed several practical cooperation projects, exploring the path and model of common prosperity, and taking new steps. In addition, the Guangdong provincial government actively promotes the implementation of major platform innovation policies, vigorously promotes the orderly transfer of industries and regional coordinated development, and enhances the balance and coordination of development in the Greater Bay Area.
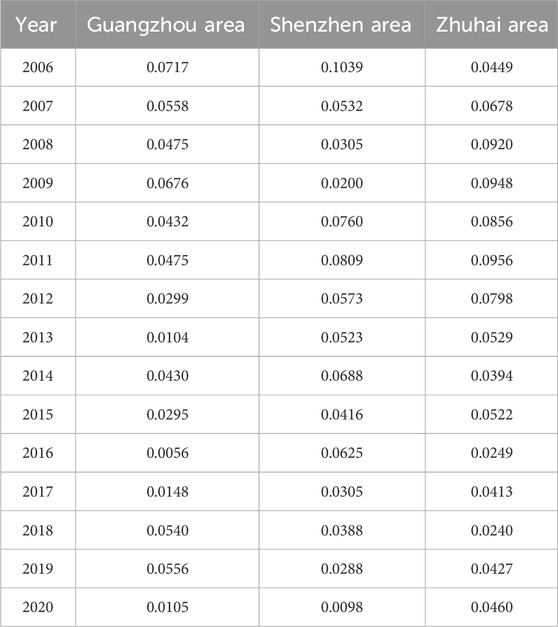
Table 6. Intra-regional differences.
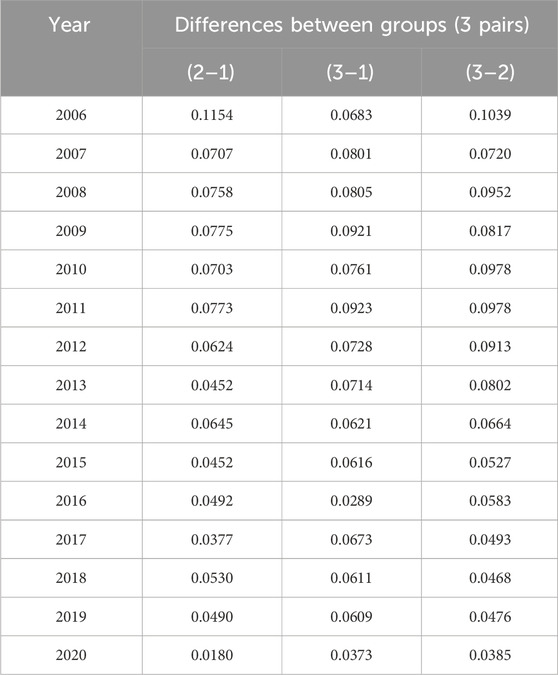
Table 7. Differences among groups.
According to Table 6, there is a significant gap in the level of green and low-carbon development among the cities within the three regions of the Guangdong-Hong Kong-Macao Greater Bay Area. During the study period, the average Gini coefficient of the cities in the Greater Bay Area from highest to lowest was Zhuhai region > Shenzhen region > Guangzhou region. The regional differences within the three regions showed an upward and downward trend from 2006 to 2019, with an overall downward trend. The appearance of a downward trend indicates that there is a contraction of spatial spillover effects within the region, while the increase in regional differences indicates a significant contraction of spatial spillover effects within the region. The fluctuations in regional development are mainly because Guangzhou, Shenzhen, and Zhuhai have relatively better green and low-carbon development compared to other cities within the region, resulting in large internal differences in green development. However, the implementation of the policies to construct the Guangfo-Zhaoqing, Shenzhen-Dongguan-Huizhou, and Zhuhai-Zhongshan-Jiangmen economic circles in Guangdong Province has greatly reduced the regional differences and promoted the green and low-carbon development of the three regions.
According to Table 7, it can be seen that the net value difference between the Guangzhou and Shenzhen regions is lower than the net value difference contribution between the other two regions during the statistical period, indicating that the degree of coordinated development between the Guangzhou and Shenzhen regions is most significant during this period. From the overall trend, the regional net value differences between any two regions show a downward trend. Therefore, during the research period, the spatial agglomeration effects and spatial spillover effects between any two regions within the three regions have been continuously strengthened. This is attributed to Guangdong Province’s deep implementation of the “Outline of the Plan for the Guangdong-Hong Kong-Macao Greater Bay Area”, taking “double upgrading” and “double transfer” as the starting point, vigorously promoting the integration and industrial transformation and upgrading of the Greater Bay Area, accelerating the revitalization of the eastern, western, and northern regions, and driving the development of the Greater Bay Area. Led by the integration of Guangzhou and Foshan, and with the promotion of infrastructure integration as the breakthrough point, the three major economic circles of Guangfo-Zhaoqing, Shenzhen-Dongguan-Huizhou, and Zhuhai-Zhongshan-Jiangmen are being built to promote industrial transformation, environmental reconstruction, and protection. However, from 2014 to 2018, the net value differences between the three regions showed an upward trend. The reason for this phenomenon may be that this period was the end of the “12th Five-Year Plan” and the beginning of the “13th Five-Year Plan”, and there were significant changes in the industrial structure and regional cooperation, leading to fluctuations in net value differences between regions.
The regional differences in the development of the green economy in the Guangdong-Hong Kong-Macao Greater Bay Area mainly come from inter-regional differences, intra-regional differences, and super-variable density differences (According to Table 8). Among them, the annual contribution rate of intra-regional differences is 26.7%, the annual contribution rate of inter-regional differences is 36.7%, and the annual contribution rate of super-variable density differences is 36.6%. Therefore, it can be concluded that the spatial differences in the level of green and low-carbon development in the Guangdong-Hong Kong-Macao Greater Bay Area mainly come from inter-regional differences, followed by super-variable density differences, with the smallest impact on intra-regional differences. The inter-regional gap is the main reason for the overall differences in green and low-carbon development in the Guangdong-Hong Kong-Macao Greater Bay Area, that is, the development level of the three cities in the Greater Bay Area is uneven, resulting in certain gaps. However, in recent years, the contribution rate of super-variable density has begun to show an upward trend and has gradually become the main reason for the overall differences in green and low-carbon development in the Guangdong-Hong Kong-Macao Greater Bay Area. Regions with higher (lower) levels of green and low-carbon development in the Greater Bay Area have cities with higher (lower) levels of economic green and low-carbon development. Overall, to narrow the overall differences in the Guangdong-Hong Kong-Macao Greater Bay Area, we should not only focus on the overall coordination between regions but also pay attention to the coordination of internal development within regions.
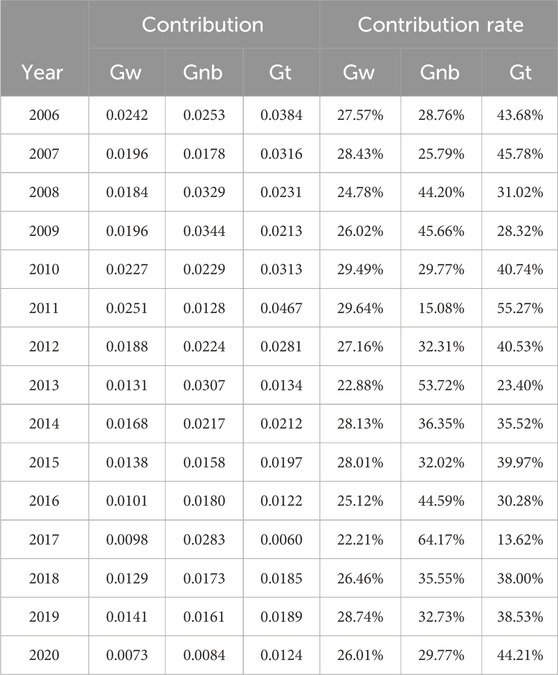
Table 8. Contribution rates of the three regions.
In the Guangzhou region, Guangzhou city has placed its focus on developing a green economy in the real economy. It adheres to the “dual-wheel drive” of technological innovation and institutional innovation, promotes the development of emerging industry clusters, strengthens the leading position of advantageous industries, and enhances its development momentum and competitiveness. At the same time, it deepens comprehensive cooperation among Guangdong, Hong Kong, and Macao, accelerates the construction of the Guangzhou-Shenzhen-Hong Kong-Macao Science and Technology Innovation Corridor, and leverages the dual-core driving and pole-driving roles. It has signed a strategic cooperation framework agreement with Shenzhen, jointly built the Guangzhou-Foshan Green and Low-Carbon Development Integration Pilot Zone, promoted cooperation between Guangzhou and Dongguan and Guangzhou and Zhongshan, and signed a new round of cooperation agreements with Zhaoqing, Shaoguan, and Jiangmen, to jointly build the Guangzhou-Foshan-Zhaoqing-Yunfu-Shaoguan Economic Circle. Foshan City continues to optimize its green economic structure, deepen the supply-side structural reform, and benefit the manufacturing industry the most. It has also made new achievements in promoting the construction of the Guangdong-Hong Kong-Macao Greater Bay Area, and Foshan and Guangzhou have entered a new stage of all-around urbanization. Zhaoqing City has accelerated its integration into the construction of the Guangdong-Hong Kong-Macao Greater Bay Area and has accelerated its industrial transformation and upgrading. It has increased efforts to phase out and upgrade traditional low-efficiency industries, thereby further enhancing the vitality of green economic development.
In the Shenzhen region, Shenzhen city has seized the major opportunities of the construction of the Guangdong-Hong Kong-Macao Greater Bay Area and accelerated the formation of a new pattern of high-level opening-up. It has made every effort to become the main battlefield for the construction of the Greater Bay Area, implemented the implementation opinions and 3-year action plan of the Guangdong Provincial Party Committee and Provincial Government, promoted the “Bay Area Pass” project, implemented special actions for cooperation between Shenzhen and Hong Kong, and continuously improved the level of opening-up and cooperation. It has strengthened cooperation with cities such as Guangzhou and actively participated in the construction of the Guangzhou-Shenzhen-Hong Kong-Macao Science and Technology Innovation Corridor. Key projects such as the Shenzhen-Zhongshan Channel are being accelerated, the Guangzhou-Dongguan-Shenzhen intercity railway has been completed and opened, and new progress has been made in the construction of the Shenzhen-Dongguan-Huizhou Economic Circle, and regional coordinated development has achieved new results. Huizhou City has accelerated the formation of a modern industrial system centered on manufacturing, and Dongguan City’s economic development has achieved steady progress, with further improvement in the coordination and matching of development. The trend of innovation-driven green and low-carbon development has been further consolidated, and major reforms have been deeply promoted.
In the Zhuhai region, the development trend of the real economy in Zhuhai City is good. A series of policies have been introduced to promote the development of industrial investment, technological transformation, equipment manufacturing, intelligent manufacturing, and other aspects. Innovative entities are flourishing, and the Guangdong-Hong Kong-Macao Bridge and ports have been officially opened, and regional cooperation is being deepened. In Zhongshan City, the urban development pattern is being reshaped by the requirements of green and low-carbon development. It is vigorously implementing the “Bay Area Layout” and the “Eastward Development Strategy”, making progress in the construction of a modern economic system, and accelerating its transformation and upgrading. In Jiangmen City, five emerging industries, including high-end equipment manufacturing, new-generation information technology, new energy vehicles and components, health, and new materials, have been introduced. However, its manufacturing industry is in the throes of the transformation of old and new kinetic energy, and the growth of bulk consumption has slowed down. The economy is facing rare downward pressure in history.
In summary, the reason for the gradual reduction in inter-regional gaps is that there are leading cities in the three major regions. Guangzhou and Shenzhen, the two first-tier cities, have accelerated industrial transfer, effectively promoting industrial upgrading and kinetic energy conversion. Based on improving their efficiency in green and low-carbon development, they have also explored the strategy of regional coordinated integration development, actively driving the development of other cities, fully leveraging their resource advantages such as technology and geographical location, and promoting the improvement of the external orientation of other cities. China and Guangdong Province have also taken a series of measures to remove old obstacles and stimulate market vitality, thereby narrowing the relative gaps within regions, between regions, and even overall.
To analyze the characteristics and changing trends of the green and low-carbon development efficiency of 9 cities in the Guangdong-Hong Kong-Macao Greater Bay Area, the results calculated based on panel data are shown in Table 9.
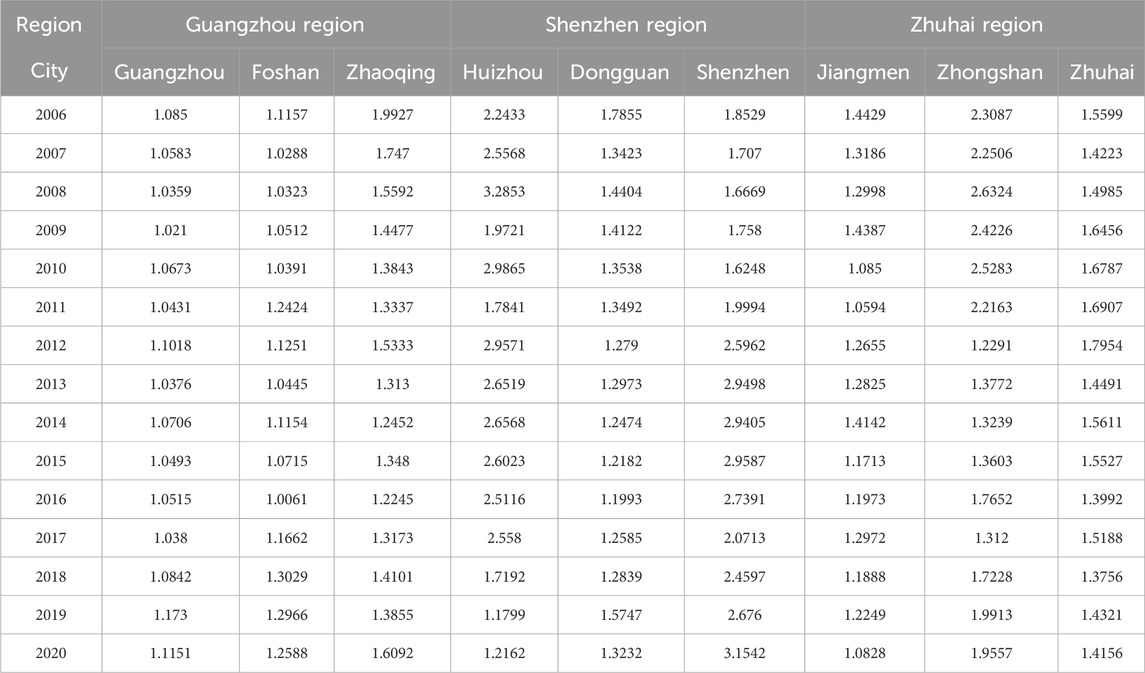
Table 9. The green and low-carbon development efficiency of nine cities.
According to the data in Table 9, it can be found that there is a certain gap in the green and low-carbon development efficiency of the nine cities in the Guangdong-Hong Kong-Macao Greater Bay Area. Among them, Huizhou and Shenzhen have the highest average green and low-carbon development efficiency, which are 2.3254 and 2.3436, respectively. Although the green and low-carbon development efficiency value of Shenzhen has slightly decreased from 2014 to 2016, it has shown an upward trend after development. The development trend of Huizhou’s green efficiency has shown multiple ups and downs, and after a significant decline from 2016 to 2018, Huizhou has maintained stable development. In addition to the curves of Shenzhen and Huizhou being more fluctuating, Zhongshan also began to show an upward trend in 2016 and has maintained this trend, indicating that Zhongshan and other cities have been able to make good use of resources during this period and continuously strive towards achieving coordinated development of the economy and the environment. The curves of the other six cities are relatively flat, indicating that although the structure of input and output has gradually become reasonable, they still need to steadily improve their efficiency values.
The differences in economic, political, market, and internal corporate environments in various regions have led to differences in green and low-carbon development efficiency in different regions. To address this issue, it is crucial to strengthen cooperation and coordination between regions, promote economic complementarity and resource sharing among regions, and achieve regional coordinated development. This will help to narrow regional differences and promote the green and low-carbon development of the Guangdong-Hong Kong-Macao Greater Bay Area. It is important to recognize that regional disparities can hinder overall economic growth and development, and therefore, it is necessary to take a comprehensive and collaborative approach to address these disparities and promote sustainable development across the region.
From a global perspective, the green and low-carbon development efficiency of the Guangdong-Hong Kong-Macao Greater Bay Area is showing a good development trend overall (view Figure 6). This is mainly attributed to Guangdong Province’s efforts to accelerate the construction of the “one core, one belt, and one zone” regional development pattern, which has significantly enhanced the balance and coordination of development, leading to a sustained improvement in the development level of the core area of the Pearl River Delta. In addition, Guangdong Province is also continuing to deepen the battle for blue skies, clear waters, and unpolluted land, implementing a comprehensive coordinated action plan to improve air quality, and promoting the coordinated control of multiple pollutants and regional prevention and control. These measures are helping to promote the green and low-carbon development of the Guangdong-Hong Kong-Macao Greater Bay Area.

Figure 6. Efficiency values of the green and low-carbon development in the three regions.
The significant differences in geographical environment, management system, and economic development level among the nine cities and three regions have led to significant differences in green and low-carbon development efficiency. To address this issue, it is crucial to strengthen technological innovation and policy coordination, promote economic complementarity and resource sharing among regions, and achieve regional coordinated development. This will help to narrow regional differences and promote the green and low-carbon development of the Guangdong-Hong Kong-Macao Greater Bay Area. It is important to recognize that regional disparities can hinder overall economic growth and development, and therefore, it is necessary to take a comprehensive and collaborative approach to address these disparities and promote sustainable development across the region.
It is important to note that Guangzhou has maintained stable development from 2006 to 2020, with an average green and low-carbon development efficiency of 1.2173, which is lower than that of Shenzhen (2.0089) and Zhuhai (1.5591). From the evolution trend of green and low-carbon development efficiency in the three regions, it can be seen that Guangzhou’s green and low-carbon development efficiency level is significantly lower than that of Shenzhen and Zhuhai. Therefore, it is necessary to further strengthen the promotion of green and low-carbon development in Guangzhou, through measures such as technological innovation, policy coordination, and resource sharing, to improve the efficiency of green and low-carbon development and promote sustainable development in the Guangdong-Hong Kong-Macao Greater Bay Area.
The overall efficiency value of green and low-carbon development in the Guangzhou region is greater than 1, which is attributed to the concerted efforts of the Guangzhou region to promote stable economic development. The Guangzhou region adheres to the principle of stability and progress, strengthens the role of innovation leadership, and promotes the stability and quality improvement of the green economy. The Guangzhou region has solidly promoted the development of the primary industry and the establishment of the manufacturing industry, focusing on the real economy as the key point for developing the green economy, and continuously promoting the high-level development of the industrial base and the modernization of the industrial chain. In addition, the cities of Foshan and Guangzhou have deepened the construction of the Guangzhou-Foshan urban integration, leading and driving the coordinated development of the entire province. The city of Zhaoqing has fully participated in the construction of the Guangdong-Hong Kong-Macao Greater Bay Area, presenting a new look for the new city. The eastern region of Zhaoqing has been fully integrated into the Guangzhou metropolitan area, and the integration of Foshan and Zhaoqing is accelerating, actively and prudently promoting carbon peak and carbon neutrality, adjusting and optimizing the energy structure in an orderly manner, vigorously developing clean energy, and promoting the green transformation of key industries and important areas.
The efficiency of green and low-carbon development in the Shenzhen region is not very stable, with multiple fluctuations. However, since 2010, there has been a clear upward trend, which is attributed to the unified deployment of the fifth Party Congress of Shenzhen City and the requirements of the “Outline of the Reform and Development Plan for the Pearl River Delta Region (2008–2020)”, which guided the city to transform its development mode, optimize its development environment, and prioritize innovative, transformational, low-carbon, and harmonious development. Shenzhen has adhered to the direction of low-carbon development, vigorously developed low-carbon technologies, accelerated the development of new and renewable energy, and promoted the intensive and efficient use of energy resources. Shenzhen has also promoted regional coordinated development, strengthened its position as the central city of the region, and led the way in cooperation with Hong Kong, focusing on the integration of the eastern bank of the Pearl River Estuary. Shenzhen has continuously expanded its economic hinterland and international influence.
After implementing the “Outline of the Reform and Development Plan for the Pearl River Delta Region (2008–2020)" in 2010, Huizhou City achieved significant results and accelerated its integration into the process of the Pearl River Delta integration. The city government actively connected with the “Five Integration” plan of the Pearl River Delta, promoted the construction of a “dual-benefit” city, and accelerated the formation of a modern urban development pattern. At the same time, the city government focused on promoting the integration of industries, strengthening the internal complementarity of industries, promoting differentiated development, and expanding development space. In addition, Huizhou City vigorously promoted ecological environment construction, actively implemented the “8-3-3” ecological project, that is, eight ecological projects (1 million mu of broad-leaved forest afforestation demonstration project, 100 square kilometers of water conservation forest construction project in Huizhou basin of Dongjiang River and Xizhijiang River, 100 km of road tree reconstruction project, 1 million mu of eucalyptus and residual forest reconstruction project, green passage construction project, coastal shelter forest system construction project, nature reserve construction project, urban and rural greening integration project); Three major industrial projects (forest eco-tourism industry, precious tree species industry, characteristic fruit industry); Three major ecological and cultural projects (Huizhou Botanical Garden Construction Project, Tonghu Wetland Construction Project, and Wildlife Museum Construction Project), further increased forest coverage, and created a provincial forestry ecological city.
Based on its location in the Bay Area and its strength, Dongguan City has seized opportunities with a high-quality comprehensive environment. The city government is aware of and promoting carbon peak and carbon neutrality, adhering to the principles of prioritizing conservation, dual-wheel drive, internal and external connectivity, and risk prevention. The government is researching and formulating an implementation plan for the carbon peak, clarifying the timetable and roadmap. At the same time, Dongguan City is accelerating the construction of a clean, low-carbon, safe, and efficient energy system, strengthening the promotion and application of new energy, and exploring the transformation from total energy consumption and energy consumption intensity control to total carbon emission and intensity control.
In 2014, the manufacturing industry in the Shenzhen region was in the throes of a transition from old to new growth drivers, resulting in a certain downward trend. However, since 2017, the overall coordinated development of the Shenzhen region has been good, seizing major opportunities in the construction of the Guangdong-Hong Kong-Macao Greater Bay Area, and accelerating the formation of a new pattern of high-level opening up to the outside world. Therefore, the Shenzhen region has the highest efficiency in green and low-carbon development and is fully committed to being the main base for the construction of the Guangdong-Hong Kong-Macao Greater Bay Area.
During the 11th Five-Year Plan to the 12th Five-Year Plan period, the efficiency of green and low-carbon development in the Zhuhai region experienced a decline, mainly due to the influence of Zhongshan City. At that time, Zhongshan City was implementing three major strategies: revitalizing traditional industries, upgrading professional towns, and strengthening industrial clusters. However, its main industries were household appliances, lighting sources, hardware products, and textiles and clothing. The economic development of these industries relied too much on the extensive economic growth model of traditional energy, and the demand for energy and environmental capacity would continue to increase rigidly, further exacerbating the contradiction between energy consumption and supply.
The Zhuhai region is currently working together to promote high-quality economic development and high-level protection of the ecological environment, creating a new model of ecological civilization. The city government is coordinating the protection and construction of mountains, waters, forests, fields, lakes, grasses, and sands, and building a new system of “big environmental protection”, “big regulation”, and “big governance”, accelerating the formation of an industrial structure, production mode, lifestyle, and spatial pattern that saves resources and protects the environment. At the same time, the city government is promoting comprehensive green transformation through carbon peak and carbon neutrality, continuously optimizing and upgrading the industrial structure, improving the efficiency of resource and energy utilization, and building a green economic system. These measures will promote high-quality economic development. The municipal government is prioritizing the development of advanced manufacturing industries as a means to accelerate the growth of the real economy, while also exploring new mechanisms for development based on the “Hengqin policy + Zhuhai space” model. By doing so, the city aims to rapidly improve its urban level and scale, and become a key driver of high-quality development in the Guangdong-Hong Kong-Macao Greater Bay Area, as well as an important growth pole for the Guangdong economy.
The statistical analysis results from 2006 to 2020 reveal a steady upward trend in the overall green and low-carbon development level of the Guangdong-Hong Kong-Macao Greater Bay Area. This reflects the positive impact of urban green and low-carbon development policies in the Greater Bay Area. However, there still exists an imbalance, primarily caused by regional development disparities, leading to overall differences in green and low-carbon development within the Greater Bay Area. In recent years, regions with higher (lower) levels of green and low-carbon development have seen cities with higher (lower) levels of economic green and low-carbon development. Overall, narrowing the overall disparity in the Greater Bay Area requires attention not only to the overall coordinated development between regions but also to the coordination of development within regions. Examining the trend in green and low-carbon development efficiency in the Greater Bay Area, the Shenzhen region consistently surpasses the Guangzhou and Zhuhai regions. The Guangzhou region operates at a moderate level, mainly due to its industrialization path and resource structure locking in high carbon emissions. In contrast, the Shenzhen region has enhanced the competitiveness of its modern industrial system, with a pronounced lead in guiding the role of strategic emerging industries. The research results align with the actual situation based on practical investigations and feedback.
The Guangdong-Hong Kong-Macao Greater Bay Area has implemented two key strategies, namely “dual enhancement” and “dual transfer,” to vigorously promote the integration and industrial transformation and upgrading of the Greater Bay Area. This initiative aims to accelerate the revitalization of the eastern, western, and northern regions, driving collaborative green and low-carbon development in the Pearl River Delta region. In 2013, the Greater Bay Area initiated a carbon trading pilot, employing market mechanisms to achieve a significant reduction in carbon emissions. The expansion of carbon trading has positively impacted the overall level of green and low-carbon development.However, the practical implementation of green finance still faces several bottlenecks and obstacles, manifested by the limited effectiveness of green finance policies. Currently, green finance products are limited and struggle to meet the demands of market participants. Government departments should enhance and refine the system of green financial products and services. To encourage the green development of enterprises, value-added tax provides certain tax incentives for green products, but only a small portion qualifies under policy conditions. Additionally, there is an issue of inadequate tax incentive intensity, particularly in the areas of energy conservation, emission reduction, and green low-carbon transformation. Consequently, there is a noticeable lack of motivation for businesses to develop low-carbon technologies.The various levels of government in the Greater Bay Area should expeditiously strengthen institutional innovation from a regulatory and legal perspective. They should focus on constructing a new environmental governance system around key stakeholders such as the government, enterprises, and the public. This approach aims to fully leverage the diverse ecological supervision functions of the government, the public, and the media.
This article uses the entropy method, Gini coefficient, and super-efficiency SBM model of unexpected output to evaluate the economic, resource, social, and ecological environment of nine cities in the Guangdong-Hong Kong-Macao Greater Bay Area. The aim is to clarify the spatial characteristics and synergistic effects of the green and low-carbon development level in the Greater Bay Area and summarize the evolution of its green and low-carbon development efficiency, the following conclusions were drawn as follows:
First, this paper found that the green and low-carbon development of the nine cities in the Guangdong-Hong Kong-Macao Greater Bay Area has achieved significant results. However, the level of green and low-carbon development among these cities exhibits regional heterogeneity, which is influenced by factors such as the level of economic development, technological innovation, and inter-regional industrial transfer activities. Overall, the green and low-carbon development value of the nine cities has increased from 0.2533 in 2006 to 0.6939 in 2020. During the transformation process, factors such as foreign trade, investment, technology, and education have played a key role in promoting the coordinated development of green and low-carbon development in the Greater Bay Area.
Second, this paper found that the green and low-carbon development level in the three regions of the Guangdong-Hong Kong-Macao Greater Bay Area exhibits a non-equilibrium distribution, with high-level and low-level cities distributed in each region. The green and low-carbon development level in the Shenzhen region is higher than that in the Zhuhai and Guangzhou regions. Although the relative differences in green and low-carbon development among the Greater Bay Area and its regions are narrowing, the non-equilibrium distribution of green and low-carbon development remains significant, and inter-regional differences continue to be the main source of overall differences. In addition, while the green and low-carbon development level in the Greater Bay Area and its regions is gradually increasing, the absolute gap in green and low-carbon development levels within each region is widening, and polarization phenomena are occurring in each region. Therefore, the coordination of green and low-carbon development within each region needs to be strengthened.
Third, this paper found that the green and low-carbon development efficiency in the Guangdong-Hong Kong-Macao Greater Bay Area is showing a slight upward trend, which is promising. In terms of urban regional comparison, there is an obvious “urban regional gradient” in the efficiency of green and low-carbon development, with the efficiency of the Shenzhen region being higher than that of the Zhuhai region, which is higher than that of the Guangzhou region. The efficiency of green and low-carbon development in the Shenzhen and Zhuhai regions fluctuates significantly, while the efficiency in the Guangzhou region remains stable. This reflects the significant spatial heterogeneity of green and low-carbon development efficiency in the Greater Bay Area.
Based on the analysis results above, several relevant policies can be proposed. The three regions divided among the nine cities in the Guangdong-Hong Kong-Macao Greater Bay Area exhibit heterogeneity in their levels of green and low-carbon development. The overall development level in the Shenzhen region is the highest, with the Zhuhai region showing a good level of green and low-carbon development, and the Guangzhou region relatively lagging behind. This indicates varying urban competitiveness among the three regions. In cities with relatively high levels of green and low-carbon development, it is essential to leverage positive spillover effects arising from industrial structure upgrades and ecological environment optimization. This can activate new sources of spillover effects, promoting the spread of influencing factors and industries to surrounding cities. In cities with lower levels of green and low-carbon development, active acceptance and utilization of spillover effects from other cities should be encouraged. Efforts should be made to explore the collaborative development of green and low-carbon urban clusters, achieving resonance effects in carbon emissions and carbon reduction efficiency. This suggests the establishment of a long-term cooperative mechanism for green and low-carbon development in the Guangdong-Hong Kong-Macao Greater Bay Area. This mechanism aims to facilitate information sharing and resource complementarity, addressing green and low-carbon development challenges collectively. To achieve this, relevant policies should be formulated, encouraging and supporting the growth of the environmental protection industry. Additionally, initiatives to promote renewable energy and clean production technologies should be prioritized. This collaborative approach will contribute to addressing green and low-carbon development issues in the Greater Bay Area, fostering shared progress in green and low-carbon development.
While this study has contributed to the assessment of the green and low-carbon development level in super-large urban agglomerations, there are still limitations. For instance, the Greater Bay Area operates under the “One Country, Two Systems” framework, a characteristic not shared by other urban agglomerations in China. Therefore, policy formulation and standards in institutional mechanisms cannot be entirely replicated in other urban agglomerations. However, the research framework, indicator system, and research methods employed in this study can serve as valuable references. As a result, future research should independently focus on different urban agglomerations, tailoring environmental economic policies to address their specific characteristics. This approach will better facilitate the promotion of green and low-carbon development in diverse urban agglomerations. Hence, there remains significant room for further exploration of the influencing mechanisms within urban agglomerations in future studies.
The original contributions presented in the study are included in the article/Supplementary Material, further inquiries can be directed to the corresponding author.
The studies involving humans were approved by Guangdong University of Finance and Economics. The studies were conducted in accordance with the local legislation and institutional requirements. The participants provided their written informed consent to participate in this study.
CY: Methodology, Writing–review and editing. HZ: Writing–original draft.
The author(s) declare financial support was received for the research, authorship, and/or publication of this article. This paper is sponsored by the social science planning fund of Guangdong (General Program, Grant No. GD20CGL39).
The authors declare that the research was conducted in the absence of any commercial or financial relationships that could be construed as a potential conflict of interest.
All claims expressed in this article are solely those of the authors and do not necessarily represent those of their affiliated organizations, or those of the publisher, the editors and the reviewers. Any product that may be evaluated in this article, or claim that may be made by its manufacturer, is not guaranteed or endorsed by the publisher.
The Supplementary Material for this article can be found online at: https://www.frontiersin.org/articles/10.3389/fenvs.2024.1336322/full#supplementary-material
Bin, L., and Li, L. (2022). How can urban agglomeration market integration promote urban green development: evidence from China's yangtze river economic belt. Environ. Sci. Pollut. Res. 29 (7), 10649–10664. doi:10.1007/s11356-021-16490-x
Cheng, G. (2014). Data envelopment analysis methods and max DEA software [M]. Beijing: Intellectual Property Publishing House.
Cheng, Yu, Liu, T., Zhao, Y., and Wang, Y. (2019). Spatio-temporal evolution of urban air quality in the "2+26" region of Beijing-Tianjin-Hebei and its surrounding areas and its socio-economic driving mechanism. Econ. Geogr. 39 (10), 183–192.
Cheng, Y., Shao, T., Lai, H., Shen, M., and Li, Y. (2019). Total-factor eco-efficiency and its influencing factors in the yangtze River Delta urban agglomeration, China. Int. J. Environ. Res. Public Health 16 (20), 3814. doi:10.3390/ijerph16203814
Chengxue, Y. U., and Chen, M. (2021). Regional ecological security evolution and green economy: an empirical study. Math. Problems Eng. 2021, 1–11. doi:10.1155/2021/5549048
Dagum, C. (1997). A new approach to the decomposition of the Gini income inequality ratio. Empir. Econ. 22, 515–531. doi:10.1007/bf01205777
Dong, H., Li, X., and Zhang, R. (2021). Spatial and temporal characteristics and driving factors of green innovation efficiency in Guangdong-Hong Kong-Macao Greater Bay Area. Econ. Geogr. 41 (05), 134–144.
Duan, Z., and Tang, T. (2022). Quantitative simulation and verification of the coordination curves between sustainable development and green innovation efficiency: from the perspective of urban agglomerations development. Sustainability 14 (24), 16686. doi:10.3390/su142416686
Feng, Y., Dong, X., Zhao, X., and Zhu, A. (2020). Evaluation of urban green development transformation process for Chinese cities during 2005 -- 2016. J. Clean. Prod. 266, 121707. doi:10.1016/j.jclepro.2020.121707
Fu, J., and Wu, C. (2016). Retroactivity of urban green transformation and development process. Reform (11), 99–108.
Ge, R., Yu, C., Xu, Yi, and Wang, S. (2017). An empirical study on green Development in Liaoning Province based on DPESAR Framework. J. Dalian Minzu Univ. 19 (01), 48–54.
Guanghui, T., Jiangsu, L., Changhong, M., and Pingping, D. (2022). Urban green development efficiency and its influencing factors based on undesired output in China [J]. Econ. Geogr. 42 (06), 83–91.
He, Q., Zeng, C., Xie, P., Tan, S., and Wu, J. (2019). Comparison of urban growth patterns and changes between three urban agglomerationsin China and three metropolises in the USA from 1995 to 2015. Sustain. Cities Soc. 50, 101649. doi:10.1016/j.scs.2019.101649
Huang, L., and Wu, C. Q. (2019). Urban industrial green development efficiency and its spatial driving mechanism in the Yangtze River Economic Belt. China Popul. Resour. Environ. 29 (08), 40–49.
Ji, Y., Zhang, L., Qin, Y., Chen, J., and Wu, S. (2020). Spatial econometric analysis of green development in cities at prefecture level and above in China [J]. Econ. Geogr. 40 (04), 184–194.
Li, L., and Liu, Y. (2015). Dynamic assessment and comparison of green efficiency between the Central and Yangtze River Delta urban agglomerations. J. Jiangxi Univ. Finance Econ. (03), 3–12.
Li, R., Song, Y., Li, Y., and Yu, T. (2016). Identification of resource-based cities' transition stages and analysis of their characteristics. Sci. Geogr. Sin. 36 (01), 90–98.
Li, X., Liu, Y., SongLi, T. X. X., and Liu, Y. M. (2014). The measurement of human green development Index. Soc. Sci. China (6), 69–95.
Li, Z., Luan, R. R., and Lin, B. Q. (2022). The trend and factors affecting renewable energy distribution and disparity across countries. Energy 254, 124265. doi:10.1016/j.energy.2022.124265
Lin, P., and Meng, N. N. (2021). Spatio-temporal differentiation and dynamic convergence of green total factor productivity growth. Res. Quantitative Tech. Econ. 38 (08), 104–124.
Lin, Z., Hu, J., Du, B., Liu, J. R. M. B., Sun, C., Wu, R., et al. (2015). International experience of green development in Western China:an overall review of policy and practice. Chin. J. Population,Resources Environ. 13 (4), 281–290. doi:10.1080/10042857.2015.1078496
Liu, B. L., Bian, Y., Zhou, M., and Zhu, J. F. (2019). 70 years review of China's regional economic development and its prospect. China Ind. Econ. (09), 24–41.
Liu, Y., and Qin, M. (2019). Comprehensive measurement and comparison of green efficiency of four major urban agglomerations in eastern coastal China. China Popul. Resour. Environ. 29 (03), 11–20.
Liu, Y., Yang, J., and Liang, R. M. B. (2019). Evaluation and equilibrium characteristics of green development efficiency of urban agglomerations in China. Econ. Geogr. 39 (02), 110–117.
Lu, L., Hu, S., He, J., and Zeng, G. (2020). The relationship between green development and economic growth in the Yangtze River Delta urban Agglomeration: Based on the decoupling index [J]. Econ. Geogr. 40 (07), 40–48.
Mao, J., Yu, Z., Wang, Y., Wang, L., and Wang, M. (2023). Spatial convergence and influencing factors of green total factor productivity of China's urban agglomerations. Front. Environ. Sci. 11. doi:10.3389/fenvs.2023.1138396
Masuda, H., Kawakubo, S., Okitasari, M., and Morita, K. (2022). Exploring the role of local governments as intermediaries to facilitate partnerships for the Sustainable Development Goals. Goals. Sustain. Cities Soc. 82, 103883. doi:10.1016/j.scs.2022.103883
Meng, D., Li, X., Lu, Y., and Fan, X. (2014). Yangtze river delta urban spatial pattern of economic development level evolution. J. Econ. Geogr. (02), 50–57.
Miao, Z., Chen, X. D., and Balezentis, T. (2021). Improving energy use and mitigating pollutant emissions across Three Regions and Ten Urban Agglomerations: a city-level productivity growth decomposition. Appl. Energy 283, 116296. doi:10.1016/j.apenergy.2020.116296
Pan, W. Q. (2012). Regional correlation and spatial spillover effect of economic growth in China. Econ. Res. J. (1), 54–65.
Saurav, C., Maity, I., Patel, P. P., Dashpoor, H., Pramanik, S., Follmann, A., et al. (2021). Spatio-temporal patterns of urbanization in the Kolkata Urban Agglomeration: a dynamic spatial territory-based approach. Sustain. Cities Soc. 67, 102715. doi:10.1016/j.scs.2021.102715
Shi, L., Xiang, X., Zhu, W., and Gao, L. (2018). Standardization of the evaluation index system for low-carbon cities in China: a case study of xiamen. Sustainability 10 (10), 3751. doi:10.3390/su10103751
Smeets, E., and Weterings, R. (1999). Environmental indicators:typology and overview[R].Copenhagen:Technical Report. EEA.
Song, H., and Xin, X. (2020). Evaluation of China's green economy development level based on entropy weight. Contemp. Econ. (05), 80–84.
Tan, F., Gong, C., and Niu, Z. R. M. B. (2022). How does regional integration development affect green innovation? Evidence from China's major urban agglomerations. J. Clean. Prod. (P1), 379.
Tone, K. (2001). A slacks-based measure of efficiency in data envelopment analysis. Eur. J. Operational Res. 130 (130), 498–509. doi:10.1016/s0377-2217(99)00407-5
Tone, K. (2002). A slacks-based measure of super-efficiency in data envelopment analysis. Eur. J. Operational Reaerach 143 (143), 32–41. doi:10.1016/s0377-2217(01)00324-1
Tone, K. (2003). Dealing with undesirable outputs in DEA: a slacks-based measure (SBM) approach. Toronto: Presentation at NAPW III.
Wang, B., and Huang, R. (2014). Regional green development efficiency and green total factor productivity in China:2000-2010 -- an empirical study based on parameter common boundary. Rev. Prod. Econ. 5 (01), 16–35.
Wang, B., Wu, Y., and Yan, P. (2010). Regional environmental efficiency and environmental total factor productivity growth in China. Econ. Res. 45 (05), 95–109.
Wang, K.-L., RuYu, X., YunHe, C., Zhuang, M., and HuaPing, S. (2023). Understanding the overall difference, distribution dynamics and convergence trends of green innovation efficiency in China's eight urban agglomerations. [J]. Ecol. Indic., 148.
Wang, P. (2015). Wu Haibin, where you have to wait. Evolution of regional land ecological security: a case study of Yongzhou City. J. Hengyang Normal Univ. 36 (3), 83–89.
Wang, Y., Niu, Y., Li, M., Yu, Q., and Chen, W. (2022). Spatial structure and carbon emission of urban agglomerations: spatiotemporal characteristics and driving forces. Sustain. Cities Soc. 78, 103600. doi:10.1016/j.scs.2021.103600
Xiao, G., Zhao, Y., and Guo, L. (2016). Evaluation and demonstration of urban green transformation based on DPSIR-TOPSIS: a case study of TaiRMB City. J. Technol. Econ. 35 (12), 82–89.
Yan, Y., Zhang, W., and Lin, C. (2022). BCL11B upregulates the expression of RelA in T cells stimulated with staphylococcal enterotoxin A. Resour. Environ. Yangtze Basin 31 (02), 259–264. doi:10.1007/s10517-023-05685-6
Yang, T., Zhou, K., and Zhang, C. (2022). Spatiotemporal patterns and influencing factors of green development efficiency in China's urban agglomerations. Sustain. Cities Soc. 85, 104069. doi:10.1016/j.scs.2022.104069
Ye, Li, and Chen, Y. (2021). Development of an SBM-ML model for the measurement of green total factor productivity: the case of pearl river delta urban agglomeration. Renew. Sustain. Energy Rev. 145, 111131. doi:10.1016/j.rser.2021.111131
Ye, R., Zhang, Y., and Luo, K. (2017). Measurement and influencing factors of China's green economy efficiency: based on biased normal panel data model. J. Tech. Econ. 36 (11), 79–85.
Yi, F., Chien-Chiang, L., and Diyun, P. (2023). Does regional integration improve economic resilience? Evidence from urban agglomerations in China. Sustain. Cities Soc. 88, 104273. doi:10.1016/j.scs.2022.104273
Yu, C., Ge, R., and Li, J. (2020). An empirical study on the relationship between regional ecological security evolution and green economy development: a case study of Liaoning Province. China Environ. Manag. 12 (02), 113–122.
Yuan, K., Hu, B., Niu, T., Zhu, B., Zhang, L., and Guan, Y. (2022). Competitiveness evaluation and obstacle factor analysis of urban green and low-carbon development in beijing-tianjin-hebei cities. Math. Problems Eng. 2022, 1–15. doi:10.1155/2022/5230314
Yun, Li, Lei, H., and Zhang, X. (2020). Research on efficiency and influencing factors of science and technology innovation based on SBM model. J. Technol. Econ. 39 (05), 1–8.
Zhang, Z.-B. (2016). Journal of shandong normal university (humanities and social sciences edition), 89–96.
Zhao, Ao, and Wu, C. (2018). Situation System evaluation of China's economic Green Transformation: improving TOPSIS based on Entropy-OWA operator and grey correlation. . Technol. Econ. 37 (07), 99–106.
Zheng, W., Xu, W., and Yue, C. (2019). Dynamic evolution of trans-regional urban agglomeration economic network: based on analysis of urban agglomeration in Haixi, Yangtze River Delta and Pearl River Delta. Econ. Geogr. 39 (07), 58–66+75.
Zheng, Y., Xue, W., Zheng, Y. W., Xue, W. X., and Zhang, Z. (2020). A new approach to improve green innovation capability of high-tech development zones in western China [J]. J. Technol. Econ. 41 (05), 1–11.
Keywords: the green and low-carbon coordinated development, mega urban agglomerations, and the indicators system, Guangdong-Hong Kong-Macao greater Bay area, efficiency assessment
Citation: Yu C and Zheng H (2024) Efficiency of green and low-carbon coordinated development for mega urban agglomerations: an empirical study. Front. Environ. Sci. 12:1336322. doi: 10.3389/fenvs.2024.1336322
Received: 10 November 2023; Accepted: 26 February 2024;
Published: 09 April 2024.
Edited by:
Jing Lan, Nanjing Agricultural University, ChinaCopyright © 2024 Yu and Zheng. This is an open-access article distributed under the terms of the Creative Commons Attribution License (CC BY). The use, distribution or reproduction in other forums is permitted, provided the original author(s) and the copyright owner(s) are credited and that the original publication in this journal is cited, in accordance with accepted academic practice. No use, distribution or reproduction is permitted which does not comply with these terms.
*Correspondence: Hongbo Zheng, MTQ3OTcwNDAyNkBxcS5jb20=
Disclaimer: All claims expressed in this article are solely those of the authors and do not necessarily represent those of their affiliated organizations, or those of the publisher, the editors and the reviewers. Any product that may be evaluated in this article or claim that may be made by its manufacturer is not guaranteed or endorsed by the publisher.
Research integrity at Frontiers
Learn more about the work of our research integrity team to safeguard the quality of each article we publish.