 Muhammad Rizwanullah
 Muhammad Nasrullah
 Mohamad Alnafissa2*
- 1School of Public Administration, Xiangtan University, Xiangtan, China
- 2Department of Agricultural Economics, College of Food and Agricultural Sciences, King Saud University, Riyadh, Saudi Arabia
The primary objective of the study is to determine how environmental performance is affected by several factors, including trade freedom, industrial production, urbanization, financial inclusion, and energy efficiency. This research provides a novel perspective on the environmental performance of Belt and Roads Initiatives (BRI) member states by employing panel data from 1991 to 2021. It contributes to our understanding of the role of several factors in improving environmental performance. Panel data analysis also incorporates the CD, CIPS, FMOLS, DOLS, and PMG-ARDL tests. This research possesses substantial theoretical ramifications, as it might enable the expansion and refinement of current economic and environmental theories. As per the findings of this research, each factor significantly affects environmental performance (ecological foot-point). This contributes to short-term environmental issues by conserving resources and lowering emissions, creating the framework for long-term environmentally friendly procedures and innovation. Strong environmental policies that may cause effective environmental performance in Belt and Roads Initiatives (BRI) countries.
1 Introduction
National environmental-socioeconomic growth can only be governed effectively with access to enough financial resources (Baek et al., 2009; Alam et al., 2012). Green energy that is affordable and beneficial to the environment can be made possible through the spread of inclusive financing (Tayebi et al., 2016; Wardhani and Dugis, 2020). The World Bank Consultation Assist Group People in Need defines “inclusive finance” as the responsible and long-term provision of various financial goods and services, such as loans and insurance, to households and the business sector. To provide “affordable, clean energy” to all people is one of the Sustainable Development Goals set by the UN, as reported by the World Bank (Nwafor, 2014). More widespread access to financial services has been recognized as a key factor in enabling sustainability by making it possible for firms and families to invest in environmentally friendly technology and make purchases of energy-efficient goods. Therefore, promoting financial inclusion is crucial for sustainable development since it provides the path for technologically advanced, energy-efficient products (Wang, 2023).
Meanwhile, as the economy and technology improved, so did energy needs. Energy consumption is vital to economic growth but has serious negative environmental effects (Chaabouni and Saidi, 2017; Li et al., 2020a). Global agreements, including Kyoto in 1997 and the Climate Agreement of Paris in 2015, seek to slow environmental damage based on rising emissions of greenhouse gases (Q. Wang, Wang, et al., 2024b). These agreements seek, in part, to boost energy efficiency, defined as “the ratio of energy input to economic output (Chenran et al., 2019). Businesses can reduce energy use while maintaining productivity and growth (G. Li et al., 2020b). It also indicates progress in low-carbon technologies, paving the way for studying renewable energy (Cai et al., 2018). Retooling domestic industrial sectors with renewable and energy-efficient technologies is a wise investment for countries. (Baek, 2016).
The world’s nations are running to find a way to cut the release of carbon dioxide. The most important thing we can do to stop global warming is to perfect renewable energy technologies. Therefore, deciding on a renewable energy path is crucial to laying the groundwork for a low-carbon economic system. However, such an adjustment is out of the question (Rehman et al., 2021). The ecological footprint was chosen as the environmental performance indicator for the following reasons: The ecological evaluation at the heart of sustainable development is the ecological footprint, which measures humankind’s impact on the environment and the resilience of the planet’s bio-system. It is an essential indicator for measuring SDG progress (Khan and Hou, 2021). Second, the ability to absorb waste is crucial to ecological sustainability. Businesses make use of everything from minerals and wood to soil and water. In contrast to pollutants, which do not consider these things, the ecological footprint seems more complete (Li R. et al., 2023). To illustrate people’s environmental impact, we may look at our “ecological footprint” (Danish et al., 2020).
Put another way, compared to individual indicators like CO2 carbon footprints, greenhouse gas emissions, and other contaminants, it provides a more comprehensive picture of environmental degradation and financial viability (Wang, 2024). Industrial production has been essential to developing sophisticated economies ever since the commencement of the Industrial era. Additional emissions of greenhouse gases frequently hinder developing and emerging nations from achieving their ambitious economic goals. To build economies and get people out of poverty, these countries need to increase industrial production through manufacturing, which uses much energy. Production often results in the release of carbon dioxide (Ge, 2023). A key contributor to carbon emissions is the ongoing expansion of economic activity, which boosts energy needs (H. Wang et al., 2022). The novelty of this research explores the relationship between trade openness, industrial production, urbanization, energy efficiency, financial inclusion, and environmental performance. It emphasizes the complexity of these relationships and uses sector-based analysis, geographical dimensions, novel technologies, and social justice ethics to develop innovative ways to manage and regulate the environment.
In addition, expanding industrial production is indistinguishably related to ecological impacts because of continued resource extraction. The ecological footprints of industrialized nations are greater than those of less developed ones (Wang et al., 2024a). Compared to the United States and China, the two largest polluters over the past two decades, nations like Malaysia, Cambodia, Indonesia, and Korea have ecological footprints far below one billion global hectares (gha). This difference strengthens the developing world’s well-known stance on shared but separate obligations (Chandio et al., 2023). Therefore, it is essential to understand the energy problem facing the Roads and Belt Initiative (BRI) by explaining the connection between industrial productivity and environmental performance. For the BRI member states, it is essential to permit industrial production to become a tool in developing the national economy. The economic, energy, and environmental perspectives highlight three key ideas: financial industry development, economic enablers, and the effects of energy efficiency on ecological productivity (Li T. et al., 2023). The financial sector provides many options to create innovative tools that can help deal with environmental threats. Recently, renewable energy solutions, in conjunction with environmentally friendly and advanced energy, are two concepts that can be depicted as two sides of a coin. Such aspects of economic management, as mentioned above, are the critical environmental management indicators of trade freedom, industrial productivity, and urbanization. It protects the environment and provides energy efficiency and financial inclusion (Xu et al., 2023). Renewable electricity industries in developing countries expand. Therefore, industries in countries where the financial market is growing professionally tend to develop even faster than those where the debt market is underdeveloped and financial institutions are unstable (Ahsan et al., 2020; Ali et al., 2021).
This research examines how the environment is affected by financial inclusion (FI), energy efficiency (EE), and economic factors like trade freedom, industrial production, and urbanization. This research proposes new conclusions and suggestions about how financial inclusion, energy efficiency, and economic factors affect environmental performance. There are three primary reasons why this study’s contribution matters: (1) the ecological footprint is used as an all-encompassing environmental performance metric in this study. The study used the PMG-ARDL model to identify the short and long-run association along with the effect of the variables on the environmental performance. (2) Renewable energy consumption is a proxy for energy efficiency, a novel metric not previously utilized in research. Despite East Asia and the Pacific’s more significant population, higher energy consumption, and higher emissions, (3) the Belt and Road Initiatives should be recognized in the scientific literature.
1.1 Research objectives
The objectives of this study are as follows:
• To assess the influence of economic factors on environmental performance.
• To determine the influence of financial inclusion on environmental performance.
• To evaluate the influence of energy efficiency on environmental performance.
2 Review of literature
2.1 Theoretical foundation
2.1.1 Ecological modernization theory
According to the ecological modernization theory, technological upgrading and restructuring the economy are ways of helping society achieve sustainability, which is the responsibility of sociology and political science. (Ahsan et al., 2020). It recognizes that industrialization and economic development are among the activities that have historically resulted in environmental disruptions but are more optimistic about the future (Xu et al., 2023). The theory implies that through green technologies and eco-friendly practices, we can build an economy that is sustainable and close to natural conditions. Economic growth in an environmentally responsible way can become a self-reinforcing force. Hence, markets and government regulation can simultaneously drive environmental improvements; firms can find economic opportunities in green innovation, and the public can demand higher environmental standards via their choices and values. This theory has contributed a lot to environmental policy improvements and the utilization of modernization processes to minimize environmental pollution (John and Hana, 2021).
2.1.2 Social Capital Theory
The Social Capital Theory that has emerged in sociology focuses on the importance of social relations, networks, and interactions, which can contribute to achieving personal objectives and common goals. One can always rely on the fact that, regardless of the adverse phases of life, mutual trust and personal connections will always provide wellbeing to the individual and community. Social capital describes the embedded resources of social networks, for example, information, support, combination, and accessibility opportunities (Hu et al., 2021). It can be categorized into two main types: at the same time, it is the combination of social capital that relates to the strength of connections between local communities and social capital that connects different communities on an enormous scale. A social setting with solid social network members may produce positive results for the people involved, including increased educational prospects or employment openings and general harmony in the community (Hussain et al., 2021).
2.2 Empirical evidence
According to Chaudhry et al. (2022), this study was based on the “Dynamic Common Correlated Effects” method employed to identify the influence of financial integration on environmental degradation across the Organization of Islamic Cooperation members from 2004 to 2018. The findings showed that CO2 emissions, CH4 emissions, and degradations are the only variables significantly related to high-income OIC member economies. In contrast, nitrogen dioxide emissions and ecological footprint appear to be independent of variations in income levels. Low-income countries with the shapes of low-income countries and all OIC nations that reversed the UV-shaped environmental Kuznets curve were also deforested. As the report indicates, nature capacity should be the highest concern and priority in government management for nature protection, sustainable forest use, and the necessary finance services.
Based on the researchers Zhao and Yang’s (2020) findings, the relationship between financial inclusion and CO2 emissions at the provincial level in China is claimed to exist. The study suggested that with financial inclusion increasing by 10%, national emissions could drop by 4%–5%. It has only three exceptions: Zhejiang, Fujian, and Xinjiang. To reduce CO2 emissions, the report suggests that China’s province concentrate on developing its financial sector and gives examples for local governments. Usman et al. (2021) explored a correlation between economic development, renewable energy usage, and GDP increases in 15 countries that ranked high in carbon emissions as preferred between 1990 and 2017. The findings demonstrate that trade freedom, renewable energy sources, and financial development can mitigate climate change. At the same time, economic growth and the consumption of fossil fuels are, for the most part, the most significant contributing factors. It was established during the study that a two-way influence exists between the features. The ecological footprint, which is negatively associated with trade freedom and renewable energy, can be used as an indicator while emphasizing the import of trade and energy balance.
According to Koomson and Danquah (2021), the study used data from lifestyle surveys to discover that financial inclusion is connected to energy poverty in Ghana. Increased financial inclusion can minimize energy poverty, translating to the most predictable outcomes in rural areas and families headed by men. At this juncture, staff members gain the most from the higher financial accessibility. The most held possible avenues are household net income and type of family.
According to Id et al. (2023), the research applied econometric tools to evaluate the impact of foreign direct investment (FDI) on technical innovation in BRICS countries from 2000 to 2020. This research indicates that inward foreign direct investments, an increase in trade openness, economic growth, and commitment of more money to research all lead to an increase in innovations. Rauf et al. (2023) investigated how foreign direct investment, energy use, and technical innovations affected BRICS countries’ economic growth and quality of the environment in 1990 and 2018. This suggests that FDI positively impacts growth but impairs sustainability, while innovation technology improves sustainability.
Xu et al. (2023) studied the effects of energy conservation campaigns and adopting alternative energy sources on the level of carbon dioxide emissions from the MENA region’s electrical industry. The considerable non-renewable energy intensity is alarming. On the other hand, the intensity of renewable energy is below the breakeven point. Examples of renewable and non-renewable energy sources could be switched into capital energy. The MENA region’s poor energy efficiency and track record of climate mitigation show that clean, cheap energy and climate change execution will only be possible through pure economic growth by the end of 2030. The study suggests that improvements or setbacks in energy efficiency may result from government subsidies.
As the researchers of Lin and Abudu (2020) indicate, energy efficiency, renewable energy, and the extent of industrial composition will still, over time, influence the level of greenhouse gas emissions. There is substantial proof that a decrease in CO2 emissions in the long term is attained through energy efficiency. Moreover, CO2 emissions are reduced when renewable energy is substituted for non-renewable energy. The study further shows that real income and industrialization are the two variables that led to the increase in the level of C02. Dong et al. (2018) demonstrated that the Environmental Kuznets Curve (EKC) for China’s greenhouse gas pollution uses a new paradigm. It assesses the dynamic impact of fossil fuel’s replacement with renewable energy sources on the emission of CO2. Study data show the positive effect of clean energy sources on CO2 emissions. The results confirm the existence of the EKC for CO2 emissions in China. Gradual emission reduction is only possible with natural gas. It is presently eclipsed as part of the renewable energy mix. Policies and suggestions for cutting carbon emissions throughout the development of these sectors are strongly supported. Abbas et al. (2022) examined the impact of renewable energy growth, market regulation, and environmental innovation on CO2 emissions from BRICS nations in 1990–2020. The findings suggest a long-term correlation in which market regulation acts as a moderator. Initiatives such as market-based methods and taxation linked to the environment will also be among our strategies.
Magazzino (2015) states that a time series analysis investigated the relationship between GDP and energy consumption in Italy between 1970 and 2009. The study shows that both series are not stationary and have cointegration. Energy consumption and GDP share a causative relationship over a short period, and then the relationship becomes bidirectional in the long run. Dou et al. (2021) stated that the relationship between trade liberalization and carbon emissions in the China-Japan-South Korea area in 1970–2019 was examined. The agreement can lessen the promotion effect of trade freedom, which favorably impacts the greenhouse effect. When countries import more, their carbon emissions rise, and when they export, their emissions drop dramatically. Freer trade indirectly affects carbon emissions through changes in scale, technology, and the economy’s underlying structure. Policy recommendations for reducing the greenhouse effect and increasing high-quality Trade freedom are included in the report.
Wen et al. (2021) demonstrated the association between environmental quality and green innovation in South Asian countries. The study employs panel co-integration tests using FMOLS and DOLS to analyze long-run correlations using panel data from 1990 to 2014. The findings demonstrate how green innovation greatly enhances environmental quality and provides South Asia with policy alternatives for environmental sustainability.
Magazzino (2016) examined six GCC nations’ (Gulf Cooperation Council) real GDP, CO2 emissions, and energy usage during 1960–2013. Results demonstrate unit roots, with a definite long-run link only identified in Oman. Granger causality analysis reveals that energy consumption is the primary factor in Kuwait, Oman, and Qatar’s real GDP. The Kingdom of Saudi Arabia has yet to settle on a committed partnership. The research contradicts the common belief that energy does not influence economic expansion, implying that comprehensive energy policy may need to be revised.
Sengupta et al. (2019) demonstrated the correlation between economic and environmental performance in manufacturing sectors in India and China is centered on output and export. Because of its importance to the economy and exports, manufacturing often experiences fast export-led expansion that raises environmental problems. Using unit root tests and Johansen co-integration tests, data from the World Bank are analyzed starting in 1970 and continuing through 2016. The findings demonstrate a close correlation between China’s manufacturing output and CO2 emissions, with China’s impact being more significant than India’s. China’s enormous carbon dioxide emissions are exacerbated by the country’s extensive export of produced products.
According to Hardiyansah et al. (2021), disclosure of carbon emissions and moderating factors as they relate to company value. It uses the 82 Indonesian firms awarded ISRAs between 2014 and 2018 and traded on the Indonesia Stock Exchange. The findings demonstrate that investors consider carbon emission disclosure as part of evaluating a company’s sustainability and that this disclosure favors industrial production. Environmental performance and industrial type also influence the connection since organizations with ISO 14001 certificates try to ensure environmental sustainability. According to the study (Ferraris, 2022), the leather industry emphasizes industrial production vs. environmental performance (EP) and the mediating function of individual green values (IGV). The study used a resource-based theoretical framework to conclude that industrial production has a net positive effect on EP and makes an immense contribution to IGV development, affecting EP. However, the study found that government measures should dampen the link between industrial production and IGV.
3 Methodology
3.1 Conceptual framework
The conceptual framework was developed after thoroughly reviewing the relevant academic literature. The current study investigates the relationship between environmental performances (ecological foot-point) as the dependent and independent variables, including trade freedom, industrial production, urbanization, financial inclusion (FI), and energy efficiency (EE). The entire framework of the investigations is depicted in Figure 1.

Figure 1. Conceptual framework.
3.2 Research hypothesis
H1a. TF has a significant long-run influence on the EP (Ecological Foot-point).
H1b. TF has a significant short-run influence on the EP (Ecological Foot-point).
H2a. IP has a significant long-run influence on the EP (Ecological Foot-point).
H2b. IP has a significant short-run influence on the EP (Ecological Foot-point).
H3a. UR has a significant long-run influence on the EP (Ecological Foot-point).
H3b. UR has a significant short-run influence on the EP (Ecological Foot-point).
H4a. FI has a significant long-run influence on the EP (Ecological Foot-point).
H4b. FI has a significant short-run influence on the EP (Ecological Foot-point).
H5a. EE has a significant long-run influence on the EP (Ecological Foot-point).
H5b. EE has a significant short-run influence on the EP (Ecological Foot-point).
3.3 Data
Table 1 describes the factors used in the investigation. Trade freedom is defined as imports of goods and services (% of GDP); industrial production as a Value added (constant 2015 US dollars); urbanization is measured by population growth (annual %); financial inclusion is an index that measures the accessibility, depth, and efficiency of financial services; energy efficiency is measured by renewable energy consumption, which is % of total final energy consumption. Ecological footprint is measured in a total global hectare. The present study selected fifteen BRI countries for their initiative regarding the environment and strategic location in the continent, which possess unique geographical importance and advantages. This study is based on World Bank Indicator (WDI) data between 1991 and 2021. We converted all of them to logarithmic form to adjust for heteroscedasticity and lower the coefficients of the research variables.
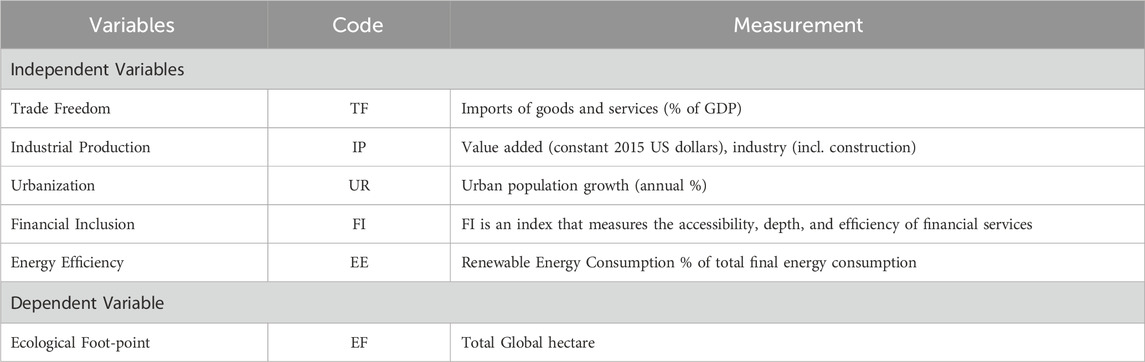
Table 1. Description of variables (Source: World economic indicators).
3.4 Cross-sectional dependence
Pesaran (2007) states that panel data constantly endure from cross-sectional dependence (CSD). According to the literature on CSD, conventional panel models are obsolete. Inadequate reporting of common-sequence dependence (CSD) of unobserved common factors reduces the accuracy of panel data, leading to inaccurate estimations (Phillips and Sul, 2003; Pesaran, 2004).
3.5 Panel unit root test
The panel unit root test method should be used if CSD is detected. This study employs the CSD augmented Im, Pesaran, and Shin test (CIPS) and (Pesaran, 2007)' test to investigate the stationarity of the variables. The CIPS tests enhance the first-generation panel data unit root tests, which do not include CSD. (Raza and Shah, 2017).
3.6 Panel cointegration test
The next step is to assess the long-term relationship through panel cointegration techniques. When I (1) appear in a series, studying the equilibrium state over numerous iterations is worthwhile. We use three distinct panel cointegration tests to determine whether or not the variables in the study are independent: the Pedroni test (Pesaran, 2007), the Kao test (Kao, 1999), and the Westerlund test (Westerlund, 2007). The effects of CSD and heterogeneity can be reduced by using the Westerlund panel cointegration test.
3.7 Model specification
This study uses a panel of FMOLS models to make long-term predictions. According to Chan (2005), one of the best techniques to analyze panel econometric heterogeneity is with FMOLS. To accommodate variability, this strategy reweights the data using the long-run covariance of cross-section estimates. We use the Group-FMOLS technique to anticipate the parameters’ intermediate and long-term correlations. The PMG-ARDL model (Ashraf et al., 2023) is used to analyze environmental performance concerning variables like trade freedom, industrial production, urbanization, and financial inclusion. Despite significant differences in short-run dynamics between countries, the pooled mean group assures that long-run coefficients are comparable. Al-Mulla et al. (2013) found that coefficients can indicate both short-term and long-term heterogeneity when the MG closely monitors the PMG estimate. If the findings of the previous methodologies do not show cointegration, the Panel Autoregressive Distributed Lag (ARDL) analysis is used. If the underlying regressors show me (0), me (1), or a combination of the two, the macro panel data technique is preferred (Pesaran and Shin, 1998), and the period exceeds 20 years. The dataset could have been more conducive to using the GMM estimator. To assess the relationship between government debt and GDP growth, we consult the extensive literature on dynamic panel data and use a variety of estimators, including Mean Group (MG), Pooled Mean Group (PMG), and Dynamic Two-Way Fixed Effect (DFE) (Pesaran and Smith, 1995; Pesaran et al., 1999). This study used the Pooled Mean Group-Autoregressive Distributed Lag (PMG-ARDL) model, which was proposed by Pesaran et al. (2007). It is about merging and averaging the coefficient across the cross-sectional units. According to existing research, this strategy outperforms prior single co-integration procedures, such as those used by Engle and Granger (1986) and Johansen and Juselius (1990), resulting in a superior econometric model. Unlike Engle and Granger (1986), this model does not suffer from endogeneity or the inability to test hypotheses on estimated coefficients across time. This research used the following empirical model in this case:
Table 1 provides information about the variable inputs.
4 Results
4.1 Descriptive statistics
Table 2 displays the descriptive statistical data for the variables. The average values for ecological footprint, energy efficiency, urbanization, financial inclusion, industrial production, trade freedom, and environmental performance are shown below. 7.743, 2.925, −1.169, 17.186, and 3.808, respectively. The minimum and highest values are 12.810, 22.362, 5.339, 29.383, 1.672, −0.159, and 4.512, respectively, with a range of −1.109 to −4.405 and −3.553 values. The standard deviation numbers are as follows: 1.462, 0.2255, 0.560, 2.749, 0.683, and 0.710. After using skewness, kurtosis, and Jarque-Bera tests to guarantee data normality, the results of this investigation were found to be expected.
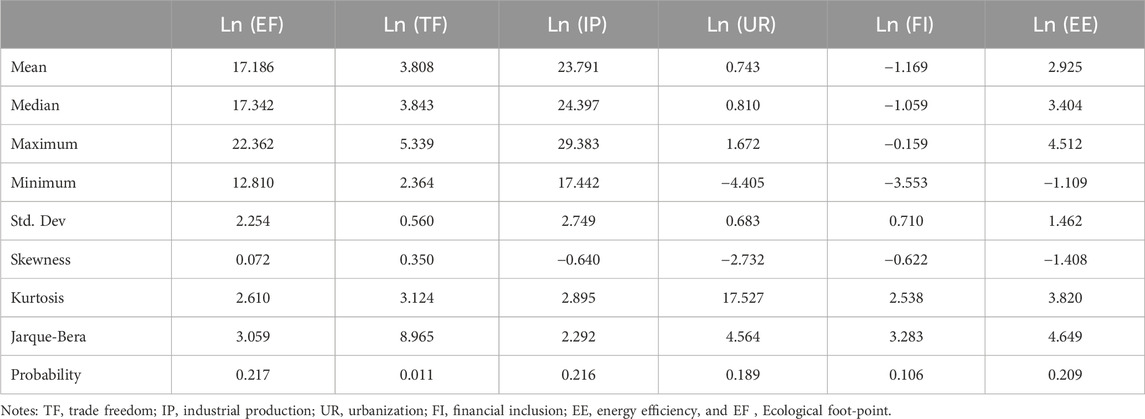
Table 2. Descriptive statistics.
4.2 Correlation matrix analysis
Environmental performance (ecological foot-point), energy efficiency, urbanization, financial inclusion, industrial production, trade freedom, and a correlation matrix demonstrate the relationship between these and other factors. Table 3 indicates that all factors had a positive and negative connection with ecological foot-point or environmental performance.
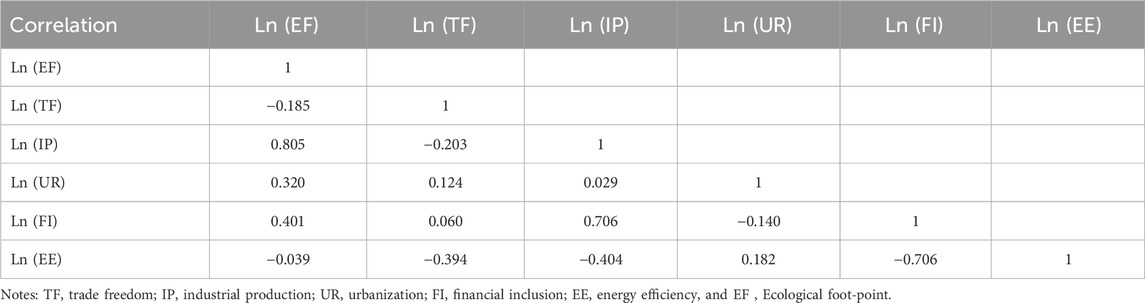
Table 3. Correlation analysis.
4.3 Cross section dependency test and unit root test
Table 4 shows the results of the cross-sectional dependencies (CD) test using the approach (Pesaran, 2004). This section discusses the empirical part of the study. The findings imply the presence of transnational dependencies, which contradicts the notion of cross-sectional independence. The findings show that events in one country might have a knock-on effect on the other countries under consideration. Based on the CD test results, the next step is assessing the degree of series stationarity. Remember that the research process is constructed so each stage runs independently to avoid inconsistencies. The CIPS employs a dependable method for establishing international correlations: the Second-generation panel unit root test. The results of testing the CIPS panel for unit roots are shown in Table 4. We used a CIPS-style unit-root test to check the stationarity of the three variables. However, when the 1% difference and trend thresholds are met, all variables approach stationary. (1) Integrating to the first order does not demonstrate that the variables are stationary. There is one unit root for the variable. So, we can reject Hypothesis 0.
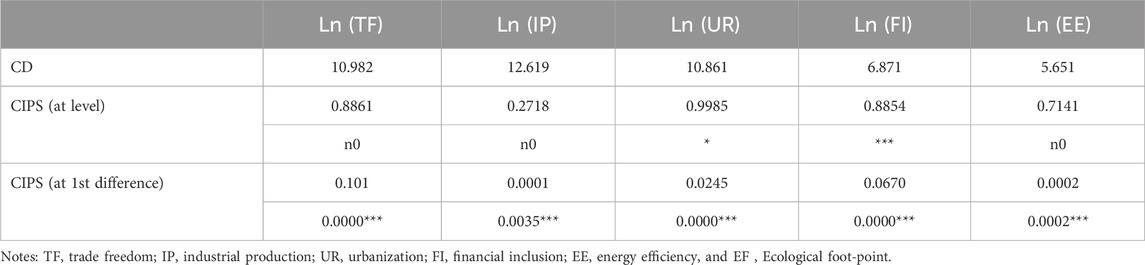
Table 4. Results of CD and CIPS unit root test.
4.4 FMOLS and DOLS test
Table 5 shows the anticipated values of the FMOLS and DOLS models. The coefficients of these models can be used to calculate the long-term implications. The FMOLS model for TF, IP, UR, and FI is positive, whereas the DOLS model for EF is negative; both models are statistically significant at 1% and 5%, respectively. Similarly, at 1% and 5%, the TF, IP, UR, FI, and EF models of the FMOLS and DOLS are statistically significant. FMOLS and DOLS validate the relevance and long-term estimation sign of the PMG-ARDL model.
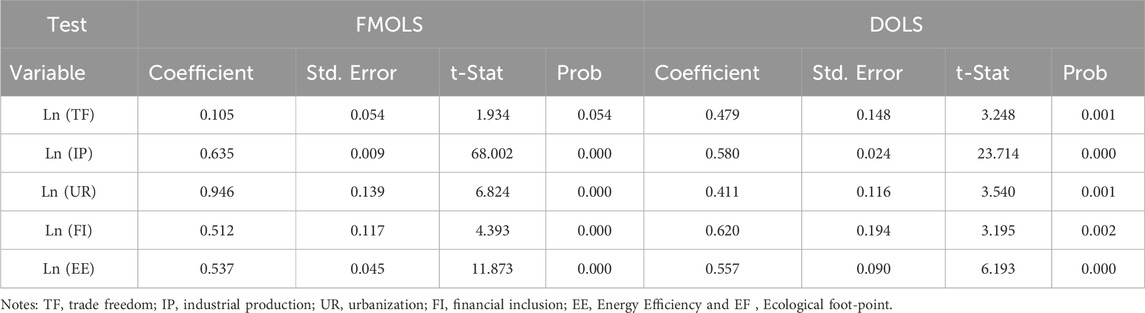
Table 5. FMLOS and DOLS test.
4.5 PMG-ARDL test
4.5.1 Short-run impact
Table 6 displays the outcome in the short term: The results (coefficient = 0.552, t-value = 10.180, and p-value = 0.000) show that trade freedom has a substantial short-term effect on environmental performance (ecological foot-point) at the 5% level of significance; thus, the (H: 1b) hypothesis has been accepted at the 1% level. This study’s findings are consistent with previous research (Ferraris, 2022). The (H: 2b) hypothesis was accepted at the 1% significance level because industrial output has a significant short-term impact on environmental performance (ecological foot-point). The findings support previous investigations’ findings (Ali et al., 2019). The first hypothesis (H: 3b) was accepted at the 1% level of significance because urbanization has a strong short-term impact on environmental performance (ecological foot-point) (coefficient = 0.808, t-value = 30.031, p-value = 0.000). This study’s findings are consistent with previous investigations (Mensah et al., 2019). The (H: 4b) hypothesis was accepted at a 1% level of significance because of the positive short-term effects of financial inclusion on environmental performance (ecological foot-point) (coefficient = 0.530, t = 4.943, and p-value = 0.000). Previous research has found the same results (Li R. et al., 2023). The findings (coefficient = 0.683, t-value = 9.091, and p-value = 0.000) indicate that the (H: 5b) hypothesis was accepted at the 1% level of significance and that energy efficiency has a significant short-run impact on environmental performance (ecological foot-point). The findings of this investigation are consistent with those of earlier studies (Albulescu et al., 2020). Therefore, the present study was employed to examine the short run model with the lag of ECT. The coefficient of ECT is −0.264, which indicates the speed of adjustment toward equilibrium. Here, the speed is 0.264 percent per unit.
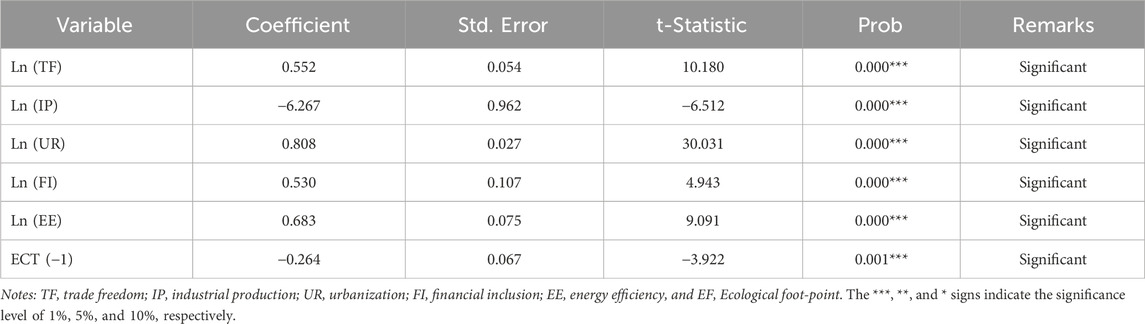
Table 6. Short-run impact.
4.5.2 Long-run impact
Table 7 displays the long-term outcomes: Based on the findings (coefficient = 0.521, t-value = 12.151, and p-value = 0.000) at the 5% significance level, we accept the (H: 1a) hypothesis at the 1% level of significance, which indicates that trade freedom has a significant short-run impact on environmental performance (ecological foot-point). This one was discovered in line with earlier investigations (Le et al., 2020). According to the findings (coefficient = −0.206, t-value = −2.077, and p-value = 0.038), industrial production significantly impacts environmental performance (ecological footing). As a result, the initial hypothesis (H: 2a) was accepted with a 1% significance level. Previous research has produced similar findings (Chaudhry et al., 2022). At a 1% level of significance, the (H: 3a) hypothesis was accepted because it showed that urbanization has a significant long-term effect on the environment (ecological foot-point) (coefficient = 0.837, t-value = 39.356, and p-value = 0.000). Previous research has produced similar findings (Zhao and Yang, 2020). At the 1% level of significance, the first hypothesis (H: 4a) was accepted because the long-term effects of financial inclusion on environmental performance (ecological foot-point) are statistically significant (coefficient = 0.524, t = 6.245, and p-value = 0.000). This study’s findings are consistent with previous research (Usman et al., 2021). The findings (coefficient = 0.949, t-value = 15.984, and p-value = 0.000) show that energy efficiency significantly impacts environmental performance (ecological footnote). Shows that, at the 1% significance level, the initial hypothesis (H: 5a) was accepted. Other research has found similar results (Koomson and Danquah, 2021).
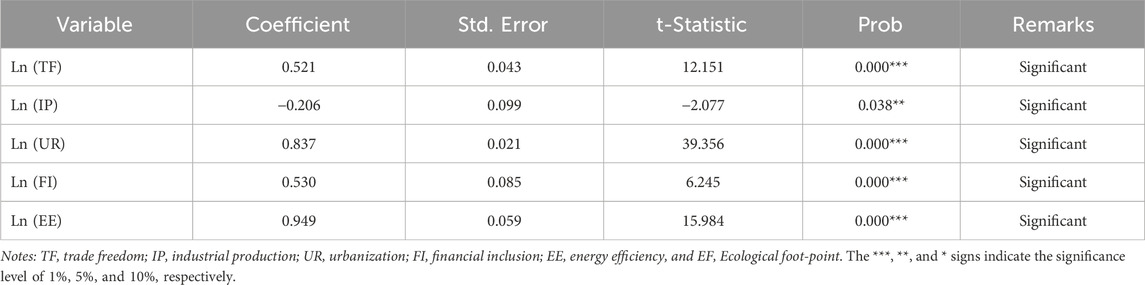
Table 7. Long-run impact.
4.6 Dumitrescu hurlin panel causality tests
This study also investigates the impact of trade freedom, industrial output, urbanization, financial inclusion, and energy efficiency on the environmental performance (from an ecological standpoint) of Belt and Road Initiative (BRI) countries. Table 8 presents the results of the causality test. The results demonstrated a direct relationship between IP*TF and EP. Countries participating in the Belt and Roads Initiative (BRI) have their EF forecasted accurately using IP*TF. We also discovered evidence of a unidirectional causal relationship between TF and EF, implying that changes in TF levels will affect EF levels.
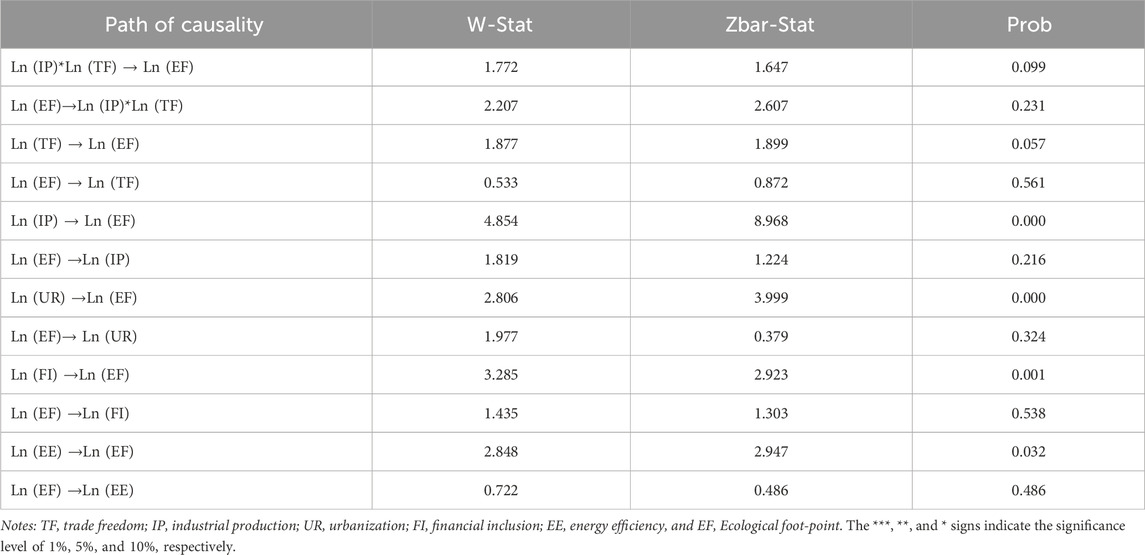
Table 8. Dumitrescu hurlin panel causality test.
Furthermore, we discovered that IP predicts EF in countries participating in the Belt and Roads Initiative (BRI), indicating that the relationship is causal but only in one direction. We discovered that UR and EF are only causally connected in one way, implying that changes to UR will have a considerable impact on EF. Changes in FI will affect EF, as we discovered a unidirectional causal relationship between the two variables. Finally, changes to EE will affect EF because there is evidence of a one-way causal relationship between the two.
5 Discussion and conclusion
5.1 Discussion
The FMOLS and DOLS models for trade freedom, industrial production, urbanization, financial inclusion, and energy efficiency have a statistically significant coefficient of 1%. FMOLS and DOLS verify the PMG-ARDL model’s long-term sign and significance estimation. The results show the short-run and long-run impact: It is important to note that the long-run and short-run effects of trade freedom on the ecological footprint in Belt and Road Initiatives (BRI) countries can vary from country to country. Each Belt and Road Initiative (BRI) country has its dynamic situation. The steps each country takes to limit environmental harm through implementing regulations may affect the total effects of free trade on the ecological footprint. The interaction of several factors, such as legal restrictions, technical advances, and public consumption of green products, would play a role in economic growth from a long-term sustainability perspective (Lin and Abudu, 2020). Besides this, it is essential to consider that every Belt and Road Initiative (BRI) nation is in its position, has distinct circumstances, is at different levels of government, and has its degrees of adhesion to sustainable development policy.
Various determinants, such as government legislation, new technological breakthroughs, and public and private sector commitment to sustainable practices, are significant elements shaping the long-term prospects of financial development consistent with environmentally responsible practices. This demonstrates that even in BRI countries, the impact of urbanization and environmental degradation in the city depends on the city and region. Reducing the ecological footprint of urbanization results from multiple factors such as urban design, infrastructure development, policy, and awareness among the masses. Integration of green urban development and planning is indispensable to avoid the environmental issues that may unfold in the future due to the acceleration of urbanization. On the other hand, politics, personal lifestyle choices, and, to some degree, a person’s economic status play a role in the environmental effect of a country’s initiative. Although some of the early-day environmental issues will appear due to rising consumption and development, the final environmental implications will depend on how successful the management of financial inclusion is and the discussions on sustainable behaviors and investments. By developing an innovative strategy to enhance financial inclusion and regulatory frameworks, the business’s ecological footprint can be reduced gradually (Sengupta et al., 2019; Dou et al., 2021). Reducing ecological footprint, the main element of implementing energy efficiency and sustainable development, is the core activity of countries participating in BRI. They address and solve the environmental problems of right now by saving energy and cutting the use of harmful substances. Therefore, technological advancements in nanotechnology can lead to long-term evolution for companies towards a healthier ecological development (Magazzino, 2016; Hardiyansah et al., 2021).
5.2 Conclusion
At the end of this study, several factors will be analyzed: trade openness, industrial production, urbanization, financial inclusion, and energy efficiency and their effect on environmental performance. This study collects data from 1991 to 2022. The relationship between trade freedom and environmental performance (ecological foot-point) Each Belt and Road Initiatives (BRI) country has its own set of circumstances, and the amount to which it implements regulations to limit environmental harm may impact the overall impact of trade freedom on the ecological footprint. However, the relationship between industrial production and environmental performance (ecological foot-point) is essential; each Belt and Roads Initiatives (BRI) country has distinct circumstances, policies, and levels of commitment to sustainable development, which define the entire impact of industrial production on the ecological footprint in those countries. Therefore, the relationship between urbanization and ecological foot-point. Sustainable urban development and planning are needed in Belt and Roads Initiatives (BRI) countries to offset the negative ecological effects of urbanization over time. The ecological effect of financial inclusion is carefully considered. Managing and altering financial inclusion to lead to benign behaviors and investments can have broader effects on the environment, even though more consumption and development may cause adverse environmental effects in the short term. Moreover, energy efficiency and ecological footprint share a strong relationship. Energy efficiency initiatives, which enable BRICS countries, are a crucial aspect in the Sustainable development of the BRI by reducing the ecological footprint.
5.3 Implications
5.3.1 Theoretical implications
The study examines the theoretical implications of Ecological Modernization Theory and Social Capital Theory on Belt and Road Initiative (BRI) countries. Ecological Modernization Theory focuses on aligning economic development with environmental sustainability, which is crucial for BRI nations to balance industrialization with environmental preservation. Social Capital Theory examines the role of social networks and relationships in shaping environmental performance within BRI countries. If stronger social capital, characterized by trust and cooperation, positively influences environmental practices, it could validate the theory’s relevance in addressing environmental challenges. Policies promoting social capital and community engagement could enhance environmental performance.
Moreover, the investigation discusses people’s social networks, which aid in accepting greener innovations and environmentally friendly practices. The study contests conventional frameworks through empirical analysis and offers refined interpretations and possibilities for different understandings of the evolutionary process. It incorporates theories from different fields and uses innovative techniques to provide a rounded framework for sustainability-related discussions in BRI economies.
5.3.2 Practical implications
This study of environmental performance within Belt and Road Initiative (BRI) countries under the influence of trade openness, industrial manufacturing, energy efficiency, urbanization, and financial initiative has functional, practical implications. It can recommend policymakers, pull investors’ indicator strings, and shape BRI projects’ behaviors to be eco-friendly. It can boost the volume of green finance and capacity in renewable sources and strengthen multilateral cooperation on solving transboundary environmental problems. Environmental conditions in BRI are ensured by undertaking routine ecological impact assessments during the project conducted and supporting local communities to make environmental and social benefits familiar. The research increases awareness among the public concerning the issue of striking a balance between economic development and environmental protection. Thus, BRI countries and all countries involved in the process will benefit. One of the fundamental prerequisites for identifying the objectives and imposing responsibilities is to achieve transparency and stakeholder confidence. On the other hand, it is through awareness of the underlying forces behind determining sustainable development and sustainability strategies over extended periods.
5.4 Limitations and future directions
The research has various limitations, such as insufficient data availability, reliability, and coverage; care for generalizations to other locations or the globe; and variable biases or measurement errors connected to financial inclusion, trade openness, industrial production, urbanization, and energy efficiency. The study is based on cross-sectional data, which may need revision to identify cause-and-effect patterns and trends. Longitudinal studies should be prioritized for future analysis, covering various aspects such as analysis of the same variables, identification of trends across the years, and assessment of all possible changes. Additionally, the limitations associated with analyzing BRI economies may require involvement from other countries and researchers. Qualitative analysis and investigation of policy, technology, or institutional backgrounds may help identify more important factors.
Data availability statement
The raw data supporting the conclusion of this article will be made available by the authors, without undue reservation.
Author contributions
MR: Conceptualization, Data curation, Writing–original draft, Formal analysis, Funding acquisition, Investigation. MN: Conceptualization, Data curation, Writing–original draft, Formal analysis, Funding acquisition, Investigation. MA: Investigation, Methodology, Project administration, Resources, Writing–review and editing. YA: Investigation, Methodology, Project administration, Resources, Writing–review and editing.
Funding
The author(s) declare financial support was received for the research, authorship, and/or publication of this article. Researchers Supporting Project number (RSPD 2024R932), King Saud University, Riyadh, Saudi Arabia.
Acknowledgments
The authors extend heartfelt thanks to the editorial board and the reviewers for their valuable suggestions.
Conflict of interest
The authors declare that the research was conducted in the absence of any commercial or financial relationships that could be construed as a potential conflict of interest.
Publisher’s note
All claims expressed in this article are solely those of the authors and do not necessarily represent those of their affiliated organizations, or those of the publisher, the editors and the reviewers. Any product that may be evaluated in this article, or claim that may be made by its manufacturer, is not guaranteed or endorsed by the publisher.
References
Abbas, S., Gui, P., Ai, C., and Ali, N. (2022). The effect of renewable energy development, market regulation, and environmental innovation on CO2 emissions in BRICS countries. Environ. Sci. Pollut. Res. 29, 59483–59501. doi:10.1007/s11356-022-20013-7
Ahsan, F., Chandio, A. A., and Fang, W. (2020). Climate change impacts on cereal crops production in Pakistan: evidence from cointegration analysis. Int. J. Clim. Change Strategies Manag. 12 (2), 257–269. doi:10.1108/IJCCSM-04-2019-0020
Alam, M., Rakkibu, M., and Rahman, M. (2012). People’s attitude towards social forestry: a case study in rajshahi. J. Environ. Sci. Nat. Resour. 5 (1), 217–222. doi:10.3329/jesnr.v5i1.11585
Albulescu, C. T., Artene, A. E., Luminosu, C. T., and Tămășilă, M. (2020). CO2 emissions, renewable energy, and environmental regulations in the EU countries. Environ. Sci. Pollut. Res. 27 (27), 33615–33635. doi:10.1007/s11356-019-06155-1
Ali, N., Hu, X., Hussain, J., and Nilofar, M. (2021). Assessing the environmental impactsof COVID-19; A review. Assess. Environ. Impacts COVID-19 ; A Rev. 30 (5), 4401–4403. doi:10.15244/pjoes/130337
Ali, N., Phoungthong, K., Techato, K., Ali, W., Abbas, S., Dhanraj, J. A., et al. (2022) FDI, green innovation and environmental quality nexus: new insights from BRICS economies, 1–17.
Ali, S., Gucheng, L., Ying, L., and Ishaq, M. (2019) The relationship between carbon dioxide emissions, economic growth and agricultural production in Pakistan: an autoregressive distributed lag analysis.
Al-mulali, U., Fereidouni, H. G., Lee, J. Y. M., and Sab, C. N. B. C. (2013). Exploring the relationship between urbanization, energy consumption, and CO2 emission in MENA countries. Renew. Sustain. Energy Rev. 23, 107–112. doi:10.1016/j.rser.2013.02.041
Ashraf, I., Ahmad, S., Dastan, D., Wang, C., Garmestani, H., and Iqbal, M. (2023). Delaminated N-Ti3C2@Ni3S4 nanocomposites based high-performing supercapacitor device fabrication. Electrochimica Acta 442, 141899. doi:10.1016/j.electacta.2023.141899
Baek, J. (2016). A new look at the FDI–income–energy–environment nexus: dynamic panel data analysis of ASEAN. Energy Policy 91, 22–27. doi:10.1016/j.enpol.2015.12.045
Baek, J., Cho, Y., and Koo, W. W. (2009). The environmental consequences of globalization: a country-specific time-series analysis. Ecol. Econ. 68 (8), 2255–2264. doi:10.1016/j.ecolecon.2009.02.021
Cai, Y., Sam, C. Y., and Chang, T. (2018). Nexus between clean energy consumption, economic growth and CO2 emissions. J. Clean. Prod. 182, 1001–1011. doi:10.1016/j.jclepro.2018.02.035
Chaabouni, S., and Saidi, K. (2017). The dynamic links between carbon dioxide (CO2) emissions, health spending and GDP growth: a case study for 51 countries. Environ. Res. 158, 137–144. doi:10.1016/j.envres.2017.05.041
Chan, R. Y. K. (2005). Does the natural-resource-based view of the firm apply in an emerging economy? A survey of foreign invested enterprises in China*. J. Manag. Stud. 42 (3), 625–672. doi:10.1111/j.1467-6486.2005.00511.x
Chandio, A. A., Akram, W., Bashir, U., Ahmad, F., Adeel, S., and Jiang, Y. (2023). Sustainable maize production and climatic change in Nepal: robust role of climatic and non-climatic factors in the long-run and short-run. Environ. Dev. Sustain. 25 (2), 1614–1644. doi:10.1007/s10668-022-02111-1
Chang, C.-C. (2010). A multivariate causality test of carbon dioxide emissions, energy consumption and economic growth in China. Appl. Energy 87 (11), 3533–3537. doi:10.1016/j.apenergy.2010.05.004
Chaudhry, I. S., Yusop, Z., and Habibullah, M. S. (2022). Financial inclusion-environmental degradation nexus in OIC countries: new evidence from environmental Kuznets curve using DCCE approach. Environ. Sci. Pollut. Res. 29 (4), 5360–5377. doi:10.1007/s11356-021-15941-9
Chenran, X., Limao, W., Chengjia, Y., Qiushi, Q., and Ning, X. (2019). Measuring the effect of foreign direct investment on CO2 emissions in Laos. J. Resour. Ecol. 10 (6), 685–691. doi:10.5814/j.issn.1674-764x.2019.06.014
Danish, K., Zhang, J., Hassan, S. T., and Iqbal, K. (2020). Toward achieving environmental sustainability target in Organization for Economic Cooperation and Development countries: the role of real income, research and development, and transport infrastructure. Sustain. Dev. 28(1), 83–90. doi:10.1002/sd.1973
Dong, K., Sun, R., and Dong, X. (2018). CO2 emissions, natural gas and renewables, economic growth: assessing the evidence from China. Sci. Total Environ. 640–641, 293–302. doi:10.1016/j.scitotenv.2018.05.322
Dou, Y., Zhao, J., Malik, M. N., and Dong, K. (2021). Assessing the impact of trade openness on CO2 emissions: evidence from China-Japan-ROK FTA countries. J. Environ. Manag. 296, 113241. doi:10.1016/j.jenvman.2021.113241
Ferraris, A. (2022) Factors affecting environmental performance during the covid-19 period in the leather industry: a moderated-mediation approach factors affecting environmental performance during the covid-19 period in the leather industry: a moderated-mediation approach. doi:10.7441/joc.2022.01.01
Ge, Y. (2023) Does improving economic ef fi ciency reduce ecological footprint ? The role of fi nancial development, renewable energy, and industrialization. doi:10.1177/0958305X231183914
Hardiyansah, M., Agustini, A. T., and Purnamawati, I. (2021). The effect of carbon emission disclosure on firm value: environmental performance and industrial type. Korea Distribution Sci. Assoc. 8 (1), 123–133. doi:10.13106/jafeb.2021.vol8.no1.123
Hu, X., Ali, N., Malik, M., and Hussain, J. (2021) Impact of economic openness and innovations on the environment: a new look into ASEAN countries. doi:10.15244/pjoes/130898
Hussain, J., Zhou, K., Muhammad, F., Khan, D., Khan, A., Ali, N., et al. (2021). Renewable energy investment and governance in countries along the belt & road initiative: does trade openness matter? Renew. Energy 180 (September), 1278–1289. doi:10.1016/j.renene.2021.09.020
Id, N. A., Id, K. P., Khan, A., and Abbas, S. (2023) Does FDI foster technological innovations ? Empirical evidence from BRICS economies, 1–20. doi:10.1371/journal.pone.0282498
Kao, C. (1999). Spurious regression and residual-based tests for cointegration in panel data. J. Econ. 90 (1), 1–44. doi:10.1016/S0304-4076(98)00023-2
Khan, I., and Hou, F. (2021). Does multilateral environmental diplomacy improve environmental quality? The case of the United States. Environ. Sci. Pollut. Res. 28 (18), 23310–23322. doi:10.1007/s11356-020-12005-2
Koomson, I., and Danquah, M. (2021). Financial inclusion and energy poverty: empirical evidence from Ghana. Energy Econ. 94, 105085. doi:10.1016/j.eneco.2020.105085
Le, T.-H., Le, H.-C., and Taghizadeh-Hesary, F. (2020). Does financial inclusion impact CO2 emissions? Evidence from Asia. Finance Res. Lett. 34, 101451. doi:10.1016/j.frl.2020.101451
Li, G., Zakari, A., and Tawiah, V. (2020a). Does environmental diplomacy reduce CO2 emissions? A panel group means analysis. Sci. Total Environ. 722, 137790. doi:10.1016/j.scitotenv.2020.137790
Li, G., Zakari, A., and Tawiah, V. (2020b). Does environmental diplomacy reduce CO2 emissions? A panel group means analysis. Sci. Total Environ. 722, 137790. doi:10.1016/j.scitotenv.2020.137790
Li, R., Wang, Q., Li, L., and Hu, S. (2023a). Do natural resource rent and corruption governance reshape the environmental Kuznets curve for ecological footprint? Evidence from 158 countries. Resour. Policy 85, 103890. doi:10.1016/j.resourpol.2023.103890
Li, T., Yue, X.-G., Waheed, H., and Yıldırım, B. (2023b). Can energy efficiency and natural resources foster economic growth? Evidence from BRICS countries. Resour. Policy 83, 103643. doi:10.1016/j.resourpol.2023.103643
Li, X., and Yang, L. (2023). Natural resources, remittances and carbon emissions: a Dutch Disease perspective with remittances for South Asia. Resour. Policy 85, 104001. doi:10.1016/j.resourpol.2023.104001
Lin, B., and Abudu, H. (2020). Can energy conservation and substitution mitigate CO2 emissions in electricity generation? Evidence from Middle East and North Africa. J. Environ. Manag. 275, 111222. doi:10.1016/j.jenvman.2020.111222
Magazzino, C. (2015). Energy consumption and GDP in Italy: cointegration and causality analysis. Environ. Dev. Sustain. 17 (1), 137–153. doi:10.1007/s10668-014-9543-8
Magazzino, C. (2016). The relationship between real GDP, CO2 emissions, and energy use in the GCC countries: a time series approach. Cogent Econ. Finance 4 (1), 1152729. doi:10.1080/23322039.2016.1152729
Mensah, I. A., Sun, M., Gao, C., Omari-Sasu, A. Y., Zhu, D., Ampimah, B. C., et al. (2019). Analysis on the nexus of economic growth, fossil fuel energy consumption, CO2 emissions and oil price in Africa based on a PMG panel ARDL approach. J. Clean. Prod. 228, 161–174. doi:10.1016/j.jclepro.2019.04.281
Nwafor, A. O. (2014). Combating environmental degradation through diplomacy and corporate governance (part 1). Mediterr. J. Soc. Sci. 5 (20), 202–210. doi:10.5901/mjss.2014.v5n20p202
Pesaran, M. H. (2004) General diagnostic tests for cross section dependence in panels general diagnostic tests for cross section dependence in panels ∗, 1229.
Pesaran, M. H. (2007). HETEROGENEITY AND CROSS SECTION DEPENDENCE IN PANEL DATA MODELS: THEORY AND APPLICATIONS INTRODUCTION. J. Appl. Econ. 232, 229–232. doi:10.1002/jae
Phillips, P. C. B., and Sul, D. (2003). Dynamic panel estimation and homogeneity testing under cross section dependence. Econ. J. 6 (1), 217–259. doi:10.1111/1368-423X.00108
Rauf, A., Ali, N., Sadiq, M. N., Abid, S., and Kayani, S. A. (2023) Foreign direct investment, technological innovations, energy use, economic growth, and environmental sustainability nexus: new perspectives in BRICS economies.
Raza, S. A., and Shah, N. (2017). Tourism growth and income inequality: does Kuznets Curve hypothesis exist in top tourist arrival countries. Asia Pac. J. Tour. Res. 22 (8), 874–884. doi:10.1080/10941665.2017.1343742
Rehman, A., Ma, H., Ahmad, M., Irfan, M., Traore, O., and Ali, A. (2021). Towards environmental Sustainability: devolving the influence of carbon dioxide emission to population growth, climate change, Forestry, livestock and crops production in Pakistan. Ecol. Indic. 125, 107460. doi:10.1016/j.ecolind.2021.107460
Sengupta, P. P., Sinha, M., and Dutta, U. P. (2019). Economic and environmental performances in manufacturing industries: a comparative study. Periodicals Eng. Nat. Sci. 7 (1), 99–108. doi:10.21533/pen.v7i1.416
Tayebi, S., Moosavi, S. F., and Poorhashemi, S. A. (2016). Environmental diplomacy: a framework for growth of international interaction and cooperation for achievement of global peace. J. Polit. Law 9 (9), 150. doi:10.5539/jpl.v9n9p150
Usman, M., Makhdum, M. S. A., and Kousar, R. (2021). Does financial inclusion, renewable and non-renewable energy utilization accelerate ecological footprints and economic growth? Fresh evidence from 15 highest emitting countries. Sustain. Cities Soc. 65, 102590. doi:10.1016/j.scs.2020.102590
Wang, H., Hu, X., and Ali, N. (2022). Spatial characteristics and driving factors toward the digital economy: evidence from prefecture-level cities in China. J. Asian Finance Econ. Bus. 9 (2), 419–426. doi:10.13106/jafeb.2022.vol9.no2.0419
Wang, Q. (2023) Exploring the impact of geopolitics on the environmental Kuznets curve research. September. doi:10.1002/sd.2743
Wang, Q. (2024) Reinvestigating the environmental Kuznets curve in 147 countries: a matter of trade protectionism. doi:10.1057/s41599-024-02639-9
Wang, Q., Hu, S., and Li, R. (2024a). Could information and communication technology (ICT) reduce carbon emissions? The role of trade openness and financial development. Telecommun. Policy 48 (3), 102699. doi:10.1016/j.telpol.2023.102699
Wang, Q., Wang, L., and Li, R. (2024b) Trade openness helps move towards carbon neutrality — insight from 114 countries. doi:10.1002/sd.2720
Wardhani, B., and Dugis, V. (2020). Greening surabaya: the city’s role in shaping environmental diplomacy. Bandung 7(2), 236–258. doi:10.1163/21983534-00702005
Wen, J., Ali, W., Hussain, J., Khan, N. A., Hussain, H., Ali, N., et al. (2021) Dynamics between green innovation and environmental quality: new insights into South Asian economies Dynamics between green innovation and environmental quality: new insights into South Asian economies. doi:10.1007/s40888-021-00248-2
Westerlund, J. (2007). Testing for error correction in panel data*. Oxf. Bull. Econ. Statistics 69 (6), 709–748. doi:10.1111/j.1468-0084.2007.00477.x
Xu, D., Abbas, S., Rafique, K., and Ali, N. (2023). The race to net-zero emissions: can green technological innovation and environmental regulation be the potential pathway to net-zero emissions? Technol. Soc. 75, 102364. doi:10.1016/j.techsoc.2023.102364
Keywords: trade freedom, industrial production, urbanization, financial inclusion, energy efficiency, environmental performance, PMG-ARDL, belt and roads initiatives (BRI) countries
Citation: Rizwanullah M, Nasrullah M, Alnafissa M and Alamri Y (2024) The role of financial inclusion, urbanization, and energy efficiency on environmental performance in belt and roads initiative (BRI) economies. Front. Environ. Sci. 12:1333998. doi: 10.3389/fenvs.2024.1333998
Received: 06 November 2023; Accepted: 29 April 2024;
Published: 14 May 2024.
Edited by:
Tian Tang, Florida State University, United StatesReviewed by:
Hasumati A Rahalkar, Other,Rongrong Li, China University of Petroleum, China
Najabat Ali, Soochow University, China
Copyright © 2024 Rizwanullah, Nasrullah, Alnafissa and Alamri. This is an open-access article distributed under the terms of the Creative Commons Attribution License (CC BY). The use, distribution or reproduction in other forums is permitted, provided the original author(s) and the copyright owner(s) are credited and that the original publication in this journal is cited, in accordance with accepted academic practice. No use, distribution or reproduction is permitted which does not comply with these terms.
*Correspondence: Muhammad Nasrullah, bmFzcnVsbGFoZWNvbm9taXN0QGhvdG1haWwuY29t; Mohamad Alnafissa, bWFsbmFmaXNzYUBrc3UuZWR1LnNh