 Rufa Tao
 Yuling Huang
 Erqing Hui3,4
94% of researchers rate our articles as excellent or good
Learn more about the work of our research integrity team to safeguard the quality of each article we publish.
Find out more
HYPOTHESIS AND THEORY article
Front. Environ. Sci., 23 July 2024
Sec. Water and Wastewater Management
Volume 12 - 2024 | https://doi.org/10.3389/fenvs.2024.1331092
This article is part of the Research TopicEnergy, Economy, and Climate Interactions: Challenges and Opportunities, volume IIView all 13 articles
Wastewater treatment plants (WWTPs) play a crucial role in modern urban water environmental protection. However, they face challenges related to high operational costs and carbon emissions. This study focused on addressing these issues through an analysis of four urban WWTPs in Jiujiang city, China. The study involved comparing the size and processes of the plants, evaluating influent and effluent water quality, assessing energy consumption and chemical usage, and calculating both direct and indirect carbon emissions. The results demonstrated that the high operational costs and increased carbon emissions in these WWTPs were primarily attributed to low hydraulic loadings, low influent concentration, and high energy and chemical consumption. In response, three targeted scenarios were proposed to enhance the efficiency of the WWTPs and reduce carbon emissions. These scenarios involved adjusting the amount of wastewater imported into the WWTPs to meet the designed capacity, optimizing operating costs, or combining both approaches. Among the scenarios, Scenario 3 emerged as the most effective in terms of improving efficiency and reducing carbon emissions. The operational costs for WWTPs could be reduced in the range of 0.42–1.04 RMB/m3, representing a reduction rate of 35%–57%. Additionally, carbon emissions could be lowered from 15.02 to 598.85 gCO2e/m3, corresponding to a reduction of 2.91%–41.38%. Although Scenario 2 exhibited a lower carbon emission reduction of 14.8–316.33 gCO2e/m3, it was identified as the most feasible and easily implementable high-efficiency solution at present, with a reduction in operational costs ranging from 0.43 to 1.31 RMB/m3. To achieve zero energy consumption and zero carbon emissions in wastewater treatment in the future, it is recommended to undertake additional measures, such as enhancing dosing system accuracy, implementing tail gas collection, adopting photovoltaic power generation, implementing carbon sequestration techniques, and exploring wastewater heat source recycling. These findings provide valuable insights for optimizing the operational efficiency of urban WWTPs, reducing carbon emissions, and promoting sustainable wastewater treatment practices in Jiujiang city, China.
In response to the urgent global climate change problem, the United Nations convened a historic signing ceremony for the Paris Agreement in New York, USA, on 22 April 2016. Over 170 countries participated in this event, emphasizing their commitment to address climate change (Paris Agreement, 2015). China, recognizing the significance of this issue, formally acceded to the Paris Agreement on 3rd September of the same year and established its own national autonomous contribution target. This target aimed to reduce carbon dioxide emissions per unit of gross domestic product by 40%–45% by 2020 and by 60%–65% by 2030 when compared with the 2005 levels, showcasing China’s commitment as a responsible major nation (Zhang, 2016). In 2020, China further demonstrated its dedication to climate change mitigation by presenting two key proposals during the United Nations General Assembly. The first proposal focused on achieving a “carbon peak,” which signifies reaching a point where national greenhouse gas emissions cease to rise and gradually decline. The second proposal aimed for “carbon neutrality,” which involves implementing emission reduction measures to reduce anthropogenic greenhouse gas emissions and ultimately achieve a balance between emissions and natural absorption (Zhao et al., 2022). These initiatives highlight China’s proactive approach to tackling climate change and its determination to contribute to global efforts in mitigating the impacts of greenhouse gas emissions. By aligning its goals with the Paris Agreement and setting ambitious targets, China plays a significant role in addressing climate change and fostering sustainable development on a global scale.
In line with China’s strong commitment to “carbon peaking and carbon neutrality” goals, the wastewater treatment industry must actively contribute to addressing climate change and reducing carbon emissions. Globally, the wastewater treatment sector ranks among the top 10 carbon-emitting industries, with greenhouse gas emissions from the treatment process accounting for 1.6% of the world’s total emissions (Jegatheesan et al., 2009; Gu et al., 2023). As urbanization continues to expand and the scale of wastewater collection and treatment increases, greenhouse gas emissions from the industry have steadily risen. Between 2005 and 2020, the rise in global emissions of nitrous oxide (N2O) and methane (CH4) from wastewater treatment is estimated at 13% and 20%, respectively (Paustian et al., 2001; Gupta et al., 2012).
The growth of the wastewater treatment industry in China exemplifies this trend. In 1978, China had only 37 urban wastewater treatment plants (WWTPs). However, by 2019, this number had surged to 4,140, representing an astounding growth rate of 2,836% (Kitano et al., 2023). The total annual greenhouse gas emissions from these plants in China has exceeded 39.84 million tons, with a national daily wastewater treatment capacity of 178.63 million tons (Xiaoshan et al., 2007). These emissions contribute to an intensified greenhouse effect, leading to rising global temperatures, elevated sea levels, and disruptions in ecosystems, which include a rise in more frequent and severe extreme weather events (Zickfeld et al., 2017).
Recent reports highlight the urgency of addressing climate change. The World Meteorological Organization (WMO) states that Latin America and the Caribbean have experienced an average warming of 0.2°C per decade over the past 30 years, while the snowpack of glaciers in the central Andes has nearly disappeared (Bodin et al., 2010; Vergara et al., 2013). The WMO’s State of the Global Climate report indicates a 66% probability of the global near-surface annual mean temperature temporarily exceeding pre-industrial levels by 1.5°C in at least 1 year between 2023 and 2027 (Deben et al., 2013). In light of these increasingly severe climatic changes and global warming trends, reducing carbon emissions has become an urgent task for the entire global community.
Given this context, it is imperative for the wastewater treatment industry to actively contribute to carbon emission reduction efforts, aligning with China’s goals and global initiatives. By implementing sustainable practices and adopting innovative technologies, the industry can play a pivotal role in mitigating climate change and fostering a more sustainable future.
Furthermore, it is important to acknowledge that wastewater treatment is a highly energy-intensive process. Studies have shown that in Europe, wastewater collection and treatment account for approximately 1% of global electricity consumption (Yang et al., 2021). WWTPs collectively contribute to over 20% of global electricity consumption (Longo et al., 2016). This poses a significant challenge for the wastewater treatment industry, particularly in terms of cost, as operating expenses constitute a substantial portion. These costs encompass energy consumption, material usage, and labor-related expenses (Abuhasel et al., 2021). The United Nations General Assembly had recognized sustainable development as the pivotal aspect of environmental protection and socioeconomic progress back in 2005. However, many WWTPs still consume excessive energy during wastewater treatment, resulting in noticeable waste management and financial constraints. Strengthened legal frameworks and environmental regulations have driven continuous upgrades in wastewater treatment processes, further increasing operational costs (Maktabifard et al., 2018). These factors significantly impact the sustainable development of WWTPs, making it crucial to focus on reducing energy consumption and operational costs.
Currently, microbial electrochemical technologies have gained popularity as a means of recovering energy from waste streams through bioreactors. Examples include microbial electrolysis cells for electromethanogenesis (Pawar et al., 2022), microbial electrolysis cells with non-platinum catalysts and binders in cathodes (Son et al., 2021), microbial desalination cells (Zahid et al., 2022), and the valorization of CO2 into value-added products through microbial electrosynthesis and electro-fermentation technologies (Quraishi et al., 2021). However, this article proposes a novel perspective that can significantly reduce costs and achieve sustainable development. It conducts a comprehensive analysis of carbon emissions and economic efficiency within four major urban WWTPs in Jiujiang city, China. The analysis employs methods recommended in the “2019 IPCC Guidelines for National Greenhouse Gas Inventory” to calculate generated carbon emissions. Additionally, it takes into account the chemical consumption of each WWTP and the unit prices of consumables to calculate the economic benefits and carbon reduction amounts under different scenarios. Finally, the article proposes recommendations for improving the operational efficiency of WWTPs in a dual-carbon context, as illustrated in Figure 1.
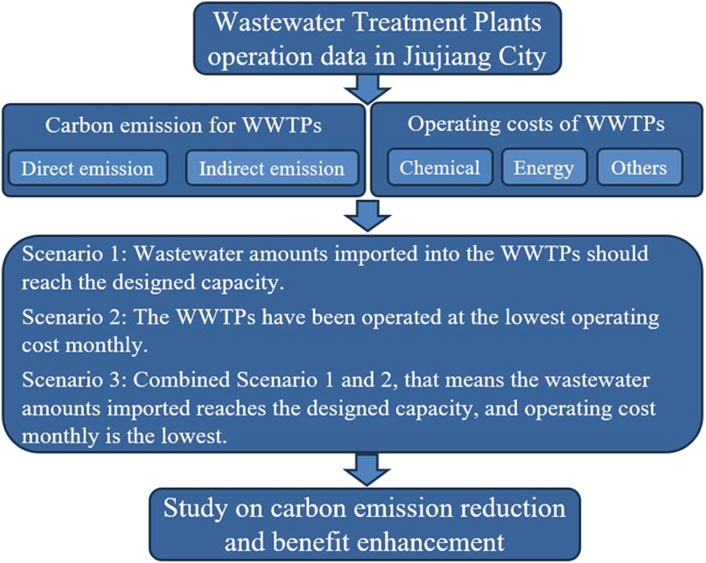
Figure 1. The technical roadmap.
This study chose four representative WWTPs in Jiujiang city, denoted as A, B, C, and D. Plant A caters to a population of approximately 150,000, with a total daily processing capacity of 30,000 m3. Plant B serves approximately 100,000 residents and has a total daily processing capacity of 15,000 m3. Plant C accommodates approximately 120,000 inhabitants and possesses a total daily processing capacity of 30,000 m3. Plant D, the largest among them, serves a population of roughly 300,000 and operates with a total daily processing capacity of 70,000 m3. The process flows for these plants are shown in Figures 2–5.
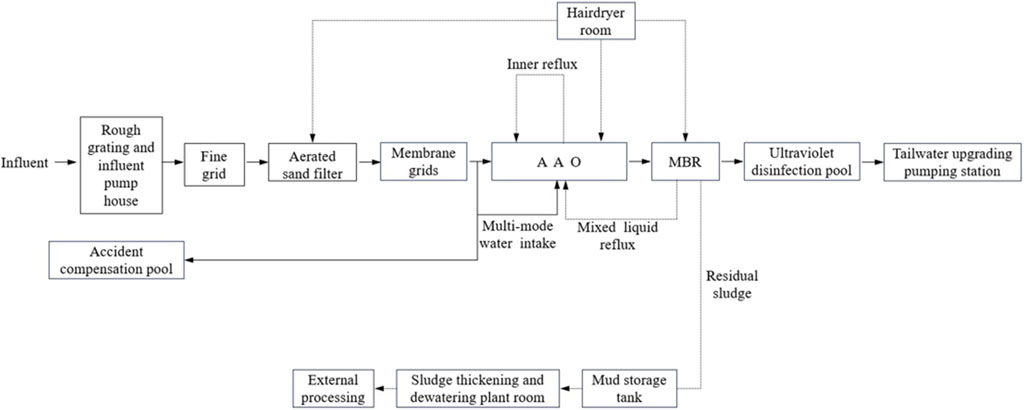
Figure 2. Process Flow for WWTP A.
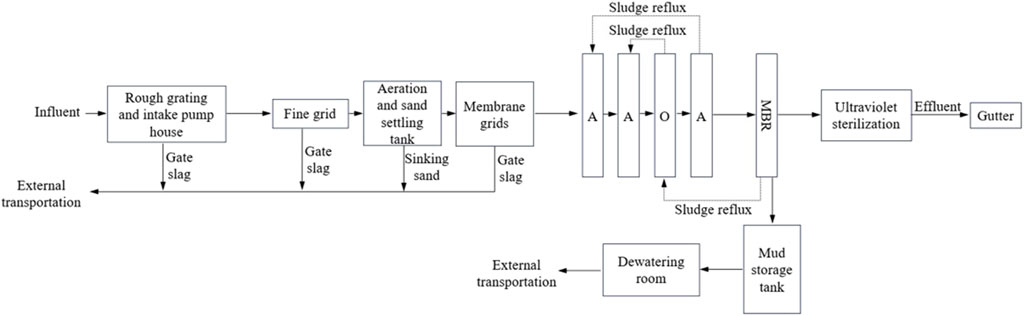
Figure 3. Process Flow for WWTP B.
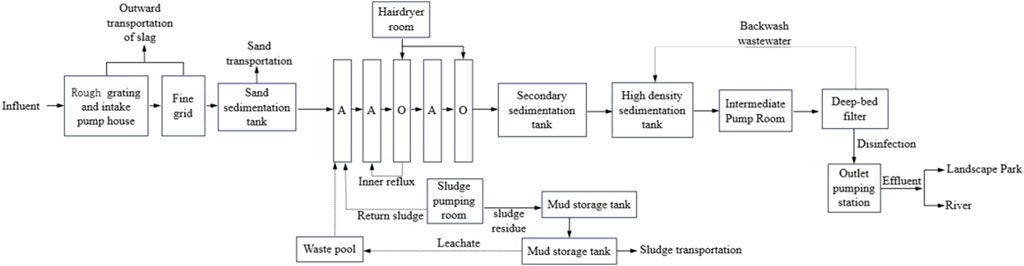
Figure 4. Process Flow for WWTP C.
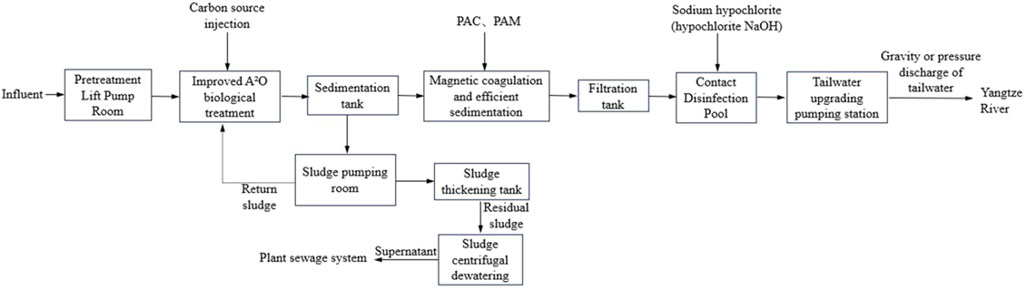
Figure 5. Process Flow for WWTP D.
In accordance with the emission standards of pollutants for municipal wastewater treatment plants in China (GB 18918-2002), all four WWTPs fall under the category of medium-sized treatment plants. Furthermore, the effluent quality from each WWTP complies with the standard Class A, Level 1, as shown in Figure 6.
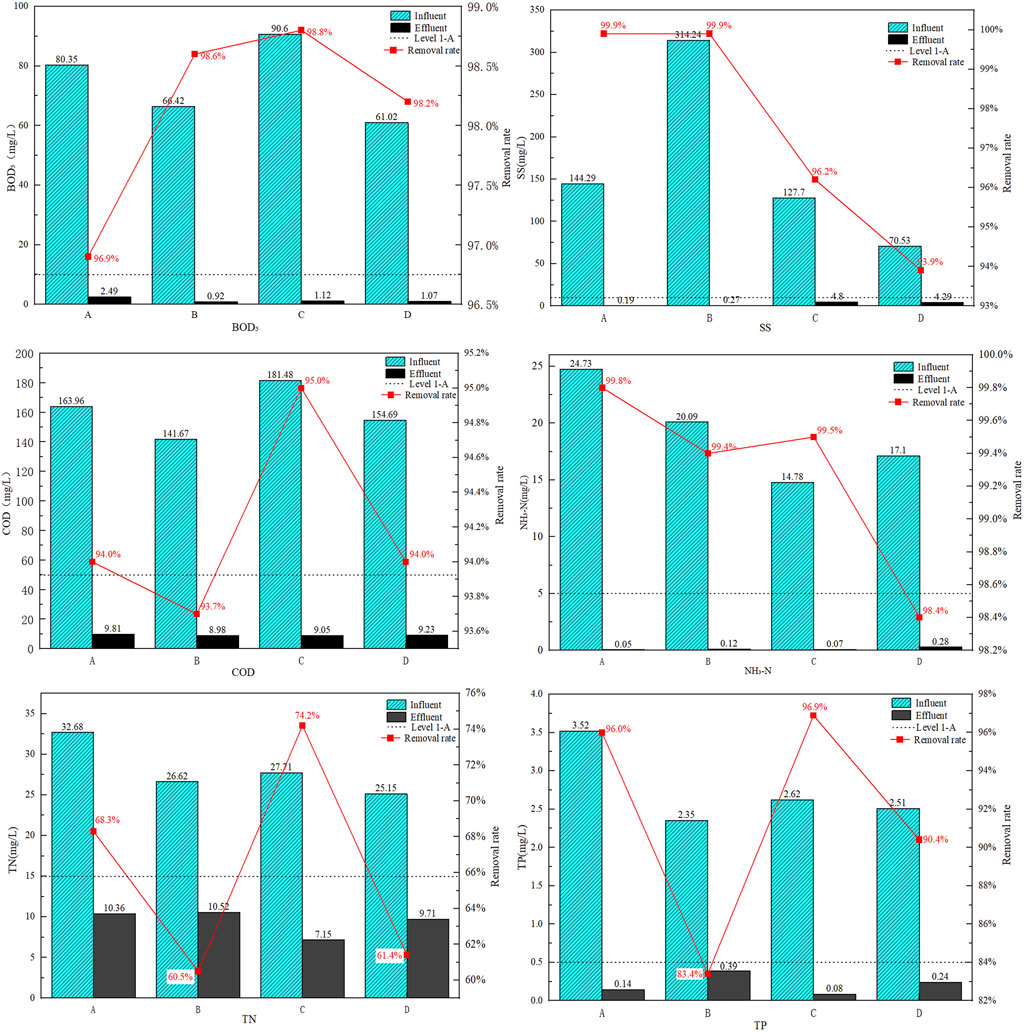
Figure 6. Concentration of wastewater and pollutant removal rates for WWTPs.
Table 1 presents the effluent wastewater quality and pollutant removal rates for the four selected WWTPs. Minimal variation in wastewater quality exists among the plants. The average effluent concentrations for biological oxygen demand over 5 days (BOD5), suspended solids (SS), chemical oxygen demand (COD), ammonia nitrogen (NH3-N), total nitrogen (TN), and total phosphorus (TP) at all four plants are 1.4, 2.39, 9.27, 0.13, 9.44, and 0.21 mg/L, respectively. The average removal rates for these pollutants are 98.1%, 97.5%, 94.2%, 99.3%, 66.1%, and 91.7%, respectively. With the exception of TN, the removal rates for all other pollutants exceed 90%. Although TN exhibits a lower average removal rate, the effluent concentrations meet the standard Class A, Level 1 in China.
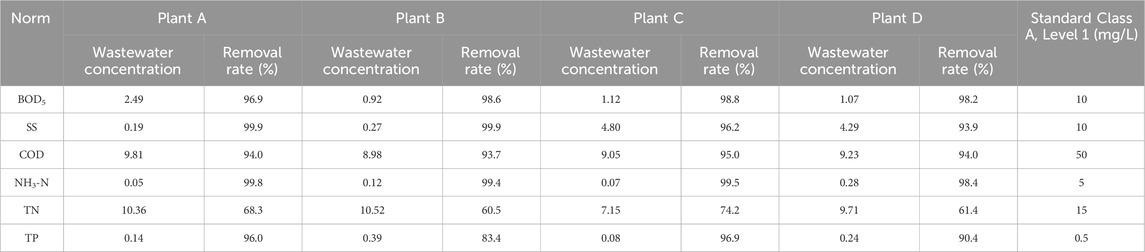
Table 1. Effluent wastewater quality and pollutant removal rates for waste water treatment plants (WWTPs).
In terms of the overall pollutant removal rates, nationwide urban WWTPs in China achieve BOD5, SS, COD, NH3-N, TN, and TP removal rates of 94.2%, 95.1%, 90.6%, 97.3%, 70.7%, and 92.3%, respectively (Hu, 2021). Comparatively, the selected WWTPs demonstrate higher BOD5, SS, and COD removal rates than the national average. However, the TN removal rates for Plants A, B, and D are 2.4%, 10.2%, and 9% lower than the national average, respectively. Similarly, the TP removal rates for Plants B and D are 8.9% and 1.9% lower than the national average, respectively. Despite these slightly lower TN and TP removal rates, the overall removal efficiency for other pollutants remains quite good.
The design influent concentrations of BOD5, SS, COD, NH3-N, TN, and TP for each WWTP were initially set at 140, 200, 300, 30, 40, and 4 mg/L, respectively, according to the design standards. However, the actual influent concentrations of BOD5, SS, COD, NH3-N, TN, and TP for each plant were approximately 53.29%, 82.1%, 53.48%, 63.93%, 70.1%, and 68.75% of these design values, respectively. These findings, as illustrated in Figure 6, indicate consistently low influent concentrations at the four urban WWTPs.
The influent BOD5/COD ratio is a widely used biochemical index in wastewater treatment, serving as an indicator of wastewater’s biochemical properties and reflecting the degree of microbial degradation of organic matter and nutrients, thereby influencing pollutant removal effectiveness (Al-Sulaiman et al., 2018). In most cases, an influent BOD5/COD ratio between 0.4 and 0.6 is considered favorable for biochemical processes (Xu et al., 2022). The statistical analysis of influent BOD5/COD ratios across various provinces reveals that the majority fall within this range. For instance, Qinghai, Chongqing, and Tibet exhibit the highest influent BOD5/COD values, reaching 0.52, 0.51, and 0.51, respectively. Conversely, Zhejiang, Fujian, and Hunan display the lowest influent BOD5/COD ratios, with values of 0.38, 0.38, and 0.40, respectively. Among the four WWTPs (Plants A, B, C, and D), all exhibit influent BOD5/COD ratios higher than 0.4. Specifically, these ratios are 0.49, 0.47, 0.50, and 0.40, respectively, as depicted in Figure 7. This indicates favorable biochemical conditions in all four WWTPs.
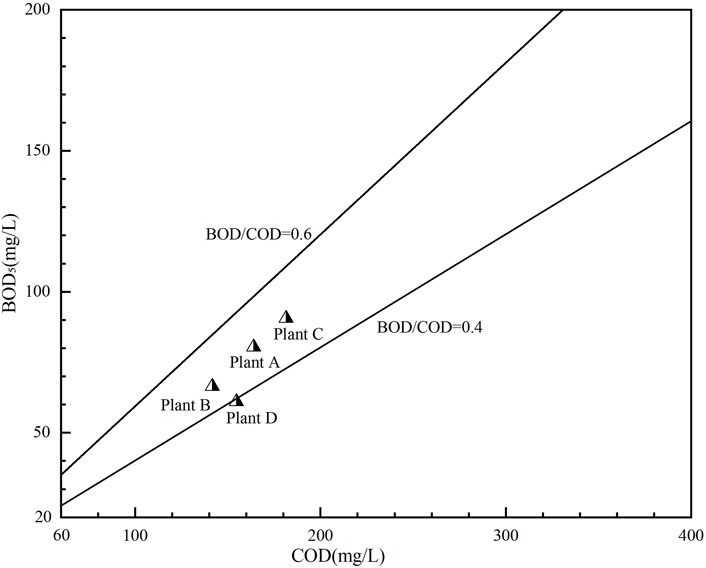
Figure 7. Characteristic of BOD5/COD in imported wastewater for WWTPs.
The influent COD/TN ratio primarily reflects the relative content of carbon and nitrogen sources in wastewater, providing insights into the nutrient balance for heterotrophic bacteria (Pan et al., 2020). A low COD/TN ratio suggests an excess of the nitrogen source component and an insufficient carbon source, hindering the growth of heterotrophic bacteria and reducing treatment efficacy. Conversely, a high COD/TN ratio indicates an excess of carbon source and insufficient nitrogen source, resulting in excessive sludge formation and biochemical challenges (Sun et al., 2016). Research indicates that the optimal COD/TN ratio falls within the range of 8–12 (Fernández-Arévalo et al., 2017). When the COD/TN ratio is close to 11, TN removal rates can reach 93.48% and TP removal rates approach 100% (Zhang et al., 2016). Among the four WWTPs, Plant C demonstrates the highest COD/TN ratio at 6.55, although it still falls below the optimal ratio, as depicted in Figure 8. A nationwide assessment of urban WWTPs in China reveals COD/TN ratios ranging from 4.8 to 8.7 (Hu, 2021), consistently below the optimal range. This prevalent issue results in insufficient carbon sources during denitrification processes, reducing the effectiveness of nitrogen and phosphorus removal (Figures 7, 8).
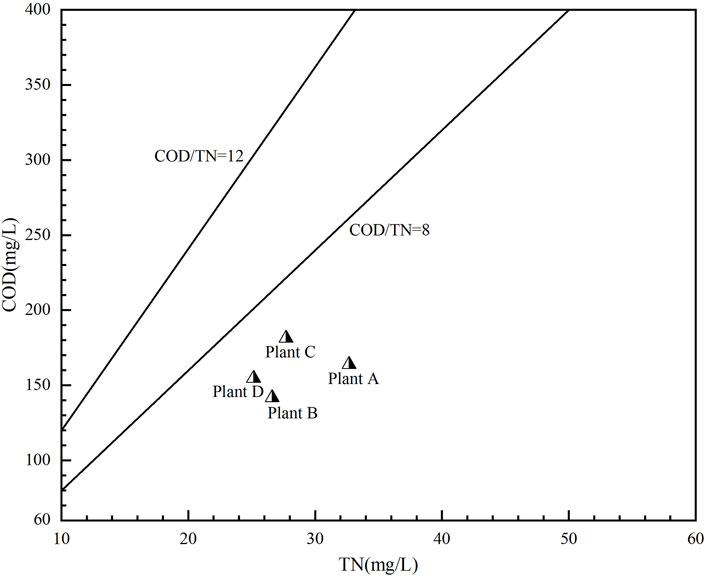
Figure 8. Characteristic of COD/TN in imported wastewater for WWTPs.
The loading rates of urban WWTPs in key cities across the country have reached an average of 102.8%, with Hohhot notably reaching as high as 152% (Xu et al., 2022). However, the wastewater hydraulic loads of Plants A, B, and C are comparatively low. Notably, Plant A has a loading rate of only 29.8%, creating a scenario analogous to a substantial vehicle with minimal cargo capacity, as depicted in Table 2. Furthermore, when considering the “China Urban Construction Statistical Yearbook” and Chinese national statistics, it becomes evident that the annual average unit wastewater consumption of electricity for 5,389 WWTPs nationwide is 0.48 kWh/m3. Approximately 80% of these WWTPs have a unit wastewater consumption of electricity lower than 0.61 kWh/m3, and 50% achieve values below 0.36 kWh/m3 (Hu et al., 2021). However, among the four WWTPs examined, only Plant D exhibits unit wastewater consumption of electricity lower than 0.36 kWh/m3. The remaining three plants have higher levels of electricity consumption, surpassing more than 80% of the WWTPs included in the statistics.
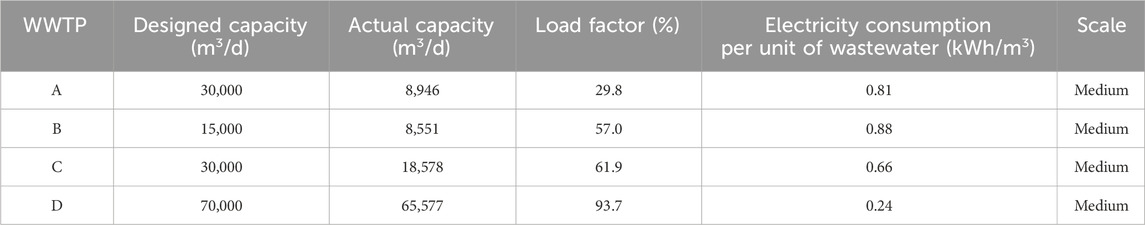
Table 2. Energy consumption and treatment capacity of each waste water treatment plant (WWTP).
On an international scale, WWTPs in China contribute significantly to urban energy consumption. For instance, in Germany, WWTPs account for approximately 20% of the total urban energy consumption, with electricity consumption being a dominant factor (Racoviceanu et al., 2007; Wang et al., 2016). In the United States, the electricity consumption of wastewater treatment accounts for 0.6% of the nation’s annual electricity consumption (Gu et al., 2017), with an average electricity consumption for wastewater treatment units of approximately 0.52 kWh/m3 (Yeshi et al., 2013). Notably, countries like the Netherlands, the United States, and Australia maintain lower levels of electricity consumption in the range of 0.36–0.45 kWh/m3. By contrast, countries such as the United Kingdom, Switzerland, Spain, Germany, and Singapore have higher levels ranging from 0.52 to 0.67 kWh/m3 (Hernández-Sancho et al., 2011). It is important to highlight that the electricity consumption of WWTPs in these countries is generally lower than that of Plants A, B, and C.
In terms of chemical consumption, Table 3 presents the average daily tap water consumption ranging from 22.21 to 123.50 m3, with unit wastewater consumption ranging from 1,910.57 to 2,901.64 g/m3. The order of unit wastewater consumption from the highest to lowest is as follows: Plant B > Plant C > Plant A > Plant D. Similarly, the average daily dosage of chemicals, such as CH3COONa, PAC, PAM, and NaClO, is provided. Regarding CH3COONa consumption, to compare it uniformly in terms of COD equivalent, the median value of CH3COONa dosing for WWTPs nationwide in China is 16.9 gCOD/m3, with approximately 95% of WWTPs consuming less than 115 gCOD/m3 of carbon sources per unit of wastewater and 50% consuming less than 18.9 gCOD/m3 (Hu et al., 2021). Given the conversion rate of 1 g CH3COONa to COD equivalent (approximately 0.78 g COD/g CH3COONa), the unit wastewater dosages for Plants A, B, C, and D are 261.38, 115.91, 46.74, and 29.20 gCOD/m3, respectively. These values exceed half of the carbon source consumption values of WWTPs nationwide. Additionally, the nationwide median value for PAC dosing is 6.7 g/m3, with unit wastewater consumption primarily falling within the range of 1–22 g/m3 (which accounts for approximately 90% of the total). Although Plant B has the lowest consumption among Plants A, B, C, and D (30.32 g/m3), it still exceeds 90% of the national consumption in WWTPs.
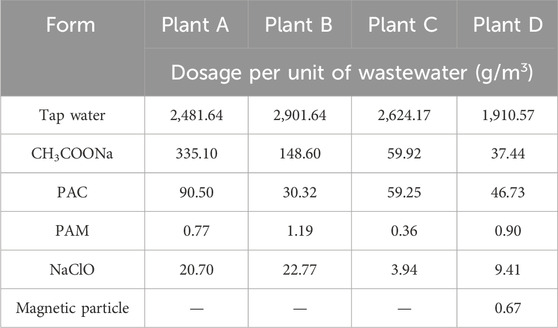
Table 3. Consumption of chemicals by waste water treatment plants (WWTPs).
The carbon emissions from WWTPs can be divided into two main components. The first component refers to direct emissions during the biochemical treatment process, which primarily include the release of greenhouse gases such as CH4 generated during the removal of COD, methane produced during sludge treatment, and N2O resulting from the removal of TN (Lv et al., 2022).
The second component involves indirect emissions generated during plant operations, mainly originating from the energy consumption of the wastewater treatment process. This encompasses carbon dioxide emissions implicitly associated with purchased electricity, carbon dioxide emissions resulting from the addition of chemicals during wastewater treatment, and carbon dioxide emissions produced during equipment operation and sludge treatment through the combustion of fossil fuels (Demir et al., 2019).
In this study, we calculated the carbon emissions for each WWTP by considering three greenhouse gases: CO2, CH4, and N2O. To assess their contribution to global warming, we utilized the global warming potential (GWP) values provided by the Intergovernmental Panel on Climate Change (IPCC). The GWP represents a basis for comparing the global warming impact of different gases, with CO2 assigned a GWP of 1. The GWP values for other greenhouse gases are quantified in relation to CO2 (Table 4), enabling us to calculate the equivalent emissions of these gases by multiplying their actual emissions by their respective GWP values (Koutsou et al., 2018).
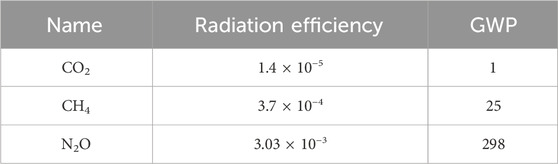
Table 4. IPCC global warming trend values.
where E1 is the removal of TN produced by N2O converted to carbon dioxide equivalent annual emissions, tCO2eq/a; Q is the annual treatment volume of wastewater, m3/a; TNi is the average annual influent concentration of TN, gCO2e/m3; TNe is the average annual effluent concentration of TN, gCO2e/m3; EFN2O is the amount of nitrogen in the wastewater per unit mass of ammonia that can be converted to nitrous oxide, tN2O -N/tN; CN2O/N2 is the ratio of the molecular weight of N2O/N2, 44/28; and GWPN2O is the global warming potential value of N2O, which takes the value of 298.
where E2 denotes the removal of COD in wastewater produced by CH4 converted to carbon dioxide equivalent emissions per year, tCO2eq/a; Q denotes the annual treatment of wastewater, m3/a; CODi denotes the COD of the average annual concentration of influents, gCO2e/m3; CODe denotes the COD of the average annual concentration of effluents, gCO2e/m3; SG denotes the annual generation of urban WWTP sludge dry matter, t/a; ρs is the content of organic matter in the sludge dry matter, tCOD/t; WCH4 is the annual recovery of CH4, tCH4/a; the WWTPs are zero; EFCH4 is the CH4 emission factor, tCH4/tCOD; GWPCH4 is the CH4 GWP value and takes the value of 25; Qa is the daily treatment of urban wastewater, m3/d; EFs is the daily processing EFs for the daily treatment of wastewater produced by the sludge dry mass, t/(10,000 m3d); D denotes the annual operation of the WWTP days, d/a; EFCH4 denotes the CH4 emission factor, tCH4/tCOD; MCF denotes the CH4 correction factor and takes the value of 0.15; and B denotes the maximum CH4 generation potential and takes the value of 0.25 tCH4/tCOD.
where E3 is the annual emission of CH4 converted to the carbon dioxide equivalent from sludge removal in the municipal WWTP, tCO2eq/a; SR is the annual amount of dry sludge in the WWTP, t/a; SG is the amount of dry sludge generated in the municipal WWTP, t/a; SE is the mass of dry sludge transported outside the boundary of the municipal WWTP, t/a; semi-finish is the organic matter content in the dry sludge of the municipal WWTP sludge dry matter content of organic matter, tC/t; DOCf is the ratio of degradable organic carbon in sludge dry matter and takes the value of 50%; MCF is the CH4 correction factor and takes the value of 1 for completely anaerobic and the value of 0 for completely aerobic; F is the ratio of CH4-producing carbon in the degradable organic carbon and takes the value of 50%; CCH4/C is the ratio of the molecular weight of CH4/C and takes the value of 16/12; and the parameter βS is assigned a value of 0.1 tC/t.
where E4 is the CO2 emission equivalent generated by the annual consumption of electricity for the operation of wastewater treatment equipment, tCO2eq/a; EH is the annual electricity consumption for the operation of wastewater treatment equipment, MWh/a; EFCO2 is the CO2 emission factor for electricity, tCO2/MWh, and according to the results of the baseline emission factor of the Chinese regional power grid of the emission reduction program in the year 2019, Jiujiang city’s emission factor is taken as 0.8587; and GWPCO2 is the CO2 global warming potential value and takes the value of 1.
where E5 is the CO2 emission equivalent produced by the chemicals added in the wastewater treatment process of the urban WWTP, tCO2eq/a; Yi is the consumption of the j-th type of chemicals added in the domestic wastewater treatment process, kg; and EFCO2,i is the CO2 emission factor consumed by the j-th type of chemicals used in the wastewater treatment, kgCO2/kg of chemicals, as shown in Table 5.
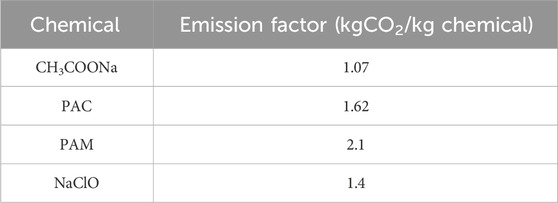
Table 5. Chemical emission factors.
To enhance the efficiency of WWTPs and reduce carbon emissions, this study proposes three distinct scenarios for research. Each scenario focuses on removal rates, carbon emission reduction, and cost optimization. Subsequently, we calculate the carbon emission generated under each scenario and analyze the effects of emission reduction. The objective is to derive the lowest operating cost while maintaining low carbon emission and meeting WWTP emission standards.
Since the influent flow rate at each WWTP is less than the designed capacity, all equipment within the plants operate at normal power, resulting in the phenomenon of “using a sledgehammer to crack a nut.” This leads to higher energy consumption per unit of wastewater. In Scenario 1, with the assumption that the influent flow rate reaches the designed wastewater flow, the energy consumption per unit of water is recalculated by each WWTP, and the cost of energy consumption per unit of wastewater is calculated based on the local electricity tariff, as shown in formulas (9) and (10). The unit chemical consumption per unit wastewater remains constant, and the cost of chemical consumption per unit wastewater is calculated based on the local chemical price, as shown in formula (11). Combining the costs of energy consumption and chemical consumption per unit wastewater results in the operational cost, as indicated in formula (12). In this scenario, energy consumption can be significantly reduced, leading to a reduction in indirect carbon emission, which positively contributes to carbon reduction.
In the equations, P1 represents the energy consumption per unit of wastewater when the influent flow rate reaches the designed wastewater flow, with the units kWh/m3; α represents the electricity tariff; W1 denotes the cost of energy consumption per unit of wastewater; γ1 to γ7, respectively, represent the consumption of PAM, water, NaClO, coal, PAC, CH3COONa, and electricity per unit of wastewater, while β1 to β7 correspond to the unit prices of these chemicals; W2 represents the cost of chemical consumption per unit of wastewater; and operating cost OC1 indicates the operational cost per unit of wastewater in Scenario 1. The units for all these costs are RMB/m3.
To break free from the current situation of high standards, high costs, and high emissions, a path for wastewater discharge that is both in line with urban WWTP pollutant discharge standards and economically low carbon is explored. We comprehensively analyze the monthly average effluent concentration, unit wastewater operation cost, and pollutant removal rate for each WWTP in 2022. By means of monthly average OC2, we select the month with the lowest OC2 and analyze whether its pollutant removal rate meets the standard. If it does not meet the standard, we select the OC for the second-lowest month, and so on, until we obtain the minimum OC2 that complies with the emission standard. We then use this month as a benchmark, with equipment operation modes and the dosage of chemicals of the other months consistent with those of this month, reducing the OC2. In this scenario, it significantly reduces the OC2, implying reduced energy consumption and chemical consumption, and a substantial reduction in indirect carbon emissions, thereby achieving energy savings and emission reduction. This approach allowed us to explore a viable path for wastewater treatment that balances the requirement for pollutant removal, economic efficiency, and low carbon emission.
By combining Scenarios 1 and 2, under the premise of the wastewater volume reaching the designed value, the unit wastewater electricity consumption obtained from Scenario 1 and the chemical consumption obtained from the month with the lowest operating cost in Scenario 2 are selected by each WWTP. By combining these two factors, energy consumption and chemical usage are minimized, resulting in the optimal OC3. In this scenario, reducing indirect emissions to the lowest extent and maximizing carbon emission reduction.
The calculation of carbon emissions for the four WWTPs in 2022 involves the utilization of Eqs 1–8. When analyzing the annual carbon emissions, it becomes evident that the volume of wastewater treatment plays a dominant role in determining the total carbon emissions, surpassing any impact arising from changes in the concentration of incoming and outgoing wastewater quality. Consequently, the total carbon emissions are ranked as follows: Plant D > Plant C > Plant A > Plant B.
When considering carbon emissions per unit of wastewater, the results indicate the following order: Plant A > Plant B > Plant C > Plant D, as detailed in Table 6. Notably, indirect emissions constitute the majority of the carbon emissions for each plant. Among these, Plant A stands out with indirect emissions accounting for a substantial 86.13% of the total emissions, while direct emissions make up only 13.87% of the total.
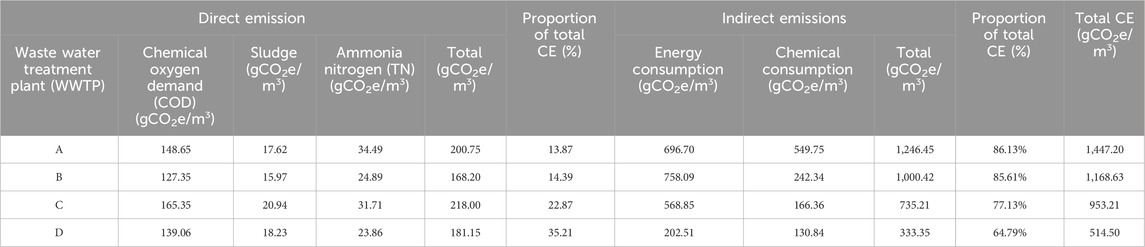
Table 6. Summary of carbon emissions (CEs) per unit of wastewater.
The carbon emissions per unit of wastewater at a WWTP in Zhengzhou city were calculated to be 1,060 gCO2e/m3 (Yu et al., 2020), indicating similarities with those of Plant B in Zhengzhou city. The WWTP processes in Zhengzhou city resemble those of Plant B, although they handle more wastewater and achieve higher pollutant removal rates per unit of wastewater. However, the energy consumption and chemical consumption per unit of wastewater are lower than those of Plant B. The difference in carbon emissions can be attributed to the higher influent concentration in Zhengzhou city’s WWTP, resulting in greater direct carbon emissions per unit of wastewater.
By contrast, the carbon emissions per unit of wastewater at a WWTP in Canada were calculated to be 390 gCO2e/m3 (Shahabadi et al., 2010), which is lower than the values observed in this study. This discrepancy arises because the study only accounted for the direct emissions from the biochemical treatment portion of the WWTP, neglecting the indirect emissions encompassing energy and chemical consumption.
Another noteworthy case is a WWTP in Shenzhen, where the carbon emissions per unit of wastewater were 430 gCO2e/m3 (Song et al., 2015), which are lower than the values in this study. However, this difference can be attributed to the exclusion of carbon emissions related to sludge treatment in the study by Song et al.
The carbon emissions per unit of wastewater for 50 small-scale WWTPs in India and the United Kingdom yielded a value of 3,040 gCO2e/m3 (Singh et al., 2016), which is significantly higher than the values observed for the four large WWTPs. This discrepancy arises from the inclusion of energy consumption, encompassing both electricity and fuel consumption. Lower fuel efficiency led to higher consumption, coupled with a larger fuel carbon emission factor, resulting in elevated carbon emissions. By contrast, the analysis of the four WWTPs considered only electricity consumption.
Lastly, the carbon emissions per unit of wastewater volume for a WWTP in the northern region yielded a value of 950 gCO2e/m3 (Xie et al., 2012), which is close to that of Plant C. Although its wastewater treatment capacity and pollutant removal per unit of wastewater exceeded those of Plant C, energy consumption and chemical consumption per unit of wastewater were lower. It is important to note that in all these cases, direct carbon emissions exceeded indirect carbon emissions, indicating excessive indirect carbon emissions from WWTPs in Jiujiang city.
In terms of carbon emission composition, Plants A, B, and C exhibited the following hierarchy: energy > chemical > COD > TN > sludge. However, Plant D displayed a slightly different pattern: energy > COD > chemical > TN > sludge. Across all WWTPs, energy consumption accounted for the majority of carbon emissions, followed by chemical consumption, COD, TN, and sludge, which contributed the least to carbon emissions.
When analyzing individual plant-level carbon emissions (Figure 9), it becomes evident that carbon emissions per unit of wastewater produced are primarily influenced by energy consumption and chemical consumption, while carbon emissions from COD, sludge, and TN remain relatively consistent. Notably, there were significant variations among the plants, with Plant D recording the lowest carbon emissions and Plant A exhibiting the highest. Specifically, the carbon emissions per unit of wastewater for Plant C, Plant B, and Plant A were 2.81 times, 3.74 times, and 3.44 times that of Plant D, respectively. Furthermore, carbon emissions per unit of wastewater from chemical consumption were 1.27 times, 1.85 times, and 4.2 times greater than that of Plant D. In total, the cumulative carbon emissions per unit of wastewater for Plant C, Plant B, and Plant A were 1.85 times, 2.27 times, and 2.81 times that of Plant D (Figure 9).
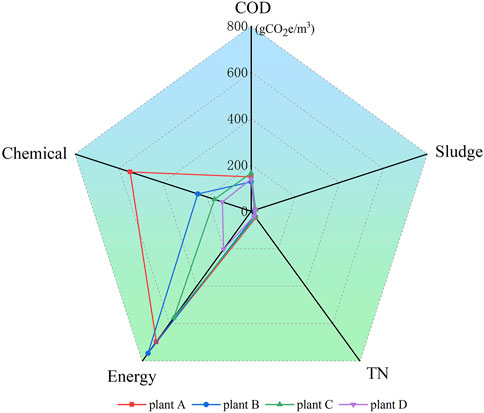
Figure 9. Carbon emissions per unit wastewater of WWTPs.
Considering the different processes employed, Plants A, B, C, and D utilize the following technologies, respectively: AAO + MBR, AAOA + MBR, AAOAO + coagulation precipitation filtration (CPF), and AAO + CPF. The carbon emissions decrease sequentially based on these technologies. A previous study on WWTPs in the Yangtze River mainstream basin, employing various technologies, reported carbon emission intensities ranging from 3,776 g/m3 to 9,559 g/m3 (Fu et al., 2022). Among these, the AAO + MBR combination process exhibited the highest carbon emission intensity due to its elevated electricity consumption, while the oxidation ditch (OD) + CPF process demonstrated the lowest carbon emission intensity.
Although Jiujiang city falls within the Yangtze River mainstream basin, Plant A’s carbon emissions significantly exceed those of WWTPs employing similar technologies. Plants B and C, which utilize currently unaccounted technology combinations, also exhibit higher carbon emissions than WWTPs using similar processes (AAOA + MBR and AAOAO + CPF). However, the carbon emissions of Plant D are comparable to those of WWTPs utilizing the same technology combination. This outcome can be attributed to the high levels of indirect carbon emissions from Plants A, B, and C, which impede the efficient operation of WWTPs. Increased energy consumption leads to lower electrical efficiency, while the low influent concentration in the WWTPs results in an insufficient carbon source, leading to higher chemical consumption. To address these issues, it is advisable to increase the influent concentration to enhance energy efficiency and reduce per-unit wastewater chemical consumption.
Three different scenarios are presented to demonstrate the efficiency improvements of WWTPs and propose a cost-effective, easily implementable low-carbon approach. In Scenario 1, the focus is on reducing carbon emissions related to energy consumption. In Scenario 2 and Scenario 3, reductions in both energy-related and chemical consumption–related carbon emissions are considered. Figure 10 illustrates the carbon emission compositions for the four WWTPs and the carbon reduction effects of the three scenarios. The carbon emission reduction results for 2022 under each scenario are as follows:
(1) Scenario 1: The energy consumption reductions for Plant A, Plant B, Plant C, and Plant D are 0.57, 0.38, 0.25, and 0.02 kWh/m3, respectively. The corresponding carbon emission reductions from energy consumption, calculated using formula (7), are 489, 325, 217, and 15 gCO2e/m3, respectively. Based on the designed wastewater inflow, the carbon emission reductions for 2022 are estimated to be 5,354.55, 1,779.38, 2,376.15, and 383.25 tCO2e/a, respectively.
(2) Scenario 2: The carbon emission reductions from energy consumption for Plants A, B, C, and D are 134.56, 219.29, 29.92, and 14.78 gCO2e/m3, respectively. The carbon emission reductions from chemical consumption, calculated using formula (8), are 109.85, 97.04, 96.22, and 0.02 gCO2e/m3, respectively. The total carbon emission reductions are 244.41, 316.33, 126.14, and 14.8 gCO2e/m3, respectively. Considering the actual wastewater inflow, the carbon emission reductions for 2022 are projected to be 798.66, 988.41, 854.76, and 349.20 tCO2e/a, respectively.
(3) Scenario 3: The energy consumption carbon emission reductions for Plants A, B, C, and D are the same as in Scenario 1. The carbon emission reductions from chemical consumption remain the same as in Scenario 2. The total carbon emission reductions are 598.85, 422.04, 313.22, and 15.02 gCO2e/m3, respectively. Based on the designed wastewater inflow, the carbon emission reductions for 2022 are projected to be 6,557.41, 2,310.67, 3,429.76, and 383.76 tCO2e/a, respectively (Figure 10).
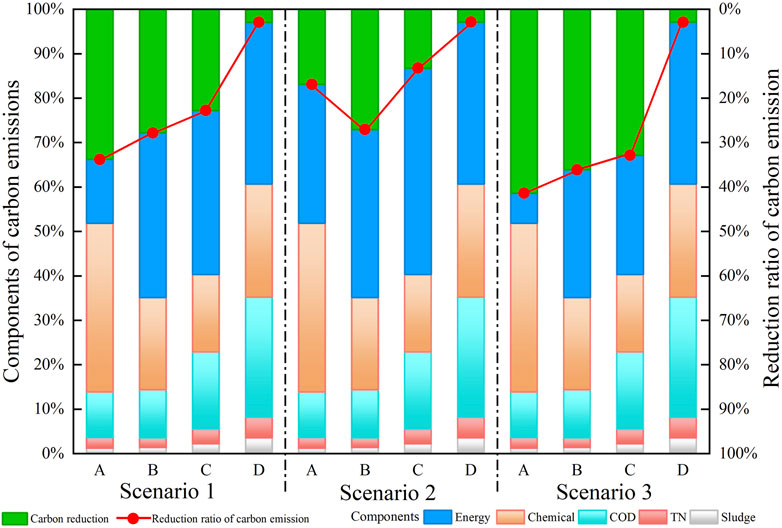
Figure 10. Carbon emission composition of the three scenarios for WWTPs.
In addition to the methods employed in this study, various measures can be implemented to achieve a reduction in carbon emissions. These include exhaust gas collection, photovoltaic power generation, carbon sequestration by green plants, and wastewater reuse. For example, the implementation of an automatic control system for dissolved oxygen can lead to energy savings ranging from 10% to 25% (Nana, 2013). A study on 31 WWTPs in China demonstrated that photovoltaic projects at WWTPs can reduce carbon emissions by 10%–40% (Chen, 2022). The Jinamar WWTP in the Canary Islands of Spain incorporated energy recovery, photovoltaic, wind energy, and hydropower generation, resulting in zero energy consumption and zero carbon emissions annually (Del et al., 2020). These examples highlight the possibility of achieving zero carbon emissions.
The operating costs discussed in this article for WWTPs include expenses related to energy consumption and chemical usage, such as electricity, tap water, CH3COONa, PAC, PAM, coal, and NaClO. Labor costs and other miscellaneous expenses were not considered in the analysis at this stage. The data on energy and chemical consumption for the year 2022 from four prominent WWTPs were collected, and the unit electricity rates and chemical prices were determined based on the prevailing local market conditions. For consistency, we used a water equivalent where 1 ton is considered equivalent to 1 m3. Through detailed calculations, the monthly operating costs for each plant were derived, as shown in Figure 11.
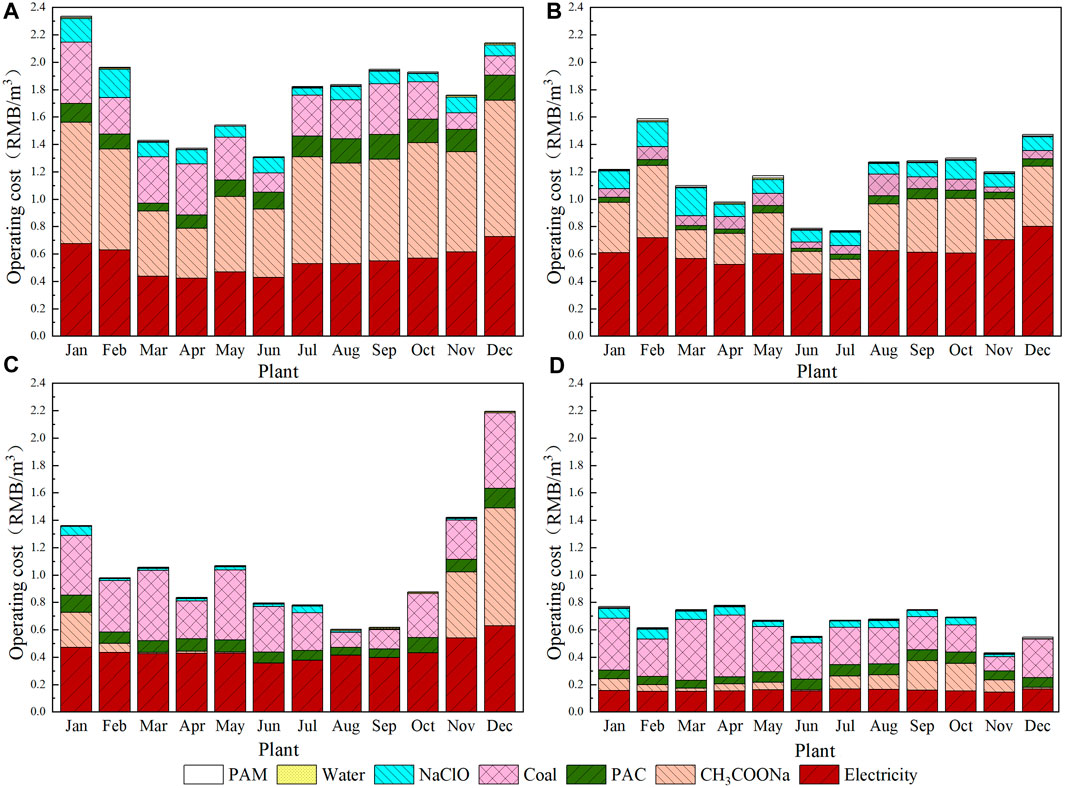
Figure 11. Operating costs per unit of wastewater for WWTPs.
The operating costs for WWTPs A, B, C, and D ranged from 1.31 to 2.33, 0.77 to 1.59, 0.6 to 2.19, and 0.43 to 0.78 RMB/m3, respectively. The mean values for these WWTPs were 1.78, 1.18, 1.05, and 0.66 RMB/m3, respectively. In a case study of an urban WWTP in Nanchang, the operating cost before an upgrade was 0.75 RMB/m3, which decreased to 0.6 RMB/m3 after the upgrade (Zhao et al., 2023), similar to the operating cost of Plant D. According to research, the operating cost of a semi-underground WWTP in China is 0.7 RMB/m3 (Kong et al., 2021). Xie et al. (2017) conducted a study on a domestic WWTP in a town in Beihai, determining the operating cost to be 0.62 RMB/m3. Tan et al. (2015) calculated the average operating cost for 227 WWTPs across China’s eastern, central, and western regions to be approximately 0.8 RMB/m3. The operating costs for urban WWTPs mentioned in these studies typically range from 0.6 to 0.9 RMB/m3, which include labor expenses. Notably, the four major WWTPs, excluding labor costs, exhibited operating costs exceeding 0.9 RMB/m3. Therefore, Plants A, B, and C have relatively high operating costs.
The composition of operating costs reveals that a significant portion of the expenses are attributed to electricity, CH3COONa, PAC, coal, and NaClO, while the costs associated with tap water and PAM relatively constitute a smaller share. The study shows that electricity consumption in China amounts to approximately 0.24 RMB/m3 (Miyoshi et al., 2018). However, the cost of electricity consumption per unit of wastewater, calculated based on the national average unit wastewater consumption, amounts to approximately 0.32 RMB/m3. The electricity consumption costs for Plants A, B, and C exceed the aforementioned values, standing at 0.55, 0.6, and 0.44 RMB/m3, respectively. Notably, Plant D has the lowest electricity consumption cost, which is 0.16 RMB/m3. The variation in electricity consumption and chemical usage primarily arises from the differences between Plant D and Plants A, B, and C. While Plant D exhibits lower power and chemical consumption, Plants A, B, and C demonstrate higher consumption of electricity and CH3COONa, which contributes to an overall increase in unit wastewater costs. The underlying reason for this issue is that the volume and concentration of influent wastewater do not meet the designed requirements, resulting in a situation similar to that of an overloaded system. Consequently, the unit wastewater power consumption remains elevated. Additionally, in the biochemical reaction process, there is an insufficient supply of carbon sources, necessitating the addition of a substantial quantity of carbon sources.
Scenario 1: The calculated results demonstrate that the operating costs (OC1) per unit of wastewater volume for Plant A, Plant B, Plant C, and Plant D, based on their designed wastewater treatment capacity, are 1.39, 0.91, 0.88, and 0.64 RMB/m3, respectively. Among these costs, electricity consumption accounts for 0.16, 0.34, 0.27, and 0.14 RMB/m3, respectively. The year-on-year cost reductions are 0.39, 0.26, 0.17, and 0.02 RMB/m3, respectively. As illustrated in Figure 12, the reduction percentages in unit wastewater operating costs (OC1) are 22%, 23%, 16%, and 3%, respectively. In this scenario, when the wastewater inflow reaches the designed capacity, annual cost savings for each plant can amount to 4.23 million, 1.45 million, 1.83 million, and 0.38 million RMB, respectively (Figure 12).
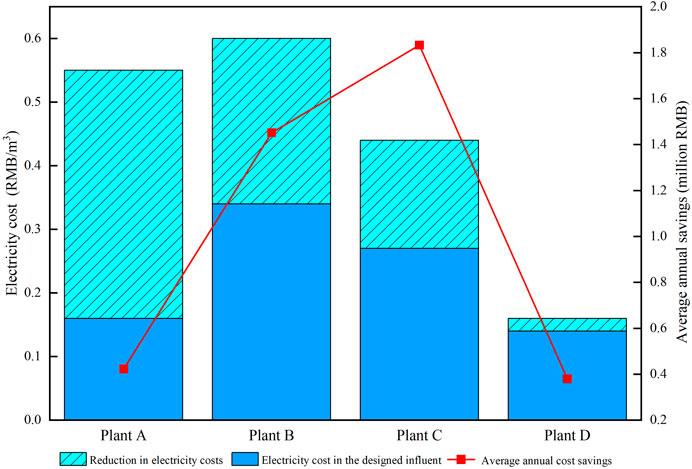
Figure 12. Electricity consumption per unit of wastewater for WWTPs.
Scenario 2: The months with the lowest operational costs for Plants A, B, C, and D are June, September, August, and November, respectively. During these months, the pollutant removal efficiencies met the Class A, Level 1, emission standards of pollutants for municipal wastewater treatment plants in China (GB 18918-2002) at the specified rates. For example, in Plant A, the BOD5, SS, COD, NH3-N, TN, and TP removal efficiencies in June were 1.13 times, 1.08 times, 1.37 times, 1.31 times, 1.34 times, and 1.14 times that of the Class A, Level 1 standard, respectively. Similar trends were observed in the other plants during their respective optimal operating months. As shown in Figure 13, the months with the lowest operational costs resulted in favorable pollutant removal efficiencies and cost-effectiveness for all plants. The outlet wastewater concentrations and removal rates for each plant generally fall within the upper–middle range. Additionally, there was minimal fluctuation in influent concentrations each month, and the influent concentrations of pollutants in the month with the lowest operating cost (OC2) typically fall near the median concentrations of each pollutant across various months. The composition of OC2 per unit of wastewater volume and the improvement in cost-effectiveness for 2022 are shown in Figures 13, 14.
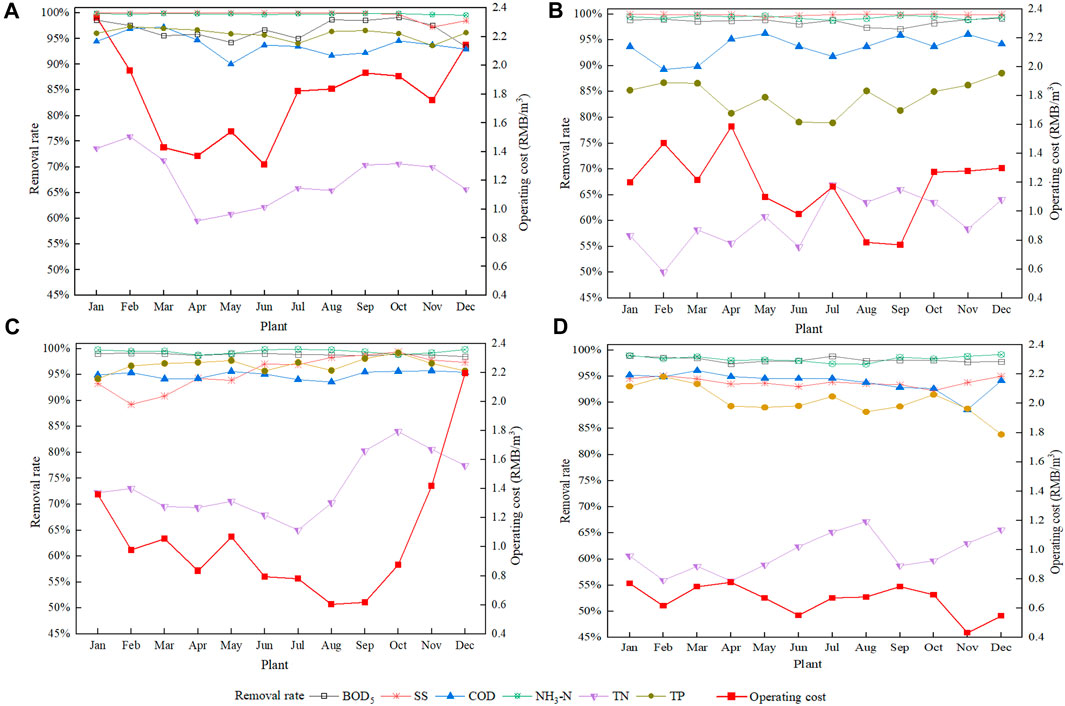
Figure 13. Removal rates and operating costs of WWTPs.
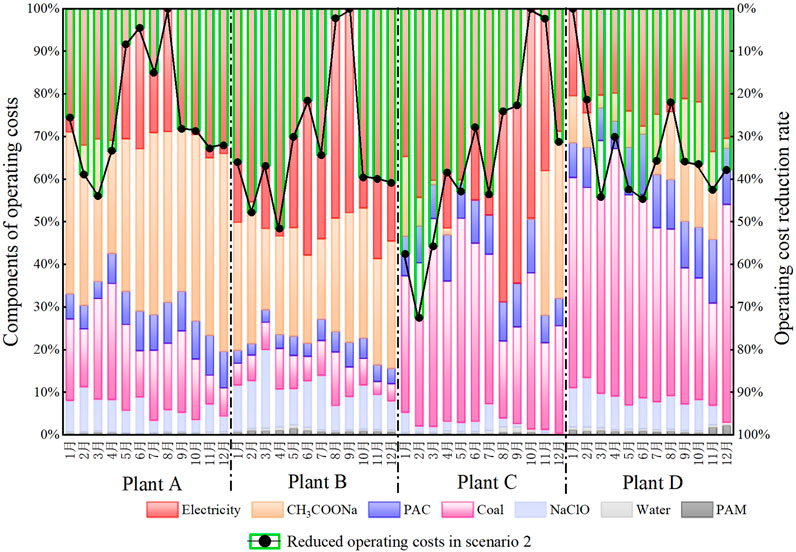
Figure 14. Composition of operating costs per unit of wastewater and benefit improvement for WWTPs in Jiujiang City in 2022.
In Plant A, if operating conditions similar to those in June are maintained, such as electricity consumption, wastewater inflow, and chemical dosage, the minimum OC2 is calculated as 1.31 RMB/m3. The actual monthly average OC2 is reduced by 0.47 RMB/m3 when compared with the same period of the past year, indicating a reduction ratio of 26%. With the same wastewater inflow, Plant A is expected to save 1.26 million RMB in the next year. Plant B, operating under September conditions, achieves a minimum OC2 of 0.77 RMB/m3. The actual monthly average OC2 is reduced by 0.41 RMB/m3 when compared with the same period of the past year, representing a reduction ratio of 35%. With the same wastewater inflow, Plant B anticipates saving 1.28 million RMB in the next year. Operating under August conditions, Plant C achieves a minimum OC2 of 0.60 RMB/m3. The actual monthly average OC2 is reduced by 0.45 RMB/m3 when compared with the same period of the past year, reflecting a reduction ratio of 43%. With the same wastewater inflow, Plant C is projected to save 3.05 million RMB in the next year. Finally, operating under November conditions, Plant D attains a minimum OC2 calculated at 0.43 RMB/m3. The actual monthly average OC2 is reduced by 0.23 RMB/m3 year-on-year, representing a reduction ratio of 35%. With the same wastewater inflow, Plant D is expected to save 5.43 million RMB in the following year (Figure 14).
Scenario 3: For Plant A, the optimal OC3 is 1.04 RMB/m3, and the actual monthly average OC3 is reduced by 0.74 RMB/m3 year-on-year, resulting in a reduction ratio of 42%. The designed wastewater inflow will lead to a savings of 8.13 million RMB in the next year. Plant B's optimal OC3 is 0.72 RMB/m3, and the actual monthly average OC3 is 0.45 RMB/m3 lower than that during the same period of the past year, representing a reduction ratio of 38%. The designed wastewater inflow will result in savings of 2.82 million RMB in the next year. Plant C’s optimal OC3 is 0.45 RMB/m3, and the actual monthly average OC3 is reduced by 0.60 RMB/m3 when compared with the same period of the past year, marking a reduction ratio of 57%. With the designed wastewater inflow, Plant C is projected to save 6.48 million RMB in the next year. Finally, for Plant D, the optimal OC3 is 0.43 RMB/m3, and the actual monthly average OC3 is reduced by 0.43 RMB/m3 when compared with the same period of the past year, representing a reduction ratio of 35%. The designed wastewater inflow will result in a savings of 5.91 million RMB in the following year.
If further reduction in operating costs is desired, a series of improvement measures can be adopted. For instance, Gaona et al. (2023) achieved a reduction in operating costs of 41%–47% through the nitrite pathway, although this led to increased N2O emissions.
(1) Through an analysis of four typical urban WWTPs in Jiujiang city, China, it was found that the four WWTPs have common features, such as low influent concentrations and effluent water quality meeting discharge standards, with pollutant removal rates higher than the national average for all pollutants except TN. Furthermore, the BOD5/COD values for influents ranged between 0.4 and 0.6, whereas the COD/TN values were less than 8, indicating that although the wastewater is good to biodegrade, it has insufficient carbon sources in the treatment processes. In terms of energy consumption, Plant D exhibited electricity consumption lower than 0.36 kWh/m3, which is below 50% that of WWTPs in China, whereas the other three WWTPs had electricity consumption exceeding 0.61 kWh/m3, surpassing 80% that of WWTPs. For chemical consumption, the four WWTPs showed a higher usage of CH3COONa and PAC than the national average, with Plant A significantly exceeding 90% of WWTPs.
(2) Concerning the carbon emissions per unit wastewater treatment, it was observed that Plant A > Plant B > Plant C > Plant D have values of 1,447.20, 1,168.63, 953.21, and 514.50 g CO2e/m3, respectively. Plants A, B, and C have higher carbon emissions mainly due to the excessively high indirect emissions resulting from energy and chemical consumption. The proportions of indirect emissions for Plants A, B, C, and D were 86.13%, 85.61%, 77.13%, and 64.79%, respectively. In addition, the operational costs for Plants A, B, C, and D were 1.78, 1.18, 1.05, and 0.66 RMB/m3, respectively, excluding labor costs. Regarding the composition of operational costs, electricity and CH3COONa costs contributed to a significant portion.
(3) The improvement efficiency for the four WWTPs was researched under three scenarios accordingly. In Scenario 1, the operational costs for Plants A, B, C, and D could be reduced from 3.03% to 22.88%. In comparison, the operational costs were reduced to 1.31, 0.77, 0.60, and 0.43 RMB/m3, resulting in cost savings of 1.26, 1.28, 3.05, and 5.43 million RMB/year in Scenario 2 and 1.04, 0.72, 0.45, and 0.42 RMB/m3 in Scenario 3, respectively, which help save costs by 8.13, 2.82, 6.48, and 5.91 million RMB/year, respectively. The results show that for the four WWTPs, carbon emissions were reduced by 489, 325, 217, and 15 gCO2e/m3 in Scenario 1; 244.41, 316.33, 126.14, and 14.8 gCO2e/m3 in Scenario 2; and 598.85, 422.04, 313.22, and 15.02 gCO2e/m3 in Scenario 3, respectively. The carbon emission reduction ranged from 2.87% to 27.07% in Scenario 2, i.e., lower than those of the other scenarios, due to energy consumption being a critical factor. Combining the operational cost analysis, Scenario 2 is the most efficient solution to improve the efficiency of WWTPs at present. It is hoped that more actions such as dosing system accuracy enhancement, tail gas collection, photovoltaic power generation, carbon sequestration, and wastewater heat source recycling are carried out to achieve zero energy consumption and zero carbon emission in the WWTPs in future.
The original contributions presented in the study are included in the article/Supplementary Material; further inquiries can be directed to the corresponding authors.
RT: data curation, formal analysis, investigation, methodology, writing–original draft, and writing–review and editing. YH: data curation, methodology, project administration, resources, visualization, and writing–review and editing. EH: data curation, funding acquisition, supervision, visualization, and writing–review and editing. HL: formal analysis, investigation, and writing–review and editing. DW: funding acquisition and writing–review and editing. PL: investigation, visualization, and writing–review and editing.
The authors declare that financial support was received for the research, authorship, and/or publication of this article. This study received funding from China Three Gorges Corporation (No. 202103361), Yangtze Ecological and Environmental Co., Ltd (No. HB/ZB 2021130), and Yangtze River Ecological Protection and Restoration Joint Research (Phase II Program) (No. 2022-LHYJ-02-0303). The funders were not involved in the study design, analysis of data, and the writing of this article.
The authors would like to express their gratitude to the editors and reviewers of this article.
Authors EH and DW were employed by China Three Gorges Corporation. Authors EH and DW were employed by Yangtze Ecology and Environment Corporation Limited.
The remaining authors declare that the research was conducted in the absence of any commercial or financial relationships that could be construed as a potential conflict of interest.
All claims expressed in this article are solely those of the authors and do not necessarily represent those of their affiliated organizations, or those of the publisher, editors, and reviewers. Any product that may be evaluated in this article, or claim that may be made by its manufacturer, is not guaranteed or endorsed by the publisher.
Abuhasel, K., Kchaou, M., Alquraish, M., Munusamy, Y., and Jeng, Y. T. (2021). Oily wastewater treatment: overview of conventional and modern methods, challenges, and future opportunities. Water 13 (7), 980. doi:10.3390/w13070980
Agreement, P. (2015). “Paris agreement,” in Report of the conference of the parties to the United Nations framework convention on climate change (21st session, 2015: Paris). Retrived December (Vol. 4) (Getzville, NY: HeinOnline).
Al-Sulaiman, A. M., and Khudair, B. H. (2018). Correlation between BOD5 and COD for Al-Diwaniyah wastewater treatment plants to obtain the biodigrability indices. Pak. J. Biotechnol. 15 (2), 423–427.
Bodin, X., Rojas, F., and Brenning, A. (2010). Status and evolution of the cryosphere in the Andes of santiago (Chile, 33.5°S.). Geomorphology 118 (3-4), 453–464. doi:10.1016/j.geomorph.2010.02.016
Chen, X., and Zhou, W. (2022). Economic and ecological assessment of photovoltaic systems for wastewater treatment plants in China. Renew. Energy 191, 852–867. doi:10.1016/j.renene.2022.04.089
Deben, L., Kennedy, D., Gault, A., Thompson, M., Fankhauser, S., Hoskins, B., et al. (2013) The fourth carbon budget review–Part 1 assessment of climate risk and the international response.
Del Río-Gamero, B., Ramos-Martín, A., Melián-Martel, N., and Pérez-Báez, S. (2020). Water-energy nexus: a pathway of reaching the zero net carbon in wastewater treatment plants. Sustainability 12 (22), 9377. doi:10.3390/su12229377
Demir, Ö., and Yapıcıoğlu, P. (2019). Investigation of GHG emission sources and reducing GHG emissions in a municipal wastewater treatment plant. Greenh. Gases Sci. Technol. 9 (5), 948–964. doi:10.1002/ghg.1912
Fernández-Arévalo, T., Lizarralde, I., Fdz-Polanco, F., Pérez-Elvira, S. I., Garrido, J. M., Puig, S., et al. (2017). Quantitative assessment of energy and resource recovery in wastewater treatment plants based on plant-wide simulations. Water Res. 118, 272–288. doi:10.1016/j.watres.2017.04.001
Fu, T., Xu, C., Yang, L., Hou, S., and Xia, Q. (2022). Measurement and driving factors of grey water footprint efficiency in Yangtze River Basin. Sci. Total Environ. 802, 149587. doi:10.1016/j.scitotenv.2021.149587
Gaona, À., Solís, B., Guerrero, J., Guisasola, A., and Baeza, J. A. (2023). Nitrite pathway in A2/O WWTPs: modelling organic matter reduction, operational cost and N2O emissions. J. Clean. Prod. 414, 137453. doi:10.1016/j.jclepro.2023.137453
Gu, Y., Li, Y., Li, X., Luo, P., Wang, H., Wang, X., et al. (2017). Energy self-sufficient wastewater treatment plants: feasibilities and challenges. Energy Procedia 105, 3741–3751. doi:10.1016/j.egypro.2017.03.868
Gu, Y., Li, Y., Yuan, F., and Yang, Q. (2023). Optimization and control strategies of aeration in WWTPs: a review. J. Clean. Prod. 138008, 138008. doi:10.1016/j.jclepro.2023.138008
Gupta, D., and Singh, S. K. (2012). Greenhouse gas emissions from wastewater treatment plants: a case study of Noida. J. Water Sustain. 2 (2), 131–139.
Hernández-Sancho, F., Molinos-Senante, M., and Sala-Garrido, R. (2011). Energy efficiency in Spanish wastewater treatment plants: a non-radial DEA approach. Sci. Total Environ. 409 (14), 2693–2699. doi:10.1016/j.scitotenv.2011.04.018
Hu, H. (2021) China urban wastewater treatment and recycling development report (in Chinese) (1978-2020). China Construction Industry Press.
IPCC-Intergovernmental Panel on Climate Change Climate Change (2007). The physical science basis, contribution to the fourth assessment report (AR4). Available at: http://www.climatechange2013.org/.
Jegatheesan, V., Liow, J. L., Shu, L., Kim, S. H., and Visvanathan, C. (2009). The need for global coordination in sustainable development. J. Clean. Prod. 17 (7), 637–643. doi:10.1016/j.jclepro.2008.11.016
Kitano, N., Qu, F., and Bennon, M. (2023) Building gaobeidian: developing the environmental infrastructure of modern beijing.
Kong, W., Wang, L., Wang, Y., et al. (2021). An example of semi-subterranean WWTP in a town. Industrial Wastewater Wastewater in Chin. 52 (06), 65–69.
Koutsou, O. P., Gatidou, G., and Stasinakis, A. S. (2018). Domestic wastewater management in Greece: greenhouse gas emissions estimation at country scale. J. Clean. Prod. 188, 851–859. doi:10.1016/j.jclepro.2018.04.039
Longo, S., d’Antoni, B. M., Bongards, M., Chaparro, A., Cronrath, A., Fatone, F., et al. (2016). Monitoring and diagnosis of energy consumption in wastewater treatment plants. A state of the art and proposals for improvement. Appl. energy 179, 1251–1268. doi:10.1016/j.apenergy.2016.07.043
Lv, Z., Shan, X., Xiao, X., Cai, R., Zhang, Y., and Jiao, N. (2022). Excessive greenhouse gas emissions from wastewater treatment plants by using the chemical oxygen demand standard. Sci. China Earth Sci. 65, 87–95. doi:10.1007/s11430-021-9837-5
Maktabifard, M., Zaborowska, E., and Makinia, J. (2018). Achieving energy neutrality in wastewater treatment plants through energy savings and enhancing renewable energy production. Rev. Environ. Sci. Bio/Technology 17, 655–689. doi:10.1007/s11157-018-9478-x
Miyoshi, T., Nguyen, T. P., Tsumuraya, T., Tanaka, H., Morita, T., Itokawa, H., et al. (2018). Energy reduction of a submerged membrane bioreactor using a polytetrafluoroethylene (PTFE) hollow-fiber membrane. Front. Environ. Sci. Eng. 12, 1–10. doi:10.1007/s11783-018-1018-y
Nana, L. (2013) Research on energy consumption analysis and energy saving measures of urban WWTP. Hebei University of Engineering. (in Chinese).
Pan, Z., Zhou, J., Lin, Z., Wang, Y., Zhao, P., Zhou, J., et al. (2020). Effects of COD/TN ratio on nitrogen removal efficiency, microbial community for high saline wastewater treatment based on heterotrophic nitrification-aerobic denitrification process. Bioresour. Technol. 301, 122726. doi:10.1016/j.biortech.2019.122726
Paustian, K., Babcock, B., Hatfield, J. L., Lal, R., McCarl, B. A., McLaughlin, S., et al. (2001). “Agricultural mitigation of greenhouse gases: science and policy options,” in 2001 conference proceedings, first national conference on carbon sequestration (Washington, DC: Conference on Carbon Sequestration).
Pawar, A. A., Karthic, A., Lee, S., Pandit, S., and Jung, S. P. (2022). Microbial electrolysis cells for electromethanogenesis: materials, configurations and operations. Environ. Eng. Res. 27 (1).
Quraishi, M., Wani, K., Pandit, S., Gupta, P. K., Rai, A. K., Lahiri, D., et al. (2021). Valorisation of CO2 into value-added products via microbial electrosynthesis (MES) and electro-fermentation technology. Fermentation 7 (4), 291. doi:10.3390/fermentation7040291
Racoviceanu, A. I., Karney, B. W., Kennedy, C. A., and Colombo, A. F. (2007). Life-cycle energy use and greenhouse gas emissions inventory for water treatment systems. J. infrastructure Syst. 13 (4), 261–270. doi:10.1061/(ASCE)1076-0342(2007)13:4(261)
Shahabadi, M. B., Yerushalmi, L., and Haghighat, F. (2010). Estimation of greenhouse gas generation in wastewater treatment plants–Model development and application. Chemosphere 78 (9), 1085–1092. doi:10.1016/j.chemosphere.2009.12.044
Singh, P., Kansal, A., and Carliell-Marquet, C. (2016). Energy and carbon footprints of sewage treatment methods. J. Environ. Manag. 165, 22–30. doi:10.1016/j.jenvman.2015.09.017
Son, S., Koo, B., Chai, H., Tran, H. V. H., Pandit, S., and Jung, S. P. (2021). Comparison of hydrogen production and system performance in a microbial electrolysis cell containing cathodes made of non-platinum catalysts and binders. J. Water Process Eng. 40, 101844. doi:10.1016/j.jwpe.2020.101844
Song, B., Qin, H., and Ma, G. (2015). Analysis for dynamic changes of wastewater treatment plant carbon emissions in operation phase: with a wastewater treatment plant in Shenzhen as an example. Environ. Sci. Technol. (China) 38 (10), 204–209.
Sun, Y., Chen, Z., Wu, G., Wu, Q., Zhang, F., Niu, Z., et al. (2016). Characteristics of water quality of municipal wastewater treatment plants in China: implications for resources utilization and management. J. Clean. Prod. 131, 1–9. doi:10.1016/j.jclepro.2016.05.068
Tan, X., Shi, L., Ma, Z., Zhang, X., and Lu, G. (2015). Institutional analysis of sewage treatment charge based on operating cost of sewage treatment plant-an empirical research of 227 samples in China. China Environ. Sci. 35 (12), 3833–3840.
Vergara, W., Rios, A. R., Paliza, L. M. G., Gutman, P., Isbell, P., Suding, P. H., et al. (2013) The climate and development challenge for Latin America and the Caribbean: options for climate-resilient, low-carbon development. Inter-American Development Bank.
Wang, H., Yang, Y., Keller, A. A., Li, X., Feng, S., Dong, Y. N., et al. (2016). Comparative analysis of energy intensity and carbon emissions in wastewater treatment in USA, Germany, China and South Africa. Appl. Energy 184, 873–881. doi:10.1016/j.apenergy.2016.07.061
Xiaoshan, F., and Jixi, G. (2007). High environmental cost behind low China price. Chin. J. Popul. Resour. Environ. 5 (3), 63–75. doi:10.1080/10042857.2007.10677520
Xie, T., and Wang, C. (2012). Greenhouse gas emissions from WWTPs. J. Tsinghua Univ. Sci. Technol. (in Chinese) 52 (4), 473–477.
Xie, Z., Zhang, X., Wei, J., et al. (2017). Practice and summary of the application of dual-membrane inner-cycle biological reaction treatment process (DMBR). China Wastewater Supply and Drainage (in Chinese) (18), 22–24.
Xu, A., Wu, Y., Chen, Z., et al. (2022). Analysis of the construction and operation status of urban wastewater treatment plants in the yellow river basin. Journal of Water Supply and Drainage in Chinese 58 (12), 27–36. doi:10.13789/j.cnki.wwe1964.2022.04.08.0004
Yang, J., and Chen, B. (2021). Energy efficiency evaluation of wastewater treatment plants (WWTPs) based on data envelopment analysis. Applied Energy 289, 116680. doi:10.1016/j.apenergy.2021.116680
Yeshi, C., Leng, L. C., Li, L., Yingjie, L., Seng, L. K., Ghani, Y. A., et al. (2013). Mass flow and energy efficiency in a large water reclamation plant in Singapore. Journal of Water Reuse and Desalination 3 (4), 402–409. doi:10.2166/wrd.2013.012
Yu, J., Zhao, R., Xiao, L., Zhang, L., Wang, S., Chuai, X., et al. (2020). Carbon emissions of urban wastewater treatment system based on the “water-energy-carbon” nexus. Resource Science (in Chinese) 42 (06), 1052–1062. doi:10.18402/resci.2020.06.04
Zahid, M., Savla, N., Pandit, S., Thakur, V. K., Jung, S. P., Gupta, P. K., et al. (2022). Microbial desalination cell: desalination through conserving energy. Desalination 521, 115381. doi:10.1016/j.desal.2021.115381
Zhang, C., Lin, F., Rong, H., et al. (2009). Research on the effect of C/N on simultaneous nitrogen and phosphorus removal in Carrousel 2000 oxidation ditch. Journal of Environmental Engineering in Chinese 3 (03), 451–454.
Zhang, Z. (2016). 17. Policies and measures to transform China into a low-carbon economy. China’s New Sources of Economic Growth 397.
Zhao, X., Deng, L., Xu, X., et al. (2023). BBR process for quasi-IV wastewater upgrading of WWTP. China Wastewater Supply and Drainage. China Water Supply and Drainage 39 (10), 115–120. in Chinese. doi:10.19853/j.zgjsps.1000-4602.2023.10.019
Zhao, X., Ma, X., Chen, B., Shang, Y., and Song, M. (2022). Challenges toward carbon neutrality in China: strategies and countermeasures. Resources, Conservation and Recycling 176, 105959. doi:10.1016/j.resconrec.2021.105959
Keywords: wastewater treatment plant, efficiency improvement, carbon reduction, influent concentration, carbon emissions, operating cost
Citation: Tao R, Huang Y, Hui E, Luo H, Wang D and Lv P (2024) Efficiency improvement of wastewater treatment plants under the background of “double carbon”: a case study in Jiujiang city, China. Front. Environ. Sci. 12:1331092. doi: 10.3389/fenvs.2024.1331092
Received: 02 November 2023; Accepted: 07 May 2024;
Published: 23 July 2024.
Edited by:
Zifu Li, University of Science and Technology Beijing, ChinaReviewed by:
Sokhee P. Jung, Chonnam National University, Republic of KoreaCopyright © 2024 Tao, Huang, Hui, Luo, Wang and Lv. This is an open-access article distributed under the terms of the Creative Commons Attribution License (CC BY). The use, distribution or reproduction in other forums is permitted, provided the original author(s) and the copyright owner(s) are credited and that the original publication in this journal is cited, in accordance with accepted academic practice. No use, distribution or reproduction is permitted which does not comply with these terms.
*Correspondence: Yuling Huang, aHVhbmczOXlAZ21haWwuY29t; Dianchang Wang, d19jdGdwQDEyNi5jb20=
Disclaimer: All claims expressed in this article are solely those of the authors and do not necessarily represent those of their affiliated organizations, or those of the publisher, the editors and the reviewers. Any product that may be evaluated in this article or claim that may be made by its manufacturer is not guaranteed or endorsed by the publisher.
Research integrity at Frontiers
Learn more about the work of our research integrity team to safeguard the quality of each article we publish.