
95% of researchers rate our articles as excellent or good
Learn more about the work of our research integrity team to safeguard the quality of each article we publish.
Find out more
ORIGINAL RESEARCH article
Front. Environ. Sci. , 07 February 2024
Sec. Interdisciplinary Climate Studies
Volume 12 - 2024 | https://doi.org/10.3389/fenvs.2024.1328808
 Ishaq Ali Shah1,2*
 Haroon Khan3Zahir Muhammad1Rehman Ullah1Shahid Iqbal4Hiba-Allah Nafidi5
 Mohammed Bourhia6,7*Ahmad Mohammad Salamatullah8
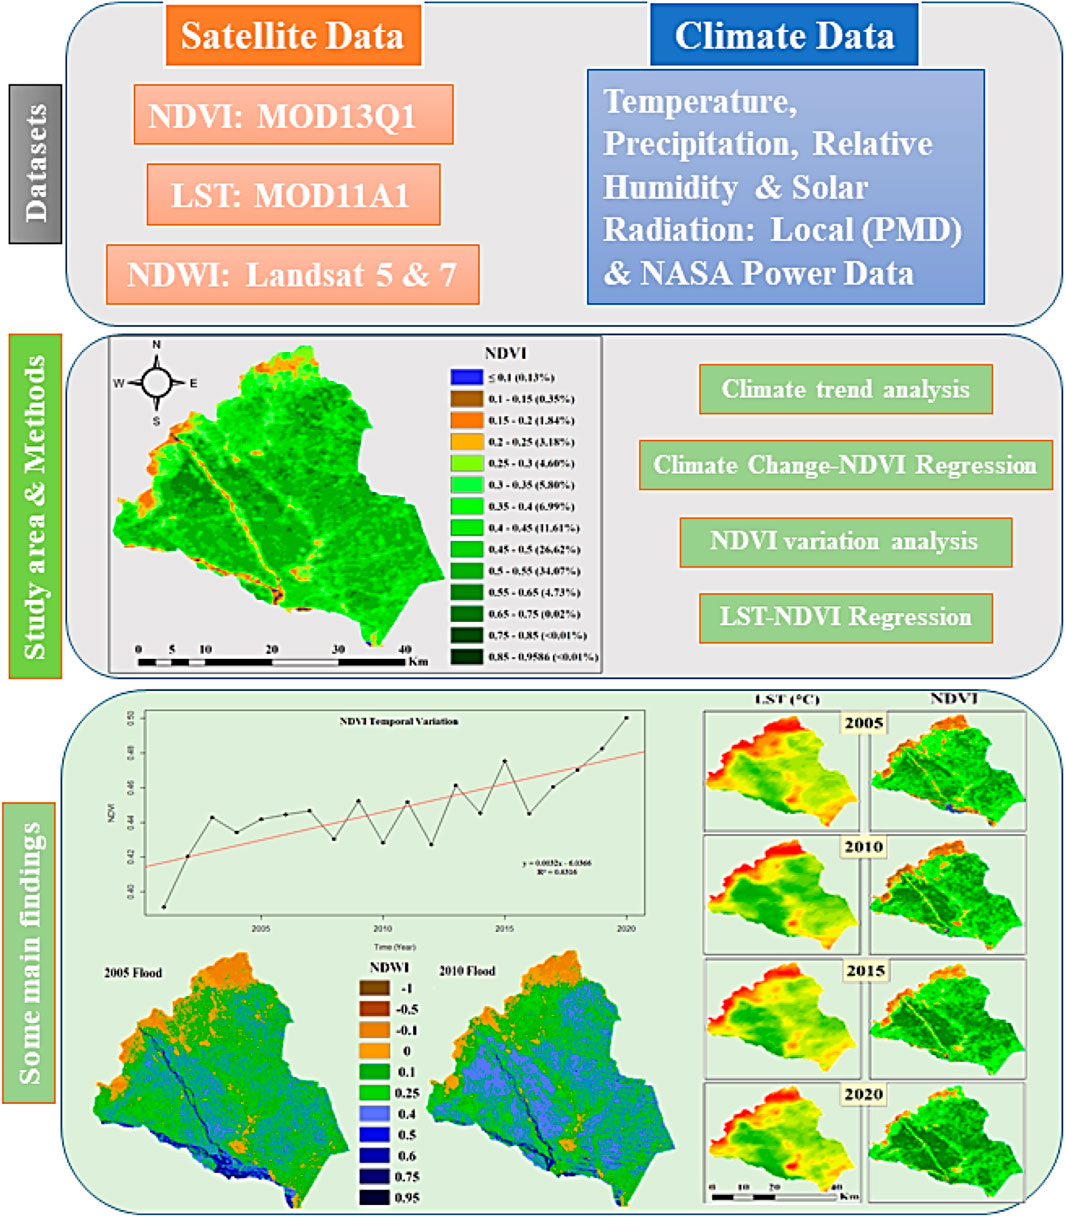
Climate change (CC) is the menace of the hour impacting every facet of human existence. Regional CC and its impact studies are crucial in that they contribute to global change. The current study aims to investigate the prevalence of CC in Charsadda, Pakistan and its impact on vegetation and hydrology of the region to understand microclimate variability contribution to global CC. Utilizing local climate data for 20 years (2001–2020), Modified Mann-Kendall and Sen’s Slope statistics were employed to determine monthly and seasonal trends in climate variables. Significant changing climate variables were regressed on Moderate resolution Imaging Spectroradiometer (MODIS) satellite dataset viz. normalized difference vegetation index (NDVI). Due to the prominent climate factor impacting vegetation, NDVI was further correlated to MODIS land surface temperature (LST). Floods being the conspicuous climate calamity were mapped for 2005 and 2010 using satellites Landsat 5 and 7 dataset viz. normalized difference water index (NDWI) with flood risk assessment by watershed delineation. The findings revealed significant (p < 0.05) variability in climate variables (average monthly and summer maximum temperature, and average monthly and summer precipitation) that are driving CC and impacting vegetation and hydrology in the region. Temperature and solar radiation affect NDVI adversely while precipitation and relative humidity has positive impact on vegetation. NDVI varied greatly spatiotemporally, often increasing but worsening in some areas (Shabqadar, Abazai, Palai and Charsadda city with NDVI = 0.1–0.3) of the study region as a result of extreme weather events. Temporally, NDVI improved with an overall positive trend with a stage (2007–2016) of noticeable zigzag fluctuation. Spatial grids with higher LST (>40°C) were either devoid of or with sparse NDVI (<0.3) presenting global warming as peril to vegetation. NDWI maps (2005, 2010 floods) indicate that after floods wreaked havoc on the region altering the vegetation pattern revealing heavy irregular precipitation as the next to temperature in jeopardizing vegetation of the region. Lower elevation regions along the Swat and Kabul Rivers with a greater risk of flooding were identified by watershed delineation. The study suggests that local governments and stakeholders implement CC mitigation strategies and plans for vegetation restoration, flood alerts with post-flood management for regional sustainable development.
Climate change (CC) is the heinous concern of the present day world and linked to rising temperature due to excessive greenhouse gas (GHG) caused by fast industrialization and urbanization since industrial revolution (Crowley, 2000; Van Huong et al., 2022). The release of GHG in alarming volumes for competition of power and money by the world largest economies is compounding the problem as warming trends are expected to exacerbate the impact of climate change in the coming decades, jeopardizing impoverished countries like Pakistan (Hussain et al., 2022a; Van Huong et al., 2022). Carbon capture via various technologies such as direct air capture (DAC) is one of the controlling measure to combat the threat of CC (Towoju and Petinrin, 2023). DAC involves air contacting sorbent medium and regeneration segment removing CO2 independent of its origin source (Sodiq et al., 2023). Intergovernmental panel on climate change (IPCC) fifth assessment report (AR5) showed rapid warming above the global mean for South Asia CC estimates which will negatively impact agricultural practices as well as vegetation cover (Hussain S. et al., 2022; 2023). The earth’s land surface temperature (LST) will rise by 0.5°C–4.4°C over the 1990 levels during the next century as per climate model projections (Van Vuuren et al., 2008). Changes in vegetation produce natural disturbances, which modify biosphere–atmosphere interactions (Scheffer et al., 2005). Climate and vegetation are inextricably linked; thus, changes in one affect changes in the other. Changes in vegetation cover at regional as well as global scale can affect the climate system by altering the components of a region’s climate (Hussain et al., 2023). The dynamics of vegetation also vary as a result of climatic changes. Longitudinal studies are imperative to understand long term climate-vegetation interactions and then adaptations of plants to regional and global CC via temporal phenology and geographical distribution (Bertin, 2008; Shahid et al., 2021). Dynamic ecosystem models may represent the complicated interactions between plant physiological systems and climatic variability (Sitch et al., 2003; Gritti et al., 2006). LST is the earth ground surface radiative energy emitted often referred to earth skin or radiometric temperature and which may not be confused with near surface air temperature (Hulley et al., 2019). Among environmental settings, one of the significant factors is the temperature of land surface as well as of atmosphere which is affected by surface energy changes, microclimatology, human thermal comfort, atmospheric pollution, anthropogenic heat discharge and buildings energy consumptions (Halder et al., 2021). LST, for bare soil, is the temperature of topmost few micrometers of soil surface, for dense vegetation, is the temperature of the canopy leaves and for sparse vegetation, is the ensemble temperature of the canopy, the understory (branches, etc.) and soil surface (Hulley et al., 2019).
Monitoring changes in vegetation and land cover has been made possible by remote sensing (RS) data, which has considerably aided in sustainable land use management (Atif et al., 2015; Hussain et al., 2023). Studying how plant and land cover change over time as a result of natural disasters like droughts and floods are affected by CC is made possible by RS and geographic information systems (GIS). The introduction of GIS and the synoptic view, along with the repetitive nature and digital format suitable for computer handling of remote satellite sensing data, have led to improved mapping and real-time monitoring of vegetation, urbanization, and agricultural production (Shah et al., 2022b; 2023). NDVI, an essential metric for examining variations in plant cover over time, is obtained from RS satellite spectral bands which measures the vegetation health as it has a robust correlation with green biomass (Shah et al., 2022b; Hussain S. et al., 2022). It is a very accurate measure for analyzing variations in plant cover across time and space, detecting the crop types and land use/land cover (LULC) change as well as assessing crop yield and production (Gao et al., 2019; Hussain et al., 2023). NDVI is sensitive climate factors such as temperature, precipitation, solar radiation and relative humidity (Shah et al., 2022b; 2023). Among these climate variables temperature is the most heinous one and is focused more in climate vegetation interaction studies. LST is a closely linked with NDVI in the context as studied by many researchers (Maroni et al., 2021). NDWI is another RS dataset used for flood mapping in conjunction with pre- and post-flood image processing to determine the extent of the flood (Memon et al., 2015; Shah et al., 2022b; Singh and Kansal, 2022). The NDWI is designed to maximized detection of the green spectral band reflection from the water bodies of earth surface (Ganaie et al., 2013; Khalifeh Soltanian et al., 2019). Environmental monitoring is based on detection of temporal trends as such studies are extracted from historical environmental behaviors. Mann-Kendall test and linear regression models are used to examine the temporal trends of plant cover and land cover variance (Mustapha, 2013; Jiang et al., 2015).
Pakistan is hit by the CC induced weather extremes especially monsoon (July-September) flash and fluvial floods since its inception such as witnessed in 1955, 1973, 1976, 1980, 1992 (Solheim et al., 2001), 2005, 2010, 2014, 2015, 2016, 2017, 2020, 2021 (EM- DAT, 2022) and 2022 (Devi, 2022). The country is ranked fifth and eighth most vulnerable to CC induced weather extremes as per the global climate risk index 2020 (1999–2018) and 2021 (2000–2019) reports respectively (Eckstein et al., 2019; 2021). The Indus-Kabul river system flooding catastrophe in 2010 killed 1985 people in addition to a worth $9,500,000 infrastructure losses (EM- DAT, 2022). Over the previous 2 decades, CC has increased the volume, occurrence and intensity of floods (Zhang et al., 2011). Several studies show that developing agrarian nations tend to be more vulnerable to CC extremes due to their dependence on subsistence agriculture, livestock production in addition to poor adaptive capacity and limited access to resources to mitigate the impact of CC (Minh et al., 2023). Khyber Pakhtunkhwa (KP) is Pakistan’s most climate-change-affected province, owing to its varied terrain and the existence of significant rivers such as the Indus, Kabul, and others (Atta-ur-Rahman and Khan, 2013). The human intervention such as embankments, LULC change, sewage discharges of industrial, domestic and agricultural practices, dams and barrages construction in the Indus river has caused it to become sediment-laden resulting in run-off and catastrophic floods (Shahid et al., 2018; Shah et al., 2022b).
The significance of the current regional research on the effects of CC on hydrology and vegetation lies in its potential to further knowledge of the global CC phenomenon and its consequences. The district Charsadda has had several catastrophic floods such as 2010 due to climate extremes that have affected its sensitive vegetation besides agricultural output (Fida et al., 2021; Shah et al., 2022b). The area is home to Kabul and Swat, two of the most well-known rivers in KP. Because of their confluence, there is an increased danger of flooding in the future, which makes research like this necessary. Peshawar valley/basin is recognized as food basket of KP (Khan et al., 2014a; Shah et al., 2022a), the district which is part of the said basket requires special attention. The present study will.
1. Analyze regional climate data to test the hypothesis of occurrence of CC in the study area.
2. Monitor spatiotemporal variation in the vegetation cover under the influence of CC.
3. Regress vegetation (NDVI) on climate parameters especially LST to elaborate climate-vegetation interaction
4. Map floods of 2005 and 2010 to enunciate its implications on the region especially its vegetation
5. Devise mitigation measures to address the threat posed by CC
Located in the northwest corner of the Peshawar Valley, the Charsadda district spans latitudes 34°02′59.99″N to 34°38′00″N, longitudes 71°28′01″E to 71°53′01″E, and elevations 277m–979 m (SRTM DEM). Mohmand, Peshawar, Mardan, Malakand, and Nowshera districts border it to the northwest, south, northeast, north, and southeast, respectively (Figure 1), encompassing a total area of 996 km2 (Provincial Land Use Plan, 2020). The common forms of land cover entail water body (8.8%), barren terrain (22.5%) and agricultural land (68.5%) (Fida et al., 2020). The district has a semi-arid hot climate classified as BSh by the Köppen–Geiger climate classification system. The yearly precipitation is 460 mm and the average temperature is 22.5°C (Iqbal and Ali, 2022). January remains the coldest month of the year with a temperature range of 3.1°C–10.4°C, June as the driest and hottest month of temperature 25.6°C–41°C and 11 mm average precipitation and August as the wettest and greenest month with an average precipitation range of 400–600 mm and relative humidity of 64.6% (Shah et al., 2023). In terms of geology, the region comprises 80% deposited alluvium and 20% rocks and gravel in outcrops throughout the northwest and much of the western terrain (Provincial Land Use Plan, 2020).
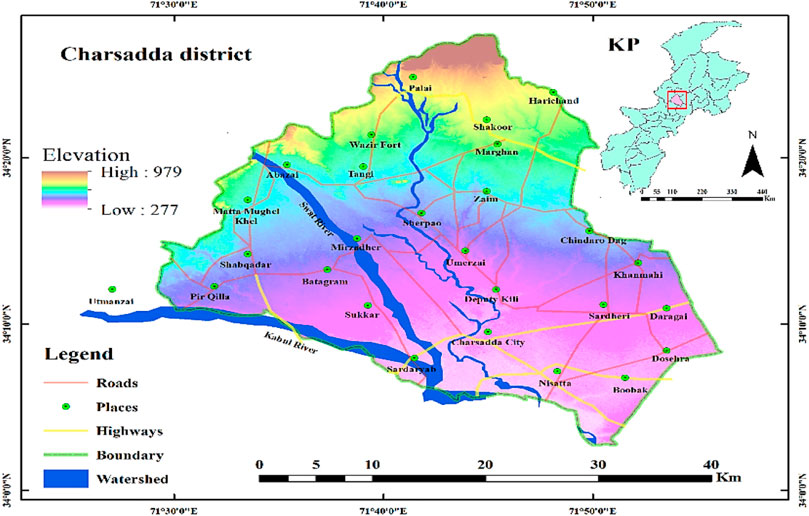
FIGURE 1. Locational map of the study area showing localities/sites of concern in the study.
The following table is providing details of the datasets used in the current study.
The most popular approach for analyzing time series changes in land cover and plant cover as a result of CC and human activities is the combination of RS data with GIS and R analysis. Numerous indicators are used to quantify changes in the large-scale vegetation cover and hydrological oscillations. Accurate mapping of vegetation, aquatic bodies, built-up regions, and land features is made possible by remote satellite sensing of many bands of visible and invisible light, each with unique absorption and reflection properties. Reliable measures of vegetation and water bodies, the NDVI and NDWI are used to monitor changes in vegetation cover and hydrology over time. These are obtained by applying Eqs 1, 2 to plant properties of Near Infra-red (NIR) band (780–890 nm) reflection and red band (680–710 nm) absorption (Tucker, 1979) while water bodies absorption of NIR and reflection of Green band (490–570 nm) respectively.
Where
ArcGIS 10.8.2 was used to obtain both datasets from the satellite data. Using the maximum value composite technique (Holben, 1986), which eliminated cloud masking, solar zenith, and air pollution, the NDVI was averaged for the whole district and converted to monthly mean NDVI values. The yearly mean NDVI for the inter-annual vegetation variation analysis was calculated using the monthly mean NDVI. The floods of 2005 and 2010 were mapped via NDWI with elaboration of before and after flood situation mapping the concurrent timeframe NDWI.
LST is a measurement of the heat radiation emitted from the ground or the canopy’s surface in vegetated areas. It is a significant factor in the local and global surface energy and water balance (Shah et al., 2023). It can give spatially continuous LST with worldwide coverage and is extracted using remotely sensed thermal infrared (TIF) data, allowing researchers to look at the thermal heterogeneity of the Earth’s surface and the effects of both natural and man-made changes on surface temperatures (Hu and Brunsell, 2015). LST’s sensitivity to variations in plant density makes it a useful tool in ecological and biogeographical research. Thus, in both agricultural and natural environments, it can monitor changes in ecosystems, surface moisture levels, transpirational cooling, drought, and plant stress (Anderson et al., 2000; Bertin, 2008). LST is used to investigate the effects of changing land cover on climate as well as the interactions between tropical forest droughts, heat waves, melting ice sheets, and maximum thermal anomalies (Mildrexler et al., 2018).
The Generalized Split-Window (GSW) method, a typical MODIS LST retrieval algorithm, is one of the MODIS LST algorithms that GEE uses (Wan and Dozier, 1996; Ghent et al., 2019). The clear-sky top-of-atmosphere (TOA) brightness temperatures (BTs) from bands 31 and 32, which are centered on 11 µm and 12 µm, respectively, are used to estimate LST using the GSW technique. The GSW-based LST approach is commonly expressed as follows:
LST is calculated using Eq 3, where
In addition to USGS EE, using JavaScript codes in Google Earth Engine’s (GEE) code editor, the datasets may be examined, sorted, exported to Google Drive, and downloaded. The current study investigated the precision of both data collection methods. The USGS EE and GEE shall be held responsible for the final data correctness and resolutions. GEE is a planetary-scale database and geospatial analytical platform designed for a variety of research functions, including large-scale cloud computing, petabyte-scale massive archives of remote sensing data, and special tools for large-scale geospatial data processing and ultimate decision-making, such as Geospark, Hadoop, Terralib, and others (Camara et al., 2000; Whitman et al., 2014; Yu et al., 2015).
The meteorological data [temperature (°C), average daily precipitation (mm/day) and relative humidity (%)] for a study period of 20 years (2001–2020) were collected from a number of meteorological stations under the administration of Pakistan Meteorological Department (PMD) in or around the research region. The data were also acquired from NASA Power Data Access for missing parameter [solar radiation (W/m2)] in local data and the rest of the parameters cross-validation for accuracy and precision.
Climate data after correct sorting and seasonal organization (summer includes May, June, July and August, while winter comprises November, December and January), was analyzed in R (4.2.1 version) using modified Mann-Kendall (MK) and Sen’s Slope (SS) statistics. MK trend test is the most familiar trend detection method frequently utilized in time series studies (Alashan, 2020). The test is a nonparametric test for estimating trends in climate datasets having no normal distribution and is less susceptible to outliers (Hussain et al., 2022b). The method assumes that there is no trend in the examined time series at first as a null hypothesis, H0. The alternative hypothesis H1 is valid if H0 is rejected which means that there exists a trend. The acceptance is based on standardized test statistic ‘Z’ with a specific significance level ‘α’ (Alashan, 2020). The SS estimator is used to estimate the magnitude of trends (Hussain et al., 2022a).
The current study linked climatic factors and NDVI to estimate the impact of CC on vegetation. Simple and multivariate linear regression models were used to investigate climate parameters such as annual mean temperature (°C), precipitation (mm/day), relative humidity (%), solar radiation (W/m2), and NDVI. To visualize and interpret data, scatter plots were utilized.
The inter-annual variation (temporal variation) in the NDVI was calculated using the linear regression model of ordinary least squares (OLS). The OLS model is commonly used in time series variation analysis (Wen et al., 2015). Eq 4 provides the slope, which may then be interpreted for an examination of the NDVI fluctuation trend (Xianfeng et al., 2013). Increased vegetation cover is indicated by a slope larger than zero, decreasing vegetation cover is indicated by a slope less than zero, and no discernible change in vegetation cover is indicated by a slope of zero.
Where
The software program ArcGIS 10.8.2 was utilized for the examination of spatial variation trends. After a 20-year analysis of the averaged NDVI photos, a composite change in plant cover was seen over the research. Supervised classification was used to construct (train) a high-accuracy sample layer file. When the sample layer classes were applied to the test NDVI pictures, the spatial variations in plant cover during the wet (August) and dry (June) months of each year were clearly shown and contrasted (see Figure 2).
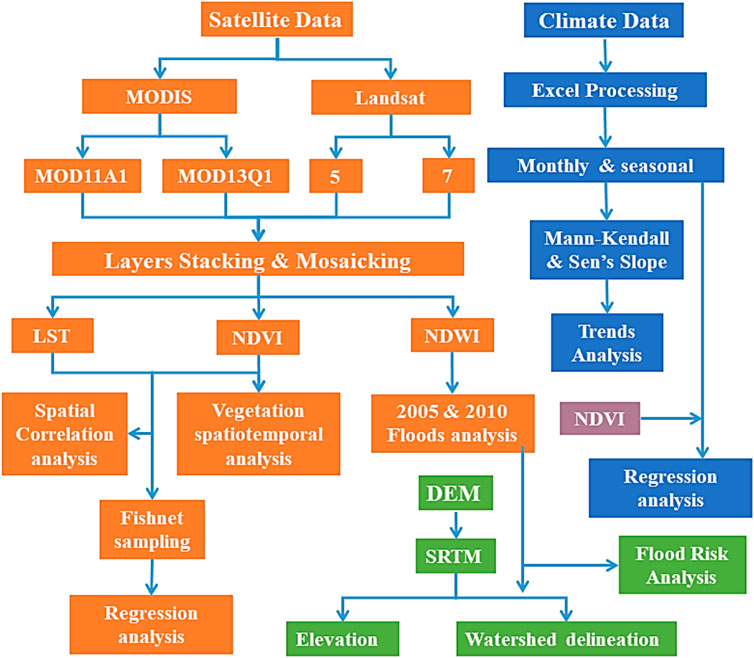
FIGURE 2. Flow chart for Data and Methods.
Data for LST and NDVI were collected from the MODIS Terra satellite MOD11A1 and MOD13Q1 (Table 1), respectively, using JavaScript in the code editor of GEE. The MODIS Terra satellite collects LST every day, whereas NDVI has a 16-day temporal resolution. The datasets were preprocessed and analyzed in ArcMap 10.8.2. Data from the June months of 4 years, 2005, 2010, 2015, and 2020, were examined. For both datasets, the data were first retrieved from the rasters using sampling by Fishnet in ArcMap’s toolbox. No-data-point rows were removed from the data before they were sorted and transferred to Excel for regression analysis. The rasters were then mapped to evaluate the spatial variance in both the LST and NDVI images from the aforementioned Junes (see Figure 2).

TABLE 1. Details for the datasets and their sources used in the study.
Landsat 5 and 7 data were employed for NDWI dataset extraction for the required timeframes, i.e., June 2005 and August 2010 with preceding and proceeding months NDWI for better comparison of flood month. The raw data was processed in ArcGIS 10.8.2 while creating a training data layer by supervised maximum likelihood classification. The accuracy of the layer was tested by Kappa coefficient (85%) and then applied to the months under consideration.
Watershed delineation was performed on Shuttle Radar Mission Topography (SRTM) Digital Elevation Models (DEM) data to probe flood risk including elevation gradient, water channels and flood inundation areas (Figure 2).
Table 2 displays the findings of Sen’s slope analysis and the modified Mann-Kendall trend test on monthly climate data from the Charsadda district over a 20-year period (2001–2020). The average monthly temperature is rising (MK Z-value = 0.94), as seen in the table, although it is statistically non-significant at a 95% confidence level. Monthly maximum temperature data reveals a statistically significant (p < 0.05) positive (rising) trend (MK Z-value = 2.97). The average of the monthly high and low temperatures is the monthly average temperature. The average yields unimpressive results since the maximum temperature is rising and the minimum temperature is declining. There is no discernible trend, despite the fact that the minimum temperature is gradually falling. The seasonal data studied reveal a rise in both the summer and winter seasons’ monthly average temperatures, as well as a substantial increase in just the summer season’s monthly maximum temperature. Even though it is exceptional, the minimum temperature during the summer displays a negative tendency (MK Z-value = −0.89), which is consistent with the pattern. The research area has seen erratic precipitation patterns for several years. As part of the monsoon region, the area is subjected to severe monsoon rains throughout the monsoon season, however at drastically varying rates and patterns each year. Table 2 shows an exceptionally significant rising trend (MK Z-value = 6.05) in monthly precipitation. The summer season, as shown in Table 2, consists of 4 months: May, June, July, and August, with the latter 2 months being in the monsoon period and hence experiencing the greatest monsoon spells. As a result of the two primary causes, frequent monsoon periods and the waterway of the Swat river in the research region, the land has been ruined by high floods (Atif et al., 2015). Furthermore, because of the changing pattern and rate of precipitation, the area experiences severe droughts in other seasons, with significant economic and cultural consequences. Both disasters (droughts in dry months and floods in wet months) wreak havoc on the region by negatively hurting the district’s socioeconomic standing (Dale, 1997).
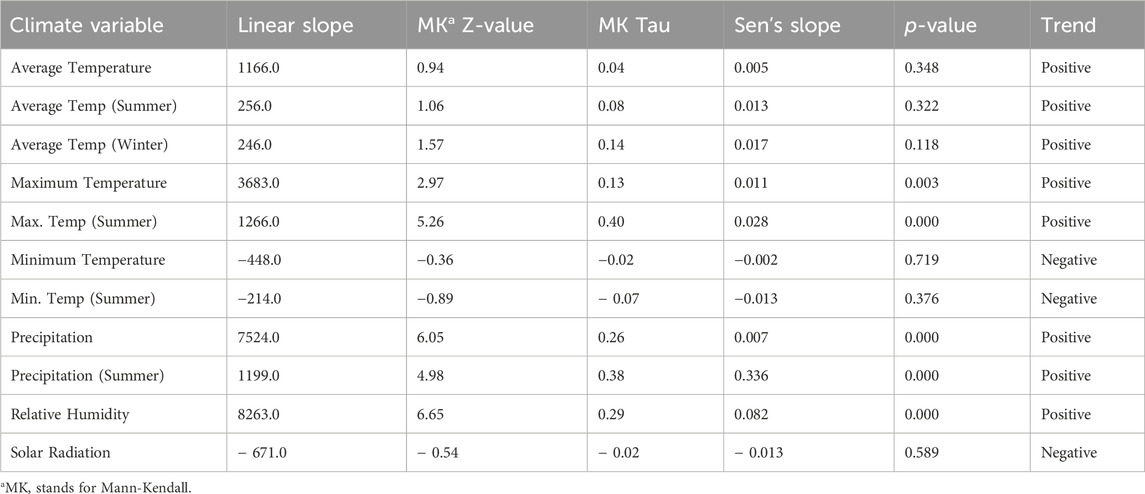
TABLE 2. A visual display of the monthly and seasonal climatic patterns (trends) for the district of Charsadda.
Table 2 also shows that relative humidity increased dramatically over the research period, which may have contributed to the warming of the study area’s environment. Water vapors in the air acts as a GHG and saturates the air, which may have a negative impact on the examined location. Most living species may be harmed by 100% humid air at temperatures over 40°C (Wang et al., 2010). However, Figure 3 shows that it has a favorable association with NDVI (vegetation). As seen in Table 2, solar radiation has a somewhat negative trend. The lowering trend of the climatic component has a negative impact on vegetation (NDVI) since it reduces the photosynthetic power of the plants.
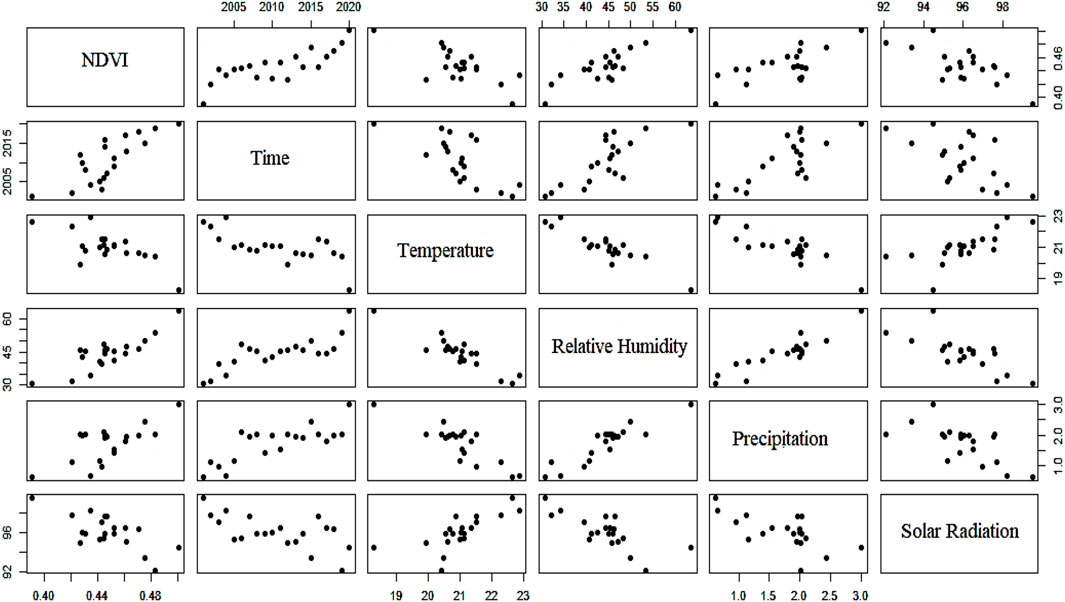
FIGURE 3. Time (years), average temperature (°C), relative humidity (%), precipitation (mm/day), and solar radiation (W/m2) are displayed as dependent and independent variables concurrently. The dependent variable here is NDVI, whereas the others are independent climatic parameters that influence NDVI; yet, this illustration portrays their relationship as if they were all independent variables with one dependent variable and vice versa.
CC has a significant influence on NDVI (Gao et al., 2019). Simple and multivariate linear regression models were used to evaluate the influence of climate on NDVI. Climate variables will always influence vegetation (NDVI) (Jiang et al., 2015). The cumulative association between NDVI and time (years), annual mean temperature (°C), precipitation (mm/day), relative humidity (%), and solar radiation (W/m2) is depicted in Figure 3. The findings indicate a significant link between weather patterns and NDVI. The NDVI has a positive correlation and regression coefficient when measured over time, showing that it improves with certain irregular fluctuations. Climate factors (precipitation and relative humidity) significantly improve NDVI.
Conversely, there is a negative correlation between NDVI and temperature and Sun radiation (Wang et al., 2001; Sun and Qin, 2016; Shah et al., 2023). The link between the NDVI and time, temperature, precipitation, relative humidity, and solar radiation is shown in Figure 3 in a way that makes each of these factors both independent (column-wise) and concurrently dependent (row-wise). The variables were substantially (p < 0.05) related, according to multiple linear regression in R. R2 = 0.835 showed the degree of data interrelationship and model design prediction. Vegetation is greatly impacted by temperature (Figure 3). A change in the Earth’s average temperature as seen in the research location is referred to as CC, and it always has a major effect on the local flora (Sun and Qin, 2016; Shah et al., 2022b). Precipitation affects plants (NDVI) in a reciprocal manner, unlike temperature.
Over the past 20 years, there has been a shift in the pattern of precipitation; while the extremes have a detrimental effect on the vegetation, overall, the effects have been positive. Plants are significantly impacted by relative humidity (Figure 3). The NDVI values cluster at 40%–50% humidity, indicating that this humidity range has a significant impact on plants. Solar radiation is an important climatic factor that determines NDVI. The relationship between NDVI and solar radiation is inverse (Figure 3). High radiation lowers plant photosynthetic production while simultaneously restricting evapotranspiration, both of which have a negative impact on vegetation (Shah et al., 2022b).
The dynamic element of the ecosystem that varies over time and space is the vegetation. Its constant change under the impact of CC demonstrates the dynamic interplay and climatic responsiveness of the surrounding environment. The present study emphasizes that due of their tight relationship, CC has significant effects on vegetation.
According to NDVI evaluations, human-caused CC has a major influence on plant cover. Figure 4 displays the yearly NDVI values fluctuation across the research period. The four stages below depict the variance trend from 2001 to 2020. The first stage shows a growing trend with a strong slope from 2001 to 2003. Following that, there is minor variation but no discernable trend from 2004 to 2007. From 2007 to 2016, the third stage features a zigzag fluctuation pattern with significant crests and troughs and an overall rising trend. Years of major reductions in NDVI values alternated with years with net rising tendency throughout this stage of NDVI temporal fluctuation. Even years exhibit lower NDVI values than odd years, such as 2008, 2010, 2012, 2014, and 2016, demonstrating a distinct trend in plant cover. From 2016 through 2020, the last stage shows a steady increasing trend, i.e., a rapid increase in NDVI values, indicating the fastest-growing tendency. In the final phase, the Pakistani government’s “billion tree tsunami” initiative in KP, vegetation improved significantly (Kamal et al., 2018). The overall trend of the NDVI variance indicated a gradual increase in vegetation, indicating a considerable improvement in the vegetation cover of the studied region during the past 20 years.
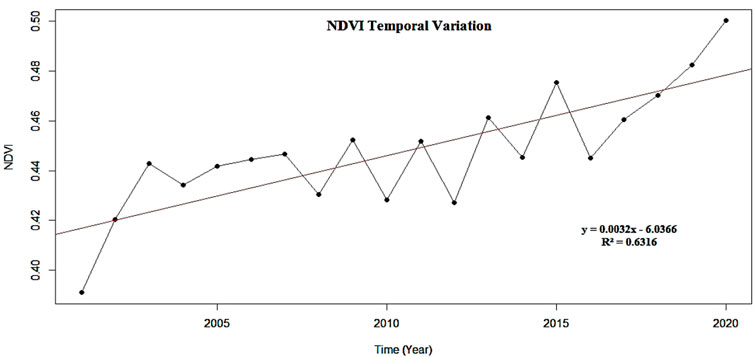
FIGURE 4. Inter-annual (2001–2020) NDVI variance in the district Charsadda exhibits erratic discord with overall improvement during the research period.
The climate of Charsadda is generally semi-arid to semi-humid. However, adverse climatic circumstances, such as natural catastrophes caused by CC, have caused drastic changes in the past. Figure 5 displays the inter-annual average NDVI spatial variation (in percentages for specific places) in the district of Charsadda from 2001 to 2020. The region is lush green, with the plant cover improving year after year. The region’s entire vegetation cover has high NDVI values, but as Figure 5 shows, the northwestern elevated boundary remains dry and sparsely vegetated. These elevated areas include Shabqadar, Matta Mughal Khel, Abazai, and Palai, as well as other tiny patches around Tangi and Charsadda City (see Figure 1 for locations), with NDVI values ranging from 0.1 to 0.3 and covering less than 10% of the district’s land. Pir Qilla, Batagram, Sukker, Umerzai, Mirzadher, Deputy Kili, Sherpao, Zaim, Chindaro Dag, Khanmahi, Nissata, Boobak, Dosehra, Sardheri, and Daragai are among the towns (representing more than 85% of the district) with NDVI values ranging from 0.3 to 0.55. Because of the district’s extensive agricultural fields, marshes, and artificially wooded Populus nigra zones around the Marghan, Shakoor, Harichand, and Swat rivers, 4.77% of the district has thick vegetation with an NDVI of greater than 0.55 (Figure 5). The district’s land cover categories include agricultural fields, marshes, woodland regions, cemetery wastelands, and urbanized lands. The most populous locations missing green patches are in Charsadda City and Shabqadar.
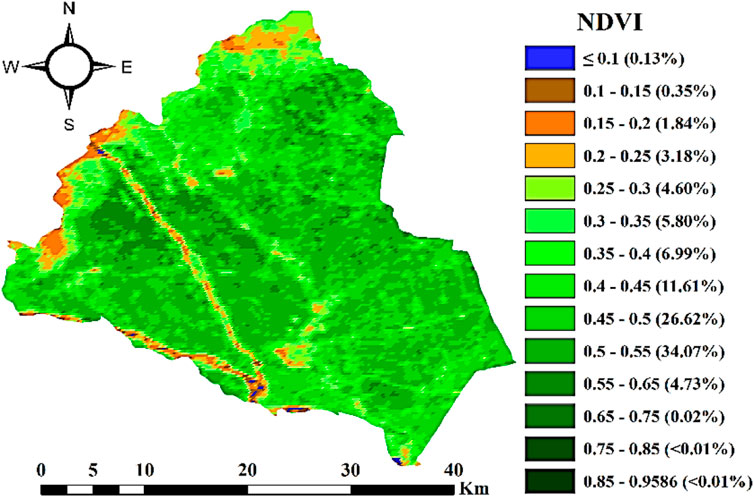
FIGURE 5. Spatial distribution of vegetation in district Charsadda showing variation over 20 years (2001–2010) with varied percentages for different places.
The NDVI of August, the greenest month of the year, is shown in Figure 6A. August has the most dense vegetation in the region, with an average NDVI range of 0.55–0.75, and it consistently improves year after year. A considerable quantity of barren land is seen in the region’s 2001 NDVI imagery. This amount of bare land gradually reduced over time with a few minor irregular oscillations until the study area’s 2020 NDVI image displays very little bare land. The monsoon season, which occurs in the same month, means there will be a lot of rain and humidity. The month of 2010 had the biggest flash flood in the region’s history, as seen on the map (Atta-ur-Rahman and Khan, 2013; Fida et al., 2020). June is the driest month of the year, hence the study area’s usual NDVI values are low, indicating that there is not much vegetation there (Figure 6B). Given that it is the hottest month of the year, it is extremely dry and scorching. The research region has little to no vegetation due to the extreme weather this month. Figure 6B depicts how weather severity, which has although consistently favoured NDVI since 2001, impacts the NDVI for each June. The NDVI range for most maps is between 0.05 and 0.4. All maps have a relatively small percentage of NDVI values higher than 0.35. Surprisingly, the maps show that vegetation increased the study area’s vegetation cover over time by slowly emerging over a long period of time.
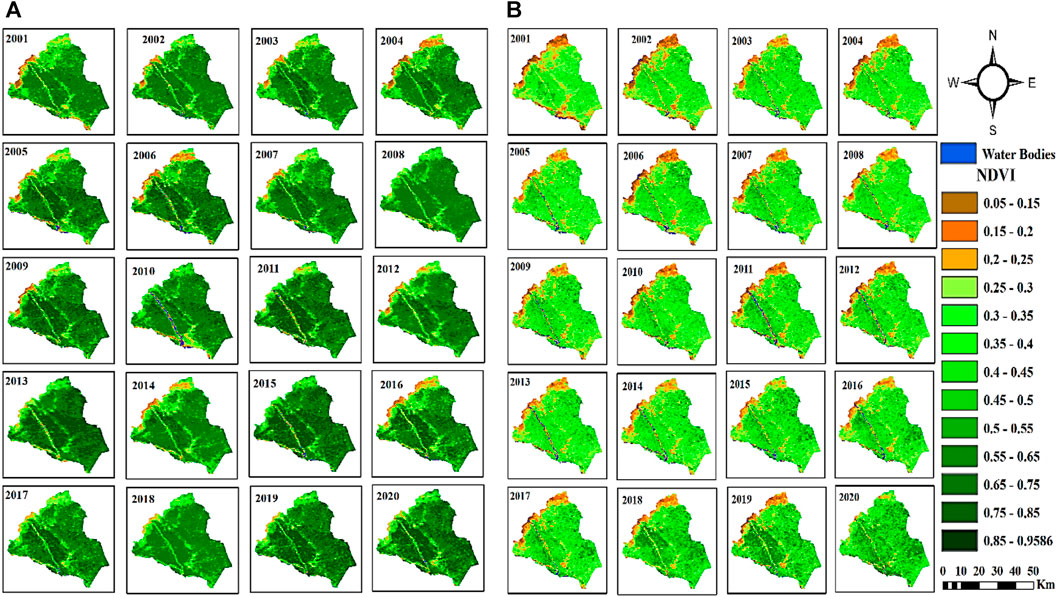
FIGURE 6. Vegetation (NDVI) variation in space and time for the study period (2001–2020) focusing the months of August (A) and June (B).
The previous section showed the research period’s June vegetation spatial distribution, which suggests that the vegetation is negatively impacted by the month’s high summer temperatures, together with a lack of humidity and precipitation. The delicate interaction between NDVI and high temperatures, as those in June, is the topic of the current section. Due to its sensitivity to changes in plant density, land surface temperature (LST) is commonly used for ecological and bio-geographical investigations and may therefore monitor ecosystem disturbances (Ghent et al., 2019). Loss of vegetation and soil moisture content causes a rise in LST, which is worsened by human activity. Urban development activities also have a direct impact on LST, which poses a worldwide problem for sustainable development. An extensive influence of LST on NDVI is revealed by scatter plots with regression in Figure 7, spatial distribution differences of both in Figure 8 and correlation analysis in Figure 9. The capacity of plants to evapotranspire and photosynthesize is hampered by temperatures that are above optimal limits, which results in the death of the vegetation (Shah et al., 2022b). With the expression of trend line equations and regression coefficients, Figure 7 shows the relationship between LST and NDVI.
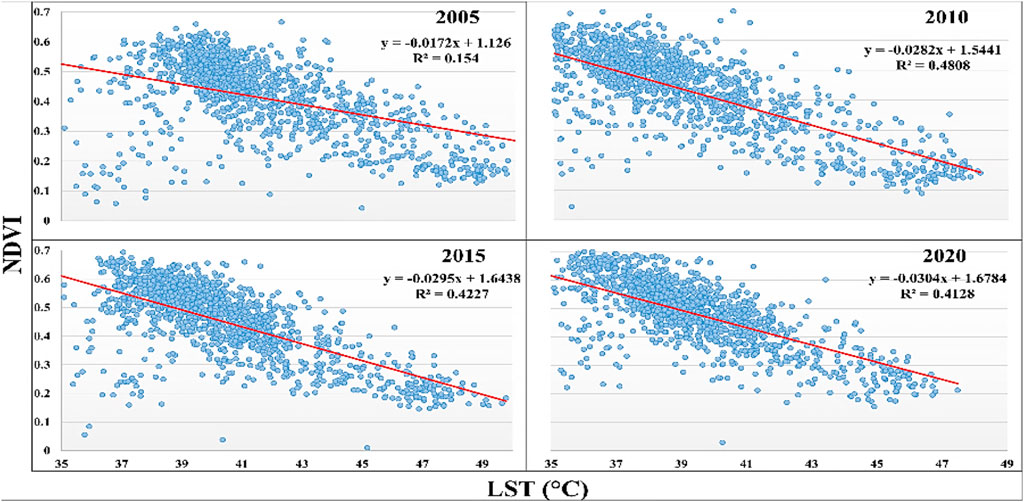
FIGURE 7. Scatter plots of spatial variations of LST and NDVI of the selected timeframes (Junes of 2005, 2010, 2015 and 2020) to represent the regression coefficients and trend lines.
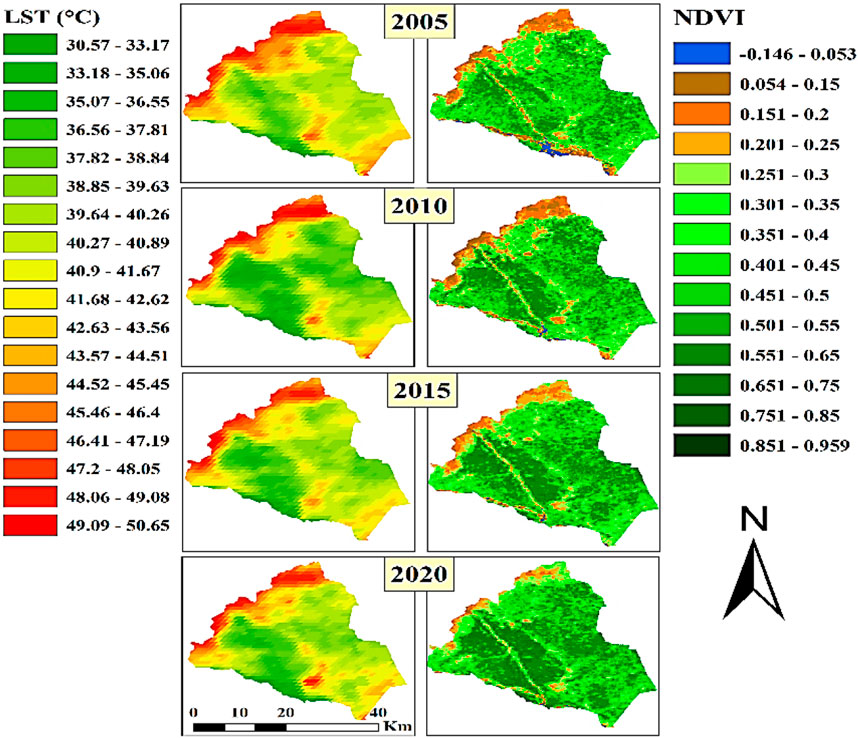
FIGURE 8. Spatial distribution of differences in vegetation cover and LST for the month of June of 2005, 2010, 2015, and 2020.
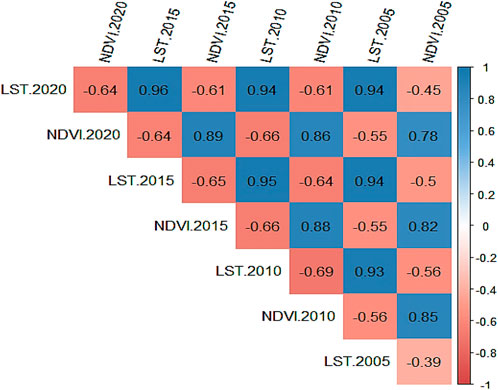
FIGURE 9. LST and NDVI cross correlations (correlation matrix) for the Junes of 2005, 2010, 2015, and 2020 with Pearson correlation coefficients at a 0.01 confidence interval.
The figure shows that during the month of June in the years under study (2005, 2010, 2015, and 2020), there is a complete negative association between LST and NDVI. The findings suggest that vegetation would be negatively impacted by CC and the associated rise in temperature, which might cause ecological disruption (Bai et al., 2013). In regions with higher temperatures and little vegetation, the spatial connection of LST and NDVI reflects the same scenario (Figure 8). The warmer climate grids appear to contain less vegetation. However, as the illustration for June 2020 shows, there is an anomaly: the vegetation is not affected just by temperature. Even in particular grids with higher temperatures, the NDVI is still noticeable, which might be explained by additional meteorological factors such as relative humidity and precipitation, etc. Figure 9 depicts correlation matrix among LSTs and NDVIs of the said Junes illustrating that they have negative correlation coefficients (red boxes).
The study area witnessed several weather extremes in which floods were on the top of the list. As Table 2 reveals the highly significant increasing trends of annual average precipitation as well as summer (monsoon) season precipitation, the probability of floods in future is high which is aggravated by the presence of two heavy water bodies viz. Kabul and Swat rivers. This section maps the floods of 2005 and 2010 to illustrate the impact of the climate crisis in the region.
Figure 10A illustrates the 2005 flood which occurred in the late June of the year. The flood intensity was high at south-western boundary especially at the junction point of the two rivers viz. Kabul and Swat rivers. The figure shows the pre-flood map of May with normal flow of the waters in the rivers and post-flood maps of July having flood inundated areas with August map of heavy vegetation.
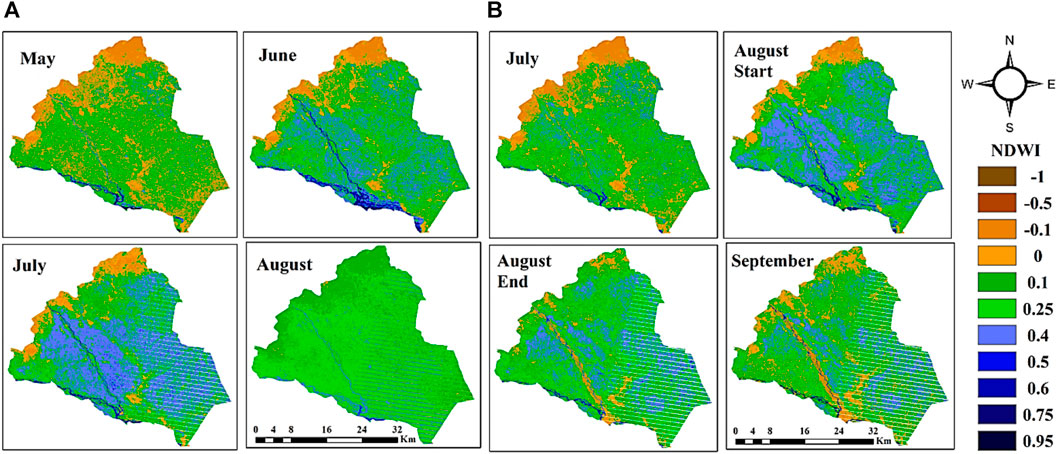
FIGURE 10. NDWI depicting pre and post-flood maps of the floods of 2005 (A) and 2010 (B).
The August 2010 flood was the most devastating flood in the history of the region wreaking havoc to the masses. Figure 10B depicts the pre-flood map of July with normal water bodies and post-flood maps of August start and end with September of the year. The flood happened in the first week of August inundating most of the district causing huge losses in terms of economy and human lives.
Water channels represented by dendritic network or river network serve as primary pathway in transporting sediment, water and other environmental fluxes (Shahid et al., 2021; Shah et al., 2022b). These networks add in floods like fluxes especially in changing climate due to human intervention. Figure 11 depicts these dendritic water pathways highlighting the flood risky areas. The southern corner of the district viz. Sardaryab, Sukkar, Charsadda city, Nissata (See Figure 1 to pinpoint the localities) is of lowest elevation (red) with proximity to the rivers junction exhibit highest flood risk.
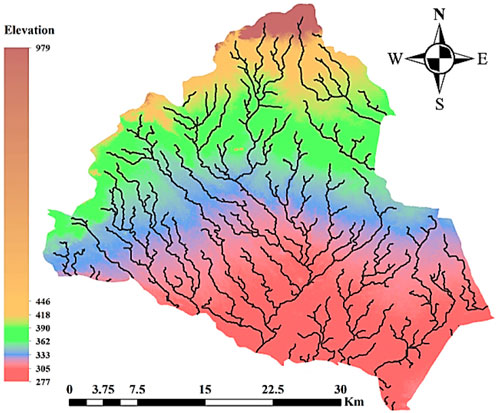
FIGURE 11. Water Channels showing dendritic network depicting flood risk.
The climate is the primary determinant of an area’s vegetation (Greve et al., 2011). In retreat, vegetation cover changes have the potential to affect climate to change. Due to human involvement in the local ecosystem, vegetation has suffered. Environmental stressors and weather extremes are becoming worse due to CC. The district of Charsadda is witnessing the phenomenon of CC, according to Table 2 trends for climate parameter variation and various research on the region (Khan et al., 2014b; 2021; Iqbal and Ali, 2022). The temperature, which has apparently scaled considerably, is the climate factor having the highest potential to induce CC (Table 2), according to the current study besides Ullah et al., 2019; Iqbal and Ali 2022. Other variables that change over time and space, in addition to temperature, also have an impact on climate and, consequently, vegetation. The study found that after temperature, precipitation is the next to highly influence the plant cover, along with relative humidity (He, 2014; Mo et al., 2019). The research infers that because temperature mediates how solar radiation affects vegetation, it is dangerous when it is at its strongest (Panferov et al., 2001). The study further explored the impact of temperature on vegetation by revealing a spatial grid-wise link between NDVI and LST, which suggests that grids with high temperatures are devoid of or very sparse vegetation (Figure 3).
A global problem, CC affects many elements of human life (Kabiri et al., 2015; Gul, 2019). The vegetation in the Charsadda region saw a major impact from CC (Khan et al., 2019), according to the current study as well. Additionally, Figures 7–9 show that LST has had a negative impact on the NDVI (Sun and Kafatos, 2007; Boqer and Science, 2009). Parts of the previously vegetated terrain are being transformed into urban areas as a result of the fast suburbanization happening in the study area (Malik and Ali, 2015; Ali K. et al., 2019). This growing urbanization, along with other factors, may significantly contribute to local climate variability, aggravating large-scale CC, as has been observed in other nations (Raza and Ijaz, 2009; Yang et al., 2013; Kabiri et al., 2015). As a result, the research area may see an increase in extreme weather occurrences in the future if mitigating measures are not put in place (Rahman et al., 2018; Ali S. et al., 2019).
CC induced weather extremes such as heatwaves, heavy rains, hailstones, storms, droughts, strong winds are happening in the study area are increasing in frequency as reported from areas in close proximity (Shah et al., 2022a). Floods are common due to highly significant positive trends of annual as well as summer (monsoon) precipitation (Table 2). Floods of 2005 (Figure 10A) and 2010 (Figure 10B) mapped reveal the harsh impact of climate crisis on the region. Future floods are more likely to occur due to rapid changing climate and presence of significant water bodies, i.e., Kabul and Swat rivers.
Understanding the consequences of CC and the mechanisms pivotal to cause CC are critical for developing climate-resilient adaptations and mitigation strategies. The present work’s purpose is to encourage more research in the area and to assist stakeholders in developing climate-resilient plans to deal with the consequences of CC on the research region. The study’s findings also emphasize the importance of taking immediate action to decrease CC’s negative effects on the region’s ecosystems and human culture. As a result, policymakers and stakeholders must place a high priority on developing and implementing effective solutions to the issues caused by CC. The current study is aimed at understanding the contribution of local climate variability to large-scale or global CC and its impacts.
The current study found that CC and its induced weather extremes in the form of high temperatures and floods have negative impact on vegetation cover and hydrology of the district Charsadda. Following are the point-wise main conclusions of the study as per its objectives.
1. Climate variables trend analysis via modified Mann-Kendall test and Sen’s slope statistics revealed significant trends. There are highly significant (p < 0.05) positive (increasing) trends for maximum temperature annually (MK-Z value = 2.96, Sen’s slope = 0.109) as well as for summer season (MK-Z value = 5.26, Sen’s slope = 0.028) and precipitation both annually (MK-Z value = 6.05, Sen’s slope = 0.007) as well as for summer season (MK-Z value = 4.98, Sen’s slope = 0.336). Relative humidity in consequence to increased precipitation also showed highly significant (p < 0.05) positive (increasing) trend (MK-Z value = 6.65, Sen’s slope = 0.082).
2. Confirming climate change in the study area, the regression analysis exposed significant (R2 = 0.835) impact of the climate factors on NDVI. NDVI varied both temporally and spatially under the influence of changed climate with overall improvement.
3. LST is the most heinous climate parameter influencing NDVI negatively.
4. Heavy intense irregular rainfalls caused severe pluvial and fluvial floods in 2005 and 2010 leading to disastrous conditions affecting both natural ecosystems including vegetation and human lives.
5. Flood risk assessment via watershed channels revealed more than 50% of area to be at risk in future.
6. Local government and stakeholders are urged to take mitigation measures and devise policy to check the human-induced climate change.
In brief, CC worsens weather, influencing the local vegetation and land uses causing enormous economic and human losses. In light of their contribution to global CC, regional as well as longitudinal climate research such as this one are essential. Beyond Charsadda, the KP area is experiencing CC and its effects, making research of this nature necessary. The study’s conclusions will be useful in making decisions on measures for regional sustainability, CC mitigation, and vegetation restoration.
The raw data supporting the conclusion of this article will be made available by the authors, without undue reservation.
IS: Methodology, Writing–original draft. HK: Methodology, Writing–original draft. ZM: Conceptualization, Writing–original draft. RU: Data curation, Writing–original draft. SI: Formal Analysis, Writing–original draft. H-AN: Investigation, Writing–original draft. MB: Writing–original draft, Writing–review and editing. AS: Supervision, Reviewing draft and Funding acquisition.
The author(s) declare that financial support was received for the research, authorship, and/or publication of this article. This work is financially supported by the Researchers Supporting Project number (RSP-2024R437), King Saud University, Riyadh, Saudi Arabia.
Weather information was provided by the Pakistan Meteorological Department’s Regional Meteorological Centre in Peshawar, Pakistan. This article is summary of a section of the first author’s (IS) doctoral dissertation, which was uploaded via the University of Peshawar, Pakistan, to the Higher Education Commission, Pakistan’s online repository for copyright and anti-plagiarism certificate purposes. The authors would like to extend their sincere appreciation to the Researchers Supporting Project, King Saud University, Riyadh, Saudi Arabia for funding this work through the project number (RSP-2024R437).
The authors declare that the research was conducted in the absence of any commercial or financial relationships that could be construed as a potential conflict of interest.
All claims expressed in this article are solely those of the authors and do not necessarily represent those of their affiliated organizations, or those of the publisher, the editors and the reviewers. Any product that may be evaluated in this article, or claim that may be made by its manufacturer, is not guaranteed or endorsed by the publisher.
Alashan, S. (2020). Combination of modified Mann-Kendall method and Şen innovative trend analysis. Eng. Rep. 2 (3), 1–13. doi:10.1002/eng2.12131
Ali, K., Akhtar, N., Shuaib, M., Ali, S., Ghaffar, A., Shah, M., et al. (2019a). Impact of urbanization on vegetation:a Survey of peshawar, Pakistan. Pol. J. Environ. Stud. 28 (4), 2523–2530. doi:10.15244/pjoes/89609
Ali, S., Eum, H. Il, Cho, J., Dan, L., Khan, F., Dairaku, K., et al. (2019b). Assessment of climate extremes in future projections downscaled by multiple statistical downscaling methods over Pakistan. Atmos. Res. 222, 114–133. doi:10.1016/j.atmosres.2019.02.009
Anderson, M. C., Norman, J. M., Meyers, T. P., and Diak, G. R. (2000). An analytical model for estimating canopy transpiration and carbon assimilation fluxes based on canopy light-use efficiency. Agric. For. Meteorology 101 (4), 265–289. doi:10.1016/s0168-1923(99)00170-7
Atif, I., Mahboob, M. A., and Waheed, A. (2015). Spatio-temporal mapping and multi-sector damage assessment of 2014 flood in Pakistan using remote sensing and GIS. Indian J. Sci. Technol. 8, 1–18. doi:10.17485/ijst/2015/v8i35/76780
Atta-ur-Rahman, , and Khan, A. N. (2013). Analysis of 2010-flood causes, nature and magnitude in the khyber pakhtunkhwa, Pakistan. Natural hazards. Springer 66 (2), 887–904. doi:10.1007/s11069-012-0528-3
Bai, J. J., Bai, J. T., and Wang, L. (2013). Spatio-temporal change of vegetation NDVI and its relations with regional climate in Northern Shaanxi Province since implementation of returning farmland to forests project. 2nd Int. Conf. Agro-Geoinformatics Inf. Sustain. Agric. Agro-Geoinformatics 34, 423–428. doi:10.1109/Argo-Geoinformatics.2013.6621956
Bertin, R. I. (2008). Plant phenology and distribution in relation to recent climate change. Journal of the Torrey Botanical Society. BioOne 135 (1), 126–146. doi:10.3159/07-RP-035R.1
Boqer, S., and Science, O. (2009). Use of NDVI and land surface temperature for drought assessment: merits and limitations, 618–633. doi:10.1175/2009JCLI2900.1
Camara, G., Souza, R., Pedrosa, B., Vinhas, L., Monteiro, A. M. V., Paiva, J., et al. (2000). TerraLib: Technology in support of GIS innovation. Geo. Info, 1–8.
Crowley, T. J. (2000). Causes of climate change over the past 1000 years. Sci. Am. Assoc. Adv. Sci. 289 (5477), 270–277. doi:10.1126/science.289.5477.270
Dale, V. H. (1997). The relationship between land-use change and climate change. Ecol. Appl. 7 (3), 753–769. doi:10.1890/1051-0761(1997)007[0753:trbluc]2.0.co;2
Devi, S. (2022). Pakistan floods: impact on food security and health systems. Lancet 400 (10355), 799–800. doi:10.1016/s0140-6736(22)01732-9
Eckstein, D., Künzel, V., and Schäfer, L. (2021). Global climate risk index 2021: who suffers most extreme weather events? Weather-related loss events in 2019 and 2000-2019. in Germanwatch nord-süd initiative eV.
Eckstein, D., Künzel, V., Schäfer, L., and Winges, M. (2019). Global climate risk index 2020. Bonn: Germanwatch.
EM- DAT (2022). DAT: the international disasters database. EM. Available at: https://public.emdat.be/data (Accessed February 21, 2022).
Fida, M., Hussain, I., Rashid, A., Amir Ali Shah, S., and Khan, S. (2021). Change detection in land use and land cover of District Charsadda Pakistan along River Kabul (2010 flood): taking advantage of geographic information system and remote sensing. Geol. Behav. 5, 40–46. doi:10.26480/gbr.02.2021.40.46
Fida, M., Hussain, I., Tao, W., Rashid, A., and Ali Shah, S. A. (2020). “Land use and land cover change analysis of District Charsadda, Pakistan along Kabul River in 2010 flood: using an advance geographic information system and remote sensing techniques,” in Natural hazards and earth system sciences discussions (Copernicus GmbH), 1–16.
Ganaie, H. A., Hashia, H., and Kalota, D. (2013). Delineation of flood prone area using normalized difference water index (NDWI) and transect method: a case study of kashmir valley. Int. J. Remote Sens. Appl. 3, 53–58.
Gao, J., Jiao, K., and Wu, S. (2019). Investigating the spatially heterogeneous relationships between climate factors and NDVI in China during 1982 to 2013. J. Geogr. Sci. 29 (10), 1597–1609. doi:10.1007/s11442-019-1682-2
Ghent, D., Veal, K., Trent, T., Dodd, E., Sembhi, H., and Remedios, J. (2019). A new approach to defining uncertainties for MODIS land surface temperature. Remote Sens. MDPI 11 (9), 1021. doi:10.3390/rs11091021
Greve, M., Lykke, A. M., Blach-Overgaard, A., and Svenning, J.-C. (2011). Environmental and anthropogenic determinants of vegetation distribution across Africa. Glob. Ecol. Biogeogr. 20 (5), 661–674. doi:10.1111/j.1466-8238.2011.00666.x
Gritti, E. S., Smith, B., and Sykes, M. T. (2006). Vulnerability of Mediterranean Basin ecosystems to climate change and invasion by exotic plant species. J. Biogeogr. 33 (1), 145–157. doi:10.1111/j.1365-2699.2005.01377.x
Gul, F. (2019). Assessing the socio-economic impact of climate change on wheat production in Khyber Pakhtunkhwa. Pakistan: GoP.
Halder, B., Bandyopadhyay, J., and Banik, P. (2021). Evaluation of the climate change impact on urban heat island based on land surface temperature and geospatial indicators. Int. J. Environ. Res. 15 (5), 819–835. doi:10.1007/s41742-021-00356-8
He, Y. (2014). The effect of precipitation on vegetation cover over three landscape units in a protected semi-arid grassland: temporal dynamics and suitable climatic index. J. Arid Environ. 109, 74–82. doi:10.1016/j.jaridenv.2014.05.022
Holben, B. N. (1986). Characteristics of maximum-value composite images from temporal AVHRR data. Int. J. remote Sens. 7 (11), 1417–1434. doi:10.1080/01431168608948945
Hu, L., and Brunsell, N. A. (2015). A new perspective to assess the urban heat island through remotely sensed atmospheric profiles. Remote Sens. Environ. 158, 393–406. doi:10.1016/j.rse.2014.10.022
Hulley, G. C., Ghent, D., Göttsche, F. M., Guillevic, P. C., Mildrexler, D. J., and Coll, C. (2019). “Land surface temperature,” in Taking the temperature of the earth: steps towards integrated understanding of variability and change. Editors G. C. Hulley, and E. Ghent (Elsevier), 57–127.
Hussain, A., Cao, J., Ali, S., Muhammad, S., Ullah, W., Hussain, I., et al. (2022a). Observed trends and variability of seasonal and annual precipitation in Pakistan during 1960–2016. Int. J. Climatol. 42 (16), 8313–8332. doi:10.1002/joc.7709
Hussain, A., Cao, J., Ali, S., Ullah, W., Muhammad, S., Hussain, I., et al. (2022b). Variability in runoff and responses to land and oceanic parameters in the source region of the Indus River. Ecol. Indic., 140, 109014. doi:10.1016/j.ecolind.2022.109014
Hussain, S., Lu, L., Mubeen, M., Nasim, W., Karuppannan, S., Fahad, S., et al. (2022c). Spatiotemporal variation in land use land cover in the response to local climate change using multispectral remote sensing data. Land. MDPI 11 (5), 595. doi:10.3390/land11050595
Hussain, S., Raza, A., Abdo, H. G., Mubeen, M., Tariq, A., Nasim, W., et al. (2023). Relation of land surface temperature with different vegetation indices using multi-temporal remote sensing data in Sahiwal region, Pakistan. Geosci. Lett. 10 (1), 33. doi:10.1186/s40562-023-00287-6
Iqbal, B., and Ali, M. (2022). Estimation of spatio-temporal air temperature from satellite based LST under semi-arid to arid environment in Peshawar Basin, Northwest Pakistan. Advances in Space Research. COSPAR 70 (4), 961–975. doi:10.1016/j.asr.2022.05.052
Jiang, W., Yuan, L., Wang, W., Cao, R., Zhang, Y., and Shen, W. (2015). Spatio-temporal analysis of vegetation variation in the yellow river basin. Ecol. Indic. 51, 117–126. doi:10.1016/j.ecolind.2014.07.031
Kabiri, R., Bai, V. R., and Chan, A. (2015). Assessment of hydrologic impacts of climate change on the runoff trend in Klang Watershed. Malaysia, 27–37. doi:10.1007/s12665-014-3392-5
Kamal, A., Ali, A., Yingjie, M., and Ali, A. (2018). Significance of billion tree tsunami afforestation project and legal developments in forest sector of Pakistan. Int. J. Law Soc. 1, 157–165. doi:10.11648/j.ijls.20180104.13
Khalifeh Soltanian, F., Abbasi, M., and Riyahi Bakhtyari, H. R. (2019). Flood monitoring using ndwi and mndwi spectral indices: a case study of aghqala flood-2019, Golestan Province, Iran. Int. Archives Photogrammetry, Remote Sens. Spatial Inf. Sci. - ISPRS Archives 42 (4/W18), 605–607. doi:10.5194/isprs-archives-XLII-4-W18-605-2019
Khan, H., Marwat, K. B., Hassan, G., Khan, M. A., and Hashim, S. (2014a). Distribution of parthenium weed in Peshawar Valley, khyber pakhtunkhwa-Pakistan. Pak. J. Bot. 46 (1), 81–90.
Khan, H., Marwat, K. B., Hassan, G., Khan, M. A., and Hashim, S. (2014b). Distribution of parthenium weed in Peshawar valley, Khyber pakhtunkhwa- Pakistan. Pak. J. Bot. 46 (1), 81–90.
Khan, I., Javed, T., Khan, A., Lei, H., Muhammad, I., Ali, I., et al. (2019). Impact assessment of land use change on surface temperature and agricultural productivity in Peshawar-Pakistan. Environmental Science and Pollution Research. Environ. Sci. Pollut. Res. 26 (32), 33076–33085. doi:10.1007/s11356-019-06448-5
Khan, T., Nouri, H., Booij, M. J., Hoekstra, A. Y., and Khan, H. (2021). Water footprint, blue water scarcity, and economic water, 1–17.
Malik, R., and Ali, M. (2015). The impact of urbanization on agriculture sector: a case study of peshawar, 8, 79–86.
Maroni, D., Cardoso, G. T., Neckel, A., Maculan, L. S., Oliveira, M. L. S., Bodah, E. T., et al. (2021). Land surface temperature and vegetation index as a proxy to microclimate. J. Environ. Chem. Eng., 9(4): 105796. doi:10.1016/j.jece.2021.105796
Memon, A. A., Muhammad, S., Rahman, S., and Haq, M. (2015). Flood monitoring and damage assessment using water indices: a case study of Pakistan flood-2012. Egypt. J. Remote Sens. Space Sci. 18 (1), 99–106. doi:10.1016/j.ejrs.2015.03.003
Mildrexler, D. J., Zhao, M., Cohen, W. B., Running, S. W., Song, X. P., and Jones, M. O. (2018). Thermal anomalies detect critical global land surface changes. J. Appl. Meteorology Climatol. 57 (2), 391–411. doi:10.1175/jamc-d-17-0093.1
Minh, D. D., Oo, A. T., and Sovanndara, K. (2023). Farm households’ vulnerability to climate change in Cambodia, Myanmar, and Vietnam: an advanced livelihood vulnerability indexing approach. Asian J. Agric. Rural Dev. 13 (1), 75–90. doi:10.55493/5005.v13i1.4768
Mo, K., Chen, Q., Chen, C., Zhang, J., Wang, L., and Bao, Z. (2019). Spatiotemporal variation of correlation between vegetation cover and precipitation in an arid mountain-oasis river basin in northwest China. J. Hydrology 574 (4), 138–147. doi:10.1016/j.jhydrol.2019.04.044
Mustapha, A. (2013). Detecting surface water quality trends using Mann-Kendall tests and Sen’s Slope estimates. Int. J. Adv. Innovative Res. 2 (1), 108–114.
Panferov, O., Knyazikhin, Y., Myneni, R. B., Szarzynski, J., Engwald, S., Schnitzler, K. G., et al. (2001). The role of canopy structure in the spectral variation of transmission and absorption of solar radiation in vegetation canopies. Veg. Canopies 39 (2), 241–253. doi:10.1109/36.905232
Rahman, M. H. ur, Ahmad, A., Wang, X., Wajid, A., Nasim, W., Hussain, M., et al. (2018). Multi-model projections of future climate and climate change impacts uncertainty assessment for cotton production in Pakistan. Agric. For. Meteorology 253 (1), 94–113. doi:10.1016/j.agrformet.2018.02.008
Raza, A., and Ijaz, B. Z. (2009). On rising temperature trends of Karachi in Pakistan, 539–547. doi:10.1007/s10584-009-9598-y
Scheffer, M., Holmgren, M., Brovkin, V., and Claussen, M. (2005). Synergy between small-and large-scale feedbacks of vegetation on the water cycle. Glob. change Biol. 11 (7), 1003–1012. doi:10.1111/j.1365-2486.2005.00962.x
Shah, I. A., Khan, H., Gul, B., and Uslu, O. S. (2022a). Farmers’ perception of climate change and parthenium weed distribution in district swabi, khyber pakhtunkhwa. Pak. J. Weed Sci. Res. 28 (3), 167–178. doi:10.28941/pjwsr.v28i3.887
Shah, I. A., Muhammad, Z., and Khan, H. (2022b). Impact of climate change on spatiotemporal variations in the vegetation cover and hydrology of district Nowshera. J. Water Clim. Change 13 (11), 3867–3882. doi:10.2166/wcc.2022.229
Shah, I. A., Muhammad, Z., Khan, H., Ullah, R., and Rahman, A. ur (2023). Spatiotemporal variation in the vegetation cover of Peshawar Basin in response to climate change. Environ. Monit. Assess. 195, 1474. doi:10.1007/s10661-023-12094-9
Shahid, M., Cong, Z., and Zhang, D. (2018). Understanding the impacts of climate change and human activities on streamflow: a case study of the Soan River basin, Pakistan. Theor. Appl. Climatol. 134 (1), 205–219. doi:10.1007/s00704-017-2269-4
Shahid, M., Rahman, K. U., Haider, S., Gabriel, H. F., Khan, A. J., Pham, Q. B., et al. (2021). Quantitative assessment of regional land use and climate change impact on runoff across Gilgit watershed. Environ. Earth Sci. 80 (22), 743. doi:10.1007/s12665-021-10032-x
Singh, S., and Kansal, M. L. (2022). Chamoli flash-flood mapping and evaluation with a supervised classifier and NDWI thresholding using Sentinel-2 optical data in Google earth engine. Earth Sci. Inf. 15 (2), 1073–1086. doi:10.1007/s12145-022-00786-8
Sitch, S., Smith, B., Prentice, I. C., Arneth, A., Bondeau, A., Cramer, W., et al. (2003). Evaluation of ecosystem dynamics, plant geography and terrestrial carbon cycling in the LPJ dynamic global vegetation model. Glob. change Biol. 9 (2), 161–185. doi:10.1046/j.1365-2486.2003.00569.x
Sodiq, A., Abdullatif, Y., Aissa, B., Ostovar, A., Nassar, N., El-Naas, M., et al. (2023). A review on progress made in direct air capture of CO2. Environ. Technol. Innovation, 29. 102991. doi:10.1016/j.eti.2022.102991
Solheim, I., Solbo, S., Indregard, M., and Lauknes, I. (2001). User requirements and SAR-solutions for flood mapping. in 4th international symposium on retrieval of bio-and geophysical parameters from SAR data for land applications. Austria: Innsbruck.
Sun, D., and Kafatos, M. (2007). Note on the NDVI-LST relationship and the use of temperature-related drought indices over North America. Geophys. Res. Lett. 34 (9), 1–4. doi:10.1029/2007GL031485
Sun, J., and Qin, X. (2016). Precipitation and temperature regulate the seasonal changes of NDVI across the Tibetan Plateau. Environ. Earth Sci. 75 (4), 291–299. doi:10.1007/s12665-015-5177-x
Towoju, O. A., and Petinrin, M. O. (2023). Climate change mitigation with carbon capture: an overview. Int. J. Sustain. Energy Environ. Res. 12 (1), 1–9. doi:10.18488/13.v12i1.3327
Tucker, C. J. (1979). Red and photographic infrared linear combinations for monitoring vegetation. Remote Sens. Environ. 8 (2), 127–150. doi:10.1016/0034-4257(79)90013-0
Ullah, W., Nafees, M., Khurshid, M., and Nihei, T. (2019). Assessing farmers’ perspectives on climate change for effective farm-level adaptation measures in Khyber Pakhtunkhwa, Pakistan. Environ. Monit. Assess. 191. doi:10.1007/s10661-019-7651-5
Van Huong, N., Minh Nguyet, B. T., Van Hung, H., Minh Duc, H., Van Chuong, N., Do Tri, M., et al. (2022). Economic impact of climate change on agriculture: a case of vietnam. AgBioForum 24 (1), 1–12. doi:10.1007/978-3-030-57281-5_34
Van Vuuren, D. P., Meinshausen, M., Plattner, G.-K., Joos, F., Strassmann, K. M., Smith, S. J., et al. (2008). Temperature increase of 21st century mitigation scenarios. Proc. Natl. Acad. Sci. 105 (40), 15258–15262. doi:10.1073/pnas.0711129105
Wan, Z., and Dozier, J. (1996). A generalized split-window algorithm for retrieving land-surface temperature from space. IEEE Trans. Geosci. Remote Sens. 34, 892–905. doi:10.1109/36.508406
Wang, J., Price, K. P., and Rich, P. M. (2001). Spatial patterns of NDVI in response to precipitation and temperature in the central Great Plains. Int. J. Remote Sens. 22 (18), 3827–3844. doi:10.1080/01431160010007033
Wang, X., Yau, M. K., Nagarajan, B., and Fillion, L. (2010). The impact of assimilating radar-estimated rain rates on simulation of precipitation in the 17--18 July 1996 Chicago floods. Adv. Atmos. Sci. 27 (2), 195–210. doi:10.1007/s00376-009-8212-6
Wen, X. J., Liu, Y. X., and Yang, X. J. (2015). A resilience-based analysis on the spatial heterogeneity of vegetation restoration and its affecting factors in the construction of eco-cities: a case study of Shangluo, Shaanxi. Acta Ecol. Sin. 35 (13), 4377–4389. doi:10.5846/stxb201406101203
Whitman, R. T., Park, M. B., Ambrose, S. M., and Hoel, E. G. (2014). Spatial indexing and analytics on hadoop. Proc. 22nd ACM SIGSPATIAL Int. Conf. Adv. Geogr. Inf. Syst., 73–82. doi:10.1145/2666310.2666387
Xianfeng, L., Zhiyuan, R., and Zhihui, L. (2013). The spatial-temporal changes of vegetation coverage in the Three-River Headwater Region in recent 12 years. Acta Geogr. Sin. 68 (7), 897–908.
Yang, Y. E., Brown, C. M., Yu, W. H., and Savitsky, A. (2013). An introduction to the IBMR, a hydro-economic model for climate change impact assessment in Pakistan ’ s Indus River basin. Water Int. 38 (10), 632–650. doi:10.1080/02508060.2013.830691
Yu, J., Wu, J., and Sarwat, M. (2015). “Geospark: a cluster computing framework for processing large-scale spatial data,” in Proceedings of the 23rd SIGSPATIAL international conference on advances in geographic information systems, 1–4.
Keywords: climate change, LST, vegetation, NDVI, hydrology, NDWI, Charsadda
Citation: Shah IA, Khan H, Muhammad Z, Ullah R, Iqbal S, Nafidi H-A, Bourhia M and Salamatullah AM (2024) Evaluation of climate change impact on plants and hydrology. Front. Environ. Sci. 12:1328808. doi: 10.3389/fenvs.2024.1328808
Received: 30 October 2023; Accepted: 18 January 2024;
Published: 07 February 2024.
Edited by:
Aliihsan Sekertekin, Iğdır Üniversitesi, TürkiyeReviewed by:
Sajjad Hussain, COMSATS Institute of Information Technology, PakistanCopyright © 2024 Shah, Khan, Muhammad, Ullah, Iqbal, Nafidi, Bourhia and Salamatullah. This is an open-access article distributed under the terms of the Creative Commons Attribution License (CC BY). The use, distribution or reproduction in other forums is permitted, provided the original author(s) and the copyright owner(s) are credited and that the original publication in this journal is cited, in accordance with accepted academic practice. No use, distribution or reproduction is permitted which does not comply with these terms.
*Correspondence: Ishaq Ali Shah, ZHVycmFuaTE0MzZAdW9wLmVkdS5waw==; Mohammed Bourhia, bS5ib3VyaGlhQHVpei5hYy5tYQ==
Disclaimer: All claims expressed in this article are solely those of the authors and do not necessarily represent those of their affiliated organizations, or those of the publisher, the editors and the reviewers. Any product that may be evaluated in this article or claim that may be made by its manufacturer is not guaranteed or endorsed by the publisher.
Research integrity at Frontiers
Learn more about the work of our research integrity team to safeguard the quality of each article we publish.