 Zhanrong Zhu1
 Juncheng Yang
 Jianquan Ma
- 1Shaanxi 185 Coal Field Geology Co., Ltd., Yulin, China
- 2Henan Branch of China National Geological Exploration Center of Building Materials Industry, Xinyang, China
- 3College of Geology and Environment, Xi’an University of Science and Technology, Xi’an, China
The northern Shaanxi coal mining area is an important coal production base in China and an ecologically fragile area, and it is of great significance to explore the ecological environment quality and spatial evolution trend of the mining area. Based on Sentinel-2 and MODIS image data, an improved remote sensing ecological index was constructed by principal component analysis method: normalized difference vegetation index, normalized difference water index, normalized differential buildup and bare soil index, and net primary productivity. The ecological environment quality of the northern Shaanxi coal mining area and its influencing factors, as well as the spatial autocorrelation analysis of ecological environment quality, were discussed. The results showed that: 1) The vegetation coverage in the study area showed an overall increasing trend, but it was greatly affected by the average annual temperature. The NDVI index at the mine area is higher than the NDVI index at the non-mine area. 2) The water area gradually decreases with the year, which has a certain negative correlation with the total raw coal production. 3) The NDBB index showed a decreasing trend with the year, and compared with the non-mining area. 4) The coupling of year-by-year precipitation and temperature leads to interannual fluctuation of NPP value. 5) The change of ecological environment quality in the study area is the result of the comprehensive effect of natural factors and human factors. The implementation of ecological protection projects such as geological environmental protection and land reclamation in mining areas also has a certain impact on the trend of ecological environment quality. 6) There was a significant spatial autocorrelation in the quality of the ecological environment in the study area. There are significant “High-High” gathering areas of ecological environment quality within the coal mining area.
1 Introduction
The northern Shaanxi coal mining area is one of the important coal production bases in China, and it is also an ecologically fragile area (Li et al., 2015). Ecological and geological problems (Ma et al., 2016; Song et al., 2021) such as coal mining subsidence, water resource destruction, and land desertification induced by the exploitation of coal resources have become hot spots and focal issues of concern to the government, the public and scholars. Therefore, studying the ecological environment quality and its temporal and spatial evolution trend in mining areas is of great significance for the protection of geological environment and ecological environment restoration in mining areas.
At present, the use of satellite remote sensing technology to monitor and evaluate the quality of regional ecological environment has become one of the most effective means (Yang et al., 2018; Wu et al., 2022; Li et al., 2023). For example, visual interpretation of images, automatic classification of machine learning and other methods (Wang, 2022) are used to extract the information of ecological environment elements in mining areas and analyze the impact of mining activities on the ecological environment of mining areas. Secondly, based on multi-temporal remote sensing images, the changes of ecological environment quality in mining areas can be quantitatively analyzed through image classification and image change detection. Secondly, based on multi-temporal remote sensing images, the changes of ecological environment quality in mining areas can be quantitatively analyzed through image classification and image change detection (Han et al., 2021; Bai et al., 2022; Liu et al., 2022; Nie et al., 2022). As early as 2006, China’s Ministry of Ecology and Environment promulgated the Technical Specifications for the Assessment of Ecological Environment Status, which is used to evaluate the ecological environment status and change trend in counties, provinces and ecological regions (China MoEaEotPsRo, 2015). The specification also stipulates the index system for evaluating the status of the ecological environment and the calculation method of each index, but many problems have been found in the application process, such as the accessibility of indicators and parameter setting (Guo et al., 2019).
Among the many regional ecological environment remote sensing monitoring methods, the remote sensing ecological index (RSEI) method is used more frequently (Xu, 2013; Xu et al., 2018; Liao and Jiang, 2020; Cao et al., 2022; Wu et al., 2022). In particular, the selection and construction methods of remote sensing ecological index indicators are often of great concern. For example, indicators such as the normalized difference vegetation index (NDVI) and the enhanced vegetation index (EVI) (Li et al., 2017) are used to monitor vegetation cover. Indicators used to invert surface humidity and temperature, such as scaled drought condition index (SDCI) (Rhee et al., 2010), land surface temperature (LST) (Ren et al., 2016), etc. In terms of soil indicators, normalized differential buildup and bare soil index (NDBSI) (Jin et al., 2023), land use/cover type (Yoshioka et al., 2017), soil index (SI) (Lin et al., 2022), etc. are often used. In terms of other indicators, there are aerosol optical depth (AOD) (Yang et al., 2020), precipitation (Zhao et al., 2023), etc. For the determination of index weights, the principal component analysis method (Hong et al., 2020), analytic hierarchy process method (Gashaw et al., 2022), entropy method (Gao et al., 2014), and information method (Bopche and Rege, 2022) are recognized.The most commonly used methods for calculating the spatial autocorrelation between indicators are Moran’s I (Wang et al., 2023), Geary’s contiguity ratio (Krzyśko et al., 2023), Getis (Wang and Lam, 2020), etc. These existing indicator selection and calculation methods do provide a good research path. Moreover, much of the data that is also used is provided by non-commercial satellites. In the above-mentioned regional ecological environment remote sensing monitoring research, it is found that the methods used and the selected indicators for different regions and different research objects are not standardized and uniform. For example, in areas with high vegetation coverage, ecological environment assessment is carried out based on the selection of indicators of vegetation types. In agricultural planting areas, the evaluation is based on the selection of indicators of land use type. In the area of urban buildings, the evaluation is based on the selection of indicators around the area of buildings or bare land.
That is, it is necessary to select targeted methods and indicators according to the scale and characteristics of the research area. Therefore, according to the climatic characteristics, geomorphological characteristics, hydrological characteristics and human activity characteristics of the mining area in northern Shaanxi, this paper carried out remote sensing monitoring research on ecological environment quality. Based on Sentinel-2 and MODIS image data, the principal component analysis method was used to construct an improved remote sensing ecological index with four indicators: vegetation, water, bare ground and buildings, and net primary productivity of vegetation. The temporal and spatial evolution trend of ecological environment quality in mining areas and its influencing factors, as well as spatial autocorrelation, were discussed.
2 Materials and methods
2.1 Study site
The study area (Figure 1) is located in Yulin City, Shaanxi Province, China, with latitude and longitude ranging from 38.4°N to 38.8N°, 109.2°E-110.1°E. The northern natural environment and the northeast mining area of Yulin City were selected as the research objects, and the comparative study of the ecological environment of mining area and non-mining area was carried out. The study area is 43 km long from north to south, 72 km wide from east to west, and has an area of 3096 km2. The altitude is about 1073–1402 m, and the surface outcropping strata are mainly aeolian sand and loess. The study area belongs to the warm temperate-medium temperate semi-arid continental monsoon climate with an annual mean air temperature of 8°C. The average annual precipitation is about 400 mm, but it is unevenly distributed, mainly from July to September. The main human engineering activity is coal mining.
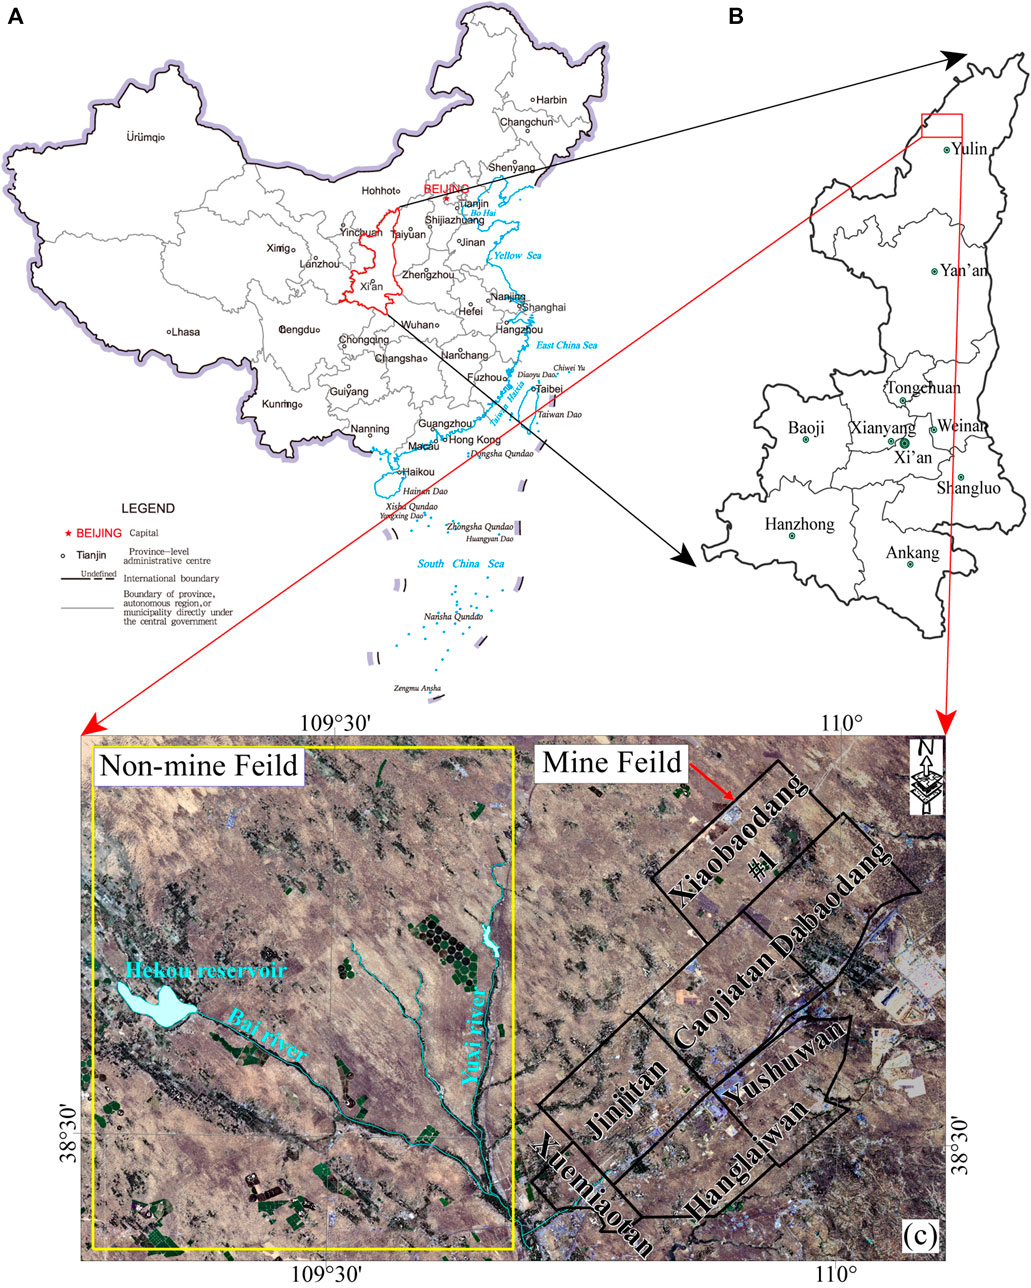
FIGURE 1. The location of the study area.
Six coal mines in the study area were selected as the research objects, as shown in Table 1.
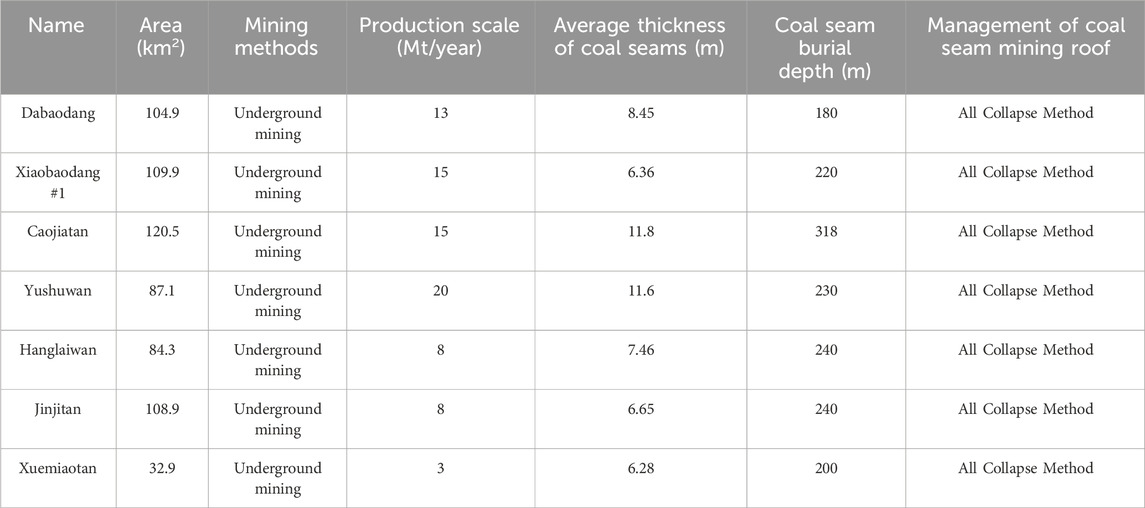
TABLE 1. List of the basic conditions of the six coal mines.
2.2 Data and pre-processing
The image data used are mainly Sentinel 2 image data and MODIS image data, covering the period from 2017 to 2022. Sentinel 2 imagery data is based on public data from the European Space Agency (https://scihub.copernicus.eu/dhus/#/home) and has 13 bands with spatial resolutions of 10 m, 20 m, and 60 m. The image period is from July to September each year, the cloud cover is less than 6%, and the study area is cloud-free. The study area involved 6 years of 12 scene image data. MODIS image data is derived from NASA (https://search.earthdata.nasa.gov/search) MOD17A3HGF V6 product NPP_500 m data and is annual data. The study area involved 6 images over 6 years. All data are geometrically fine-calibrated, radiometrically calibrated, and atmosphically calibrated. All data is resampled to 10 m resolution. The sources of data and the preprocessing methods are shown in Table 2.

TABLE 2. Main data source and pre-processing.
2.3 Methods
2.3.1 Determination of indicators of remote sensing ecological index
Referring to previous studies, there is no unified standard for determining the indicators of remote sensing ecological index, but it must be targeted to the research area (Jin et al., 2023). The study area in this paper is the mining area of northern Shaanxi, and its ecological environment has the following characteristics.
1) Climate characteristics: arid, low-rainfall.
2) Geomorphological features: the terrain is relatively flat, covered by bare ground such as aeolian sand.
3) Characteristics of human engineering activities: strong coal mining activities, high construction intensity of surface buildings.
4) Hydrological characteristics: uneven distribution of surface water systems.
5) Vegetation characteristics: low vegetation coverage, affected by mine ecological restoration.
In view of the above characteristics, an improved remote sensing ecological index with four indicators: normalized difference vegetation index, normalized difference water index, normalized differential buildup and bare soil index, and net primary productivity was constructed, which was used for the evaluation of ecological environment quality in mining areas in northern Shaanxi.
2.3.2 Calculation of indicators of remote sensing ecological index
(1) Vegetation indicators
The most common and widely used vegetation indicator is normalized difference vegetation index (NDVI). Because vegetation has strong reflection in the NIR band and strong absorption capacity in the RED band, it shows peaks and valleys of reflectivity in the spectrum, which are unique characteristics of vegetation from other features and strong separability. Therefore, NDVI is calculated from these two bands to extract vegetation features. The calculation formula is as follows:
In the formula, NIR and RED are the B8 band (near-infrared) and B4 band (red light) in the Sentinel 2 data, respectively, with a spatial resolution of 10 m.
(2) Water area indicators
The normalized difference water index (NDWI) is selected for water area indicators. The water reflectance curve decreases with the increase of wavelength, and NDWI can effectively extract water information by normalizing the GREEN and NIR bands. The calculation formula is as follows:
In the formula, GREEN is the B3 band (green light) in the Sentinel 2 data, with a spatial resolution of 10 m.
(3) Bare ground and building indicators
Combining the vegetation GREEN band and the reflectivity peak in the NIR band, a new normalized differential buildup and bare soil index (NDBBI) can be constructed. The calculation formula is as follows:
In the formula, SWIR is the B12 band (shortwave infrared) in the Sentinel 2 data, with an initial spatial resolution of 20 m and a resampling of 10 m.
(4) Indicators of net primary productivity of vegetation
Net Primary Production (NPP) is equal to the total amount of organic matter produced by photosynthesis of green vegetation in a certain period of time minus the green vegetation’s own maintenance respiratory consumption and self-growth consumption (Ruimy et al., 2012). It can not only characterize the productive capacity of vegetation communities under natural environmental conditions, but also estimate carbon sources and sinks in terrestrial ecosystems, and describe the carbon cycle and energy flow process (Field et al., 1998). Therefore, the accurate estimation of NPP has important theoretical and practical significance for ecological environment governance, carbon cycle research and rational development and utilization of natural resources (Fang et al., 2001).
The NNP estimate is derived from the MOD17A3HGF.v006 version data and involves a tiled image grid of h26v05, a spatial resolution of 500 m, and a temporal resolution of 1 year. After georeferencing and resampling, it reaches 10 m resolution. The NPP data unit is kgC/m2/year, the effective range is −30000–32700, and the scaling factor is 0.0001.
2.3.3 Improved remote sensing ecological index
The research method proposed in this paper is an improvement on the basis of the RSEI index proposed in the past (Xu, 2013). On the basis of the four indexes of NDVI, WET, NDBSI, and LST, combined with the ecological environment characteristics of the coal mining area in northern Shaanxi, the water index and NPP index were updated to calculate RSEI. First, all indicators are normalized and calculated as follows:
where Vi is the normalized value of an indicator; Vmax and Vmin correspond to the maximum and minimum values of the indicator, respectively.
Secondly, in order to avoid subjectivity and make the results comparable, the principal component analysis method is used to determine the weights of each indicator. The calculation process of the principal component method is as follows.
Calculate the covariance matrix for a standardized sample:
where R is the covariance matrix for a standardized sample; xik is the sample of individual indicators.
Calculate the eigenvalues and eigenvectors of R:
Calculate the eigenvalues contribution rate and the cumulative contribution rate:
Finally, the remote sensing ecological index is calculated according to the contribution rate or weight of each feature value (Eq. 10). The calculation process is shown in Figure 2.
where RSEI is the remote sensing ecological index; Ri is the contribution rate weight; PCi is a principal component feature vector; Xi is an indicator of the remote sensing ecological index; n is the number of indicators of remote sensing ecological index.
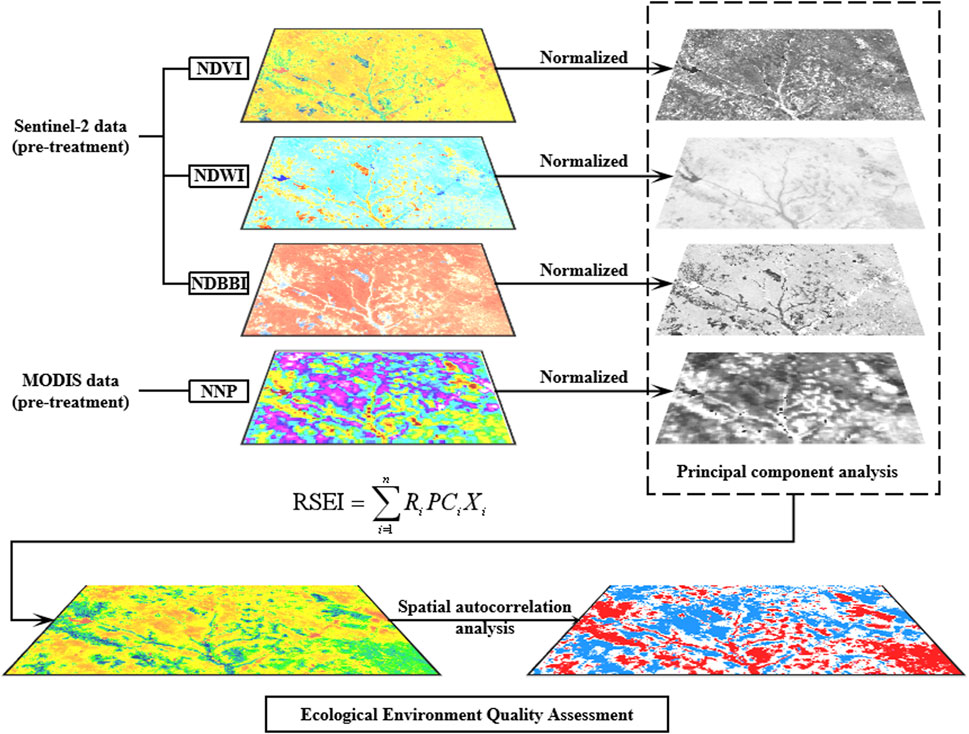
FIGURE 2. Calculation flowchart.
3 Results
3.1 Results of each indicator calculation
3.1.1 Normalized difference vegetation index indicator
Figure 3 shows a thematic map of the NDVI from 2017 to 2022 in the study area. The color in the figure ranges from dark green to dark red, and the more obvious the dark green, the higher the vegetation cover, and vice versa. From the color changes in the 6-year thematic map, it can be concluded that vegetation coverage was relatively high in 2018 (Figure 3B) and relatively low in 2022 (Figure 3F).
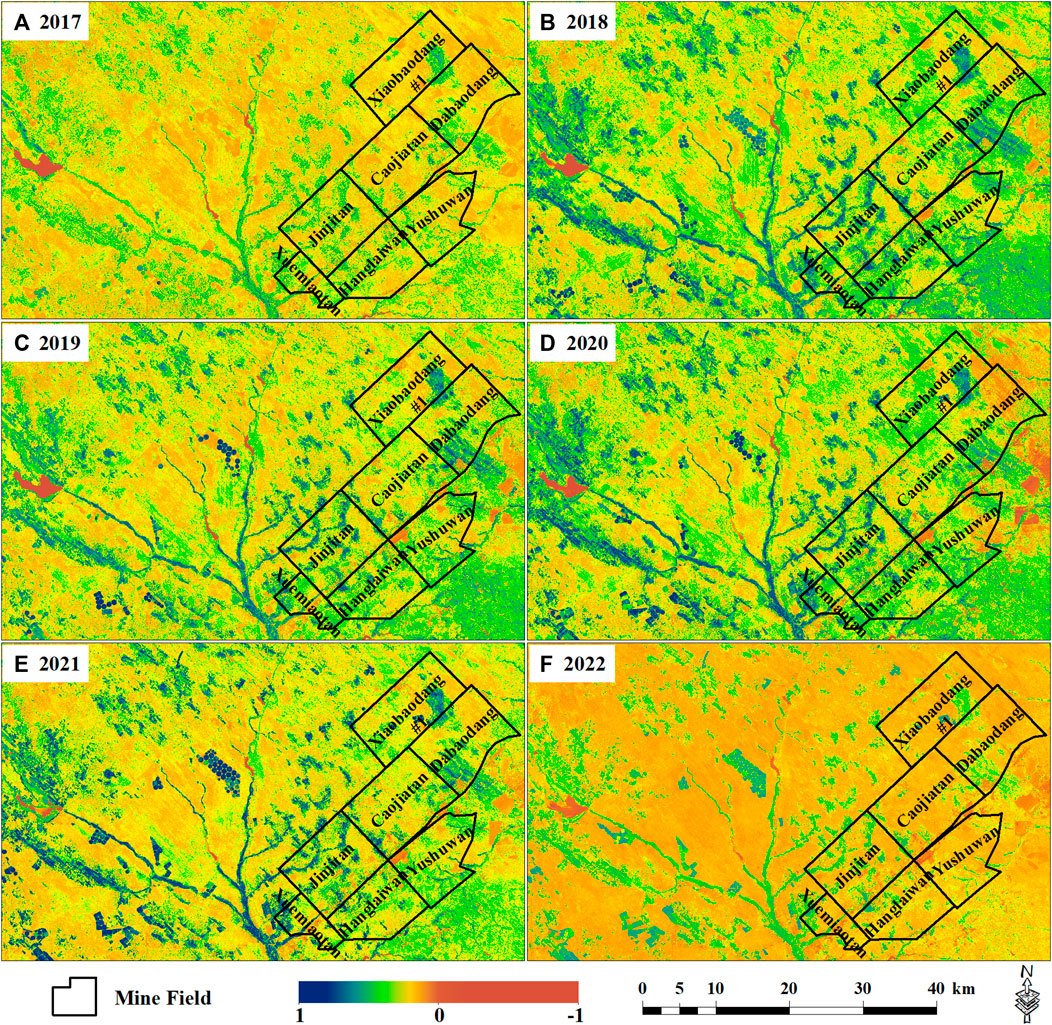
FIGURE 3. The thematic map of NDVI from 2017 to 2022 in the study area.
The mean value of NDVI indicators at the mining and non-mining areas was calculated (Figure 4). It shows that the NDVI indicator average fluctuates with years, with the highest in 2018 and 2020 and the lowest in 2022. Combined with the average annual precipitation and annual mean air temperature data in the study area, there was no correlation between the average NDVI and the average annual precipitation, but it had a certain correlation with the annual mean air temperature. This may be related to the fact that the study area is located in the desert edge area of northern Shaanxi, with large evaporation, uneven inter-monthly distribution of precipitation, and mainly short-term concentrated precipitation. Therefore, the precipitation has less effect on vegetation. The annual mean air temperature value can well reflect local extreme climate events. According to the 2022 climate bulletin released by the Yulin Meteorological Bureau, the temperature in the study area is high, and the precipitation is obviously more, but the distribution in time and space is uneven, and extreme weather and climate events are frequent. From March to June, regional and periodic meteorological drought was obvious, which had a certain impact on vegetation growth. In addition, the average value of NDVI found to be higher than that of non-mining areas, which may benefit from ecological restoration works in mining areas.
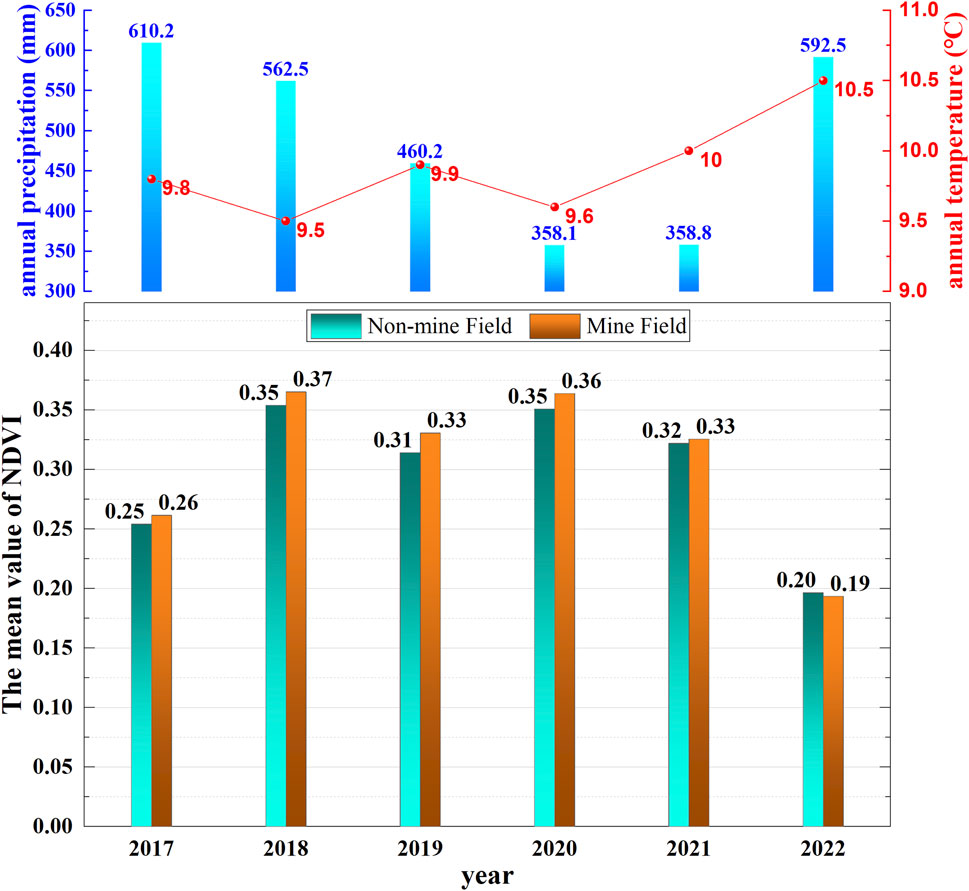
FIGURE 4. The mean value of NDVI at the mining and non-mining areas.
3.1.2 The normalized difference water index indicator
Figure 5 shows a thematic map of the NDWI from 2017 to 2022 in the study area. The color in the figure ranges from dark blue to deep red, and the more obvious the area of dark blue, the higher the water coverage, and vice versa. The changes in the water bodies in the figure are mainly concentrated near Hekou reservoirs and rivers, and obvious changes can also be seen within the mining area. However, this figure cannot reflect the changes in water bodies from the average value, and image segmentation is required for further discussion.
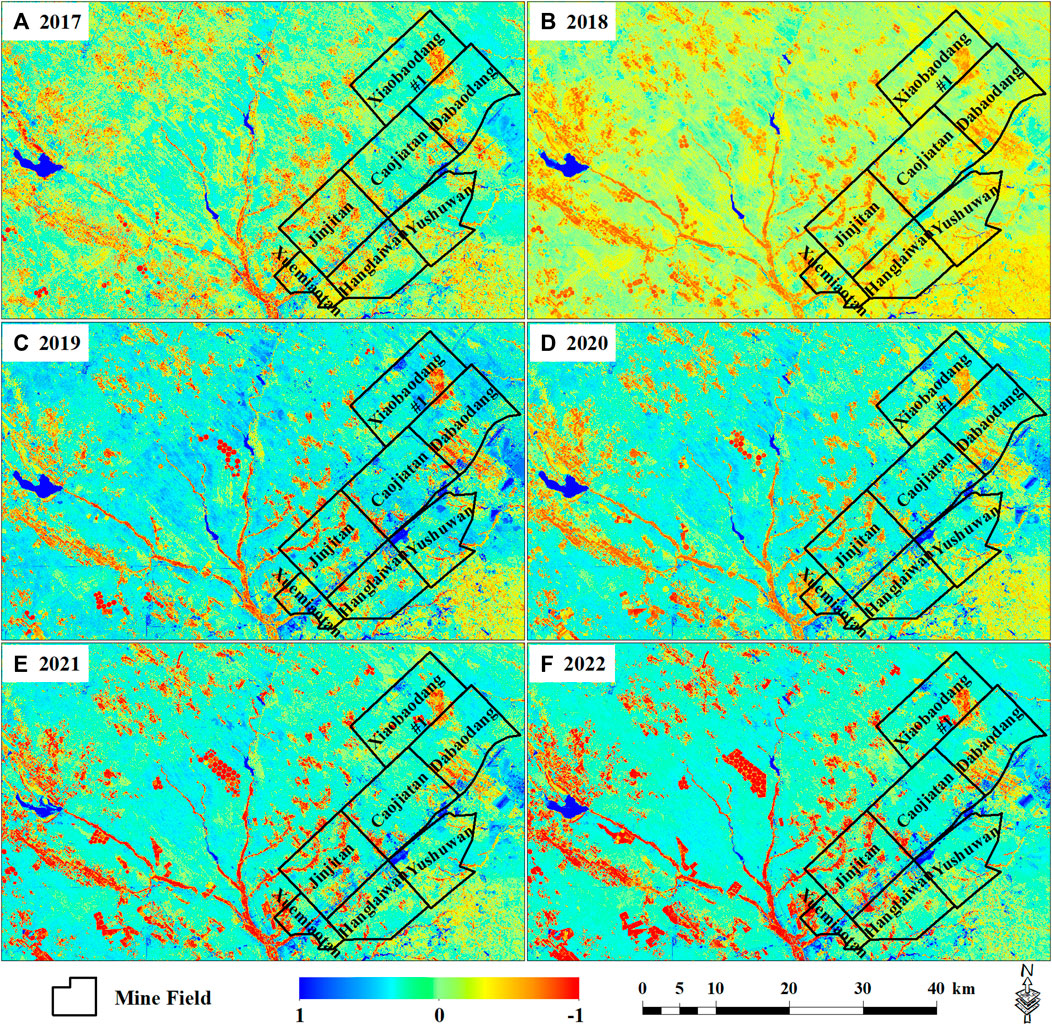
FIGURE 5. The thematic map of NDWI from 2017 to 2022 in the study area.
The thematic layer is a continuous data layer, and effective water data cannot be obtained directly, so image segmentation is required. By continuously adjusting the band segmentation threshold and comparing the visual interpretation results of water bodies on Google Maps, 0.125 was finally determined as the segmentation threshold for water extraction.
The area of water at the mining and non-mining area was extracted (Figure 6) and found that the area of the non-mining area decreased gradually with the year. This change law is consistent with the average change law of NDVI, and the increase of annual mean air temperature value has a certain impact on the regional water area. In addition, we collected the total raw coal production in the study area from 2017 to 2022, and found that there was a very good negative correlation between water body area and total raw coal production. Coal mining activities may have a certain impact on water bodies.
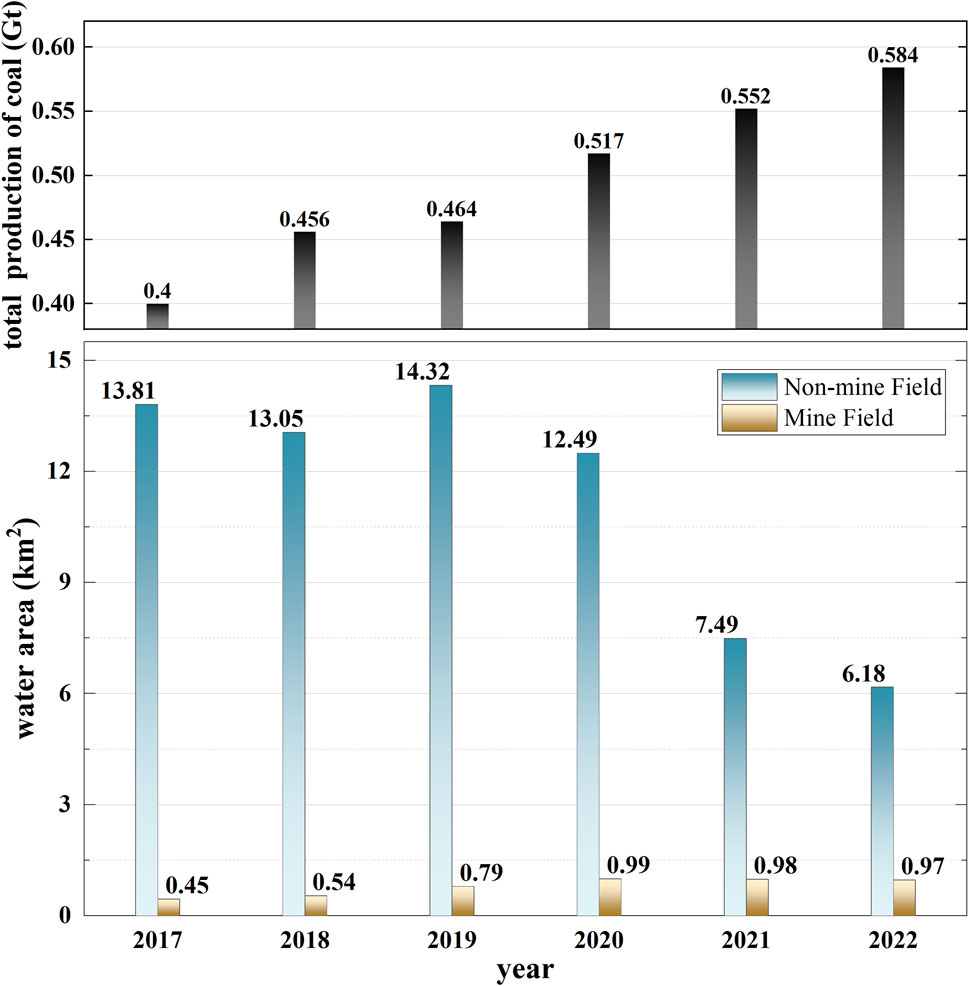
FIGURE 6. The mean value of NDWI at the mining and non-mining areas.
The water area within the non-mining area is relatively stable, only rising a little, which may be related to the increase in the production and living water requirements of the coal mining area.
3.1.3 Normalized differential buildup and bare soil index indicator
Figure 7 shows a thematic map of the NDBBI from 2017 to 2022 in the study area. The color in the figure ranges from dark green to yellowish brown, and the more obvious the brown, the higher the coverage of bare land and building land, and vice versa. Judging from the color changes in the 6-year thematic map, the coverage of bare land and building land is decreasing year by year.
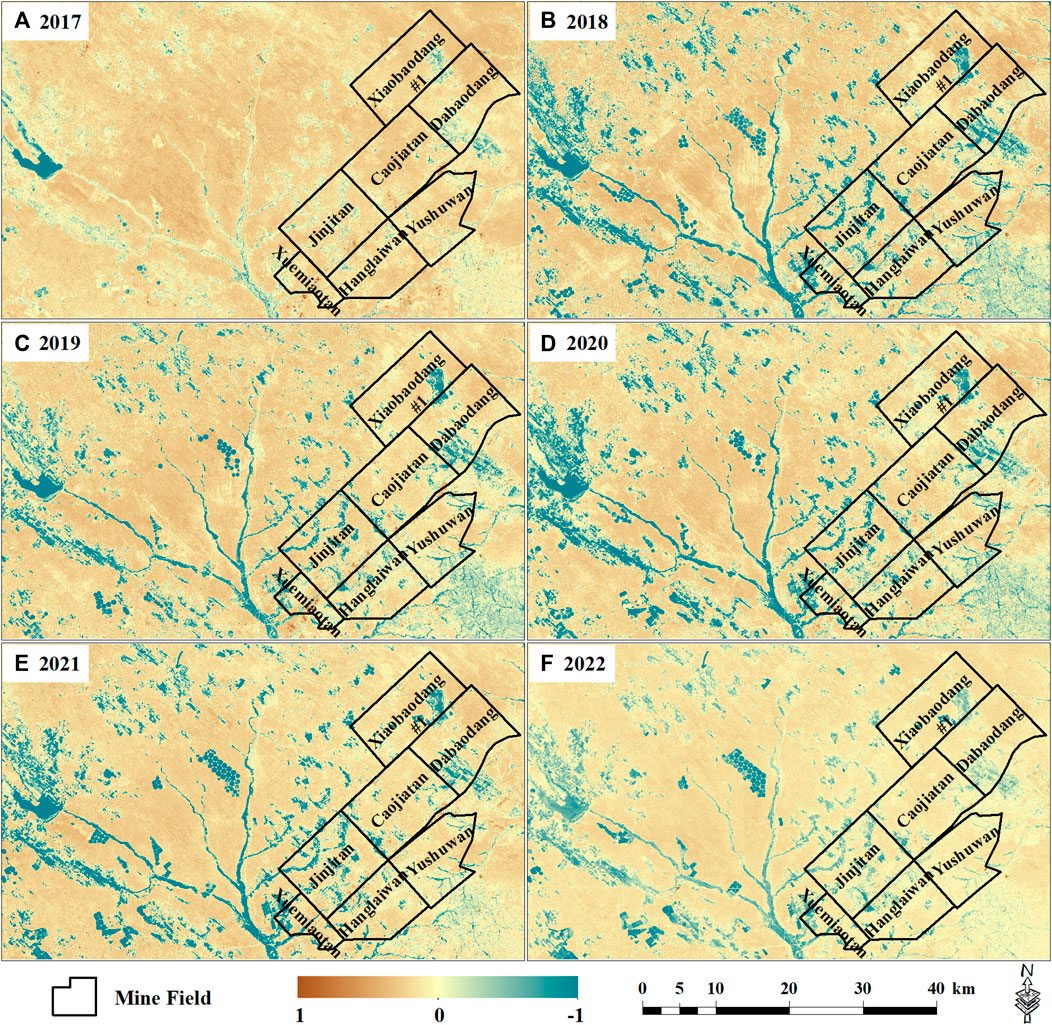
FIGURE 7. The thematic map of NDBBI from 2017 to 2022 in the study area.
The average of NDBBI indicators at the mining and non-mining areas was calculated (Figure 8). It shows that the average of NDBBI indicator is decreasing year by year. The reduction in the average NDBBI within the mining area is relatively large compared to the non-mining area. Combined with the average change of NDVI in the study area, the increase of vegetation cover will affect the bare land and building cover, resulting in its decrease. In addition, Yulin’s GDP is increasing year by year, and the largest contribution rate is the growth rate brought by the secondary industry dominated by mining. Since 2017, China has strictly implemented the preparation of mine geological environmental protection and land reclamation plans to ensure that the mine ecological environment is effectively restored. The implementation of this policy also affects the bare land and building coverage of the mining area, resulting in a decrease in the NDBBI value within the mining area.
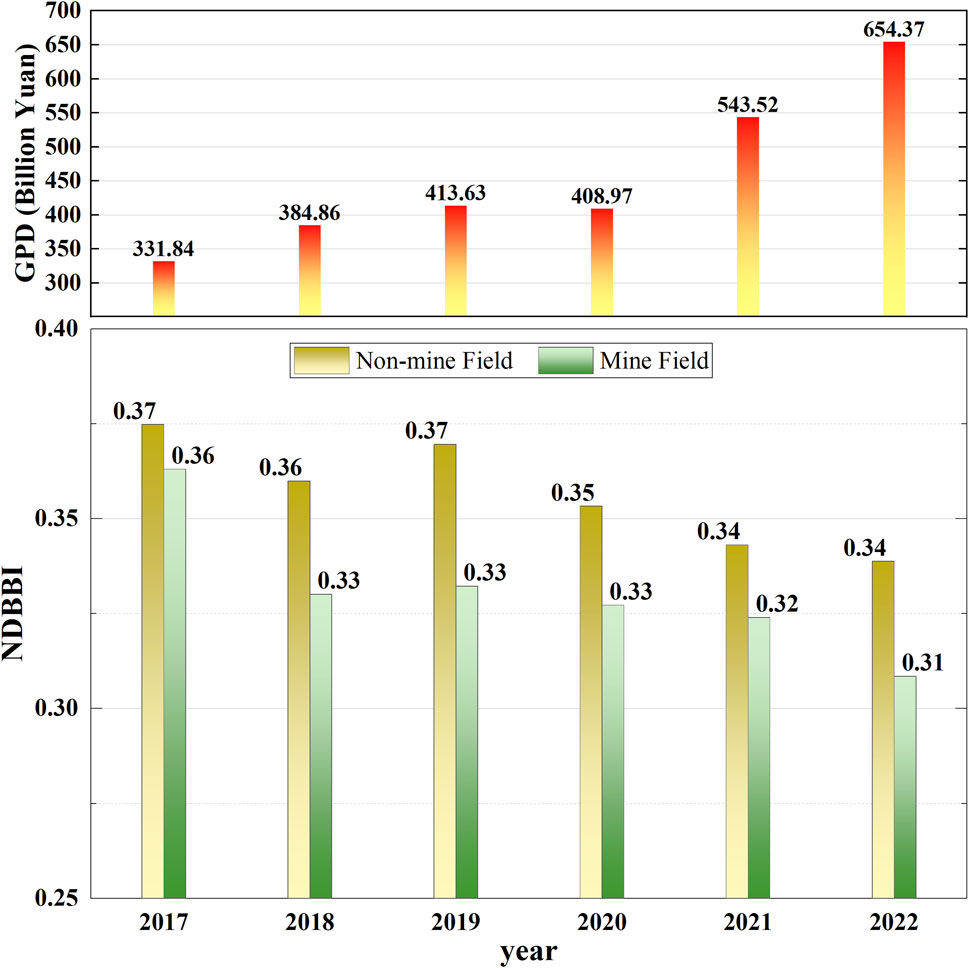
FIGURE 8. The mean value of NDWI at the mining and non-mining areas.
3.1.4 Net primary production indicator
Figure 9 shows a thematic map of the NPP from 2017 to 2022 in the study area. The color in the figure ranges from dark green to white, and the more obvious the green area, the higher the net primary productivity value of vegetation, and vice versa. From the color changes in the 6-year thematic map, it can be concluded that the NPP value was relatively high in 2019 (Figure 9C) and relatively low in 2021 (Figure 9E).
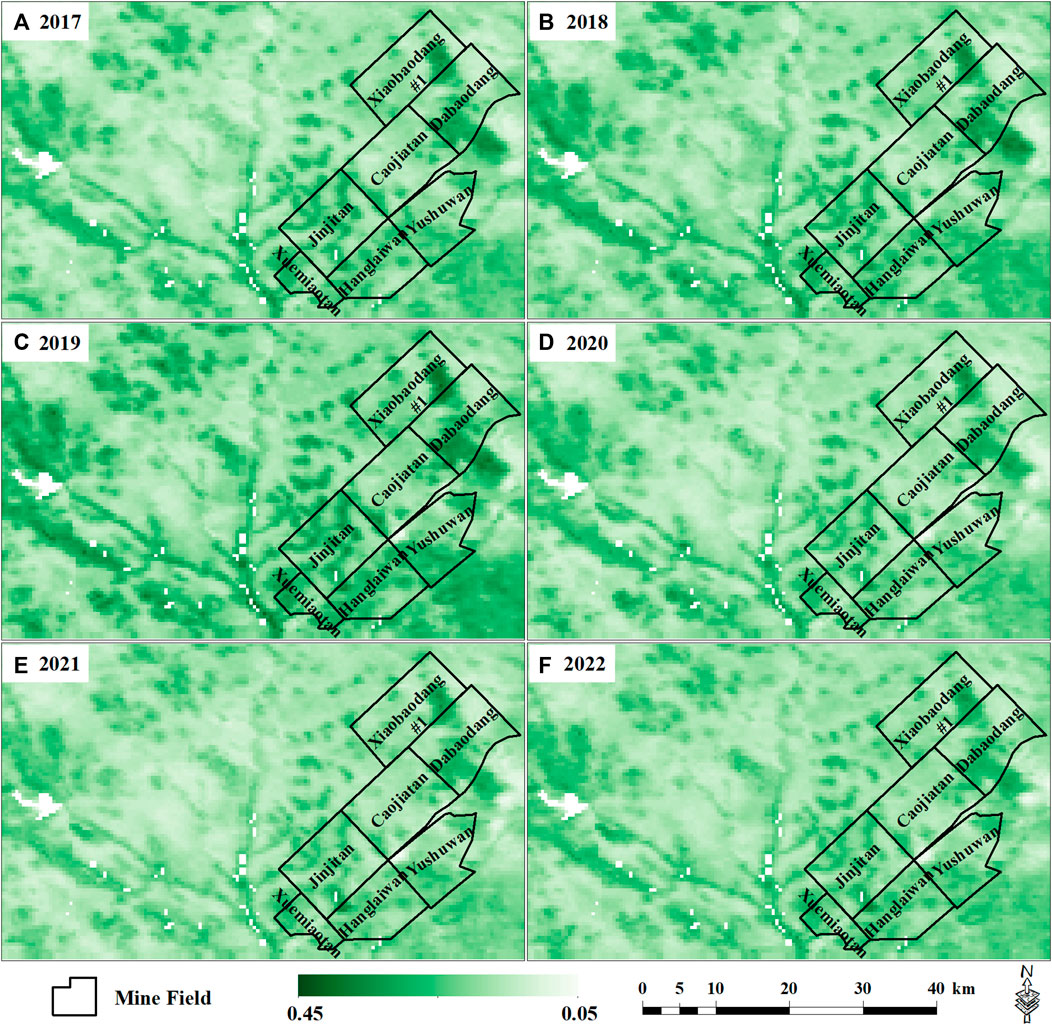
FIGURE 9. The thematic map of NPP from 2017 to 2022 in the study area.
The average of NPP indicators at the mining and non-mining areas was calculated (Figure 10). It shows that the NPP indicator average fluctuates with years, with the highest in 2019. The change in NPP value is mainly the result of a combination of natural and human factors. On the one hand, the warming and humidification of the climate is conducive to the growth of vegetation and increases the NPP value, and the coupling effect of annual precipitation and temperature leads to the interannual fluctuation of NPP value. On the other hand, the development of social economy and the implementation of ecological restoration projects in mining areas have a certain impact on the spatial pattern and trend change of regional NPP value.

FIGURE 10. The mean value of NPP at the mining and non-mining areas.
3.2 Results of principal component analysis
The four indicators of NDVI, NDWI, NDBBI, and NPP were normalized, and principal component analysis was carried out. The results of the analysis are shown in Figure 11.
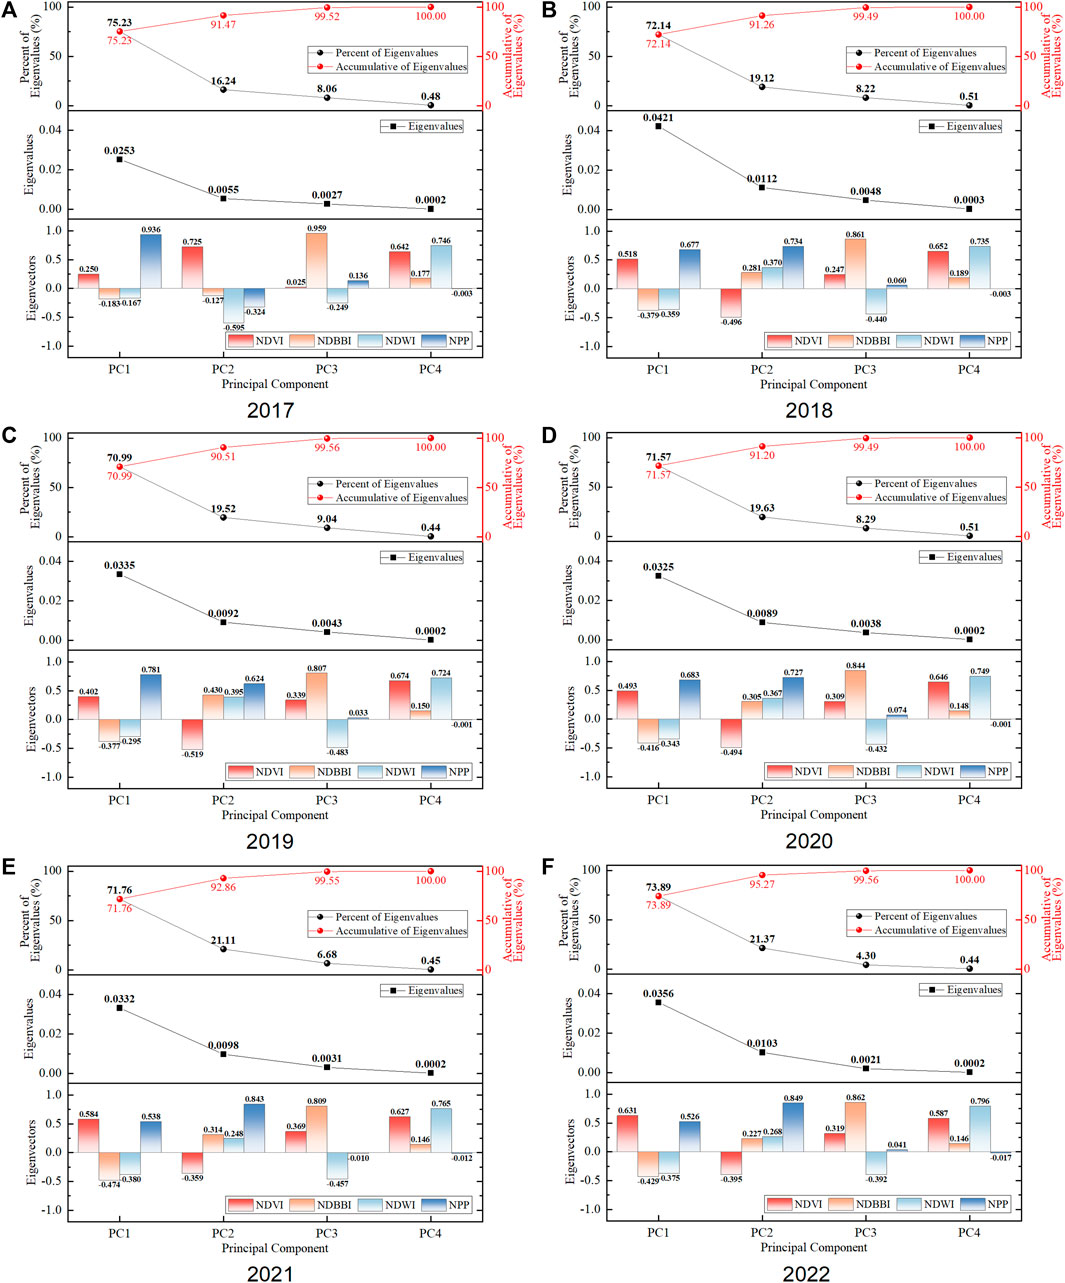
FIGURE 11. Principal component analysis results of each indicator in the study area from 2017 to 2022.
The analysis results show that the contribution rate of the first principal component is 70%–76%, and the cumulative contribution rate of the first and second principal components exceeds 90%. In practical applications, only the first two principal components can be taken. Taking the principal component analysis results in 2022 as an example, the first two principal components y1 and y2 can be expressed by the following formula.
where (x1, x2, x3, x4) is a sample of (NDVI, NDBBI, NDWI, NPP). In the expression of the first principal component y1, the coefficient before the NDVI value x1 and the NPP value x4 is positive, while the coefficient before the NDBBI value x2 and the NDWI value x3 is negative. The results of the principal component analysis for other years were similar to those for 2022. When the y1 value of an area is large, it means that the x1 value and x4 value are large, while the x2 value and x3 value are relatively small, which can judge that the area has high vegetation coverage, good growth and “carbon sequestration capacity”. It indirectly reflects the quality of the ecological environment.
In the expression of the second principal component y2, the coefficient before the NDBBI value x2, the NDWI value x3, the NPP value x4 is positive, and the coefficient before the NDVI value x1 is negative. However, in the 2017 principal component analysis results, the positive and negative signs of the sample coefficients are exactly the opposite. This is detrimental to the calculation of the remote sensing ecological index, so the results of the second principal component calculation are not taken into account. Only the first principal component is used in subsequent analytical calculations.
3.3 Results of remote sensing ecological index
The remote sensing ecological index is calculated according to Eq. 10, and the calculation result is shown in Figure 12.
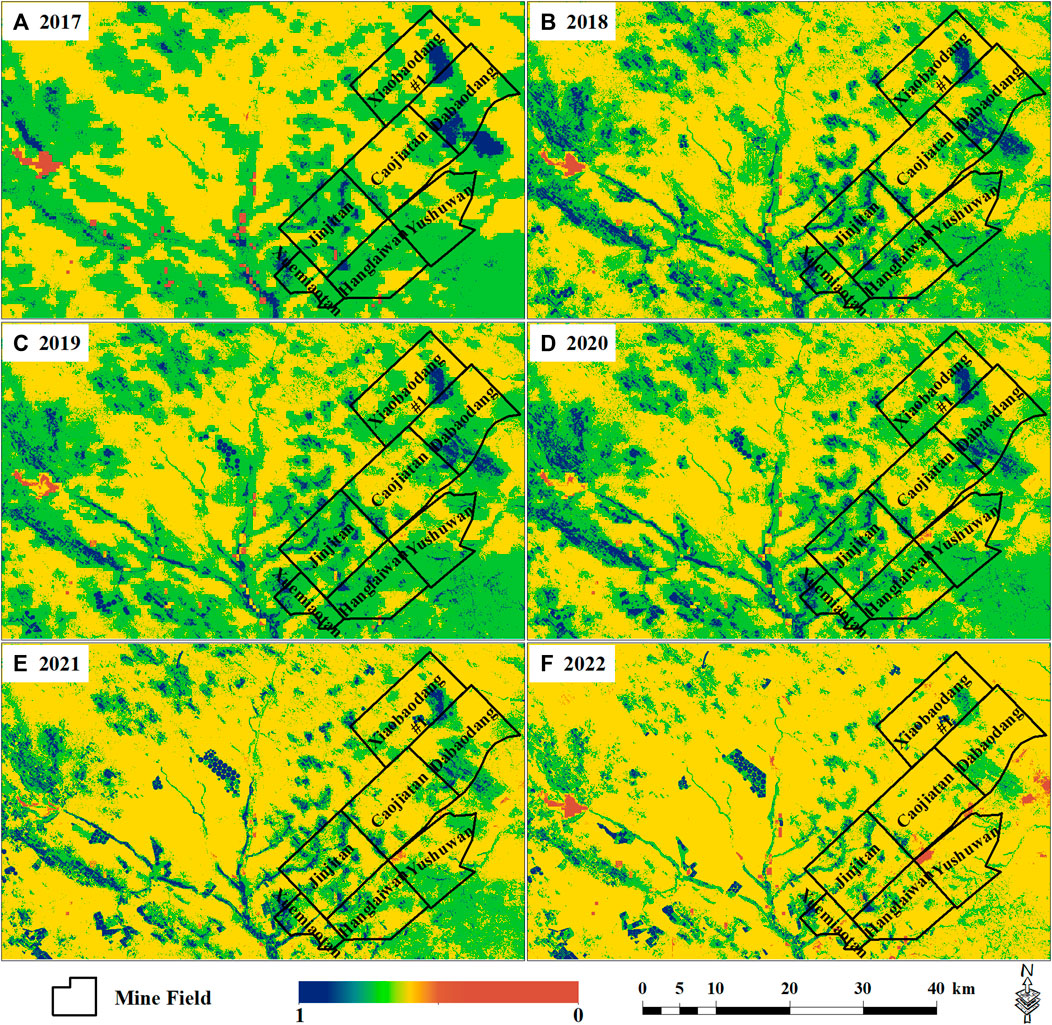
FIGURE 12. The thematic map of RSEI from 2017 to 2022 in the study area.
Figure 12 shows a thematic map of the RSEI from 2017 to 2022 in the study area. The color in the picture ranges from dark green to dark red, the more obvious the dark green, the better the quality of the ecological environment, and vice versa. The color changes in the 6-year thematic map show that the areas with better ecological environment quality have the following characteristics:
1) It is greatly affected by the analysis scope of river waters.
2) It is greatly affected by human activities, such as the artificial irrigation area in Figures 12E, F, and the mine ecological restoration area of Xiaobaodang mining area and Dabaodang mining area in Figures 12C, D.
4 Discussion
4.1 Evaluation of ecological environment quality in the study area
According to the above remote sensing ecological index calculation results, the ecological environment quality is divided into five categories: worst (index value of 0–0.2), poor (index value of 0.2–0.4), medium (index value of 0.4–0.6), good (index value of 0.6–0.8), excellent (index value of 0.8–1.0).The percentage of ecological environment quality at all levels within the mining area and non-mining area is calculated, and the results are shown in Figure 13.
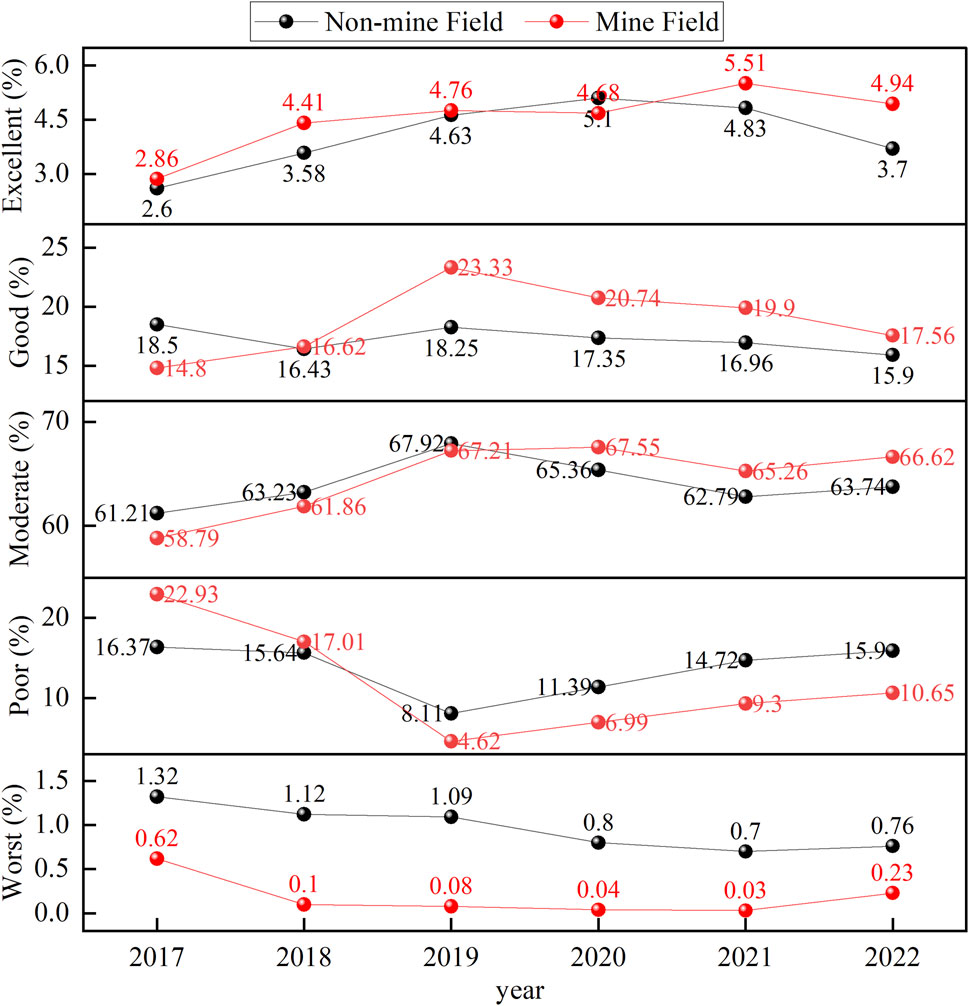
FIGURE 13. The percentage of ecological environment quality at all levels within the mining area and non-mining area.
It is found that the proportion of ecological environment quality changes relatively large in medium areas and poor areas, and the detailed analysis is as follows:
1) Excellent: The proportion of this area tends to increase overall, and the increase in mining area is more obvious than that of non-mining areas, from 2.86% to 5.51%.
2) Good: The proportion of good areas within the non-mining area changes within 3%, and the proportion of good areas within the mining area ranges from 14.8% to 23.33%–17.56%, which is greatly affected by human engineering activities.
3) Medium: This area accounts for the largest proportion of ecological environment quality, and it is also the indicator that best reflects the change of ecological environment quality. In general, this value is increasing, reaching a peak of about 67% in 2019 and decreasing since then. This trend is consistent with changes in the NPP indicator and the NDVI indicator. Secondly, the increase in the proportion of medium areas in the mining area is slightly higher than that in the non-mining area.
4) Poor: The volatility of this area is large, especially in the scope of the mining area, the change is more obvious, from 22.93% to 10.65%.
5) Worst: The range of change in this area is relatively small and tends to decrease overall.
In summary, the change of ecological environment quality is mainly affected by the comprehensive effect of natural factors and human factors. The warming and humidification of the climate is conducive to the growth of vegetation and the increase of water area, and the corresponding ecological environment quality is better. Secondly, the development of social economy and the implementation of ecological restoration projects in mining areas have a certain impact on the spatial pattern and trend change of regional ecological environment quality.
In the previous literature, human engineering activities have caused serious damage to the ecological environment, such as coal mining (Liu et al., 2023), urban sprawl (Lin et al., 2022), and climate rise caused by excessive carbon dioxide emissions (Zhang et al., 2023). However, with the strict implementation of laws, regulations and policies such as ecological environmental protection, the quality of the ecological environment has a tendency to improve (Wang et al., 2021).
4.2 Spatial autocorrelation of ecological environment quality in the study area
From the above discussion, it is found that the distribution of ecological environment quality categories has obvious characteristics of aggregation and banding. Whether this degree of aggregation has spatial autocorrelation and the relationship with the natural environment and human activities deserves further discussion. Therefore, the Moran index method was used to analyze the remote sensing ecological index of the study area.
4.2.1 Moran’s I scatter-plot
Firstly, the Moran’s I scatter-plot is used to analyze whether the remote sensing ecological index of each year has correlation and clustering. Figure 14 shows the Moran’s I scatter-plot of the remote sensing ecological index of the study area from 2017 to 2022. The index of Moran’s I in each year were 0.960, 0.864, 0.922, 0.897, 0.853 and 0.864, respectively. It shows that there is a significant spatial autocorrelation in ecological environment quality.
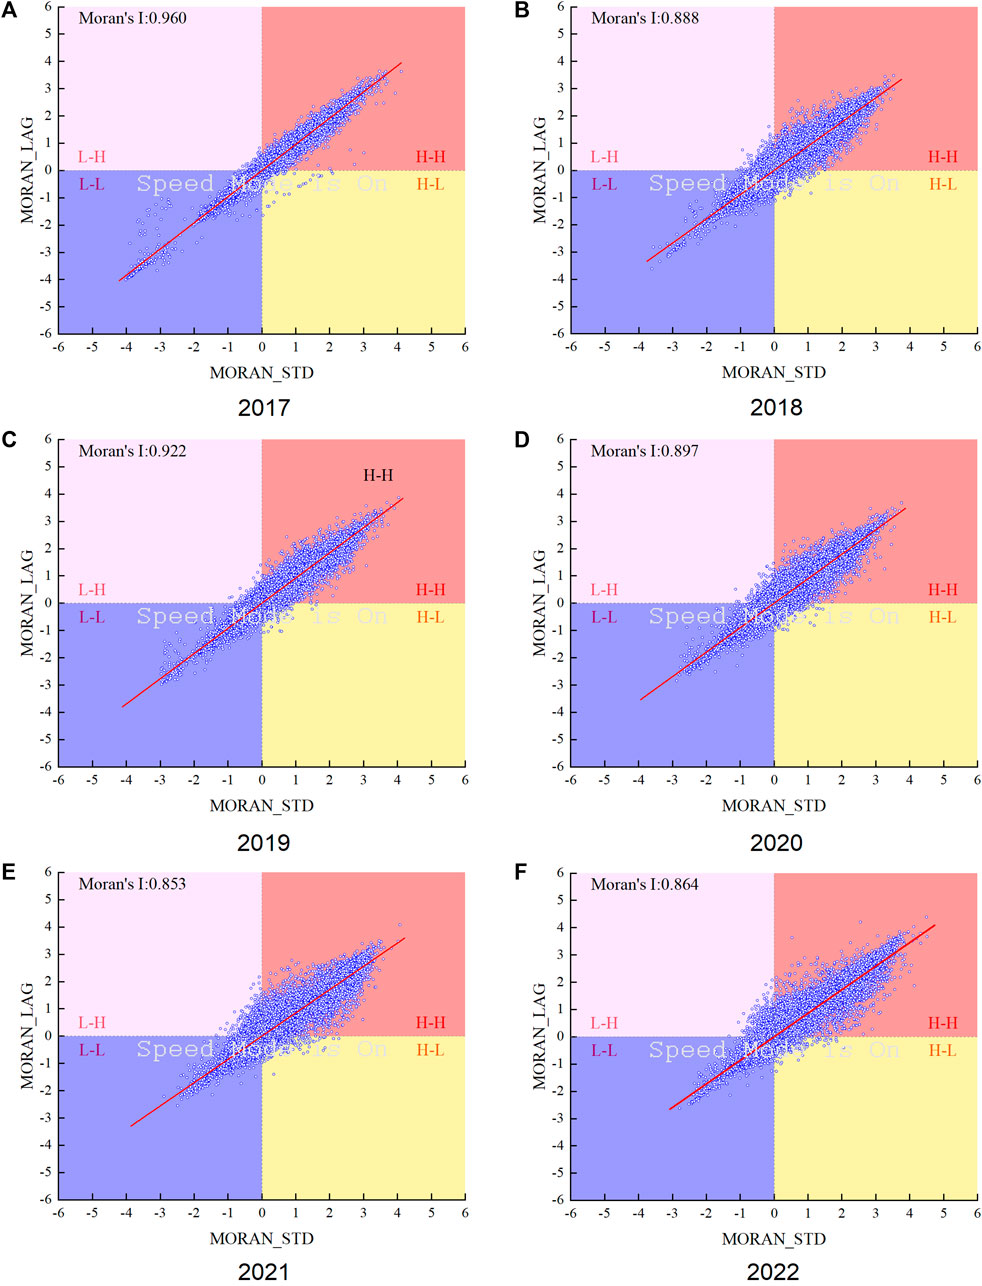
FIGURE 14. The Moran’s I scatter-plot of remote sensing ecological index in the study area from 2017 to 2022.
In Figure 14, the distance of the sample point from the origin represents the significance of aggregation. The farther away from the origin, the higher the level of significance. The four quadrants in a scatter-plot are used to identify relationships between expected neighbors in an area. The first quadrant (HH) indicates that it is a high value in itself, and it is also a high value around it. The second quadrant (LH) indicates that it is itself a low value, but it is surrounded by high values. The third quadrant (LL) indicates that the value itself is high, and the surrounding areas are all low values. The fourth quadrant (HL), which indicates that it is itself a high value, but is surrounded by a low value. The first and third quadrants represent positive spatial autocorrelation, indicating the concentration of similar values. The second and fourth quadrants indicate negative spatial autocorrelation, indicating spatial anomalies. In Figure 14, most of the scattered points are distributed in the first and third quadrants, which has a strong positive spatial correlation.
4.2.2 LISA cluster map
The Moran’s I scatter-plot only preliminarily identifies the quadrant to which the sample points belong, and cannot judge whether the local correlation type of each area and its aggregation area are statistically significant. Therefore, further analysis with LISA cluster maps is required.
Based on the value of the Moran’s I index, the studies were divided into five different categories: high-high, low-low, high-low, low-high, and not significant (Figure 15). The figure shows that the “high-high” cluster areas of ecological environment quality are mainly concentrated in the areas near rivers, artificial irrigation areas and coal mining areas, especially in Jinjitan mine field, Hanglaiwan mine field, Dabaodang mine field and Yushuwan mine field. This may be related to the implementation of ecological protection projects such as geological environmental protection and land reclamation in mining areas.
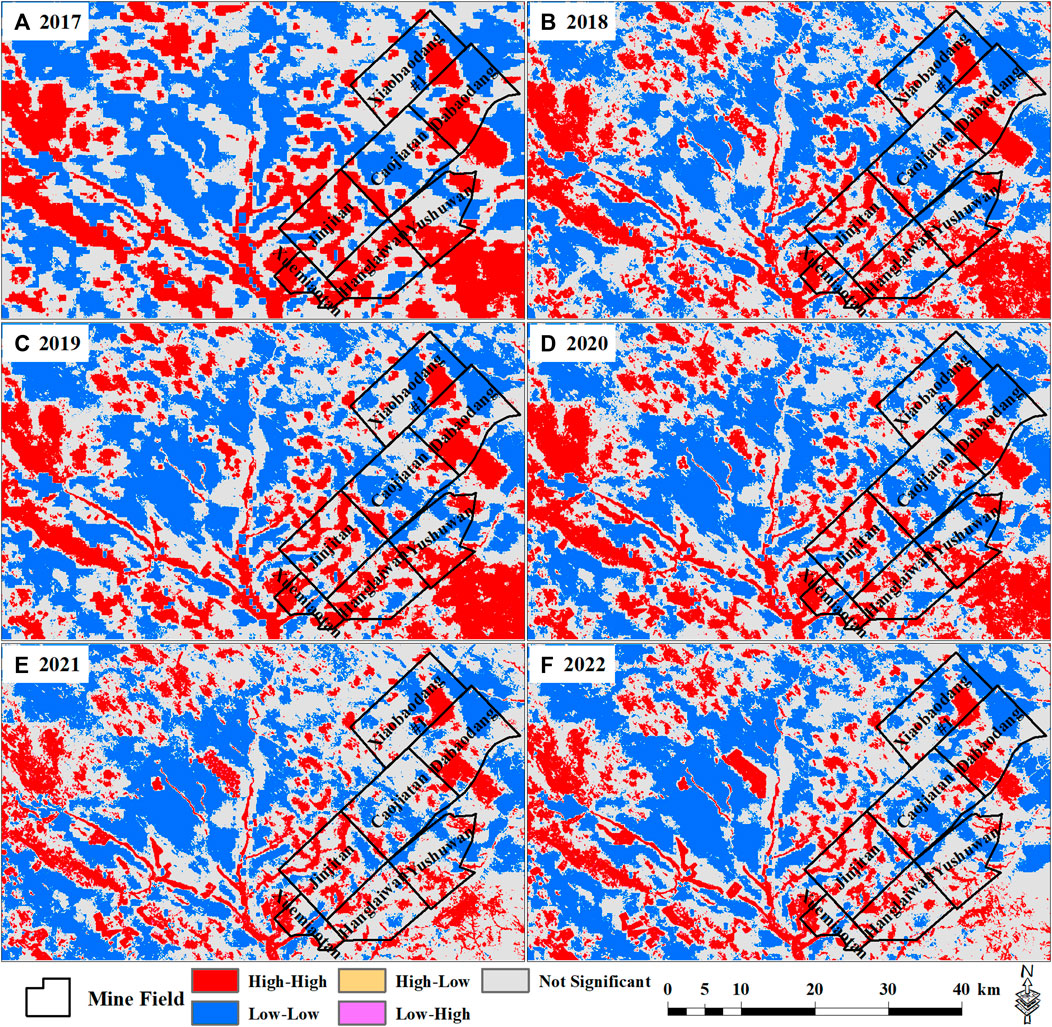
FIGURE 15. The LISA cluster maps.
4.3 Comparison with traditional remote sensing ecological index methods
The traditional RSEI method focuses on the change of land surface characteristics and adapts to areas with less climate change differences. The improved RSEI method in this paper is constructed according to the characteristics of northern Shaanxi, China, such as arid, little rainfall, flat terrain and aeolian sand, and intensive mining activities. Compared with the traditional RSEI method, the improved RSEI method is more applicable to the mining area. Secondly, from the results of principal component analysis, the calculation results of the first principal component are relatively stable, which is different from the calculation results of the previous index constructed by traditional methods (Liu et al., 2023).
5 Conclusion
This paper uses an improved remote sensing ecological index to explore the quality of the ecological environment and its influencing factors, as well as spatial autocorrelation in the mining area of northern Shaanxi, and concludes as follows:
(1) An improved remote sensing ecological index with four indicators (NDVI, NDWI, NDBBI, NPP) was constructed, which was used for the evaluation of ecological environment quality in mining areas in northern Shaanxi.
(2) The ecological environment quality is mainly affected by the comprehensive effect of natural factors and human factors. The regional climate and topography control the distribution of vegetation and water bodies. Secondly, the development of social economy and the implementation of ecological restoration projects in mining areas have a certain impact on the spatial pattern and trend change of regional ecological environment quality.
(3) There was a significant spatial autocorrelation in the quality of the ecological environment in the study area. There are significant “high-high” cluster areas of ecological environment quality in the areas near rivers, artificial irrigation areas and coal mining areas. In particular, the cluster phenomenon of Jinjitan mine field, Hanglaiwan mine field, Dabaodang mine field and Yushuwan mine field is obvious.
Data availability statement
The datasets presented in this article are not readily available because there is no restricted. Requests to access the datasets should be directed to bWFqaWFucXVhbkB4dXN0LmVkdS5jbg==.
Author contributions
ZZ: Conceptualization, Validation, Writing–original draft. HC: Validation, Writing–original draft. JY: Writing–original draft, Data curation. HS: Data curation, Writing–original draft, Methodology. MJ: Methodology, Conceptualization, Funding acquisition, Writing–review and editing.
Funding
The author(s) declare financial support was received for the research, authorship, and/or publication of this article. This research was funded by Innovative scientific research project of Shaanxi Coalfield Geology Group (No. SMDZ-2020CX-8) and the National Natural Science Foundation of China (Nos 41907255, 41602359, and 41702377).
Conflict of interest
Authors ZZ and HC were employed by the Shaanxi 185 Coal Field Geology Co., Ltd.
The remaining authors declare that the research was conducted in the absence of any commercial or financial relationships that could be construed as a potential conflict of interest.
Publisher’s note
All claims expressed in this article are solely those of the authors and do not necessarily represent those of their affiliated organizations, or those of the publisher, the editors and the reviewers. Any product that may be evaluated in this article, or claim that may be made by its manufacturer, is not guaranteed or endorsed by the publisher.
References
Bai, E., Guo, W., Zhang, H., Tan, Y., Ma, Z., Wu, D., et al. (2022). Coal mining method with near-zero impact on the ecological environment in a high-intensity mining area of Northwest China. Bull. Eng. Geol. Environ. 81, 80–14. doi:10.1007/s10064-022-02574-6
Bopche, L., and Rege, P. P. (2022). Landslide susceptibility mapping: an integrated approach using geographic information value, remote sensing, and weight of evidence method. Geotechnical Geol. Eng. 40, 2935–2947. doi:10.1007/s10706-022-02070-4
Cao, J., Wu, E., Wu, S., Fan, R., Xu, L., Ning, K., et al. (2022). Spatiotemporal dynamics of ecological condition in qinghai-tibet plateau based on remotely sensed ecological index. Remote Sens. 14, 4234. doi:10.3390/rs14174234
China MoEaEotPsRo (2015). Technical criterion for ecosystem status evaluation hj192-2015. Beijing: China Environmental Press.
Fang, J., Piao, S., Tang, Z., Peng, C., and Ji, W. (2001). Interannual variability in net primary production and precipitation. Science 293, 1723. doi:10.1126/science.293.5536.1723a
Field, C. B., Behrenfeld, M. J., Randerson, J. T., and Falkowski, P. (1998). Primary production of the biosphere: integrating terrestrial and oceanic components. Science 281, 237–240. doi:10.1126/science.281.5374.237
Gao, S., Zhu, Z., Liu, S., Jin, R., Yang, G., and Tan, L. (2014). Estimating the spatial distribution of soil moisture based on Bayesian maximum entropy method with auxiliary data from remote sensing. Int. J. Appl. Earth Observation Geoinformation 32, 54–66. doi:10.1016/j.jag.2014.03.003
Gashaw, D. Y., Suryabhagavan, K. V., Nedaw, D., and Gummadi, S. (2022). Rainwater harvesting in Modjo watershed, upper Awash River Basin, Ethiopia through remote sensing and fuzzy AHP. Geocarto Int. 37, 14785–14810. doi:10.1080/10106049.2022.2091158
Guo, Z., Wei, W., Pang, S., Li, Z., Zhou, J., and Xie, B. (2019). Spatio-Temporal evolution and motivation analysis of ecological vulnerability in Arid Inland River Basin based on SPCA and remote sensing index: a case study on the Shiyang River Basin. Acta Ecol. Sin. 39, 2558–2572. doi:10.5846/stxb201805211114
Han, X., Cao, T., and Yan, X. (2021). Comprehensive evaluation of ecological environment quality of mining area based on sustainable development indicators: a case study of Yanzhou Mining in China. Environ. Dev. Sustain. 23, 7581–7605. doi:10.1007/s10668-020-00935-3
Hong, J.-H., Su, Z. L.-T., and Lu, E. H.-C. (2020). Spatial perspectives toward the recommendation of remote sensing images using the INDEX indicator, based on principal component analysis. Remote Sens. 12, 1277. doi:10.3390/rs12081277
Jin, W., Li, H., Wang, J., Zhao, L., Li, X., Fan, W., et al. (2023). Continuous remote sensing ecological index (CRSEI): a novel approach for multitemporal monitoring of eco-environmental changes on large scale. Ecol. Indic. 154, 110739. doi:10.1016/j.ecolind.2023.110739
Krzyśko, M., Nijkamp, P., Ratajczak, W., Wołyński, W., Wojtyła, A., and Wenerska, B. (2023). A novel Spatio-temporal principal component analysis based on Geary's contiguity ratio. Comput. Environ. Urban Syst. 103, 101980. doi:10.1016/j.compenvurbsys.2023.101980
Li, N., Yan, C. Z., and Xie, J. L. (2015). Remote sensing monitoring recent rapid increase of coal mining activity of an important energy base in northern China, a case study of Mu Us Sandy Land. Resour. Conservation Recycl. 94, 129–135. doi:10.1016/j.resconrec.2014.11.010
Li, W., An, M., Wu, H., An, H., Huang, J., and Khanal, R. (2023). The local coupling and telecoupling of urbanization and ecological environment quality based on multisource remote sensing data. J. Environ. Manage 327, 116921. doi:10.1016/j.jenvman.2022.116921
Li, Y., Cao, Z., Long, H., Liu, Y., and Li, W. (2017). Dynamic analysis of ecological environment combined with land cover and NDVI changes and implications for sustainable urban–rural development: the case of Mu Us Sandy Land, China. J. Clean. Prod. 142, 697–715. doi:10.1016/j.jclepro.2016.09.011
Liao, W., and Jiang, W. (2020). Evaluation of the spatiotemporal variations in the eco-environmental quality in China based on the remote sensing ecological index. Remote Sens. 12, 2462. doi:10.3390/rs12152462
Lin, L., Hao, Z., Post, C. J., and Mikhailova, E. A. (2022). Monitoring ecological changes on a rapidly urbanizing island using a remote sensing-based ecological index produced time series. Remote Sens. 14, 5773. doi:10.3390/rs14225773
Liu, C., Ma, Y., and Liu, X. (2022). Integration of multi-source remote sensing data for spatial-temporal change monitoring of ecological environment in the yellow river delta. Pol. J. Environ. Stud. 31, 4757–4765. doi:10.15244/pjoes/147295
Liu, Y. J., Liu, H. J., Yan, C. Q., Feng, Z. W., and Zhou, S. (2023). Evaluation and dynamic monitoring of ecological environment quality in mining area based on improved CRSEI index model. Heliyon 9, e20787. doi:10.1016/j.heliyon.2023.e20787
Ma, X., Fan, L., Zhang, X., Zhang, Y., Zhang, H., and Bian, H. (2016). Ynamic change of land desertification and its driving mechanism in Yushenfu mining area based on remote sensing. J. China Coal Soc. 41, 2063–2070. doi:10.13225/j.cnki.jccs.2016.0012
Nie, X., Hu, Z., Ruan, M., Zhu, Q., and Sun, H. (2022). Remote-sensing evaluation and temporal and spatial change detection of ecological environment quality in coal-mining areas. Remote Sens. 14, 345. doi:10.3390/rs14020345
Ren, Y., Deng, L. Y., Zuo, S. D., Song, X. D., Liao, Y. L., Xu, C. D., et al. (2016). Quantifying the influences of various ecological factors on land surface temperature of urban forests. Environ. Pollut. 216, 519–529. doi:10.1016/j.envpol.2016.06.004
Rhee, J., Im, J., and Carbone, G. J. (2010). Monitoring agricultural drought for arid and humid regions using multi-sensor remote sensing data. Remote Sens. Environ. 114, 2875–2887. doi:10.1016/j.rse.2010.07.005
Ruimy, A., Saugier, B., and Dedieu, G. (2012). Methodology for the estimation of terrestrial net primary production from remotely sensed data. J. Geophys. Res. Atmos. 99, 5263–5283. doi:10.1029/93jd03221
Song, J., Yang, Z., Xia, J., and Cheng, D. (2021). The impact of mining-related human activities on runoff in northern Shaanxi, China. J. Hydrology 598, 126235. doi:10.1016/j.jhydrol.2021.126235
Wang, J. (2022). Landscape classification method using improved U-net model in remote sensing image ecological environment monitoring system. J. Environ. Public Health 2022, 1–12. doi:10.1155/2022/9974914
Wang, S.-D., Si, J.-J., and Wang, Y. (2021). Study on evaluation of ecological environment quality and temporal-spatial evolution of danjiang river basin (henan section). Pol. J. Environ. Stud. 30, 2353–2367. doi:10.15244/pjoes/128110
Wang, Y., Lv, W., Wang, M., Chen, X., and Li, Y. (2023). Application of improved Moran’s I in the evaluation of urban spatial development. Spat. Stat. 54, 100736. doi:10.1016/j.spasta.2023.100736
Wang, Z., and Lam, N. S. N. (2020). Extending getis–ord statistics to account for local space–time autocorrelation in spatial panel data. Prof. Geogr. 72, 411–420. doi:10.1080/00330124.2019.1709215
Wu, S., Gao, X., Lei, J., Zhou, N., Guo, Z., and Shang, B. (2022). Ecological environment quality evaluation of the Sahel region in Africa based on remote sensing ecological index. J. Arid Land 14, 14–33. doi:10.1007/s40333-022-0057-1
Xu, H. (2013). A remote sensing index for assessment of regional ecological changes. China Environ. Sci. 33, 889–897. doi:10.3969/j.issn.1000-6923.2013.05.019
Xu, H., Wang, M., Shi, T., Guan, H., Fang, C., and Lin, Z. (2018). Prediction of ecological effects of potential population and impervious surface increases using a remote sensing based ecological index (RSEI). Ecol. Indic. 93, 730–740. doi:10.1016/j.ecolind.2018.05.055
Yang, Y., Erskine, P. D., Lechner, A. M., Mulligan, D., Zhang, S., and Wang, Z. (2018). Detecting the dynamics of vegetation disturbance and recovery in surface mining area via Landsat imagery and LandTrendr algorithm. J. Clean. Prod. 178, 353–362. doi:10.1016/j.jclepro.2018.01.050
Yang, Z., Zdanski, C., Farkas, D., Bang, J., and Harris, W. (2020). Evaluation of Aerosol Optical Depth (AOD) and PM2.5 associations for air quality assessment. Remote Sens. Appl. Soc. Environ. 20, 100396. doi:10.1016/j.rsase.2020.100396
Yoshioka, A., Fukasawa, K., Mishima, Y., Sasaki, K., and Kadoya, T. (2017). Ecological dissimilarity among land-use/land-cover types improves a heterogeneity index for predicting biodiversity in agricultural landscapes. Ambio 46, 894–906. doi:10.1007/s13280-017-0925-7
Zhang, Z., Li, M., Wen, Z., Yin, Z., Tang, Y., Gao, S., et al. (2023). Degraded frozen soil and reduced frost heave in China due to climate warming. Sci. Total Environ. 893, 164914. doi:10.1016/j.scitotenv.2023.164914
Keywords: northern Shaanxi in China, coal mining area, ecological environment quality, remote sensing monitoring, spatial autocorrelation
Citation: Zhu Z, Cao H, Yang J, Shang H and Ma J (2024) Ecological environment quality assessment and spatial autocorrelation of northern Shaanxi mining area in China based-on improved remote sensing ecological index. Front. Environ. Sci. 12:1325516. doi: 10.3389/fenvs.2024.1325516
Received: 21 October 2023; Accepted: 24 January 2024;
Published: 07 February 2024.
Edited by:
Jarosław Brodny, Silesian University of Technology, PolandReviewed by:
Huini Wang, Wuhan Institute of Technology, ChinaXuedong Wang, Liaoning Technical University, China
Zhongqiong Zhang, Chinese Academy of Sciences (CAS), China
Yu Guoqiang, xi’an geology center, China
Copyright © 2024 Zhu, Cao, Yang, Shang and Ma. This is an open-access article distributed under the terms of the Creative Commons Attribution License (CC BY). The use, distribution or reproduction in other forums is permitted, provided the original author(s) and the copyright owner(s) are credited and that the original publication in this journal is cited, in accordance with accepted academic practice. No use, distribution or reproduction is permitted which does not comply with these terms.
*Correspondence: Jianquan Ma, bWFqaWFucXVhbkB4dXN0LmVkdS5jbg==