 Irlan A. Rum
 Arnold Tukker
 Rutger Hoekstra1
- 1Institute of Environmental Science (CML), Leiden University, Leiden, Netherlands
- 2Department of Economics, Universitas Padjadjaran, Bandung, Indonesia
- 3Netherlands Organisation for Applied Scientific Research TNO, Den Haag, Netherlands
- 4Social Sciences, Paris Institute of Advanced Study, Paris, France
Within Indonesia, the structure of consumption and production differs significantly across provinces. This implies that carbon footprints and intensities between provinces are also diverse. This paper calculates historical consumption- and production-based carbon emissions at the provincial level using a multi-scale input-output (IO) database for 2010, in which an environmentally extended multi-regional IO (EE MRIO) table for 34 Indonesian provinces is integrated in the global EE MRIO EXIOBASE with data for 43 countries and 5 rest of the world regions. Emissions from consumption are detailed by product and their points of origin, while emissions from production are detailed by industry and their destinations. Our results show the heterogeneity of Greenhouse Gas (GHG) emissions under both sides. The Java region is a net importer of carbon emission, while Sumatra and Kalimantan are net exporters. In the global context, the Asia Pacific region plays important role in national GHG emissions. Services product contributed 57.1% of national consumption-based GHG emissions, followed by manufacture (30.6%), and agriculture (12.3%). On the national level, 63.5% of national GHG emissions are related to household consumption. There is a high disparity across provinces in Indonesia in carbon footprints. Provincial average per capita carbon footprints vary from 2 t CO2e/capita in East Nusa Tenggara to 13.84 t CO2e/capita in East Kalimantan. Carbon intensity also varies from 0.83 kt CO2e/M Euro in Jakarta to 2.37 kt CO2e/M Euro in North Kalimantan. Agriculture and food products dominate household carbon footprints, while construction leads in government carbon footprints. Utilities and transportation services play important roles on national carbon intensities. We further correlated the Human Development Index (HDI) with per capita carbon footprints and expenditure, and find that provinces with similar GHG emissions and expenditure per capita income as Java, tend to have a lower HDI. Understanding development status and province-level characteristics is important for selecting policy strategies.
1 Introduction
In the context of the United Nations Framework Convention on Climate Change (UNFCCC), Indonesia has an ambitious long term strategy to peak territorial Greenhouse Gas (GHG) emissions in 2030, to reach 540 Mt (million tonnes) CO2e in 2050, and to achieve net-zero GHG emissions by 2060 (MoEF, 2021a). Previously, under the first National Determined Contribution (NDC) to UNFCCC, Indonesia pledged to reduce emissions by 29% (834 Mt CO2e) under unconditional mitigation scenario, or by 41% (1,185 Mt CO2e) under international support scenario, compared to the baseline projections for 2030 (2,869 Mt CO2e) (MoEF, 2021b). The government has enacted regulatory frameworks, such as Law No. 16/2016 on the Paris Agreement to the UNFCC and Presidential Regulation (PERPRES) No. 18/2020 on the 2020–2024 National Medium-Term Development Plan. They set a national binding target for GHG emissions of below 1.56 Gt CO2e per year in 2024 (i.e., a 27.3% reduction from baseline) and further set an emission intensity target of below 333.7 t CO2e per billion IDR in 2024, or equivalent to 5.25 kt CO2e/M Euro (i.e., a 31.6% reduction from baseline). Moreover, the government also issued regional policies such as PERPRES No. 98/2021, to set GHG emission reduction targets at provincial levels in line with the aforementioned national and sectoral targets.
Several studies have analyzed the importance of regional specific policies for environmental impact mitigation (Harris et al., 2012; Meng et al., 2013). It further has been recognized that national and global supply chains of provinces and regions drive emissions in other regions and countries. For example, in China, four megacities consumed about 72%–77%, 87%–92%, and 95%–99% of their consumption on energy, water, and land from outside of their geographic boundaries, respectively (Meng et al., 2022). The carbon footprint in 2012 ranged from 0.87 to 6.60 t CO2 per capita across 30 provinces in China (Wang et al., 2019). In India too, the per capita carbon footprint varies highly between regions. There is about a tenfold difference between the highest and the lowest carbon footprint across 623 districts in 2012 (from 0.21 to 2.04 t CO2 per capita). The four mega districts (Mumbai, Kolkata, Bangalore, and New Delhi) in India have carbon emissions of 0.98–1.76 t CO2 per capita in 2012, which is well above their national average (Lee et al., 2020). In Brazil, the per capita consumption-based CO2 emissions vary significantly between states, from 0.77 to 4.51 t CO2 per capita in 2008. The four states in the southeast region import most of their carbon footprints from outside their state boundaries (Imori and Guilhoto, 2016). These sub-national studies reveal a wide spatial heterogeneity within a specific country, which may point the opportunities for region specific GHG mitigation options.
Indonesia has a wide range of regional GDP per capita across 34 provinces due to different economic activities and population density. As an example, North Maluku, a province in eastern Indonesia that produces agriculture products, can only have 1,438 M Euro in GDP compared to one province in western Indonesia, i.e., West Java, which produces services and manufactures products, with 82,051 M Euro in GDP in 2010 (more than 50 times higher). Moreover, looking at the population distribution across the regions, Indonesia shows an unequal distribution. More than 60 percent of the people live on Java Island. In this case, West Java accounts for 43.1 million people, while North Maluku has just 1.01 million people. These examples underscore the regional disparity within Indonesia both production and consumption activities.
The production and trade of goods and services create environmental impacts in various steps of their (usually global) supply chains before they reach final consumers. This implies that it is useful not only to measure environmental impacts from a territorial-based (production) perspective, but also from a consumption-based perspective (Tukker et al., 2016). The consumption-based approach establishes a connection between local consumption and the global environmental impacts driven by this consumption. Ignoring this connection might result in an incomplete analysis of the underlying driving forces of environmental change.
Consumption-based accounting further can support consumption-based policies as another way to mitigate climate change. Consumption-based accounting can also identify the potential for and so limit the danger of carbon leakage in the global market (Girod et al., 2014), as today’s GHG mitigation actions are still based on national or regional production-based policies. Indonesia has not yet adopted consumption-based measures in their policies due to the lack of harmonized and actionable impact information at the level of regions (Ivanova et al., 2017; Turner et al., 2011). Production-based accounts only indicate emissions occurrence without revealing what causes the emissions. We need more study that attempt to connect standard emission inventories to consumption activities that are more applicable for policymakers (Hertwich and Peters, 2009; Peters, 2008). To our knowledge, there is no subnational assessment of carbon footprints and carbon intensities available by product and industry for the 34 provinces of Indonesia. Previous studies on Indonesia’s carbon footprints and carbon intensities only looked at the national level and a limited number of sectors (Fang et al., 2021; Farizal et al., 2024; Lam et al., 2019; Mao, 2018; Nathaniel and Khan, 2020; Yilanci and Korkut Pata, 2020).
In this article, we aim to analyze the environmental impact of industries and final consumptions across Indonesian provinces in terms of GHG emissions, associated with the production and consumption of goods and services. This study provides the first historical carbon footprint of final consumption and carbon intensity of final production across Indonesian provinces at a detailed sectoral level. The remainder of the paper is structured as follows. Section 2 discusses the database and approach to calculate carbon footprints and its distributions, and Section 3 gives the main results. Section 4 forms the reflection and conclusion on this work.
2 Database and approach to calculate environmental footprints
2.1 Database
For our analysis, we use a multi-scale Environmentally Extended Multi-Region Input-Output (EE-MRIO) for Indonesia. It integrates INDOTERM, a national MRIO for Indonesia, with EXIOBASE, a global environmentally extended MRIO. The multi-scale EE-MRIO model integrates global data on 43 countries and 5 rest of continents with 34 Indonesian provinces. The key to the multi-scale EE-MRIO model is that it shows the needs for domestic and imported products across each industry and final demand within Indonesia, as well as all other countries. We refer to earlier literature on multi-scale EE-MRIO models for more illustrations of the concept (Bachmann et al., 2015; Fry et al., 2021; Jiang et al., 2019; Meng et al., 2018; Wang et al., 2015; Wiedmann, 2009). The main challenge for performing the analysis in this paper is the construction of the multi-scale MRIO table and adding the environmental extensions by sector.
We decide to use EXIOBASE version 3.3 for the year 2010 and INDOTERM version 3 for that same year. At the time of writing, this was the latest publicly available province-level MRIO for Indonesia. Moreover, the original (not estimated) global EE-MRIO from EXIOBASE is only available through 2011. Thus, using 2010 as a base year is optimal to merge these two databases. The EXIOBASE database contains the supply-use tables (SUTs) and detailed environmental extensions for 200 products from 163 industries. It covers 44 individual countries (including Indonesia) and 5 aggregated “Rest of Continent” regions covering all remaining countries in the world. In addition, EXIOBASE also provides a large number of environmental extensions including GHG emissions. INDOTERM contains the SUTs for 185 products and industries for 34 provinces in Indonesia.
From these two databases, all the SUTs are put in the same classification by aggregating products and industries. We integrate Indonesia’s provincial SUT into the global SUT to generate a multi-scale SUT, in which the Indonesian tables are kept consistent with the national accounts following the so-called SNAC method of Edens et al. (2015). This required a rebalancing of EXIOBASE so that EXIOBASE would be consistent with the Indonesian import and export data, which we performed using the Generalized RAS balancing procedure (Temurshoev et al., 2013). The resulting multi-scale SUT was transformed into a product by product IOT using industry technology assumption (United Nation, 2018). Province-specific sectoral GHG emissions for Indonesia were obtained from SIMONTANA (MoEF, 2020). The resulting extended multi-scale product by product MRIO model includes 82 regions (34 provinces, 43 countries, and 5 rest of the continents), 80 products and industries, and is complemented with data on GHG emissions. Detail information about database construction can be found in Rum et al. (2023) and the illustration of the database construction are provided in the Supplementary Figure S1. In addition, data on regional population and the Human Development Index (HDI) by province and country are taken from the Statistic Office (Bps, 2010; Bps, 2012) and the UNDP (2022).
2.2 Calculating carbon footprints and elasticities
The total output of the multi-region economy can be expressed as the sum of intermediate and final consumption as shown in the Leontief model (Miller and Blair, 2022) below
where
where
In this study, we analyze carbon emissions from both a consumption (footprint) and production side. The carbon footprint represents the carbon emission embodied in consumption. We include carbon emission from the CO2, CH4, and N2O, as CO2-equivalents, based on the global warning potential (GWP100) values in the 4th Assessment Report (IPCC, 2007). We calculate the carbon emissions related to final demand or we called it as consumption-based carbon emissions using the formulas below
where
where
We further decompose consumption and production-based carbon emissions according to trade components: local (domestic) trade, interprovincial trade, and international trade. We split matrix
where
where
We use Equations 1–7 in this paper to calculate consumption and production-based carbon emissions in 10 aggregated products/industries and 5 source/destination components for 34 provinces. The list of regions, products, and industries, along with the corresponding mapping for aggregation, can be found in SI, Supplementary Tables S1, S2.
The changes in carbon footprint resulting from the change in household expenditure can be calculated using a carbon elasticity of expenditure
where
where
3 Results
3.1 Indonesian carbon emissions compared to other countries
We begin our analysis of Indonesian carbon emissions from a global context. Table 1 shows that the total Indonesian carbon emissions in 2010 was much smaller compared to other populous countries, such as China, India, and the US and comparable with other developing countries. And this standing remains the same when comparing the global emission data in 2022 from the World Bank (2022). For example, China and India contribute the highest to global carbon emission, with more than ten- and three-times emission of Indonesia, respectively, both from consumption and production side, respectively. In 2010, 27% of global carbon emissions, or around 10 Gt CO2e, were embodied in international trade. Other studies also show similar results (Harris et al., 2020; He and Hertwich, 2019; Li et al., 2020; Wang et al., 2022). This overview highlights the contribution of global trade on global carbon emissions and how Indonesia contributes to the global carbon emissions.
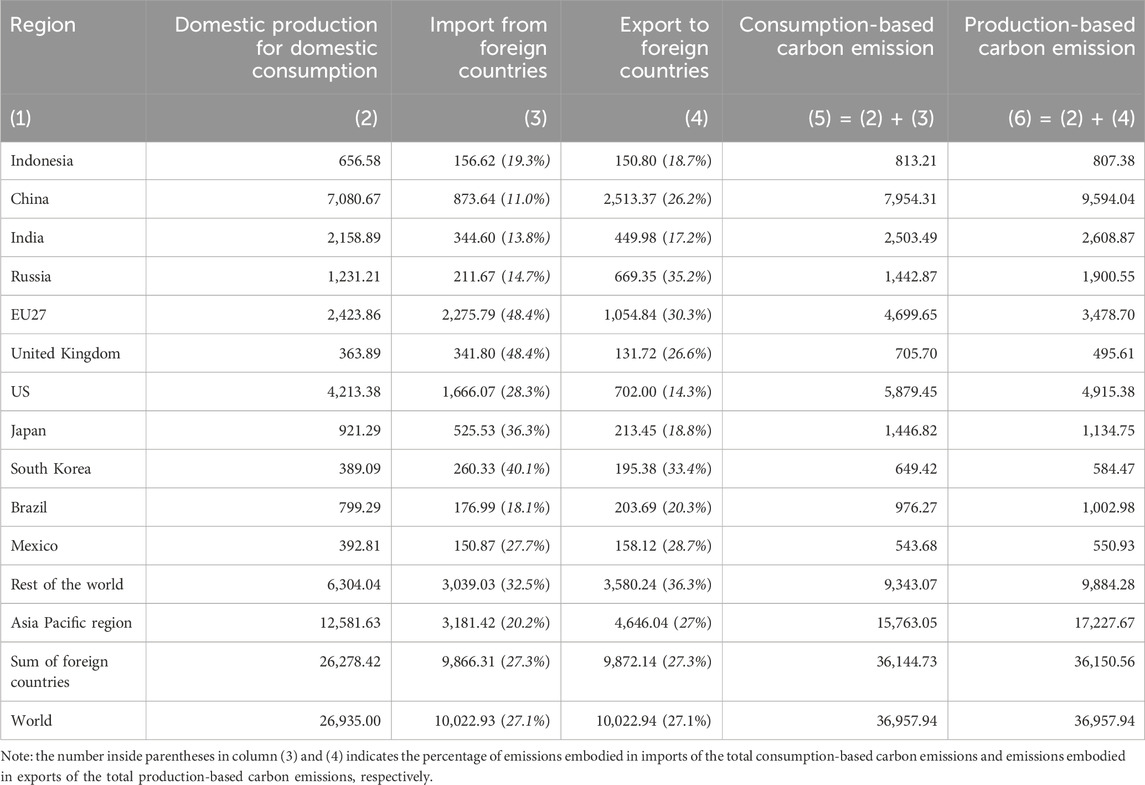
Table 1. Consumption- and production-based carbon emissions by country and its decomposition for 2010 (in Mt CO2e).
We further show the whole distribution of total global carbon emissions across countries from one database, where the total global consumption-based carbon emission is equal with the total global production-based carbon emission (Table 1). In Indonesia, there is a total of consumption-based carbon emissions (carbon footprint) of 813.2 Mt CO2e in 2010, which is slightly higher than its national production-based carbon emissions, which is 807.3 Mt CO2e. Emissions embodied in imports are higher as in exports, making Indonesia a net-importer of GHG emissions of around 6 Mt CO2e. The carbon emissions from domestic production for domestic consumption total 656 Mt CO2e (around 80% of total carbon emissions). Thus, carbon emissions embodied in trade are less relevant for Indonesian as only 19.3% of its consumption-based carbon emissions are embodied in import and 18.7% of its production-based carbon emissions are embodied in export.
3.2 Consumption-based and production-based carbon emissions at provincial level
We first highlight the regional outlook on carbon emissions in Indonesia. We classify the 34 provinces into five regions, i.e., Sumatra, Java, Kalimantan, Sulawesi, and Eastern Indonesia, as shown in Figures 1, 2. Java contributes the most to national carbon emissions, both in terms of consumption and production, with 415 and 399.4 Mt CO2e, respectively (around half of total national carbon emissions). Sumatra and Kalimantan contribute 193.1 Mt CO2e (23.7%) and 83.3 Mt Co2e (10.2%) to national consumption-based carbon emission, respectively. For national production-based carbon emission, Sumatra and Kalimantan each contribute 223.6 Mt CO2e (27.7%) and 88.6 Mt CO2e (10.9%). Sulawesi and Eastern Indonesia contribute less than 10% of the national carbon emission. Thus, for Indonesia, both consumption-based and production-based total carbon emissions are similar across regions and they are mainly concentrated in Java and Sumatra.
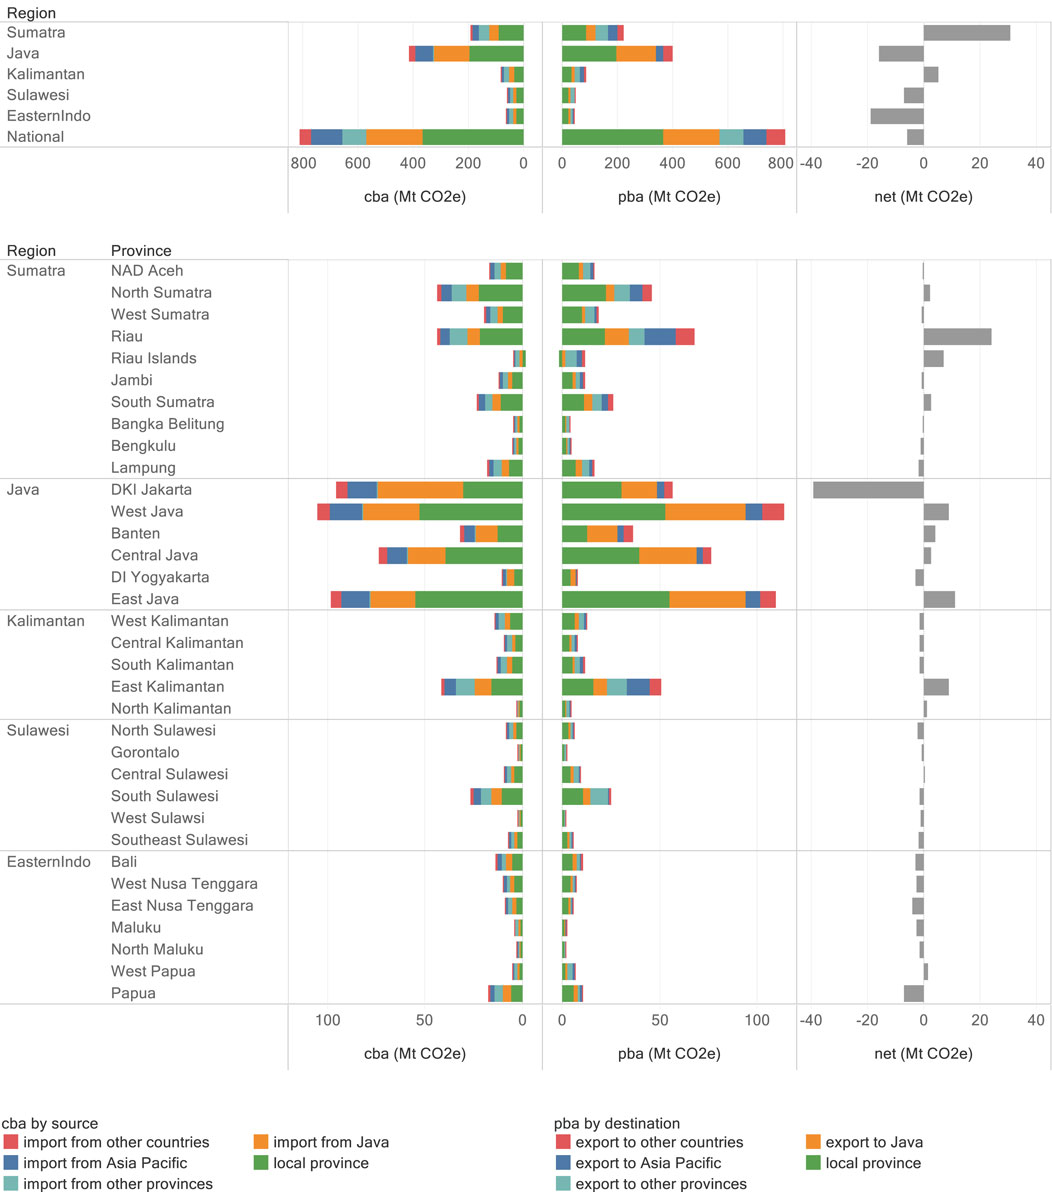
Figure 1. Contribution of carbon emissions (in Mt CO2e) by source and destination across 5 regions and 34 provinces in Indonesia in 2010. The left bars are the consumption-based carbon emissions (cba) and the middle bars are the production-based emissions (pba). The right bars are the net carbon emissions transfer (net = pba-cba).
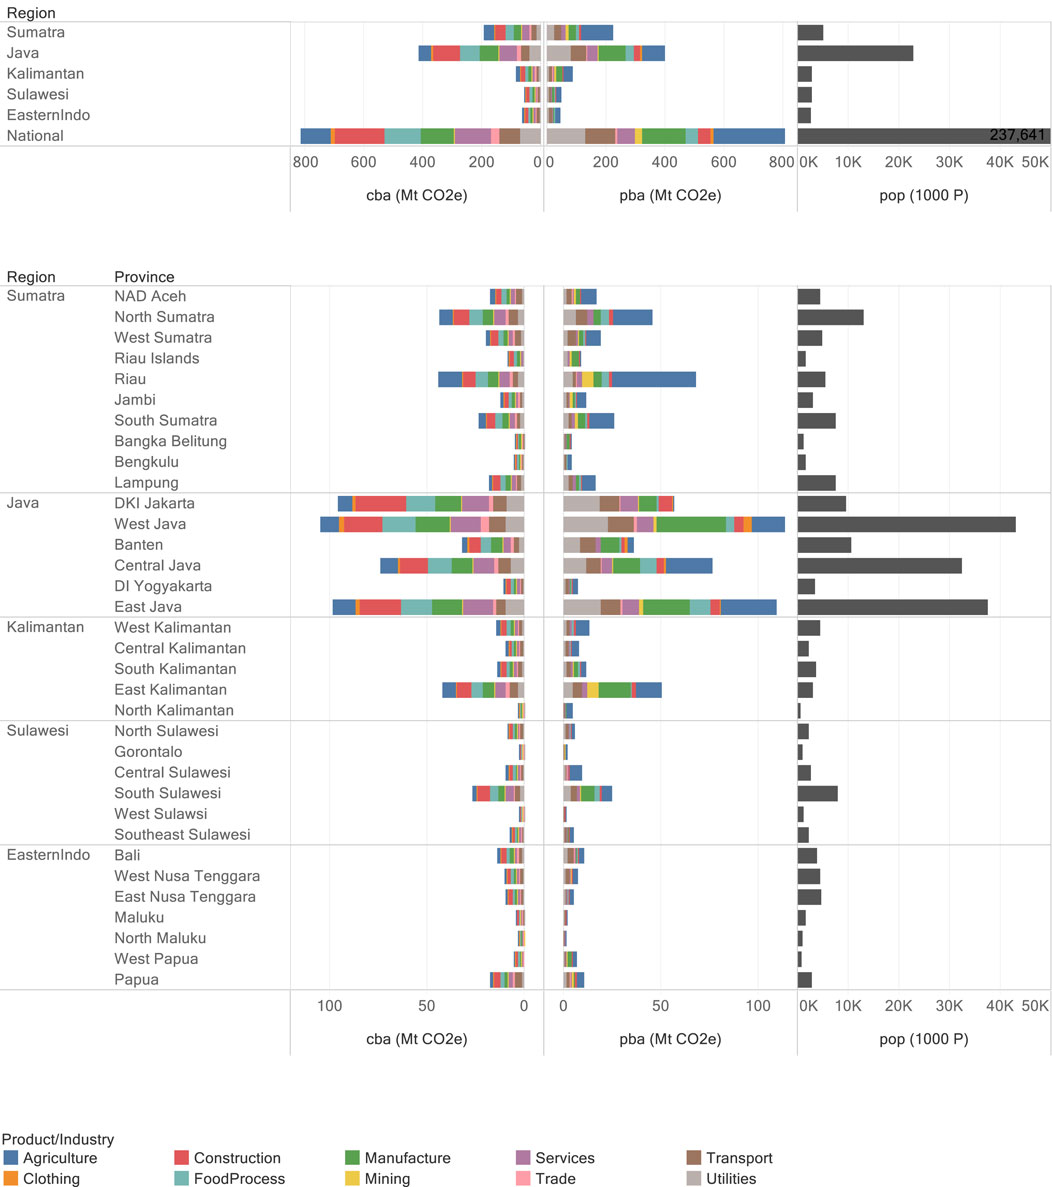
Figure 2. Contribution of carbon emissions (in Mt CO2e) by product and industry across 34 provinces in Indonesia in 2010. The left bars represent the consumption-based carbon emissions (cba) by product, the middle bars are the production-based carbon emissions (pba) by industry, and the right bars are the population (pop) by province.
3.2.1 Carbon emission by source and destination
Next, we present consumption-based and production-based carbon emissions at the provincial level. For each province, consumption-based emissions are decomposed into five sources based on the origin of the product:
1. Locally produced (within the province)
2. Produced in the Java region (imported from Java)
3. Produced in the non-Java regions (imported from non-Java regions)
4. Produced in the Asia-Pacific region (imported from Asia-Pacific region)
5. Produced in the rest of the world (imported from RoW)
Similarly, production-based emissions by province are decomposed into five sources based on the destination of the product:
1. Consumed locally (within the province)
2. Consumed in the Java region (exported to Java)
3. Consumed in the non-Java regions (exported to non-Java regions)
4. Consumed in the Asia-Pacific region (exported to Asia-Pacific region)
5. Consumed in the rest of the world (exported to RoW)
In the following paragraph, we explain these decomposed carbon emissions to highlight the key contributors to each province’s carbon emissions. The analysis will help identify which regions, provinces, products, and industries are driving the consumption- and production-based emissions.
The results are shown in Figure 1. Province-level (local) production contributes the most to national consumption-based carbon emissions (365.8 Mt CO2e, or equivalent to 45% of total). Consumption of products produced in the Java region contributes around 25% of national consumption-based carbon emissions (205.3 Mt CO2e) while consumption of products from non-Java regions contributes around 10% (85.5 Mt CO2e). Consumption of products imported from the Asia Pacific region and RoW contribute respectively around 14% and 5% to the Indonesian consumption-based carbon emissions while production of products consumed in the Asia Pacific region and RoW contributes respectively around 10% and 8% of national production-based carbon emissions. As indicated before, this implies that carbon embodied in trade (national consumption from import or production for export) accounts for 20% less of national carbon emissions.
The total consumption-based carbon emissions across the provinces vary highly from 2.8 Mt CO2e in Gorontalo to 104.8 Mt CO2e in West Java. Most provinces in the Java region are major contributors to consumption-based carbon emissions, except for Yogyakarta (10.5 Mt CO2e). Population by province obviously has a major influence here; therefore, in Section 3.3 we discuss differences in per capita carbon footprints. We further see that the sources of consumption-based carbon emissions differ a lot between provinces. For West Java, local production is responsible for 52.8 Mt CO2e of the consumption-based carbon emissions (50% of total), followed by 29.2 Mt CO2e (27.8%) from imports from Java, 16.7 Mt CO2e (16%) from imports from Asia Pacific region and 5.9 Mt CO2e (5.7%) from production in the rest of the world. For Gorontalo, only 38.3% of its total consumption-based carbon emission are produced within the province, 24.3% are from imports from the non-Java regions, and 19.2% are from imports from the Java region.
Also, the production-based carbon emissions vary highly, ranging from 1.75 Mt CO2e in North Maluku to 113.6 Mt CO2e in West Java. Three provinces in the Java region, i.e., West Java, East Java, and Central Java, contribute the most to national carbon emissions from the production side, accounting for 37.2% of the total national emissions. For West Java, consumption within the province drives 52.8 Mt CO2e (46.5% of total) of the production-based carbon emissions, while 42.2 Mt CO2e (36.3%) is related to exports to the Java region (as domestic exports), 8.5 Mt CO2e (7.5%) to exports to Asia Pacific region (as foreign exports), and 11 Mt CO2e (9.7%) to non-Asia Pacific region. For North Maluku, 54.5% of its total production-based carbon emissions are related to consumption within the province, 17.4% to export to the non-Java regions, and 16.7% to exports to the Java region.
Overall, we find that while Indonesia’s total carbon emissions are quite similar between consumption and production sides, the distribution of carbon emissions by source/destination is significantly different across provinces. There are three regions in Indonesia that have a net import of carbon emissions: Eastern Indonesia (18.8 Mt CO2e), Java (15.7 Mt CO2e), and Sulawesi (7.1 Mt CO2e). Carbon emissions from consumption in these regions exceed those from production. In contrast, Sumatra and Kalimantan regions are the net exporters of carbon emissions, by 30.5 and 5.31 Mt CO2e, respectively. Among all provinces, Jakarta is the highest net importer of carbon emissions (39.12 Mt CO2e), while Riau is the highest net exporter of carbon emissions (23.9 Mt CO2e). Jakarta is a net exporting province because the consumption-based carbon emissions imported from Java and the Asia Pacific regions exceed the production-based carbon emissions exported to those regions. The same reasons apply to Riau province. Detail consumption and production-based emissions by province can be found in Supplementary Table S3.
3.2.2 Carbon emission by product and industry
We present now carbon emissions according to ten aggregated product categories from both the consumption and production side in 34 provinces, as shown in Figure 2. The total national consumption-based carbon emissions are mostly contributed from three products: construction (169.6 Mt CO2e), food processing (124.4 Mt CO2e), and services (124.1 Mt CO2e). If we classify into three product groups, agriculture product accounts for 12.3%, manufacture product 30.6%, and services product 57.1%. This shows that services product become the main contributor to the national consumption-based carbon emissions.
There are different characteristics between regions on the product contribution. In Java region, products that contribute the most to its consumption-based carbon emissions are construction (89.9 Mt CO2e), food processing (66.9 Mt CO2e), and services (64.5 Mt CO2e) product. This is largely due to the fact that around 70% of the population lives in this region. For comparison, products that contribute the most in Sumatra region are construction (36.4 Mt CO2e), agriculture (33.3 Mt CO2e), and food processing (29.4 Mt CO2e) product. Jakarta province has the highest consumption-based carbon emissions from construction product (27.1% of total). In all province of Java, consumption of food processing and manufacture product contributes the most to carbon emissions (around 30%). Riau province has high consumption-based carbon emissions from agriculture product usage (around 27%). Consumption on transport product contribute high to its consumption-based carbon emissions in North Sulawesi and Papua (around 20%).
The total national production-based carbon emissions are mostly contributed by these industries: agriculture (243.4 Mt CO2e), manufacture (145.8 Mt CO2e), and utilities (130.7 Mt CO2e). If we classify into three industry groups, agriculture industry contributes 33%, manufacture industry 24.7%, and services industry 42%. Agriculture production is the largest contributor to its carbon emissions in Riau (63.15% of total), and followed by North Sumatra (44.7%), and East and North Kalimantan (26.9%). The manufacture production contributes to its carbon emissions in West Java (31.1%) and East Java province (21.5%). In Jakarta, utilities and services production are major contributor to production-based carbon emissions (32.6% and 15.6%, respectively).
Overall, the variation in consumption- and production-based emissions across Indonesian provinces is influenced by several key factors. For consumption-based emissions, differences in population size and consumption behavior play a crucial role. Province with larger populations, such as Jakarta, naturally have higher emissions due to the large number of people consuming goods and services. Additionally, richer provinces with higher GDP per capita exhibit increased consumption levels, resulting in higher emissions. Urbanization further intensifies these differences, as urban areas tend to consume more energy compared to rural areas. On the other hand, production-based emissions are largely determined by the distribution of natural resources, the scale and type of industries, and their regional economic structures. Provinces rich in natural resources, such as in Kalimantan, experience higher emissions due to activities like coal mining and oil extraction. Agriculture practices also play a significant role, with provinces like Riau generating high emissions from extensive palm oil cultivation and deforestation. These factors collectively explain the provincial disparities in carbon emissions, highlighting the need for tailored strategies to address specific environmental challenges of each province.
3.2.3 Consumption-based carbon emissions by final demand category
Figure 3 provides an overview of the consumption categories by final user responsible for the national consumption-based carbon emissions by type of GHG. The total national consumption-based carbon emissions consist, counted as CO2e, of 581 Mt of carbon dioxide, 168 Mt of methane, and 50.9 Mt of nitrous oxide. About 63.8% of its total emissions is related to household consumption (compared to 58% of national GDP), 14% is related to government consumption (compared to 19% share of GDP), and 21% is related to investment (compared to a 21% share of GDP). The most significant consumption categories contributing to household carbon emissions is agriculture and food processing products, accounting for nearly 36.3% of carbon emissions of household consumption. Transport by households account for 13.6%, manufacture product 14.1%, utilities 13.6% (most of it related to the direct energy consumption), trade (retail market) 4.5% and clothing 2.3%. Other services product account for 15.9% of total household carbon emissions.
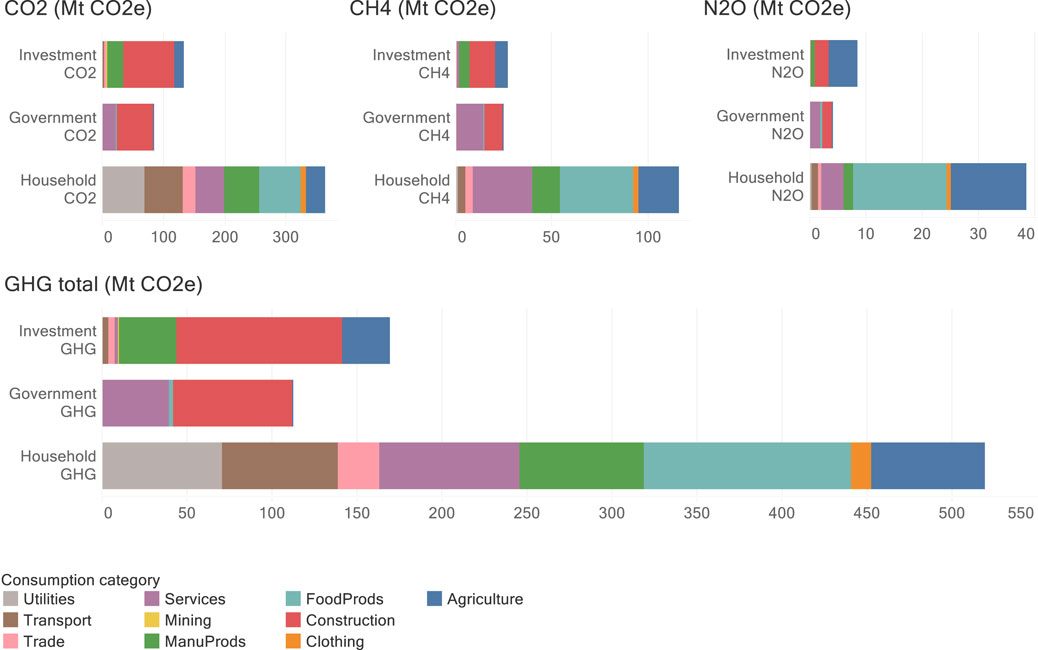
Figure 3. Distribution of national consumption-based carbon emissions (in Mt CO2e) across three emission types, three final users and 10 consumption categories in 2010. Each figure has different scale in x-axis.
For government and investment expenditure, the most significant consumption categories contributing to their carbon emissions is construction, accounts for 62.7% and 57.5%, respectively. This is due to the fact that materials used in construction activities (e.g., cement and steel) are produced in processes generating significant amounts of carbon dioxide. Detail consumption-based carbon emissions by province for different consumption categories can be found in the Supplementary Figure S2.
3.3 Carbon footprint and carbon intensity
In addition to the results presented in the previous subsection, the analysis of carbon emissions now will take into account the population and GDP in each province. For the consumption-based carbon emissions, we use the per capita carbon emissions (or carbon footprints, per person); and for the production-based carbon emissions we use the per value added carbon emissions (or carbon intensity, per Euro).
3.3.1 Provincial carbon footprint
The per capita carbon footprints by consumption category for 34 provinces are depicted in Figure 4. The national average of per capita carbon footprint is 3.42 t CO2e/capita. The carbon footprint per capita in Indonesia ranges from 2 t CO2e/capita in East Nusa Tenggara to 13.84 t CO2e/capita in East Kalimantan. Following East Kalimantan, the provinces of Jakarta and Riau have per capita carbon footprints of 9.93 and 7.94 t CO2e/capita, respectively. This is understandable given the high expenditure per capita in these provinces. As for the capital city, Jakarta’s high carbon footprint is due to the carbon footprint of construction (2.69 t CO2e/capita), food processing (1.58 t CO2e/capita), and services product (1.49 t CO2e/capita).
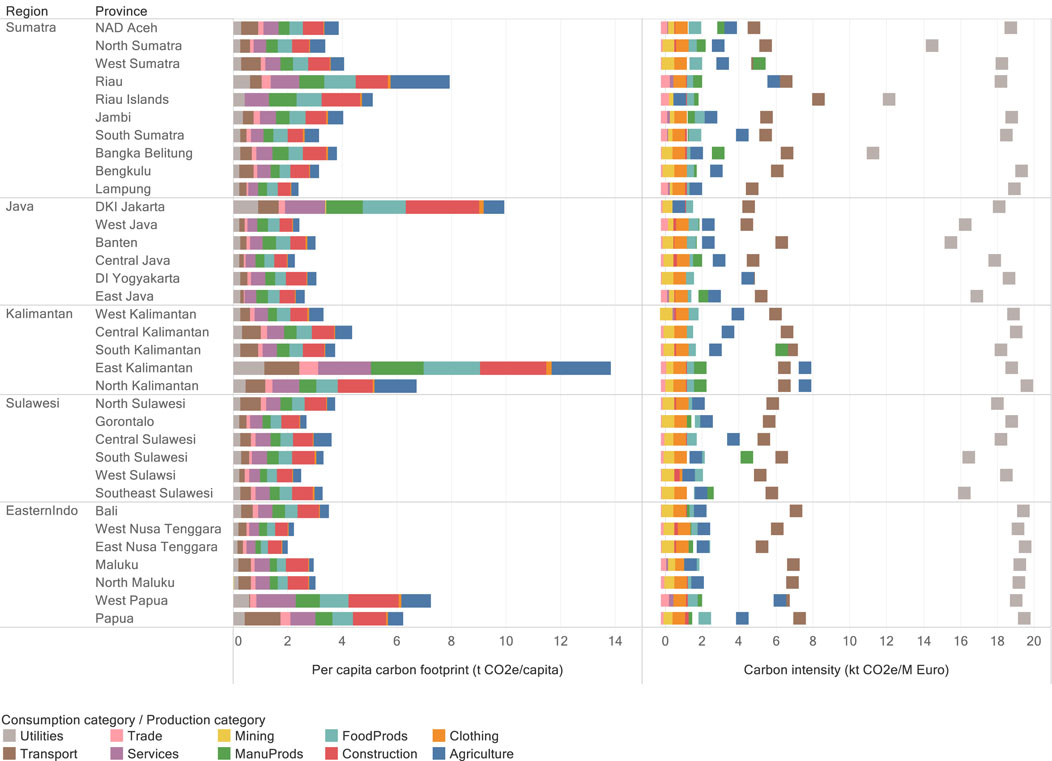
Figure 4. Contribution of per capita carbon footprint (in t CO2e/capita) by consumption category and carbon intensity (in kt CO2e/M Euro) by production category across 34 provinces in Indonesia in 2010. Carbon footprint represents the total of household, government and investment footprints and expenditures per capita.
In East Kalimantan, the high carbon footprint is contributed from construction product (2.44 t CO2e/capita), agriculture product (including estate crops and forest products, 2.17 t CO2e/capita), and food processing product (2.04 t CO2e/capita). This is largely due to extensive infrastructure projects initiated by the government and private investments, including those related to mining and estate crops likes coals and palm oil. The combination of a relatively high population and moderate expenditure (and hence low expenditure per capita) contributes to the low carbon footprint in provinces likes West Java, Central Java, and East Java, of respectively 2.43, 2.27, and 2.62 t CO2e/capita. Provinces in the Sulawesi region have a per capita carbon footprint near the national average. West Papua and Papua provinces have the highest per capita carbon footprint in the Eastern Indonesia region, with 7.26 and 6.24 t CO2e/capita, respectively.
Our analysis enables us to identify which consumption categories contribute highly to the carbon footprint by province (see Supplementary Figure S1 for a further division into household, government and capital expenditure). Provinces with the highest per capita carbon footprint from agriculture product are East Kalimantan (2.2 t CO2e/capita), Riau (2.1 t CO2e/capita), and North Kalimantan (1.5 t CO2e/capita). This is driven by per capita expenditure from households in East Kalimantan, investment in Riau, and from all final users in North Kalimantan. The provinces of Jakarta, East Kalimantan and West Papua have the highest per capita carbon footprint from construction product (2.7, 2.4, 1.8 t CO2e/capita, respectively). They are driven by per capita expenditure from government and investment. Jakarta was undergoing significant infrastructure development due to ongoing urban expansion, and the initiation of large-scale projects on public transportation systems. In East Kalimantan, major infrastructure supported the booming mining sector. Meanwhile, in West Papua, infrastructure development was crucial for improving connectivity and fostering economic growth.
For services product, provinces with the highest per capita carbon footprint are East Kalimantan (1.9 t CO2e/capita), followed by Jakarta (1.5 t CO2e/capita) and West Papua (1.4 t CO2e/capita). They are driven by per capita expenditure from household and government. For transport product, provinces with the highest per capita carbon footprint are Papua with 1.3 t CO2e/capita, followed by East Kalimantan (1.3 t CO2e/capita) and North Sumatra (1.2 t CO2e/capita). They are driven by per capita household expenditure. East Kalimantan has the highest per capita carbon footprint in utilities product (1.1 t CO2e/capita) following its high per capita household expenditure. Other products and provinces have a per capita carbon footprint of less than 1 t CO2e/capita. These variations highlight the diverse consumption patterns across Indonesian provinces. In Jakarta, the high per capita carbon footprint for service products is influenced by its large population and its status as the administrative center of Indonesia. Provinces like East Kalimantan, with significant industrial activities and high household spending on utilities and transport, also shows higher carbon footprints.
3.3.2 Provincial carbon intensity
The carbon intensity at the national level is 1.43 kt CO2e/M Euro, as shown in Figure 4. It ranges from 0.83 kt CO2e/M Euro in Jakarta to 2.37 kt CO2e/M Euro in North Kalimantan. Provinces with the highest carbon intensity are North Kalimantan, and followed by Riau (2.18 kt CO2e/M Euro), and Central Sulawesi (2.92 kt CO2e/M Euro). This is mainly caused by the relatively high carbon emissions per unit value added from agriculture (including estate crops and forest) and manufacture industry. For example, in Riau, agriculture industry has a carbon intensity of around 5.88 kt CO2e/M Euro, whereas in Central Sulawesi the manufacture industry has an intensity of around 4.41 kt CO2e/M Euro.
We see that for all provinces, the utilities and transport industries have the highest carbon intensity. At the national level, these industries have a carbon intensity of 5.33 and 17.05 kt CO2e/M Euro, respectively. The agriculture industry has 3.12 kt CO2e/M Euro, the third highest industry in carbon intensity. The carbon intensity of agriculture is very diverse, and varies highly between e.g., North Kalimantan (7.58 kt CO2e/M Euro), East Kalimantan (7.55 kt CO2e/M Euro), West Papua (6.19 kt CO2e/M Euro), and Riau (5.88 kt CO2e/M Euro) who have the highest intensities, and e.g., Sulawesi where most provinces have an intensity of agriculture of below 2 kt CO2e/M Euro. North Kalimantan, East Kalimantan, and Riau have high VA in agriculture from oil palm and logging industries which tend to be carbon intensive. The fishing industry is an important contributor to VA in agriculture for West Papua, and has relatively high carbon emissions due to the use of petrol for the fishing fleet. South Kalimantan, West Sumatra, and South Sulawesi have the highest carbon intensity in the manufacture industry (6.31, 5.11, and 4.41 kt CO2e/M Euro, respectively). South Kalimantan has a high VA from the wood and cement industries, both of which are carbon intensive. For West Sumatra, VA and emissions are mainly contributed by the textile and cements industries, and for South Sulawesi, by the cement and nickel industries. Other industries and provinces have carbon intensity of less than 1 kt CO2e/M Euro. Contributions to total VA by industry and province are shown in Supplementary Figure S2.
3.4 Measure sustainability
In this final analysis, we explore three dimensions of sustainability: environmental, economic, and social, within the scope of this study. We measure three dimensions across provinces and compared them with those of other countries. Specifically, we look at two correlations: 1) the relationship between per capita carbon footprint and expenditure, and 2) the correlation between the Human Development Index (HDI) and per capita carbon footprint.
3.4.1 Correlation between per capita carbon footprint and expenditure
Figure 5 uses plots the per capita footprint plot against the expenditure per capita. We do so for 34 Indonesian provinces, together with 43 countries and five rest of world regions in our database (Section 2). We label them as provinces on Java, other Indonesian provinces (non-Java), and other countries in the world (RoW). As also could be seen in Figures 4, 5 illustrates that carbon footprints are strongly correlated with per the capita total consumption expenditure (households, government, and investment). Higher expenditure generally leads to a higher carbon footprint, but the rate of increase varies by region. Compare to Indonesia, rest of the world regions have a more moderate increase in carbon footprints with expenditure, as seen from the more gradual slope of their trend line. From the same figure, we see that countries like Switzerland, Norway, and Luxembourg have high per capita expenditure with relatively lower increases in carbon footprints. While developing countries, like China, India, Brazil, show higher increases in carbon footprints with rising expenditure, similar to trend seen in provinces of Indonesia.
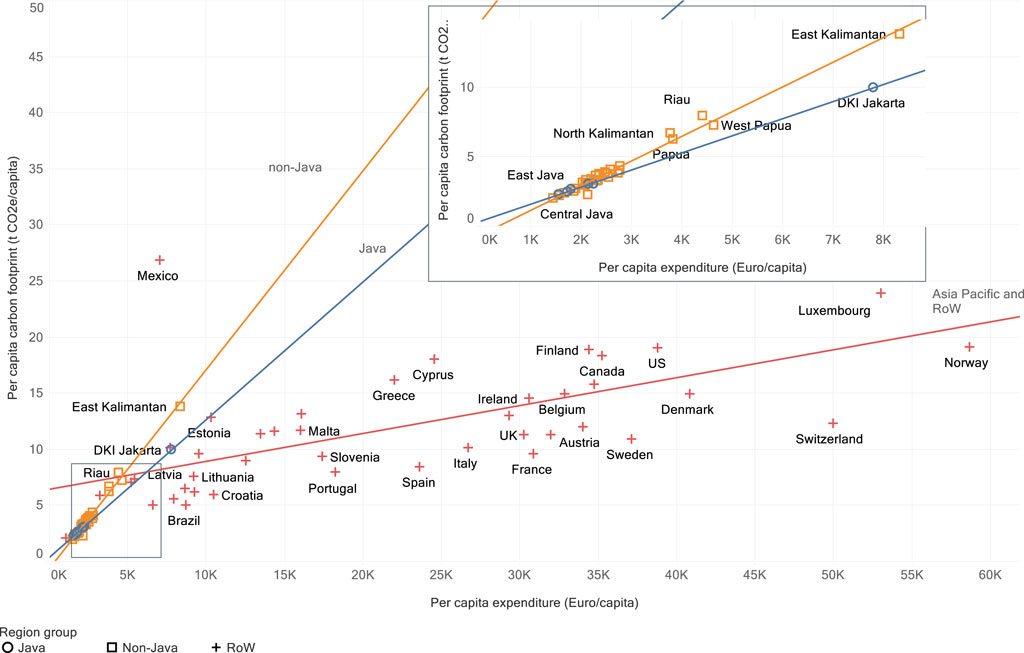
Figure 5. Linear regression for the per capita carbon footprint in Indonesia and selected countries in Asia Pacific and RoW as a function of per capita expenditure level in 2010. The blue line gives the regression for provinces on Java, the orange line for non-Java provinces, and the red line for the selected countries.
The carbon footprint and expenditure per capita of Indonesia by province are spread between 2–13.8 t CO2e/capita and 1.4–8.3 thousand Euro/capita. The regression between carbon footprint and expenditure is steeper in Indonesia as for the RoW (Figure 5), reflecting a higher per capita carbon footprint per unit of expenditure. Within Indonesia, we see that the regression for non-Java provinces is again steeper as for provinces in Java. This pattern within Indonesian regions aligns with the general pattern that emission per monetary unit tends to become lower when income per capita rises (Bjelle et al., 2021; Scherer et al., 2019). This highlights a broader view compared to the common literatures, which conclude that higher income leads to higher consumption-based emissions (Lee et al., 2020; Lévay et al., 2021).
We further calculated price elasticities of the consumption-based carbon emissions by consumption category using a regression of natural log-transformation data in Equation 9 measuring the slope in Supplementary Table S4. It shows that the correlation between carbon footprint and per capita consumption expenditure differs between consumption category and region. For total consumption,
Carbon footprint elasticities differ within Indonesia itself. For total consumption, Java has an elasticity of
3.4.2 Correlation between quality of life and carbon footprint
The Human Development Index (HDI) is used as an indicator for quality of life (UNDP, 2022). The HDI is an indicator that combines life expectancy at birth, years of schooling and Gross National Income (GNI) per capita (UNDP, 2021). Figure 6 plots the HDI for Indonesian provinces and selected countries in Asia Pacific and RoW versus per capita carbon footprint and expenditure. The figure indicates that to some extent carbon footprints and expenditure correlate with a higher HDI. At low carbon footprint levels, we see that provinces with higher per capita carbon footprints and expenditures tend to have a higher HDI. But then, as the carbon footprint and expenditure increases, the impact to HDI become smaller as the curve begins to flatten. That is when the regions in principle have the most room for reduction of emissions without loss in quality of life. In the case of Indonesia, all provinces are at lower carbon footprint levels. This indicates that for Indonesia at its current development enhancing GDP/expenditure, and with this a likely enhancement of per capita carbon footprint, is important for enhancing HDI. Using the same per capita carbon footprint and expenditure level as Java, the non-Java region has a lower quality of life than Java.
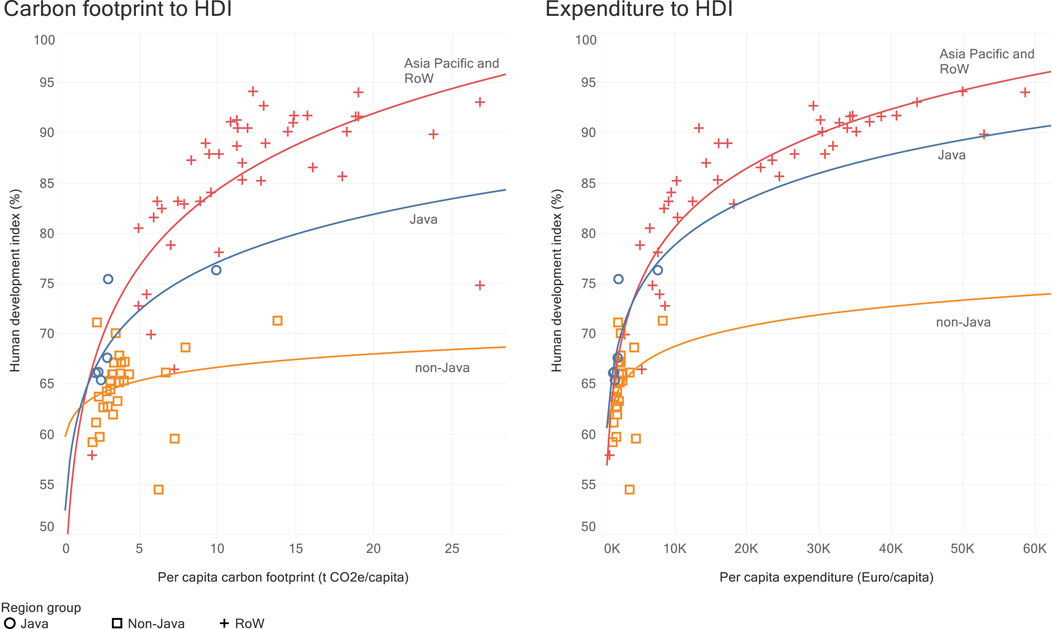
Figure 6. Log-linear regression for the Human Development Index (HDI) in Indonesia and selected countries in Asia Pacific and RoW as a function of per capita carbon footprint and expenditure. The orange line is for the non-Java regions, the blue line is for the Java region, and red line is for the selected countries.
4 Discussion and conclusion
This study undertakes a comprehensive analysis of consumption-based and production-based carbon emissions at the provincial level in Indonesia. Despite being constrained by data limitation for 2010 only, this study underscores the relevance of such sub-national assessments, for countries like Indonesia with varying development across the provinces. By mapping carbon footprints and carbon intensities and its distribution at different scales, this study has highlighted the importance of understanding underlying factors of environmental impacts. The study hence as a start shows the relevance that statistical offices gather such data, including GHG inventories using standard method like the IPCC guidelines, and further research using a very recently published province level MRIO for Indonesia for 2015 desirable.
Emissions from national production used for national consumption contribute the most to the Indonesian carbon footprints (Table 1). This is particularly observed in regions such as Java, Sumatra, and Kalimantan, where industrial activities, energy production, and agriculture practices are heavily concentrated. In these regions, local industries produce a significant portion of goods and services consumed within the country, leading to high proportion on carbon emissions.
Although the country has a small imported carbon footprints overall, trade with Asia Pacific region contributes most to Indonesian carbon footprints from foreign-imported final consumption (Figure 1). In the global context, Indonesian consumption-based carbon emissions are relatively small, particularly on a per capita basis (Figures 4, 5). This indicates that despite experiencing high economic growth (5%–6% pa in 2010), Indonesia has managed to maintain low per capita carbon footprints (3.42 t CO2e/capita in 2010), showing the potential for sustainable development as the country expands its economic activities. However, other factors also play important roles in impacting carbon footprints, such as changes in energy mix (e.g., a shift from fossil fuels to renewable) and technology advancements (e.g., energy efficiency improvement). As of 2019, Indonesia’s economic growth remains stable at a 5% rate with per capita carbon emissions around 2.2 t CO2/cap (World Bank, 2020a; World Bank, 2020b). This historical condition suggests that Indonesia’s lower per capita carbon footprints are primarily due to its relatively lower levels of industrialization and consumptions compared to developed countries.
Specific information at a detailed sector level can be used to identify provinces and products that contribute the most to carbon footprints (Figure 2). Almost a sixfold difference is observed between the provinces with the highest and the lowest per capita carbon footprints. Provinces in Java contribute the most to national carbon footprint, which are mainly driven by investments in construction sector. This finding is different from the common production approach where Java contributes most to national carbon emissions from producing manufacture products. In Jakarta, for example, carbon emissions from imported consumption exceeds carbon emissions from exported production, resulting in a higher net carbon import. This shows that Jakarta consumes more carbon-intensive goods and services from other regions and countries than it produces and exports, highlighting its role as a major economic and service sector hub, rapid urbanization and high population growth. On the other hand, Riau has a high net carbon export since carbon emissions in exports are higher as carbon emissions in imports. Riau is a significant producer and exporter of carbon-intensive products, such as palm oil (BPS, 2019), which contribute substantially to its carbon emissions.
Household consumption is the primary contributor to national carbon footprints (around 63.8% share in 2010, Figure 3), which consistent across many countries. It is intriguing to note that agriculture and food products makes a substantial contribution to Indonesia’s household carbon footprint. This result underscores the importance of considering not only production practices but also consumer behavior when addressing net zero emissions. Its prompt further study about sustainable food choices and the potential for reducing emissions through changes in dietary habits. In addition to household consumption, government and investment activities also contribute to consumption-based emissions, with construction being the main contributor to their carbon footprints.
Across ten sectors, Construction is the main contributor in the consumption-based emissions and agriculture is the one for the production-based emissions. Urban areas like Jakarta drive consumption-based emissions through infrastructure for urban development. In contrast, developing regions like Riau, with their vast agriculture activities such as palm oil cultivation, significantly contribute to production-based emissions. This different distribution between consumption and production-based emissions underscores the importance of targeted strategies for reducing emission in both consumption and production settings.
The significant positive correlation between per capita carbon footprint and expenditure differs between Java and non-Java region (Figures 5, 6). The per capita carbon footprint and expenditure are spread from 2 to 13.84 t CO2e/capita (3.42 for average) and from 1,448 to 8,331 Euro/capita (2,339 for average), lower than the world average (11.29 t CO2e/capita and 21,931 Euro/capita). The elasticity of per capita carbon footprint versus expenditure is 1.07. Within Indonesia itself, non-Java region has higher elasticity than Java. In the global context, the national elasticity in all categories is higher than the rest of the world, especially those in non-Java region. There are differences in product elasticities between provinces on Java and non-Java. Utilities and food products have higher elasticity in Java, while for non-Java, it is agriculture and transport. As the economies in the provinces continue to grow, they increase their expenditure with small increase in carbon emissions, which suggest having a lower carbon footprint per unit expenditure.
Finally, the regression analysis for HDI versus per capita expenditure and carbon footprint shows that Indonesia has still a lower HDI and lower per capita footprint and expenditure than the rest of the world (Figure 6). The regression suggests that HDI can be improved with relatively small enhancements in Indonesian expenditure and carbon footprint per capita. Since Indonesia is just starting to follow the log-linear trend, there is a possibility for the country to improve their quality of life while with slow increase in carbon footprint as their economy grow. This, however, depends on improved technology, structural changes in what people consume, and lower prices for low carbon products in Indonesia.
In conclusion, this study highlights the importance of conducting regional assessment of carbon emissions and understanding their implication for sustainable development. By providing a comprehensive analysis of consumption and production-based emissions at the provincial level, this research offers valuable insights for policymakers to formulate strategic development plans aimed to reduce carbon emissions while promoting economic growth and human development across the country. Furthermore, this study contributes to the goal of net zero emissions by identifying key areas where interventions can be most effective to reduce carbon emissions. Thus, thus study provides comprehensive insights for policymaking to formulate strategic development plans aiming to reduce carbon emissions while promoting economic growth and human development across the country.
Data availability statement
The data analyzed in this study is subject to the following licenses/restrictions: Data will be made available on request. Requests to access these datasets should be directed to aS5hLnJ1bUBjbWwubGVpZGVudW5pdi5ubA==.
Author contributions
IR: Writing–original draft, Software, Methodology, Formal Analysis, Conceptualization. AT: Writing–original draft, Writing–review and editing, Validation, Supervision, Conceptualization. RH: Writing–review and editing, Supervision. AK: Writing–review and editing, Supervision, Software. AY: Writing–review and editing, Supervision.
Funding
The authors declare that financial support was received for the research, authorship, and/or publication of this article. This research was funded by the Indonesian Endowment Fund for Education (LPDP), grant number S-870/LPDP.4/2019, Ministry of Finance, Republic of Indonesia, as a part of the first author’s doctoral scholarship at the Institute of Environmental Science (CML), Faculty of Science, Leiden University, Netherlands.
Conflict of interest
The authors declare that the research was conducted in the absence of any commercial or financial relationships that could be construed as a potential conflict of interest.
Publisher’s note
All claims expressed in this article are solely those of the authors and do not necessarily represent those of their affiliated organizations, or those of the publisher, the editors and the reviewers. Any product that may be evaluated in this article, or claim that may be made by its manufacturer, is not guaranteed or endorsed by the publisher.
Supplementary material
The Supplementary Material for this article can be found online at: https://www.frontiersin.org/articles/10.3389/fenvs.2024.1325089/full#supplementary-material
References
Bachmann, C., Roorda, M. J., and Kennedy, C. (2015). Developing a multi-scale multi-region input–output model. Econ. Syst. Res. 27 (2), 172–193. doi:10.1080/09535314.2014.987730
Bjelle, E. L., Wiebe, K. S., Többen, J., Tisserant, A., Ivanova, D., Vita, G., et al. (2021). Future changes in consumption: the income effect on greenhouse gas emissions. Energy Econ. 95, 105114. doi:10.1016/j.eneco.2021.105114
BPS (2019). Statistik perkebunan Indonesia 2018-2020: kelapa sawit. Available at: https://drive.google.com/open?id=1FVxpBNihnuB3ayAALBi-FtsBShIUxMTD.
Edens, B., Hoekstra, R., Zult, D., Lemmers, O., Wilting, H., and Wu, R. (2015). A method to create carbon footprint estimates consistent with national accounts. Econ. Syst. Res. 27 (4), 440–457. doi:10.1080/09535314.2015.1048428
Fang, K., Wang, S., He, J., Song, J., Fang, C., and Jia, X. (2021). Mapping the environmental footprints of nations partnering the Belt and Road Initiative. Resour. Conservation Recycl. 164, 105068. doi:10.1016/j.resconrec.2020.105068
Farizal, F., Amanda, T., Dachyar, M., and Noor, Z. Z. (2024). 2030 oil palm plantation carbon footprint estimation using O-LCA and forecasting. J. Clean. Prod. 463, 142646. doi:10.1016/j.jclepro.2024.142646
Fry, J., Geschke, A., Langdon, S., Lenzen, M., Li, M., Malik, A., et al. (2021). Creating multi-scale nested MRIO tables for linking localized impacts to global consumption drivers. J. Industrial Ecol. 26, 281–293. doi:10.1111/jiec.13165
Girod, B., Peter van Vurren, D., and Hertwich, E. G. (2014). Climate policy through changing consumption choices: options and obstacles for reducing greenhouse gas emissions. Glob. Environ. Change 25, 5–15. doi:10.1016/j.gloenvcha.2014.01.004
Harris, P. G., Chow, A. S. Y., and Symons, J. (2012). Greenhouse gas emissions from cities and regions: international implications revealed by Hong Kong. Energy Policy 44 (C), 416–424. doi:10.1016/j.enpol.2012.02.012
Harris, S., Weinzettel, J., Bigano, A., and Källmén, A. (2020). Low carbon cities in 2050? GHG emissions of European cities using production-based and consumption-based emission accounting methods. J. Clean. Prod. 248, 119206. doi:10.1016/j.jclepro.2019.119206
He, K., and Hertwich, E. G. (2019). The flow of embodied carbon through the economies of China, the European Union, and the United States. Resour. Conservation Recycl. 145, 190–198. doi:10.1016/j.resconrec.2019.02.016
Hertwich, E. G., and Peters, G. P. (2009). Carbon footprint of nations: a global, trade-linked analysis. Environ. Sci. and Technol. 43 (16), 6414–6420. doi:10.1021/es803496a
Imori, D., and Guilhoto, J. (2016). Tracing Brazillian regions’ CO2 emissions in domestic and global trade. TD NEREUS, 2–2016. Available at: http://www.usp.br/nereus/wp-content/uploads/TD_Nereus_02_2016.pdf.
IPCC (2007). Climate change 2007: synthesis Report. Contribution of working groups I, II and III to the fourth assessment Report of the intergovernmental panel on climate change. Available at: https://www.ipcc.ch/site/assets/uploads/2018/02/ar4_syr_full_report.pdf.
Ivanova, D., Vita, G., Steen-Olsen, K., Stadler, K., Melo, P. C., Wood, R., et al. (2017). Mapping the carbon footprint of EU regions. Environ. Res. Lett. 12 (5), 054013. doi:10.1088/1748-9326/aa6da9
Jiang, M., Behrens, P., Wang, T., Tang, Z., Yu, Y., Chen, D., et al. (2019). Provincial and sector-level material footprints in China. Proc. Natl. Acad. Sci. 116 (52), 26484–26490. doi:10.1073/pnas.1903028116
Lam, W. Y., Kulak, M., Sim, S., King, H., Huijbregts, M. A. J., and Chaplin-Kramer, R. (2019). Greenhouse gas footprints of palm oil production in Indonesia over space and time. Sci. Total Environ. 688, 827–837. doi:10.1016/j.scitotenv.2019.06.377
Lee, J., Taherzadeh, O., and Kanemoto, K. (2020). The scale and drivers of carbon footprints in households, cities and regions across India. Glob. Environ. Change 66, 102205. doi:10.1016/j.gloenvcha.2020.102205
Lévay, P. Z., Vanhille, J., Goedemé, T., and Verbist, G. (2021). The association between the carbon footprint and the socio-economic characteristics of Belgian households. Ecol. Econ. 186, 107065. doi:10.1016/j.ecolecon.2021.107065
Li, Y. L., Chen, B., and Chen, G. Q. (2020). Carbon network embodied in international trade: global structural evolution and its policy implications. Energy Policy 139, 111316. doi:10.1016/j.enpol.2020.111316
Mao, Y. (2018). Does democratic transition reduce carbon intensity? Evidence from Indonesia using the synthetic control method. Environ. Sci. Pollut. Res. 25 (20), 19908–19917. doi:10.1007/s11356-018-2165-1
Meng, B., Xue, J., Feng, K., Guan, D., and Fu, X. (2013). China’s inter-regional spillover of carbon emissions and domestic supply chains. Energy Policy 61, 1305–1321. doi:10.1016/j.enpol.2013.05.108
Meng, F., Liu, G., Hu, Y., Su, M., and Yang, Z. (2018). Urban carbon flow and structure analysis in a multi-scales economy. Energy Policy 121, 553–564. doi:10.1016/j.enpol.2018.06.044
Meng, F., Wang, D., Meng, X., Li, H., Liu, G., Yuan, Q., et al. (2022). Mapping urban energy–water–land nexus within a multiscale economy: a case study of four megacities in China. Energy 239, 122038. doi:10.1016/j.energy.2021.122038
Miller, R., and Blair, P. (2022). Input-output analysis: foundation and extensions. 3rd Edition. Cambridge: Cambridge University Press.
MoEF (2020). Sistem monitoring hutan nasional (SIMONTANA). Available at: https://nfms.menlhk.go.id.
MoEF (2021a). Indonesia long-term strategy for low carbon and climate resilience. Available at: https://unfccc.int/sites/default/files/resource/Indonesia_LTS-LCCR_2021.pdf.
MoEF (2021b). Updated nationally determined contribution republic of Indonesia. Available at: https://unfccc.int/sites/default/files/NDC/2022-06/Updated%20NDC%20Indonesia%202021%20-%20corrected%20version.pdf.
Nathaniel, S., and Khan, S. A. R. (2020). The nexus between urbanization, renewable energy, trade, and ecological footprint in ASEAN countries. J. Clean. Prod. 272, 122709. doi:10.1016/j.jclepro.2020.122709
Peters, G. P. (2008). From production-based to consumption-based national emission inventories. Ecol. Econ. 65 (1), 13–23. doi:10.1016/j.ecolecon.2007.10.014
Rum, I., De Koning, A., Tukker, A., and Yusuf, A. A. (2023). The construction of an environmentally extended multi-scale MRSUT: the case of Indonesia. Econ. Syst. Res. 36, 378–403. doi:10.1080/09535314.2023.2280888
Scherer, L., de Koning, A., and Tukker, A. (2019). BRIC and MINT countries’ environmental impacts rising despite alleviative consumption patterns. Sci. Total Environ. 665, 52–60. doi:10.1016/j.scitotenv.2019.02.103
Temurshoev, U., Miller, R. E., and Bouwmeester, M. C. (2013). A note on the gras method. Econ. Syst. Res. 25 (3), 361–367. doi:10.1080/09535314.2012.746645
Tukker, A., Bulavskaya, T., Giljum, S., de Koning, A., Lutter, S., Simas, M., et al. (2016). Environmental and resource footprints in a global context: Europe’s structural deficit in resource endowments. Glob. Environ. Change 40, 171–181. doi:10.1016/j.gloenvcha.2016.07.002
Turner, K., Munday, M., McIntyre, S., and Jensen, C. D. (2011). Incorporating jurisdiction issues into regional carbon accounts under production and consumption accounting principles. Environ. Plan. A 43 (3), 722–741. doi:10.1068/a43234
UNDP (2021). Technical notes: calculating the HDI. United nations. Available at: https://hdr.undp.org/sites/default/files/2021-22_HDR/hdr2021-22_technical_notes.pdf.
UNDP (2022). “Human development Report 2021-22,” in Human development reports (USA: United Nations). Available at: https://hdr.undp.org/content/human-development-report-2021-22.
United Nation (2018). Handbook on supply and use tables and input-output tables with extensions and applications. United Nation.
Wang, S., Wang, H., Zhang, L., and Dang, J. (2019). Provincial carbon emissions efficiency and its influencing factors in China. Sustainability 11 (8), 2355. doi:10.3390/su11082355
Wang, Y., Geschke, A., and Lenzen, M. (2015). Constructing a time series of nested multiregion input–output tables. Int. Regional Sci. Rev. 40 (5), 476–499. doi:10.1177/0160017615603596
Wang, Y., Xiong, S., and Ma, X. (2022). Carbon inequality in global trade: evidence from the mismatch between embodied carbon emissions and value added. Ecol. Econ. 195, 107398. doi:10.1016/j.ecolecon.2022.107398
Wiedmann, T. (2009). A review of recent multi-region input–output models used for consumption-based emission and resource accounting. Ecol. Econ. 69 (2), 211–222. doi:10.1016/j.ecolecon.2009.08.026
World Bank (2020a). GDP growth (annual %)—Indonesia. Available at: https://data.worldbank.org/indicator/NY.GDP.MKTP.KD.ZG?locations=ID.
World Bank (2020b). CO2 emissions (metric tons per capita)—Indonesia. Available at: https://data.worldbank.org/indicator/EN.ATM.CO2E.PC?locations=ID.
World Bank (2022). Total GHG emissions (kt of CO2 equivalent). Available at: https://data.worldbank.org/indicator/EN.ATM.GHGT.KT.CE?end=2020&locations=ID-IN-CN-RU-EU-GB-US-JP-KR-BR-MX&start=2020.
Keywords: carbon footprint, carbon intensity, regional assessment, multi-scale MRIO, HDI, Indonesia
Citation: Rum IA, Tukker A, Hoekstra R, Koning Ad and Yusuf AA (2024) Exploring carbon footprints and carbon intensities of Indonesian provinces in a domestic and global context. Front. Environ. Sci. 12:1325089. doi: 10.3389/fenvs.2024.1325089
Received: 20 October 2023; Accepted: 18 September 2024;
Published: 09 October 2024.
Edited by:
Zhen Wang, Huazhong Agricultural University, ChinaReviewed by:
Elyta Elyta, Tanjungpura University, IndonesiaKathleen Aviso, De La Salle University, Philippines
Copyright © 2024 Rum, Tukker, Hoekstra, Koning and Yusuf. This is an open-access article distributed under the terms of the Creative Commons Attribution License (CC BY). The use, distribution or reproduction in other forums is permitted, provided the original author(s) and the copyright owner(s) are credited and that the original publication in this journal is cited, in accordance with accepted academic practice. No use, distribution or reproduction is permitted which does not comply with these terms.
*Correspondence: Irlan A. Rum, YWRpeWF0bWFydW1AZ21haWwuY29t