 Shijun Chai
 Hong Qiao1
94% of researchers rate our articles as excellent or good
Learn more about the work of our research integrity team to safeguard the quality of each article we publish.
Find out more
ORIGINAL RESEARCH article
Front. Environ. Sci., 06 February 2024
Sec. Environmental Economics and Management
Volume 12 - 2024 | https://doi.org/10.3389/fenvs.2024.1324771
This article is part of the Research TopicLow-Carbon Economy and Sustainable Development: Driving Force, Synergistic Mechanism, and Implementation PathView all 21 articles
Carbon emissions reduction and population ageing are two major challenges faced by human society in the 21st century. Based on data from the China Family Panel Studies (CFPS), we investigated the impact of population ageing on carbon emissions at the household level along with the potential mechanisms of this impact. We found that households with a higher older adult population proportion and age of the household head emitted less, and these results were shown to be very robust and reliable across a series of endogeneity and robustness tests. Furthermore, population ageing contributed to carbon emission reductions for all groups; however, compared with urban households, rural households were more sensitive to population ageing. Mechanism analysis showed that population ageing can reduce household carbon emissions through more frugal life attitudes and lower future income expectations, whereas it increases carbon emissions due to weaker environmental awareness among older adults. However, overall, population ageing has a significant inhibitory effect on household carbon emissions. The findings of this study contribute to our understanding of the micro-scale mechanisms of residents’ carbon emission behaviour and provide new insights for designing targeted policies for carbon reduction from the perspective of population structure.
Climate change caused by excessive emissions of carbon dioxide has incited worldwide concern due to its potential threats to the sustainable development of human society (Zhang and Wang, 2017; Liu et al., 2020). Thus, low-carbon development has gained popularity as a climate change mitigation strategy within the international community. According to data from the Netherlands Environmental Assessment Agency, total global carbon emissions reached 33.88 billion tons in 2021, representing an increase of 5.61% from 2020. Since 2007, China has surpassed the United States as the world’s largest carbon emitter. In 2021, China’s carbon emissions reached 10.52 billion tons, accounting for 31.06% of the global total; China’s emissions were 1.87 times those of North America, 2.77 times those of Europe, and 8.15 times those of Africa. China has actively addressed the need for carbon emissions reduction through such measures as joining the Paris Agreement, Kyoto Protocol, and other international conventions. Moreover, the Chinese government has pledged to substantially reduce carbon intensity in the course of future economic development, striving to reach a carbon peak by 2030 and carbon neutrality by 2060.
Past research on carbon emissions primarily focused on industrial production. However, with the acceleration of urbanization and increase in consumerism, the household sector has become an important source of carbon emissions growth (Wang et al., 2015). Many studies have shown that direct and indirect carbon dioxide emissions from the household sector have surpassed those from the industrial sector, accounting for more than 50% of the total emissions in China (Yang and Wang, 2020), 70% in the United Kingdom (Baiocchi et al., 2010), 61% in Japan (Nansai et al., 2012), and 52% in Korea (Park and Heo, 2007). However, research on carbon emissions at the household level is limited. In another aspect, according to the Seventh National Population Census of China, by the end of 2020, the number of people over 60 and over 65 in China reached 264.02 million and 190.64 million, respectively, accounting for 18.70% and 13.50% of the total population. China has an ageing society, and the changes in income distribution and consumption characteristics caused by population ageing will likely affect the trends of Chinese household carbon emissions. Therefore, in the context of the dual pressures of an ageing and climate change, it is vital to study the impact of population ageing on household carbon emissions and the micro-scale mechanisms of this impact.
Although Many literatures have discussed the relationship between population ageing and carbon emissions, a consensus has not been reached. Menz and Welsch (2012) analysed panel datasets from 26 Organisation for Economic Co-operation and Development member countries and found that high demand for housing lighting and heating energy among elderly groups led to an increase in carbon emissions. Yang et al. (2015) determined that population ageing increased carbon emissions mainly through reducing household size. Similarly, Zhang and Tan (2016), Yu Y. et al. (2018), and Chancel (2014) analysed data from China, France, and the United States, respectively, and concluded that population ageing has a significant positive correlation with carbon emissions. In contrast, Dalton et al. (2008) determined that population ageing will reduce carbon emissions, and under the same economic conditions, the impact of age structure change (especially population ageing) on carbon emissions is even greater than that of technological progress. Additionally, based on micro-scale survey data, Liu et al. (2020) also confirmed that population ageing leads to a decrease in energy demand and carbon emissions. However, population ageing may have a complex impact on carbon emissions rather than a linear relationship. For example, using a threshold panel model, Yang and Wang (2020) found that when population ageing exceeds the threshold of 0.1274, its impact on carbon emissions changes from negative to positive. Additionally, Zhang et al. (2017) used cross-country data and confirmed an “inverted U-shaped” relationship between population ageing and carbon emissions. Moreover, empirical studies have predicted that population ageing will delay the arrival of the turning point of the environmental Kuznets curve (Maddison, 2006; Magnani and Tubb, 2010), which means that an ageing society will face a longer cycle of environmental pollution and a higher cost of environmental governance.
As a summary, previous research has mainly focused on the relationship between population ageing and carbon emissions at the national, regional or urban levels, whereas investigations at the household level are limited. Thus, past studies have not examined the differences between families and interaction of family members within a household, hindering identification of the mechanisms of and solutions for this issue. Moreover, previous studies mainly used industrial data and macroeconomic models to investigate the impact of population ageing on carbon emissions. Macro-scale data cannot directly describe the differences in carbon emissions among different individuals, and the micro-scale mechanisms of carbon emission behaviour have not been accurately identified and assessed. Therefore, we used detailed datasets from the China Family Panel Studies (CFPS) conducted in 2016, 2018, and 2020 with the aims of evaluating the impact of population ageing on carbon emissions and revealing the potential mechanisms of this impact at the micro-scale household level.
This study contributes to the literature in this field by focusing on three main aspects. First, we constructed a population ageing index at the household level from two dimensions: age structure (measured by the proportion of older adults) and life cycle (measured by the age of the head of the household), which facilitated a comprehensive micro-scale exploration of the impact of population ageing on carbon emissions. Second, unlike previous studies that only measured household carbon emissions indirectly, such as Xu and Han (2017), Zhang et al. (2019), and Liu et al. (2020), this study also considered direct carbon emissions based on household electricity and gas expenditure information. Third, we identified the potential mechanisms through which household population ageing affects carbon emissions by discerning subjective mediating factors including life attitude, future income expectations, and environmental awareness, which revealed new insights into this topic. Furthermore, we constructed a panel dataset based on the CFPS data from 2016, 2018, and 2020, which confirmed the explanatory power of the empirical results. Overall, we determined that household ageing has a considerable inhibitory effect on carbon emissions. The results of this study provide a valuable reference for targeted emission reduction policies.
The remainder of this paper is organized as follows. Section 2 presents a theoretical analysis of the effect of population ageing on household carbon emissions, based on the existing literature, along with the research hypothesis; Section 3 outlines the data, variables, and econometric models used in this study; Section 4 details the empirical results, including the baseline regression, endogeneity and robustness tests, and mechanism analysis; and Section 5 presents a summary of the main conclusions.
Bin and Dowlatabadi (2005) developed the pioneering theoretical framework of the Consumer Life Approach, which has been widely used in the analysis of household carbon footprints. Under this theoretical framework, household characteristics, individual behaviours, and the external environment affect consumption patterns by influencing consumption decision-making, thus affecting household carbon emissions. From the perspective of population ageing, due to different consumption behaviours and preferences, different age groups have different carbon emission levels. Based on previous research, we speculated that population ageing affects households carbon emissions through three main mechanisms.
The first mechanism is a person’s attitude toward life. There are marked differences between older and younger people in terms of consumption concepts, consumption habits, and life attitudes. Wang et al. (2015) suggested that the pattern of individual consumption is closely related to household carbon emissions. In general, older adults are more self-disciplined, frugal, conservative, introverted, and modest (Yu B. et al, 2018; Christis et al., 2019). Conversely, younger people are typically overconfident, lack self-restraint, overconsume, and tend to set improved living standards and quality as their primary goals; these behaviours are likely to substantially increase household carbon emissions. From a historical perspective, Liu et al. (2020) detailed that older generations experienced a difficult period, which restricted them from forming extravagant consumption patterns and helped reduce household energy demand and carbon emissions. Liu et al. (2011) also showed that the consumption habits of older adults are more rational and conservative and differ considerably from those of younger people. Furthermore, although older adults have higher energy demands for heating (Menz and Welsch, 2012), their outings tend to be more limited, and spending on food and clothing is more cautious and economical (O’neill et al., 2010; Long et al., 2013), which will reduce carbon emissions by reducing the overall scale of household consumption. Based on the above theoretical analysis, we propose the following hypothesis: Household population ageing leads to more self-disciplined and frugal attitudes towards life, contributing to a reduction in carbon emissions (H1).
The second mechanism through which population ageing affects household carbon emissions involves future income expectations. As a key driver of consumption, income plays a decisive role in household carbon emission behaviour (Sommer and Kratena, 2017). The anticipated income theory (Golley and Meng, 2012) posits that the impact of future income expectations on consumption is greater than that of current income. Compared with younger adults, older adults may lower their expectations of future income due to retirement or incapacity, which in turn affects their consumption levels and reduces household carbon emissions (Shigetomi et al., 2014). Life cycle theory (Wilson et al., 2013) states that at middle and younger ages, personal consumption is determined by wage income, and at older ages, it is mainly determined by early cumulative savings; people make intertemporal consumption decisions based on their lifetime expected income. From this perspective, consumption may not decrease with ageing. However, because older adults in China have a strong cultural incentive to bestow to their children or grandchildren, there is an age-consumption dynamic that is inconsistent with the life cycle theory (Chai et al., 2019). In summary, population ageing reduces family income, especially future income expectation, to some extent. Accordingly, we propose the following hypothesis: By lowering future income expectations, household ageing reduces the scale of household consumption expenditures, thereby reducing household carbon emissions (H2).
The third mechanism through which ageing affects carbon emissions involves environmental awareness, which is an important psychological factor that affects individual behaviour (Menz and Welsch, 2012). Environmental awareness refers to people’s internal perceptions of environmental problems and the possible environmental impact of their social activities (Kollmuss and Agyeman, 2002). According to attitude–behaviour theory (Sharma et al., 2022), the stronger an individual’s environmental awareness, the more they pay attention to environmental issues, and the higher their perceived value of low-carbon products, thereby making them more likely to engage in low-carbon environmental behaviours. In theory, people’s environmental awareness mainly depends on two aspects: cognition and emotion. From the perspective of cognition, the development of mass media has made it easier for younger people to receive information about the environment than for older people (Rebecca et al., 2018). Moreover, owing to differences in education level and growth background, younger people have stronger environmental preferences than older people and are more likely to engage in low-carbon consumption, purchase energy-saving appliances, and carry out energy-saving household renovations to reduce their carbon emissions (Lee, 2008). From the perspective of emotion, due to the long cycle and slow effect of environmental improvement, older people are less willing to engage in environmental protection than younger people. Older adults are unable to enjoy the long-term benefits of environmental improvements and lack the incentive to invest now for a high-quality environment in the future (Willis et al., 2011). Therefore, household ageing may increase tolerance for environmental degradation and weaken low-carbon environmental behaviours, thus increasing household carbon emissions. Accordingly, we propose the following hypothesis: Population ageing will increase household carbon emissions through weakening household environmental awareness (H3).
Based on the above analysis, population ageing may affect household carbon emissions through its influence on life attitude, future income expectations, and environmental awareness, but its overall impact on household carbon emissions is uncertain. Section 3 outlines the empirical analysis that we employed to verify the overall impact of population ageing on carbon emissions at the household level and the potential mechanisms of this impact.
The data used in this study were mainly obtained from the CFPS, which is a nationally representative, longitudinal survey conducted in 2016, 2018, and 2020 by the Institute of Social Science Survey of Peking University, China. The questionnaire covered three levels (individuals, families, and communities) and collected detailed information on household age structure, consumption categories, asset and debt status, income composition, and family demographic characteristics. The household sample sizes were 14,033 in 2016, 14,241 in 2018, and 11,620 in 2020. The information collected by the CFPS is both comprehensive and representative of Chinese families.
Household carbon emissions include both direct and indirect emissions. Direct carbon emissions refer to those generated by residents’ direct consumption of energy products in daily life, including electricity for lighting or other household appliances and gas for cooking, heating, and bathing. Indirect carbon emissions are emissions generated from household consumption of nonenergy goods and services and include eight categories: food; clothing; housing; daily necessities; transportation and communication; education, culture, and entertainment (ECE); medical care; and other goods and services. As residents consume various goods and services, they indirectly consume energy related to the process of producing goods and providing services, resulting in carbon emissions.
For direct carbon emissions, the CFPS collected data on annual household electricity and gas expenditures. First, we converted expenditure (yuan) into quantities (kW·h or m3). The conversion formula is as follows:
where
Furthermore, we calculated the carbon emission coefficients for electricity and gas. The carbon emission coefficient of gas,
where
To determine the indirect carbon emissions, we utilised the CFPS data for expenditure on eight categories of goods and services for sample households. Following the approach of Liu et al. (2020), we used the following formula to calculate the household indirect carbon emission coefficient:
where
To avoid overlapping calculations for direct and indirect carbon emissions, we excluded the expenditure for electricity and gas from household housing expenditures. In the above equations, the input and output data for electricity were obtained from the China Energy Statistical Yearbook (CESY) in 2016, 2018, and 2020;
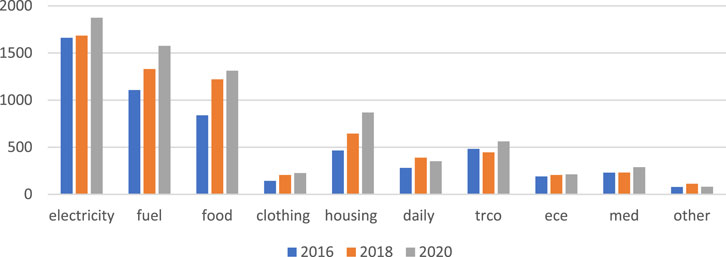
FIGURE 1. The basic situation of household CO2 emissions in China (unit: kg). Note: Electricity and gas represent direct carbon emissions; food, clothing, housing, daily, trco, ece, med, and other represent indirect carbon emissions, where “daily” refers to daily necessities, “trco” refers to transportation and communication, “ece” refers to education, culture and entertainment, “med” refers to medical care, and “other” refers to other goods and services.
To explore the impact of population ageing on carbon emissions at the household level, we measured the degree of household population ageing in two dimensions: age structure and life cycle. Following the approach of Demery and Duck (2006), we measured household age structure using the proportion of older adults (over 60 years old) within the total household population. In terms of the life cycle, we divided households into four groups based on the age of the household head: under 60, 60–65, 65–75, and over 75. Three binary variables, Age6065 (60–65 years old), Age6575 (65–75 years old), and Age75 (over 75 years old), were used to reflect the differences in carbon emission behaviour between the different age groups and the control group (under 60 years old).
Based on previous studies (Dalton et al., 2008; Zhang et al., 2019), the control variables were categorised into three groups: (1) individual variables, including gender, health status, and education level; (2) household variables, including assets and income, car ownership, marital status, social networks, and family size; and (3) regional characteristic variables, including household registration, urbanisation rate, per capita GDP, and proportion of tertiary (service) industries. Table 1 provides the definitions of the main variables, and Table 2 reports the results of the summary statistics.
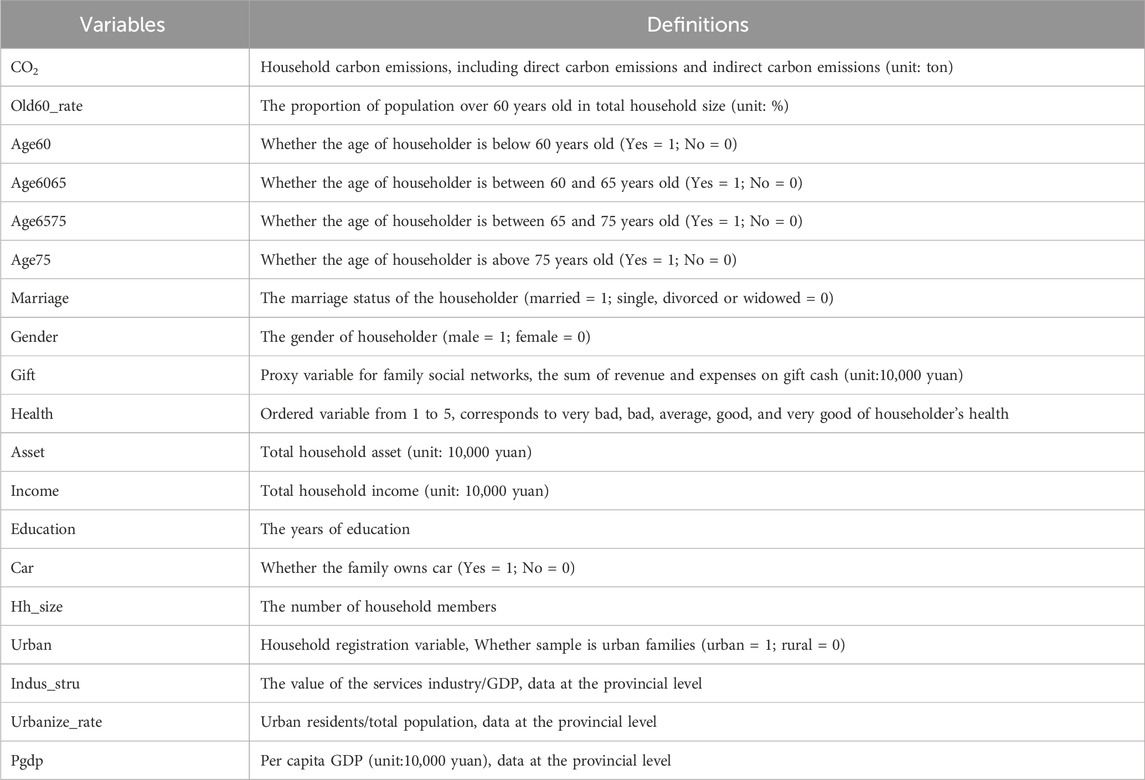
TABLE 1. Variable definition.
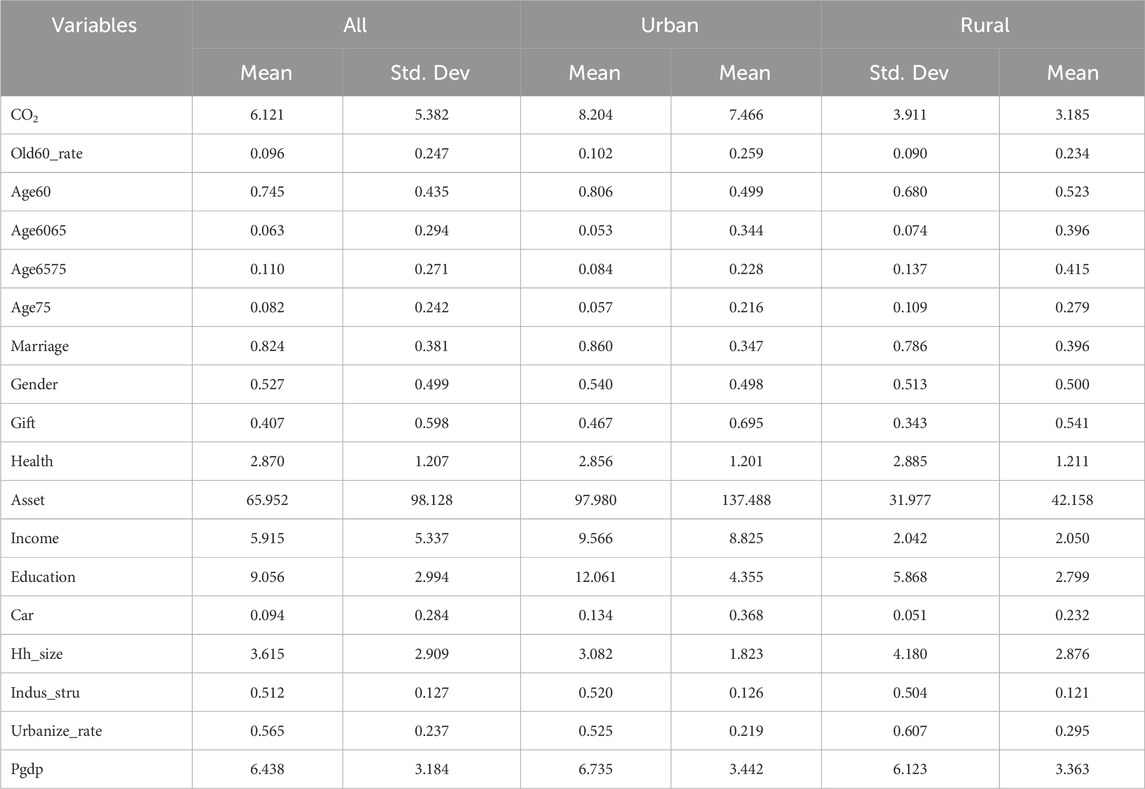
TABLE 2. Descriptive statistics.
As shown in Table 2, the average proportion of older adults (over 60 years old) within the total household population was 9.6%. Furthermore, 6.3% of the household heads were between 60 and 65 years old, 11.0% were between 65 and 75 years old, and 8.2% were over 75 years old. From the perspective of urban–rural differences, the degree of ageing of rural families was slightly higher than that of urban families, but the carbon dioxide emissions of urban families were markedly higher than those of rural families.
This study used a fixed-effects model to investigate the impact of household ageing on carbon emissions. The baseline regression model was set as follows:
where
From the perspective of empirical methods, the age structure and life cycle effects in the above parameter estimation may be biased. First, carbon emissions and the resulting air pollution affect fertility rates (Chancel, 2014; Yu B. et al., 2018), thus affecting the proportion of older adults in the population. Therefore, reverse causality may exist. Second, family age structure and carbon emission behaviour may be jointly influenced by the social environment, social preferences, and behavioural habits. However, these variables cannot be observed or controlled. Therefore, we addressed potential endogeneity problems through three methods.
The first method was to use the number of elderly activity places in the community of the sample family in the CFPS questionnaire as an instrumental variable of household ageing. The number of activity places for older adults is related to the degree of population ageing, but it does not directly affect household carbon emission behaviour. Accordingly, it may be exogenous in the determination equation of household carbon emissions.
The second method was to adopt data from the previous period as core explanatory variables. Specifically, we empirically examined the impact of population ageing in 2016 and 2018 on household carbon emissions in 2018 and 2020, respectively. One advantage of this treatment is that the household age structure can maintain relative continuity and stability over a short time span. Another is that the carbon emission activities of current residents generally do not affect the age structure of the family in previous years. Therefore, the predetermined variables have good exogeneity.
The third method was to use the first-difference model. Notably, using predetermined explanatory variables in the regression analysis can alleviate the endogeneity problems caused by reverse causation to some extent; however, endogeneity may also arise from omitted variables that simultaneously affect household age structure and carbon emission behaviours. Further, we re-estimated the effects of the ratio of the older adult population and age of the household head on household carbon emissions using the first-difference model. This treatment can better control the estimation bias arising from unobservable factors that do not change with time to satisfy the condition of
We performed a sequence of tests for robustness. First, according to the ageing criteria set by the United Nations Population Fund, we re-estimated the age structure effect using the proportion of adults aged 65 years and older within the total household population to reflect the degree of family population ageing.
Second, we substituted per capita carbon emissions for total household carbon emissions as the dependent variable.
Third, we considered intergenerational related variables in the regression model of household carbon emissions based on responses to CFPS questions, including “the amount of financial assistance you provide to your children,” “the amount of financial assistance your children provide to you,” “whether to help your children with housework and childcare,” and “whether your children help you with housework or take care of your diet and daily living.”
Fourth, we accounted for non-normalised and non-equilibrium data distribution characteristics, which are common in household survey data (Jappelli et al., 2013). Respondents are often reluctant to provide information or do not accurately answer detailed questions about consumption and expenditure because of personal privacy issues, leading to excessive measurement errors in terms of household carbon emissions. To increase accuracy, we removed samples with the highest 5% and the lowest 5% of household carbon emissions.
According to the theoretical predictions of Yu Y. et al. (2018), household population ageing can reduce carbon emissions by promoting a frugal and self-disciplined life attitude. To determine the degree of frugality, we measured the ratio of total household income to expenditures over the previous 12 months. A higher ratio indicates that households live within their means according to their financial situation and that they live more frugally. For self-discipline, we followed the approach of Savelli et al. (2017) by using the number of meals with family (evenings/week) as a measure, with a value range of 0–7. The greater the number, the stronger the respondents’ self-discipline tendencies. Based on the steps for mediation analysis proposed by Baron and Kenny (1986), we adopted a recursive model to test whether population ageing affects household carbon emissions through the mechanism of life attitude, represented by frugality and self-discipline.
Another mechanism that may influence the effect of population ageing on carbon emissions is future income expectations. The ageing of the household population can reduce carbon emissions by lowering expectations of future income. The CFPS questionnaire directly asked, “Do you think there is a good chance of improving your living standard in the future?” We used this as a proxy variable for future income expectations, with a value of 1 for “agree” and 0 for “disagree.”
In addition to life attitudes and future income expectations, household population ageing may also impact carbon emissions by affecting people’s environmental awareness, according to Sharma et al. (2022). Unfortunately, the CFPS questionnaire did not provide direct indicators of the respondents’ degree of environmental awareness. However, responses to the question “How serious do you think China’s environmental problems are?” indirectly reflected whether people have a strong awareness of environmental protection. The degree of severity was assigned on a scale of 1–10, with 1 denoting not very serious and 10 denoting very serious, which correspond to weak and strong environmental awareness, respectively.
Columns (1) and (2) of Table 3 provide the baseline regression results for the effects of age structure and life cycle on household carbon emissions, respectively. The results show that the proportion of the older adult population had a significant negative impact on household carbon emissions. Every 10% increase in the proportion of older adults (over 60 years old) in the total household population reduced carbon emissions by approximately 0.60%. A life cycle-based analysis revealed similar results: compared with young and middle-aged households (the head of the household is under 60 years old), older households emitted less carbon. Furthermore, with an increase in the age of the household head, the carbon emissions of older households gradually decreased, and the significance of the life cycle effect gradually increased. These results are consistent with the prediction of Dalton et al. (2008), based on macro-scale data, that the intensification of population ageing helps reduce carbon emissions.
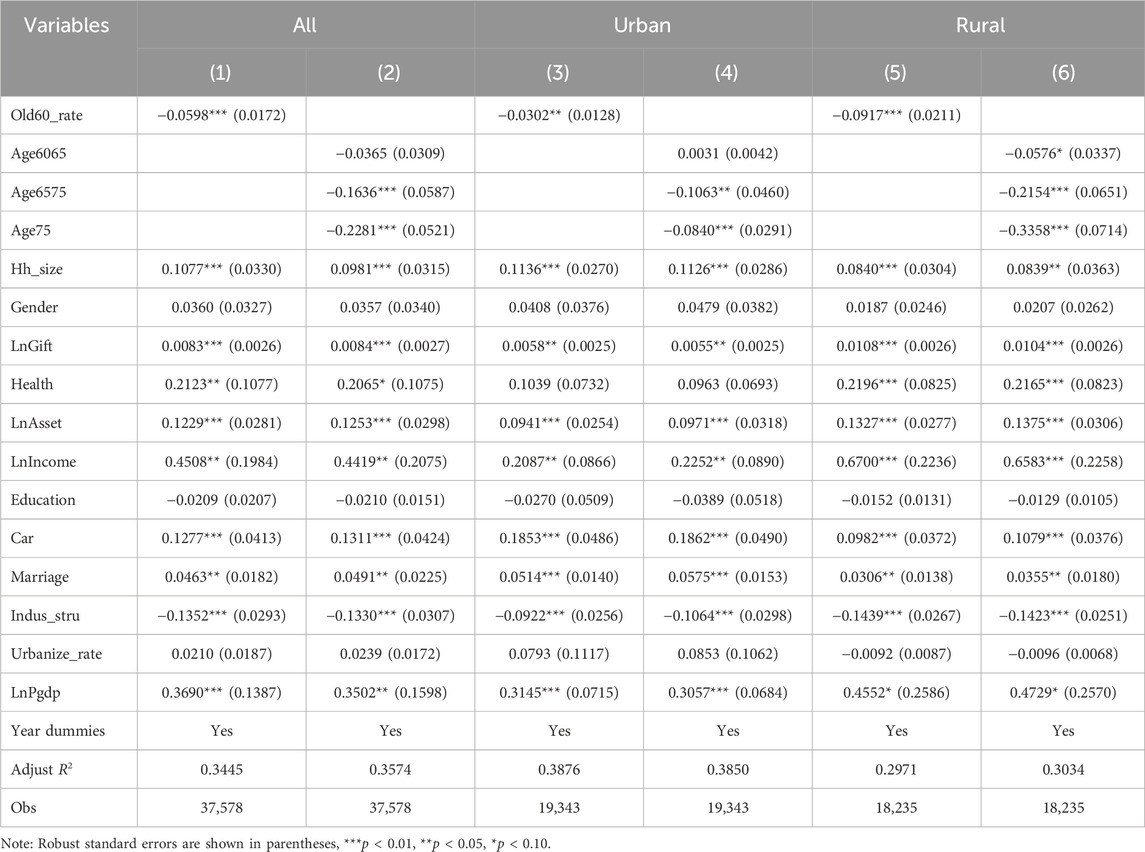
TABLE 3. Baseline estimates of household population ageing on carbon emissions: panel fixed effect.
From the perspective of urban–rural differences, the results in Columns (3), (4), (5), and (6) in Table 3 show that the impact of rural household ageing on carbon emissions was markedly higher than that of urban household ageing, regardless of the life cycle or age structure effect. A possible explanation for this variation is that the urban–rural dual pattern has long been an important feature of China’s social and economic development. Therefore, there are considerable differences between rural and urban residents in terms of consumption, savings, and other economic behaviours (Li et al., 2018). According to Fan et al. (2021) and Du et al. (2022), compared with urban older adults, rural older adults have lower wealth accumulation and future income expectations and are generally more self-disciplined, frugal, and conservative; therefore, they are more introverted and modest, and not prone to excessive consumption. Consequently, the degree of rural household ageing has a greater impact on household carbon emissions than the degree of urban household ageing.
In addition to the age of the head of the household and the proportion of the older adult population, we found that other household characteristics affected carbon emissions. First, car ownership, household size, social network, and health status of the household head had positive and significant impact on household carbon emissions, which is in accordance with Zhang X. et al. (2023). Additionally, compared to households with unmarried heads (single, divorced, or widowed), those with married household heads emitted more carbon. Second, the higher the level of household wealth and income, the higher the household carbon emissions. From the perspective of regional characteristics, households located in provinces with a lower proportion of tertiary (service) industries and higher per capita GDP emitted more carbon than their counterparts, which is consistent with the findings of previous studies (Sun et al., 2014; Zhang et al., 2014; Pan et al., 2023).
To overcome potential endogeneity problems, we used the number of elderly activity places in the community of the sample family as an instrumental variable of household ageing. Table 4 presents the results of two-stage least squares (2LSL) analysis. The first stage of instrumental variable regression showed that the number of activity places for older adults in the community was significantly positively correlated with the proportion of older adults (over 60 years old) within the total household population, which conforms to the expectation. The second stage of 2LSL analysis indicated that the F-value of the Cragg-Donald test was 34.16, exceeding the thresholds of the week IV. The p-value of the Wald test for endogeneity was 0.0344, verifying that the proportion of older adults was endogenous at the statistical level of 5%. The results of 2LSL analysis indicates that, after taking endogeneity into consideration, the regression coefficient of the Old60_rate reached −0.1162, and the marginal contribution was significantly higher than that of baseline regression.
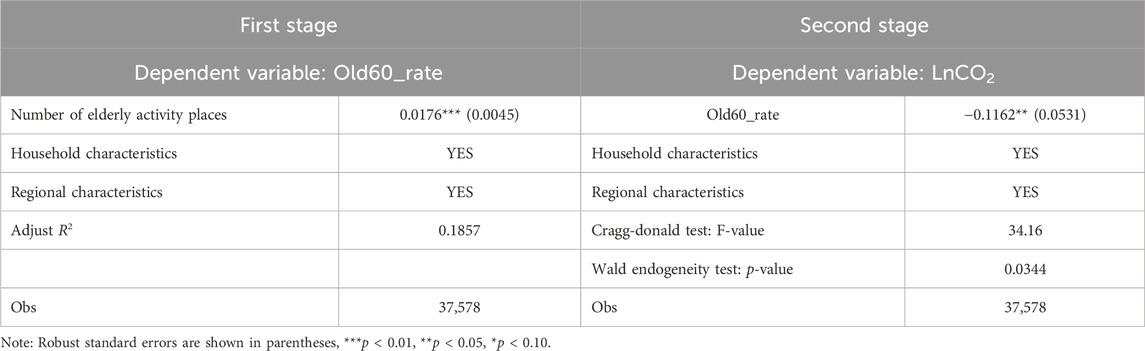
TABLE 4. Endogeneity test: instrumental variable regression.
Columns (1), (2), (3), and (4) of Table 5 display the lag regression results. The results show that although the marginal contributions of the proportion of the older adult population and the age of the household head were relatively convergent, the age structure and life cycle effects were still negative and significant. These results are consistent with those presented in Table 3, indicating the reliability of the conclusion that ageing of the household population reduces carbon emissions.
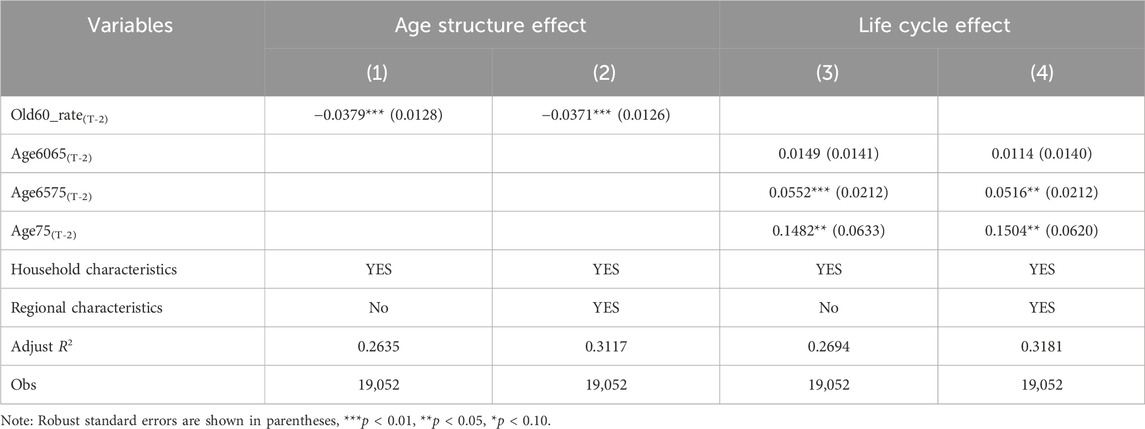
TABLE 5. Endogeneity test: lag variable regression.
The results of the first-difference model are shown in Table 6. An increasing proportion of the older adult population significantly reduced household carbon emissions, indicating that the age structure effect was valid. Compared to young and middle-aged families (the head of the household is under 60 years old), older families (the head of the household is between 65 and 75 years old or above 75 years old) emitted less carbon, which is broadly consistent with the results in Table 3.
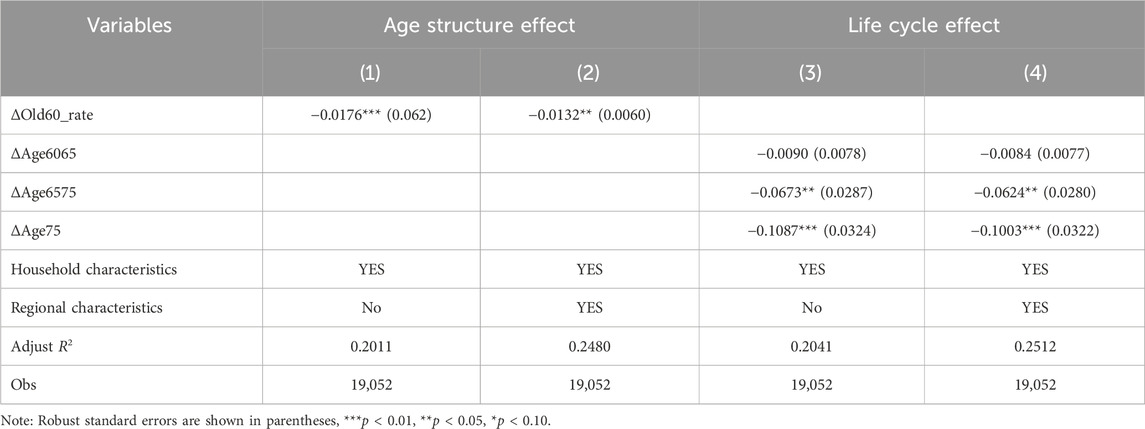
TABLE 6. Endogeneity test: first-difference model.
We performed a sequence of tests for robustness. Column (1) of Table 7 shows that the impact of the older adult population proportion on household carbon emissions was still negative and significant under the revised standard of household ageing, confirming the validity of the study results.
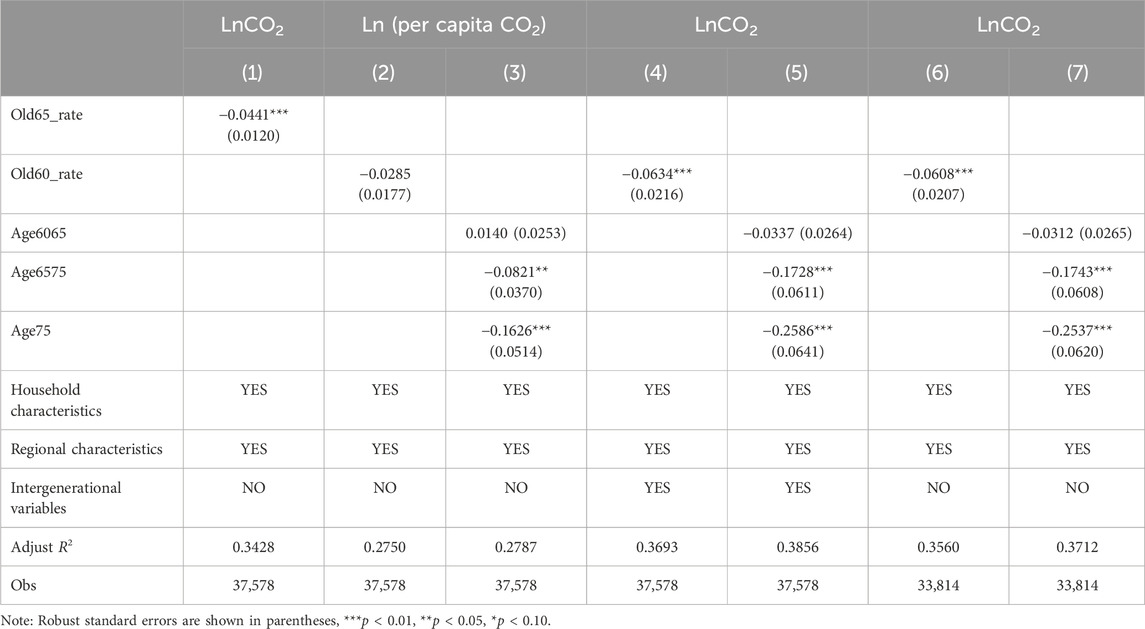
TABLE 7. The impact of household population ageing on carbon emissions: robustness test.
Columns (2) and (3) of Table 7 present the results for the dependent variable substitution. We found that the age of the household head had a significant negative correlation with per capita carbon emissions. Although the effect of the proportion of the older adult population was not significant, the marginal coefficient was negative and the t-value reached 1.6102, which is close to the critical value at the 10% level.
Columns (4) and (5) of Table 7 show that, after controlling for intergenerational related variables, the estimated coefficients of the proportion of the older adult population and the age of the household head were still significantly negative and larger than those of baseline regression shown in Table 3.
Columns (6) and (7) of Table 7 show consistent results in rejecting samples with the highest 5% and the lowest 5% of household carbon emissions. Regardless of the proportion of the older adult population or age of the household head, the impact of household ageing was still negative and significant, indicating that our main findings in the above empirical tests are robust and reliable.
The results in Columns (1) and (2) of Table 8 show that when the dependent variable was the ratio of total household income to expenditure, which measures the degree of frugality, the estimated coefficient of the older adult population proportion was positive and significant, indicating that household population ageing leads to a more frugal life attitude, which partially supports H1. However, when the dependent variable was the number of meals with family, which reflects self-discipline, the regression coefficient of the older adult population proportion was negative, contrary to H1.
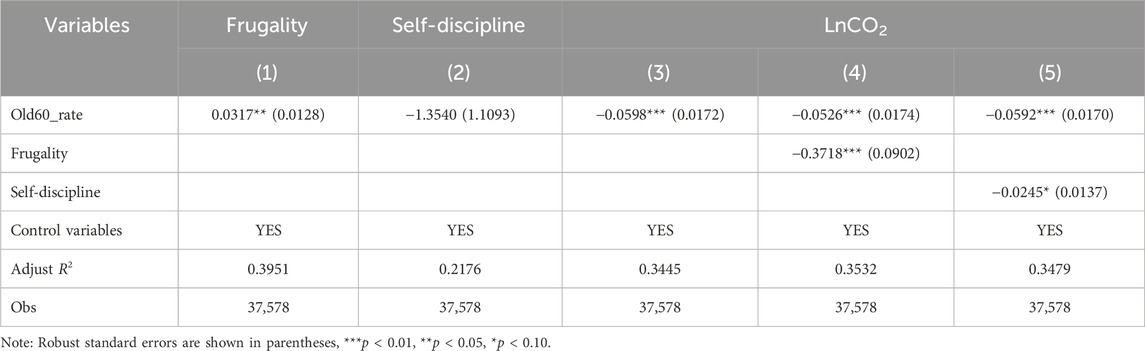
TABLE 8. The impact mechanism Ⅰ: life attitude.
The self-discipline mechanism test results may indicate a flaw in the study design. The underlying reason for the conflicting results may be that the indicator describing self-discipline in the CFPS questionnaire was insufficient. However, this does not mean that self-discipline is not directly related to the ageing of the household population. An examination of the mechanism of life attitude showed that only the premise of frugality is reasonable. Thus, we compared the changes in the model coefficients after introducing the frugality variable, and the results are shown in Columns (3) and (4) of Table 8. First, the revised model revealed that the ratio of income to expenditure was positive and significant, indicating that advocating a frugal life attitude significantly inhibits household carbon emissions. Second, the estimated coefficient of the older adult population proportion was reduced by approximately 12% compared with when the frugality variable was not introduced. In summary, the introduction of frugality weakens the inhibition effect of the older adult population proportion on household carbon emissions, indicating that household ageing leads to a frugal life attitude, and its impact on household carbon emissions is partly reflected in a more frugal attitude towards life.
Table 9 presents the results of the mediation effect test for future income expectation. As shown in Columns (1) and (2), regardless of the older adult population proportion or age of the household head, population ageing reduced the household’s future income expectations, and all variables were significant, at least at the 10% level. According to Shui and Dowlatabadi (2005), a reduction in people’s future income expectations restrains excessive household consumption through behavioural guidance and demand-driven mechanisms, thus reducing household carbon emissions. Columns (3) and (4) of Table 9 show that optimistic income expectations significantly increased household carbon emissions and simultaneously reduced the marginal contributions of the older adult population proportion and the age of the household head to household carbon emissions, which strongly supports H2. Thus, the inhibition effect of family population ageing on carbon emissions can be partially realised by lowering future income expectations.
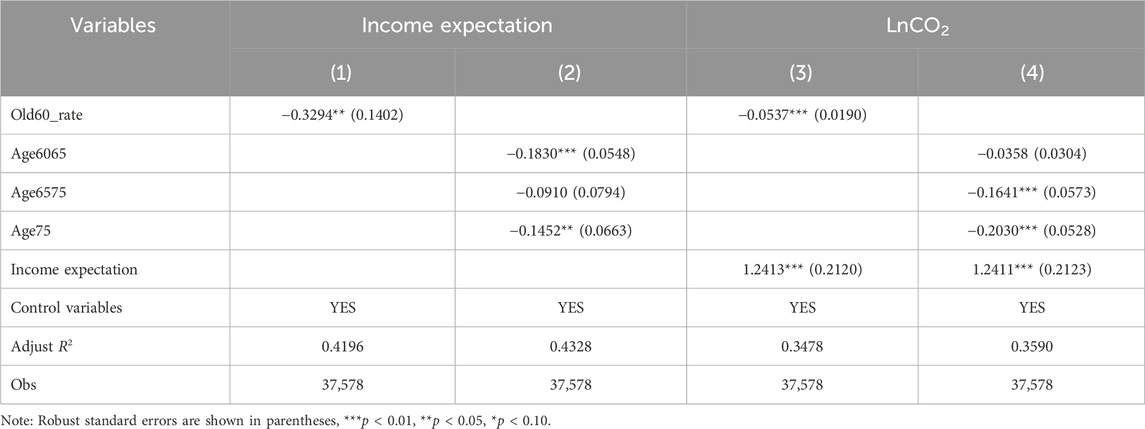
TABLE 9. The impact mechanism Ⅱ: future income expectation.
Table 10 displays the results of the mediation effect test for environmental awareness. Column (1) shows that the estimated coefficient of the older adult population proportion was negative and significant at the level of 1%, indicating that family ageing reduces environmental awareness. The results in Column (2) confirm that the environmental awareness of older households (the head of the household is 60–65, 65–75, or over 75 years old) was significantly weaker than that of young and middle-aged households (the head of the household is below 60 years old). Further, as shown in Columns (3) and (4) of Table 10, the stronger the environmental awareness, the lower the household carbon emissions. Moreover, compared with the baseline regression in Columns (1) and (2) of Table 3, although the impacts of the older adult population proportion and age of the household head on carbon emissions were still negative and significant, their marginal contributions were markedly smaller. The above results confirm the validity of the environmental awareness mechanism and verify H3.

TABLE 10. The impact mechanism Ⅲ: environmental awareness.
The relationship between population ageing and environmental change has long been an important topic in academia. Carbon emissions and the impacts of population ageing have been widely studied as essential components of the ecological environment. However, due to data limitations and technical difficulties in measuring carbon emissions, relevant research in this area is often limited to the macro level. Based on detailed household survey panel data (CFPS in 2016, 2018, and 2020), we constructed a household population ageing index from two dimensions—age structure and life cycle—and evaluated the impact of household ageing on carbon emissions at the micro level.
The results show that: (1) regardless of the life cycle or age structure effects, household population ageing significantly reduces carbon emissions; (2) compared with the impact on urban households, population ageing has a greater impact on the carbon emissions of rural households; (3) robustness and endogeneity tests, including instrumental variable regression, lag variable regression, the first-difference model, and alternative measures of independent and dependent variables, confirmed that the above conclusions are robust and reliable; and (4) population ageing can reduce household carbon emissions mainly through advocating for more frugal life attitudes and lowering future income expectations. Notably, increased carbon emissions correspond to weakening environmental awareness, which is associated with older households. However, population ageing has an overall significant inhibitory effect on household carbon emissions.
The policy implications of these empirical findings are clear. First, population ageing is a dominant long-term trend of China’s demographic structure, presenting new characteristics of the transformation from rapid ageing to accelerated ageing and from low-age ageing to high-age ageing. In this context, we should promote the low-carbon development of “silver industries” such as medicine, health, and nursing. Guided by the concepts of energy saving and emission reduction, the policy design of “silver industries” should strengthen the adaptation of relevant services to the new trend and requirements of low-carbon development while improving their suitability for an ageing population.
Second, the urban-rural differences in the impact of population ageing on household carbon emissions should be considered. With the continuous advancement of China’s urbanisation process, the size and proportion of the urban population have increased sharply, meanwhile, the trend of smaller-scale households in urban areas has become more apparent, which has greatly intensified the pressure to reduce carbon emissions. Notably, co-living in multigenerational households can promote intergenerational complementarity and resource sharing, along with reductions in consumption and carbon emissions through the optimal allocation of household resources (Zhang Y. et al., 2023). For example, multiple people living together use resources more efficiently than individuals living alone. Therefore, the government should implement differentiated emission reduction strategies for urban and rural residents, and appropriately limit the “luxury emission” of urban residents on the premise of ensuring the “survival and development emission” of rural residents.
Third, the differences in the impact paths of household ageing on carbon emissions should be considered. In contrast to the mechanisms of life attitude and future income expectations, which are helpful in promoting low-carbon behaviours, household ageing may also increase carbon emissions by weakening environmental awareness. Compared to the current generation of young people, older adults are less environmentally conscious. Therefore, low-carbon values should be promoted among older adults. The willingness and receptivity of older adults should be considered as the key factors in the publicity of low-carbon environmental protection knowledge. The government should utilise the new media era as an opportunity to expand publicity channels and use new media such as short videos to strengthen the popularisation of low-carbon environmental awareness among older adults.
The study findings provide valuable support for decision making regarding carbon emissions reduction. However, there are some limitations in the current study that should be addressed in future research. First, we only evaluated three mechanisms: life attitude, future income expectations, and environmental awareness. There may be other mechanisms, such as wealth accumulation, consumption preferences, and expenditure structure, through which population ageing affects household carbon emissions. Second, in recent years, emissions from the use of gasoline or electricity for cars have become an important aspect of household carbon emissions. Due to the lack of available data, we were unable to discern the household expenditure for gasoline or electricity for cars. Thus, future studies should consider car-related emissions in measurements of household carbon emissions.
The raw data supporting the conclusion of this article will be made available by the authors, without undue reservation.
Ethical review and approval was not required for the study on human participants in accordance with the local legislation and institutional requirements. Written informed consent from the (patients/ participants OR patients/participants legal guardian/next of kin) was not required to participate in this study in accordance with the national legislation and the institutional requirements.
SC: Conceptualization, Data curation, Formal Analysis, Software, Writing–original draft. HQ: Conceptualization, Methodology, Supervision, Writing–review and editing. YL: Data curation, Methodology, Software, Writing–review and editing.
The author(s) declare financial support was received for the research, authorship, and/or publication of this article. This work was supported by National Social Science Foundation of China (No. 23BGL205); Soft Science Project of Henan, China (No. 222400410143); Social Science Foundation of Henan, China (No. 2022BJJ071).
The authors declare that the research was conducted in the absence of any commercial or financial relationships that could be construed as a potential conflict of interest.
All claims expressed in this article are solely those of the authors and do not necessarily represent those of their affiliated organizations, or those of the publisher, the editors and the reviewers. Any product that may be evaluated in this article, or claim that may be made by its manufacturer, is not guaranteed or endorsed by the publisher.
Baiocchi, G., Minx, J., and Hubacek, K. (2010). The impact of social factors and consumer behavior on carbon dioxide emissions in the United Kingdom: a regression based on Input−Output and geodemographic consumer segmentation data. J. Industrial Ecol. 14 (1), 50–72. doi:10.1111/j.1530-9290.2009.00216.x
Baron, R., and Kenny, D. A. (1986). The moderator–mediator variable distinction in social psychological research: conceptual, strategic, and statistical considerations. J. Personality Soc. Psychol. 51 (6), 1173–1182. doi:10.1037/0022-3514.51.6.1173
Bin, S., and Downlatabadi, H. (2005). Consumer lifestyle approach to US energy use and the related CO2 emissions. Energy Policy 33 (2), 197–208. doi:10.1016/S0301-4215(03)00210-6
Chai, S. J., Chen, Y., Huang, B. H., and Ye, D. Z. (2019). Social networks and informal financial inclusion in China. Asia Pac. J. Manag. 36 (2), 529–563. doi:10.1007/s10490-017-9557-5
Chancel, L. (2014). Are younger generations higher carbon emitters than their elders? Inequalities, generations and CO2 emissions in France and in the USA. Ecol. Econ. 100, 195–207. doi:10.1016/j.ecolecon.2014.02.009
Christis, M., Breemersch, K., An, V., and Dils, E. (2019). A detailed household carbon footprint analysis using expenditure accounts—case of Flanders (Belgium). J. Clean. Prod. 228, 1167–1175. doi:10.1016/j.jclepro.2019.04.160
Dalton, M., O’neill, B., Prskawetz, A., Jiang, L., and Pitkin, J. (2008). Population aging and future carbon emissions in the United States. Energy Econ. 30 (2), 642–675. doi:10.1016/j.eneco.2006.07.002
Demery, D., and Duck, N. W. (2006). Savings-age profiles in the UK. J. Popul. Econ. 19 (3), 521–541. doi:10.1007/s00148-005-0039-6
Du, M., Zhang, X., Xia, L., Cao, L., Zhang, Z., Zhang, L., et al. (2022). The China Carbon Watch (CCW) system: a rapid accounting of household carbon emissions in China at the provincial level. Renew. Sustain. Energy Rev. 155, 111825. doi:10.1016/j.rser.2021.111825
Fan, J., Zhou, L., Zhang, Y., Shao, S., and Ma, M. (2021). How does population aging affect household carbon emissions? Evidence from Chinese urban and rural areas. Energy Econ. 100, 105356. doi:10.1016/j.eneco.2021.105356
Golley, J., and Meng, X. (2012). Income inequality and carbon dioxide emissions: the case of Chinese urban households. Energy Econ. 34, 1864–1872. doi:10.1016/j.eneco.2012.07.025
Jappelli, T., Pagano, M., and Maggio, M. D. (2013). Households’ indebtedness and financial fragility. J. Financial Manag. Mark. Institutions 1, 23–46. doi:10.12831/73631
Kollmuss, A., and Agyeman, J. (2002). Mind the gap: why do people act environmentally and what are the barriers to pro-environmental behavior? Environ. Educ. Res. 8 (3), 239–260. doi:10.1080/13504620220145401
Lee, K. (2008). Opportunities for green marketing: young consumers. Mark. Intell. Plan. 26 (6), 573–586. doi:10.1108/02634500810902839
Li, W., Qi, X., and Zhao, X. (2018). Impact of population aging on carbon emission in China: a panel data analysis. Sustainability 10 (7), 2458. doi:10.3390/su10072458
Liu, L. C., Wu, G., Wang, J. N., and Wei, Y. M. (2011). China’s carbon emissions from urban and rural households during 1992–2007. J. Clean. Prod. 19 (15), 1754–1762. doi:10.1016/j.jclepro.2011.06.011
Liu, Y., Zhang, M., and Liu, R. (2020). The impact of income inequality on carbon emissions in China: a household-level analysis. Sustainability 12 (7), 2715. doi:10.3390/su12072715
Long, L., Wu, W., Lal, R., and Guo, Y. (2013). Structural change and carbon emission of rural household energy consumption in Huantai, northern China. Renew. Sustain. Energy Rev. 28, 767–776. doi:10.1016/j.rser.2013.07.041
Maddison, D. (2006). Environmental kuznets curves: a spatial econometric approach. J. Environ. Econ. Manag. 51 (2), 218–230. doi:10.1016/j.jeem.2005.07.002
Magnani, E., and Tubb, A. (2010). The link between economic growth and environmental quality: what is role of demographic change? Int. J. Glob. Environ. Issue 8 (4), 365–391. doi:10.1504/IJGENVI.2008.019370
Menz, T., and Welsch, H. (2012). Population aging and carbon emissions in OECD countries: accounting for life-cycle and cohort effects. Energy Econ. 34 (3), 842–849. doi:10.1016/j.eneco.2011.07.016
Nansai, K., Kondo, Y., Kagawa, S., Suh, S., Nakajima, K., Inaba, R., et al. (2012). Estimates of embodied global energy and air-emission intensities of Japanese products for building a Japanese input–output life cycle assessment database with a global system boundary. Environ. Sci. Technol. 46 (16), 9146–9154. doi:10.1021/es2043257
O’neill, B. C., Dalton, M., Fuchs, R., Jiang, L., Pachauri, S., and Zigova, K. (2010). Global demographic trends and future carbon emissions. Proc. Natl. Acad. Sci. 107 (41), 17521–17526. doi:10.1073/PNAS.1004581107
Pan, H., Page, J., Shi, R., Cong, C., Cai, Z., Barthel, S., et al. (2023). Contribution of prioritized urban nature-based solutions allocation to carbon neutrality. Nat. Clim. Change 13, 862–870. doi:10.1038/s41558-023-01737-x
Park, H. C., and Heo, E. (2007). The direct and indirect household energy requirenments in the Republic of Korea from 1980 to 2000: an input-output analysis. Energy Policy 35 (5), 2839–2851. doi:10.1016/j.enpol.2006.10.002
Rebecca, B. R., Wilde, P. E., Michele, V. P., Christine, C., and Cash, S. B. (2018). A comprehensive life cycle assessment of greenhouse gas emissions from U.S. household food choices. Food Policy 79, 67–76. doi:10.1016/j.foodpol.2018.05.004
Savelli, E., Murmura, F., Liberatore, L., Casolani, N., and Bravi, L. (2017). Food habits and attitudes towards food quality among young students. Int. J. Qual. Serv. Sci. 9 (3/4), 456–468. doi:10.1108/IJQSS-02-2017-0011
Sharma, N., Paco, A., and Kautish, P. (2022). The impact of eco-innovation on green buying behaviour: the moderating effect of emotional loyalty and generation. Manag. Environ. Qual. Int. J. 33 (4), 1026–1045. doi:10.1108/MEQ-11-2021-0267
Shigetomi, Y., Nansai, K., Kagawa, S., and Tohno, S. (2014). Changes in the carbon footprint of Japanese households in an aging society. Environ. Sci. Technol. 48 (11), 6069–6080. doi:10.1021/es404939d
Shui, B., and Dowlatabadi, H. (2005). Consumer lifestyle approach to US energy use and the related CO2 emissions. Energy Policy 33 (2), 197–208. doi:10.1016/S0301-4215(03)00210-6
Sommer, M., and Kratena, K. (2017). The carbon footprint of European households and income distribution. Ecol. Econ. 136, 62–72. doi:10.1016/j.ecolecon.2016.12.008
Sun, C., Ouyang, X., Cai, H., Luo, Z., and Li, A. (2014). Household pathway selection of energy consumption during urbanization process in China. Energy Convers. Manag. 84, 295–304. doi:10.1016/j.enconman.2014.04.038
Wang, Z., Liu, W., and Yin, J. (2015). Driving forces of indirect carbon emissions from household consumption in China: an input-output decomposition analysis. Nat. Hazards 75 (2), 257–272. doi:10.1007/s11069-014-1114-7
Willis, K., Scarpa, R., Gilroy, R., and Hamza, N. (2011). Renewable energy adoption in an ageing population: heterogeneity in preferences for micro-generation technology adoption. Energy Policy 39 (10), 6021–6029. doi:10.1016/j.enpol.2011.06.066
Wilson, J., Tyedmers, P., and Spinney, J. E. L. (2013). An exploration of the relationship between socioeconomic and well-being variables and household greenhouse gas emissions. J. Ind. Ecol. 17 (6), 880–891. doi:10.1111/jiec.12057
Xu, X., and Han, L. (2017). Diverse effects of consumer credit on household carbon emissions at quantiles: evidence from urban China. Sustainability 9 (9), 1563. doi:10.3390/su9091563
Yang, T., and Wang, Q. (2020). The nonlinear effect of population aging on carbon emission: empirical analysis of ten selected provinces in China. Sci. Total Environ. 740, 140057. doi:10.1016/j.scitotenv.2020.140057
Yang, Y., Zhao, T., Wang, Y., and Shi, Z. (2015). Research on impacts of population-related factors on carbon emissions in Beijing from 1984 to 2012. Environ. Impact Assess. Rev. 55 (1), 45–53. doi:10.1016/j.eiar.2015.06.007
Yu, B., Wei, Y., Kei, G., and Matsuoka, Y. (2018a). Future scenarios for energy consumption and carbon emissions due to demographic transitions in Chinese households. Nat. Energy 3, 109–118. doi:10.1038/s41560-017-0053-4
Yu, Y., Deng, Y., and Chen, F. (2018b). Impact of population aging and industrial structure on CO2 emissions and emissions trend prediction in China. Atmos. Pollut. Res. 9, 446–454. doi:10.1016/j.apr.2017.11.008
Zhang, C., and Tan, Z. (2016). The relationships between population factors and China’s carbon emissions: does population aging matter? Renew. Sustain. Energy Rev. 65, 1018–1025. doi:10.1016/j.rser.2016.06.083
Zhang, H., Zhang, L., Wang, K., and Shi, X. (2019). Unveiling key drivers of indirect carbon emissions of Chinese older households. Sustainability 11 (20), 5740. doi:10.3390/su11205740
Zhang, L., Wang, C., and Bahaj, A. (2014). Carbon emissions by rural energy in China. Renew. Energy 66, 641–649. doi:10.1016/j.renene.2014.01.005
Zhang, X., Wang, J., Pan, H., Yuan, Z., and Feng, K. (2023a). Changes in the socio-economic characteristics of households can decouple carbon emissions and consumption growth in China. Sustain. Prod. Consum. 43, 168–180. doi:10.1016/j.spc.2023.10.019
Zhang, X., and Wang, Y. (2017). How to reduce household carbon emissions: a review of experience and policy design considerations. Energy Policy 102, 116–124. doi:10.1016/j.enpol.2016.12.010
Zhang, Y., Bian, X., Tan, W., and Song, J. (2017). The indirect energy consumption and CO2 emission caused by household consumption in China: an analysis based on the input-output method. J. Clean. Prod. 163 (10), 69–83. doi:10.1016/j.jclepro.2015.08.044
Keywords: population ageing, household carbon emissions, life attitude, environmental awareness, future income expectation
Citation: Chai S, Qiao H and Li Y (2024) Impact of household population ageing on carbon emissions: micro-scale evidence from China. Front. Environ. Sci. 12:1324771. doi: 10.3389/fenvs.2024.1324771
Received: 20 October 2023; Accepted: 17 January 2024;
Published: 06 February 2024.
Edited by:
Wang Pei, Nanjing Agricultural University, ChinaReviewed by:
Haozhi Pan, Shanghai Jiao Tong University, ChinaCopyright © 2024 Chai, Qiao and Li. This is an open-access article distributed under the terms of the Creative Commons Attribution License (CC BY). The use, distribution or reproduction in other forums is permitted, provided the original author(s) and the copyright owner(s) are credited and that the original publication in this journal is cited, in accordance with accepted academic practice. No use, distribution or reproduction is permitted which does not comply with these terms.
*Correspondence: Shijun Chai, MjAyMTIxNzdAaHVhbmdodWFpLmVkdS5jbg==
Disclaimer: All claims expressed in this article are solely those of the authors and do not necessarily represent those of their affiliated organizations, or those of the publisher, the editors and the reviewers. Any product that may be evaluated in this article or claim that may be made by its manufacturer is not guaranteed or endorsed by the publisher.
Research integrity at Frontiers
Learn more about the work of our research integrity team to safeguard the quality of each article we publish.