 Iwona Bąk
 Katarzyna Wawrzyniak
 Piotr Sulikowski
- 1Department of Applied Mathematics in Economics, Faculty of Economics, West Pomeranian University of Technology, Szczecin, Poland
- 2Department of Information Systems Engineering, Faculty of Computer Science and Information Technology, West Pomeranian University of Technology, Szczecin, Poland
EU Member States must implement environmental policy in accordance with the specified rules, including standards supporting the implementation of the adopted EU policies. The standards (target values) for the levels of environmental indicators are included in EU directives. Compliance with EU environmental standards is already bringing many benefits, but there is still much to be done. The aim of our study is to assess the current levels of environmental indicators in EU countries, since prompt achievement of their target values is a prerequisite for sustainable development in this area. A classical correspondence analysis was used to evaluate the degree of differentiation of the levels of indicators in the EU countries based on the data presented in a binary matrix of indicators. As a result, countries have been identified in which indicators monitoring the state of environmental protection have achieved a level in line with the target values indicated in EU directives, and those in which this level has not been achieved. The research procedure used in the article is universal in the sense that it can be used to assess the situation of the objects under study (countries, regions) regardless of the specifics of the phenomenon under study, provided that comparable data are available.
1 Introduction
Environmental security issues are at the heart of the ongoing social, political and economic debates around the world (Wang et al., 2021). The fundamental instrument for ensuring environmental safety is the law. In the European Union, environmental issues are being given increasing priority, and environmental law is one of the fastest-growing branches of European law. Apart from addressing issues such as clean water and air and the protection of endangered species, environmental regulation is becoming an increasingly important issue, not only in economic terms but above all in terms of the health of populations.
A common environmental policy has been slowly emerging since the early 1970s. The first action program was adopted in 1973 (covering the period 1973–1977) and laid down environmental quality limit values, particularly for water and air. More legislation, regulations, programmes and joint initiatives were added in the following years. In 1990, the European Environment Agency (EEA) was established to support the development, implementation and evaluation of environmental policy and inform the public. Currently, the environmental policy and solutions to improve the environment are implemented based on The Treaty on the Functioning of the European Union (2012). , which contains 3 articles (191, 192 and 193) directly addressing environmental issues.
The EU’s multi-annual environmental programmes provide a framework for future action in all areas of environmental policy. EU Member States must implement environmental policy in accordance with the specified rules, including standards supporting the implementation of the adopted EU policies (Peeters and Misonne, 2022; de Sadeleer, 2023). At present, environmental policy is regarded by the European Union as an integral part of its policy for sustainable development. Compliance with EU environmental standards is already bringing many benefits, but there is still much to be done. The report of the European Environment Agency (EEA) (SOER, 2020) identified severe discrepancies between the state of the environment and the short-term and long-term policy objectives of the Union. However, it was found that there is still a chance to achieve the long-term objectives adopted for 2030 and 2050. Recent trends indicate a slowdown in progress in areas such as reducing greenhouse gas emissions, industrial emissions and waste generation, improving energy efficiency and the share of renewable energy. In terms of human health, climate change, air pollution, noise pollution, and the risks associated with using hazardous chemicals remain a source of concern.
The aim of our study is to assess the levels of indicators related to environmental protection in the European Union. Achieving their target values in individual countries as soon as possible is a necessary condition for sustainable development in this area. As a result of the study, EU countries have been identified in which indicators monitoring the state of the environment have achieved a level in line with the target value, and those in which this level has not been achieved. That will enable a detailed analysis of the reasons for the current situation.
A classical correspondence analysis based on the data presented in a binary matrix of indicators was used to assess the compliance of the levels of indicators with the target values resulting from the EU directives. The choice of the research method is not accidental. It is intended to draw attention to the fact that in this method, from the beginning (the creation of a binary matrix of indicators) to the end (the interpretation of relations between categories of surveyed variables), a two-element diagnosis process is implemented, i.e., the comparison of the actual level of indicators monitoring the state of environmental protection in EU countries (observed pattern) with their values resulting from EU directives/strategies (normative pattern) (Mojsiewicz and Wawrzyniak, 2007; Wawrzyniak, 2013). This type of approach is used for the first time in this study. It thus fills an existing gap in research related to implementing a strategy to protect the environment for present and future generations following the principles of sustainable development.
The study was conducted on the basis of data on Sustainable Development Goals (SDGs), among others in European Union countries available at Eurostat. The structure of this paper includes an introduction, which presents the main purpose of the paper and explains the authors’ main motivations for researching the degree of implementation of EU environmental directives in EU countries. Subsequently, the literature on environmental protection, an essential element of sustainable development, was reviewed. Then the following section presents the statistical data used in the study and describes the research procedure followed in the paper. The article is concluded by presenting the research results and the discussion and conclusions derived from the study.
2 Literature review
The European Union has made environmental protection one of its policy priorities for many years (Goncalves, 2023). First of all, attention is drawn to the importance of the impact of the environment on the health and the quality of life of the population and the harmful effects of negligence in this area. The EU has some of the highest environmental standards in the world that have been developed over decades. EU environmental law has been evolving since the early 1970s. Several hundred directives, regulations and decisions are currently in force in this area. The EU’s multi-annual environmental programmes provide a framework for future action in all areas of environmental policy. A way to ensure harmony between economic growth, in purely economic terms, and environmental improvement is the concept of sustainable development (Robinson, 2004; Kates et al., 2005; Adams, 2009; Stibbe, 2009; Blewitt, 2015). It emerged as a response to environmental threats caused by excessive economic development linked to widespread exploitation of natural resources. Its guiding principle is not only the living conditions of the current generation but also of the next ones (Pezzey and Toman, 2002).
The principles of sustainable development are raised in many international agreements and other legal acts and the activities of the UN Sustainable Development Committee. These include, for example, The United Nations Stockholm Conference and the adoption of the so-called Stockholm Declaration, in which environmental protection was recognised as one of the key functions of the state (1972), the adoption of the World Charter of Nature by the UN General Assembly (1982). Another example is the Earth Summit in Rio de Janeiro (1992), when the Rio Declaration on Environment and Development was signed by all states (179 countries) participating in the conference, and Agenda 21 - a programme to implement actions for sustainable development at global, regional and local levels. In 2001, the Council of Europe adopted the European Union Sustainable Development Strategy in Gothenburg - as a complement to the Lisbon Strategy - and developed it further in 2006. The strategy aims to ensure sustainable economic growth, quality of life, intergenerational and intergenerational justice, coherence of all economic (sectoral) policies, environmental security and spatial governance. The EU sustainable development strategy also points to the need for integration between economic development - social cohesion - environmental protection.
One of the milestones in the European Union’s climate policy was the adoption by the European Council of the so-called 3 × 20 energy and climate package in 2007. It addressed three main objectives:
• to reduce greenhouse gas emissions by 20% (base year: 1990);
• to increase the share of renewable energy sources in the total EU energy consumption to 20%;
• to increase energy efficiency by 20% (European Council, 2007).
On the other hand, in December 2019, the Commission presented the idea of a European Green Deal (EGD), a package of measures to increase the level of greenhouse gas emission reductions by 2030 and reduce the EU economy’s carbon footprint by 2050, in line with the commitments made under the Paris Agreement. To put the EU on a sustainable path towards carbon neutrality by 2050, in April 2021, the Commission agreed to raise the level of climate standards under the target to reduce greenhouse gas emissions from 40% to 55% by 2030 compared to 1990 levels. According to Sikora, (2021), measures under the EGD could significantly impact the functioning of a number of important areas in EU countries, such as emissions trading, taxation, agriculture, energy and transport, and biodiversity.
Based on the international law on sustainable development, it can be concluded that sustainable development is achieved by adopting the right to a healthy and creative life in harmony with nature. Detailed solutions in various legal systems focus around this concept and principle, seeking a balance between environmental protection, the need to exert influence on the environment, and the need to obtain environmental resources. The principle of sustainable development thus concentrates on finding normative solutions that reconcile legally protected values in conflict with each other while simultaneously considering the needs of future generations.
The EU is empowered to act in all environmental policy areas such as air and water pollution, waste management and climate change. It is guaranteed by Articles 11 and 191–193 of the Treaty on the Functioning of the European Union (2012). European standards contribute to achieving the SDGs and help enterprises move toward a circular, low-carbon and climate-resilient economy. EU environmental policies and legislation protect natural habitats, clean air and water, ensure adequate waste treatment, improve knowledge of toxic substances, and help businesses move to a sustainable economy.
Although EU environmental and climate policy has brought significant benefits in recent years, Europe is still facing problems in areas such as biodiversity loss, resource use, climate change impacts and environmental risks to health and quality of life (SOER, 2020). The implementation of EU policies supports the standards set out in the legal acts, becoming an important tool in support of environmental protection.
The World Health Organization states that air pollution is the most significant health risk. In EU countries, it causes some 4,00,000 premature deaths and hundreds of billions of euros in health (Air pollution, 2018). Most of these premature deaths are caused by particulate matter, nitrogen dioxide and ground-level ozone. The protection of air against pollution is, therefore, the central area of the broader concept of environmental protection (Luo et al., 2022). The European Union Register lists as many as 230 existing legislation in the sub-group “Monitoring Air pollution”, the largest sub-groups in the “Environment”1 sector. The main ones are the directive on national emission levels, which aims to reduce total emissions (Directive EU, 2016/2284, 2016); the directive on industrial emissions (Directive, 2010/75/EU, 2010); the directive on the limitation of emissions of certain pollutants into the air from medium combustion plants (Directive EU, 2015/2193, 2015); the regulation on emissions from passenger and commercial vehicles (Regulation EC No 715/2007, 2007) and other transport directives, as well as the ecodesign directive (Directive, 2009/125/EC, 2009) and its implementing regulations for domestic heating and cooling. The EU addresses air pollution by setting limit values for air pollutants in the air that people breathe and standards for pollution sources.
An opportunity to improve air quality is provided by renewable energy sources that generate minimal waste (Panwar et al., 2011) and contribute to reducing greenhouse gas emissions, thus preventing climate change (Bąk et al., 2021). Economic and social development increases energy demand. Its production from non-renewable sources is becoming increasingly expensive and therefore less profitable, and, more importantly, it has negative effects not only on environmental issues but also affects the entire economy and the social sphere. Therefore, it is necessary to diversify energy resources, both to improve energy security and to reduce environmental risks by switching to renewable electricity generation (Noorollahi et al., 2021). The EU has developed the most advanced and comprehensive regulatory framework in the world on climate change due to greenhouse gas emissions (Delreux and Pipart, 2019). However, there is no consensus among EU countries on this issue, with some supporting a strong climate policy and others being reluctant to dynamically reduce CO2 emissions, justifying it with a bad impact on economic growth (Skovgaard, 2017).
Among contemporary environmental problems that have attracted considerable legislative interest is the generation and disposal of waste (Kyriakopoulos, 2021). The generation of waste is a key by-product of modern economic and social life and consumption behaviour and one of the ever-increasing problems for the environment, human health and the EU economy. It is estimated that materials sent to landfills in the EU may have a commercial value of around €5.25 billion per year, resulting in significant economic losses (Pouikli, 2020).
Soil degradation continues in Europe (Jones et al., 2012), suggesting that existing strategies are insufficient to maintain soil function. Therefore, a common soil protection policy is needed at the European level. Sustainable land use is often based on the multi-functionality of the soil, which may be lost when soil functions are dealt with separately in different directives (Haging and Pérez-Saturday, 2011). Soil degradation occurs across the EU, but only a few Member States have enacted comprehensive national soil legislation (Kutter et al., 2011).
Soil protection is one of the least regulated areas of environmental protection (Glæsner et al., 2014), as demonstrated by the fact that the Framework Directive has been rejected. Moreover, in most Member States, there is little awareness of the subject and a lack of monitoring of soil status over a long period, which is very important because soil formation is extremely slow. Soil systems are resistant to change; soil degradation and its consequences can only be seen with a significant time lag (Heuser, 2022). In September 2006, a soil protection strategy (COM, 2006) was announced, which aims at the protection and sustainable use of soil. The assessment of the situation in the document identified the soil status as a serious problem for all EU countries. For many years, the European Commission has underlined the importance of soil for combating climate change, protecting human health, maintaining biodiversity and ecosystems, and food security (Heuser, 2022). The environmental report of the European Environment Agency (SOER, 2020) reiterated that the area where the least progress has been made in the protection and preservation of European biodiversity. It has been reported that Europe’s soils are deteriorating due to, among other things, erosion, pollution, flooding and landslides, a decline in soil organic matter, salinisation, compaction, sealing and loss of biodiversity, and in recent years: desertification, drought, water scarcity and soil acidification. According to the EEA, the lack of appropriate EU legislation on soil contributes to soil degradation. The progress toward sustainable development in Europe and globally will not be possible if land and soil resources are not adequately protected.
The problem of soil protection is a major challenge for the EU countries, which are aware of it and are initiating new legal actions in this regard. Comprehensively combating soil and land degradation and contributing to achieving soil and land neutrality by 2030 is the objective of the EU 2030 Biodiversity Strategy (COM, 2020). As an essential part of the European Green Deal, this strategy will also support green recovery from the COVID-19 pandemic. The following measures are, for example, the Resolution on soil protection 2021/2,548 (Resolution on soil protection, 2021).
Another crucial environmental area is marine and inland waters. Water protection is one of the most developed branches of EU environmental policy, dating back to the 1970s. The Water Framework Directive (WFD) was adopted in 2000 as the main instrument of EU policy in this area (Directive, 2000/60/EC, 2000). It establishes a legal framework for protecting and restoring clean water resources in the EU and ensuring their long-term sustainable use (Carvalho et al., 2019). The framework directive is complemented by specific legislation such as the Drinking Water Directive, the Bathing Water Directive, the Floods Directive, the Marine Strategy Framework Directive, and international agreements. The WFD aimed to achieve good water status in all Member States by 2015. Integrated action programs at a national level are intended to serve this purpose. The implementation of the Water Framework Directive is regularly assessed by official processes carried out by the European Commission and the EEA during each River Basin Management Plans in each River Basin District (RBMP) cycle (European Environment Agency, 2012; European Environment Agency, 2018). The introduction of WFD has significantly improved the monitoring and assessment of the ecological status of at least some parts of the waters. However, at the same time, the EU countries have failed to achieve the main objective of the Water Framework Directive, i.e., the achievement of good status of Europe’s waters. European Environment Agency, (2018) indicated that about 60% of surface water bodies are not in good ecological status. The first 6-year RBMP cycle was initially set as the deadline for achieving such status in all surface waters, though extensions are possible for two further cycles up to 2027 (Department for Environment Food and Rural Affairs, 2021).
Noise pollution, primarily traffic noise resulting from increased pressure from motorisation, is an increasingly serious problem in Europe. Environmental research is now increasingly addressing the impact of noise pollution on biodiversity. Sounds originating from human activity related to civilisation growth and expansion of urban areas create anthropogenic sound phenomena whose presence introduces dissonance in the environment, contributes to disruption of natural ecosystems and has a negative impact on human life (Sordello et al., 2019). EU directives aim to reduce noise harmful to public health and the environment. Noise mitigation includes defining and harmonising noise measurement methodologies across the EU, surveying the current state of the acoustic climate and building up the database, as well as introducing instruments to reduce noise or protect areas not yet affected by noise pollution (European Environment Agency, 2020).
3 Materials and methods
3.1 Stages of the applied research procedure
In this paper, a three-stage research procedure was used to assess the degree of implementation of EU environmental directives in EU countries, the successive stages of which are shown in Figure 1. In the first step, statistical data on environmental indicators were collected. Then targets for indicators were set based on the EU directives, which were discussed in the literature review.
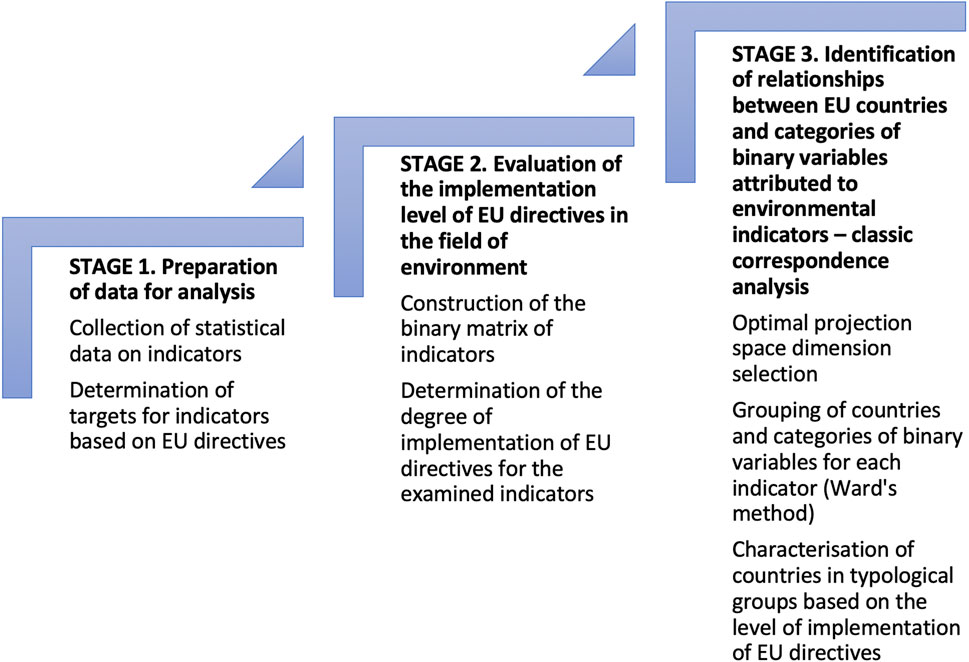
Figure 1. Stages of the applied research procedure (source: own elaboration).
In the next phase of the study, a binary matrix of indicators was constructed, which allowed for determining the degree of implementation of EU directives in EU countries regarding indicators adopted for the study. As a result, EU countries were classified according to indicators that were compliant with the adopted standard. The examined indicators were also ranked according to the number of countries in which a given indicator was in line with the adopted target value.
Classical correspondence analysis was then applied to identify interrelationships between EU countries and categories of binary variables attributed to indicators describing environmental protection. Once the optimal dimension of the projection space was selected, Ward’s method was applied, which enabled the grouping of countries and categories of binary variables assigned to the indicators under study. As a result, it was possible to classify the EU countries in the created typological groups.
3.2 Characteristics of the research material
A total of 17 environmental indicators were selected for the study, which are included in the Sustainable Development Goals and for which comparable data were available for individual EU countries. The names of the indicators, together with their symbols, the objective of sustainable development and the year of the current data, are given below:
1. Greenhouse gases emissions (in CO2 equivalent), index 1990 = 100 (Goal 3. Climate action)—data from 2019 (
2. Average CO2 emissions per km from new passenger cars in grams (Goal 12) Data from 2020 (
3. Exposure to air pollution by particulate matter (batches <2.5) (Goal 11. Data from 2019 (
4. Greenhouse gas emissions intensity of energy consumption, index 2000 = 100 (Goal 13. Climate action)—data from 2019 (
5. Share of renewable energy in gross final energy consumption in % (Goal 7. Affordable and clean energy)– data from 2020 (
6. Primary energy consumption, index 2005 = 100 (Goal 7. Affordable and clean energy)—data from 2020 (
7. Primary energy consumption Tons of oil equivalent (TOE) per capita (Goal 7. Affordable and clean energy)—data from 2020 (
8. Final energy consumption, index 2005 = 100 (Goal 7. Affordable and clean energy)—data from 2020 (
9. Final energy consumption tonnes of oil equivalent (TOE) per capita (Goal 7. Affordable and clean energy)—data from 2020 (
10. Final energy consumption in households per capita, a kilogram of oil equivalent (KGOE) (Goal 7. Affordable and clean energy)—data from 2020 (
11. Energy productivity (purchasing power standard (PPS) per kilogram of oil equivalent) (Goal 7. Affordable and clean energy)—data from 2020 (
12. Water exploitation index, plus (WEI+) in % (Goal 6. Clean water and sanitation)—data from 2017 (
13. Soil sealing, index 2006 = 100 (Goal 15. Life on land)—data from 2018 (
14. Soil sealing, index in % (Goal 15. Life on land)—data from 2018 (
15. Generation of waste excluding major mineral wastes (hazardous and non-hazardous—total), kilograms per capita (Goal 12. Responsible consumption and production)– data from 2018 (
16. Recycling rate of municipal waste in % (Goal 11. Sustainable cities and communities)—data from 2020 (
17. Population living in households considering that they suffer from noise in % (Goal 11. Sustainable cities and communities)—data from 2020 (
The above indicators characterise the most important areas of the environment, the protection of which is regulated, among others, by EU directives. Thus: indicators
As most of the data come from 2020, the UK was not included among the EU countries as it left the EU in 2021, and no more data was available for 2020.
An essential aspect of this research is establishing the target values level for the analysed indicators, which is necessary to assess the degree of implementation of EU directives by individual EU countries. The information on these values has been extracted from literature studies and the Eurostat website, which provides the main guidelines on desired values or trends for the indicator in subsequent years. On this basis, the target values for individual indicators are provided in Supplementary Appendix Table A1, with an explanation of how they were determined. As the current data on the selected indicators are from 2017-to 2020, it was assumed that the target values should apply to 2020 at the most. Supplementary Appendix Table A2, included at the end of the paper (Appendix), presents the values of the analysed indicators in individual EU countries.
3.3 Research method
Correspondence analysis for data in the form of a binary matrix of indicators was used to assess the degree of implementation of EU environmental directives by individual EU countries (binary indicator matrix) (Hoffman and Franke, 1986). In this binary test, a matrix of indicators was created in such a way that each indicator analysed
where:
Eqs (1, 2) show that there has been a substitution of the actual index values by two categories, one of which indicates a positive indicator level from the point of view of the target value adopted (
The binary instrument matrix can be considered a contingency table with dimensions
Considering the binary indicator matrix as a contingency table allows the application of classical correspondence analysis (CA), and according to Blasius (2001), this is the approach that allows the application of correspondence analysis for small samples (sets).
The analysis of correspondence is extensively discussed, among others, in the works of Greenacre (1984), Greenacre (2007), Beh and Lombardo (2014), Andersen (1994). In each of these papers, classical correspondence analysis is defined as a technique (mathematical, statistical, graphical) that allows the categories of variables contained in the rows and columns of a contingency table to be represented as points in a common low-dimensional (usually two-dimensional) projection plane. Thus, it is possible to examine the structure of the relationships between the categories of variables presented in the contingency table. Therefore, the analysis of correspondence is included in the exploration methods.
The way in which the binary matrix of indicators was built and the ability to identify the interrelations between EU countries and categories
As mentioned earlier, the computational procedure used in correspondence analysis is described in detail in many publications (e.g., Hoffman and Franke, 1986; Greenacre, 2007; Batóg and Batóg, 2016), so only an abridged version of the method description is presented below, taking into consideration the designations given earlier when describing the binary indicator matrix as a contingency table.
The starting point in the study is a binary indicator matrix created according to formulas (1) and (2), which was considered a contingency table
where:
Then, two diagonal matrices are created (
The average row profile (vector
Based on the matrix
The decomposition of the matrix
where:
The quality of the representation of the links between individual rows and columns from the actual projection space in a lower-dimensional space can be assessed by the contribution of the inertia of the selected dimension to the total inertia calculated according to Eq. 8:
where:
The measure
The following rules can be used to select the optimal dimension of the projection space (Sourial et al., 2010):
− the inertia share of the selected dimension in total inertia (
− the number of the chosen dimension should be just before the “elbow” in the eigenvalue diagram, where the “elbow” corresponds to the dimension where the curve starts to level out,
− select a projection dimension from the dimensions satisfying the condition in Eq. 9
Where the designations are the same as those in Formulas 7, 8.
4 Results
The presentation of the results began with an analysis of the information obtained directly from the binary tag matrix. Supplementary Appendix Table A3, included at the end of the paper (Appendix), shows the values of the binary variable categories, which only indicate the implementation of an EU directive (
The manner in which this matrix was constructed enabled ordering:
− of EU countries (rows of binary matrix) according to the non-increasing number of indicators tested that were in line with the accepted standard (Table 1),
− indicators (columns of the binary matrix) according to the non-increasing number of EU countries where a given indicator complied with the adopted standard (Table 2).
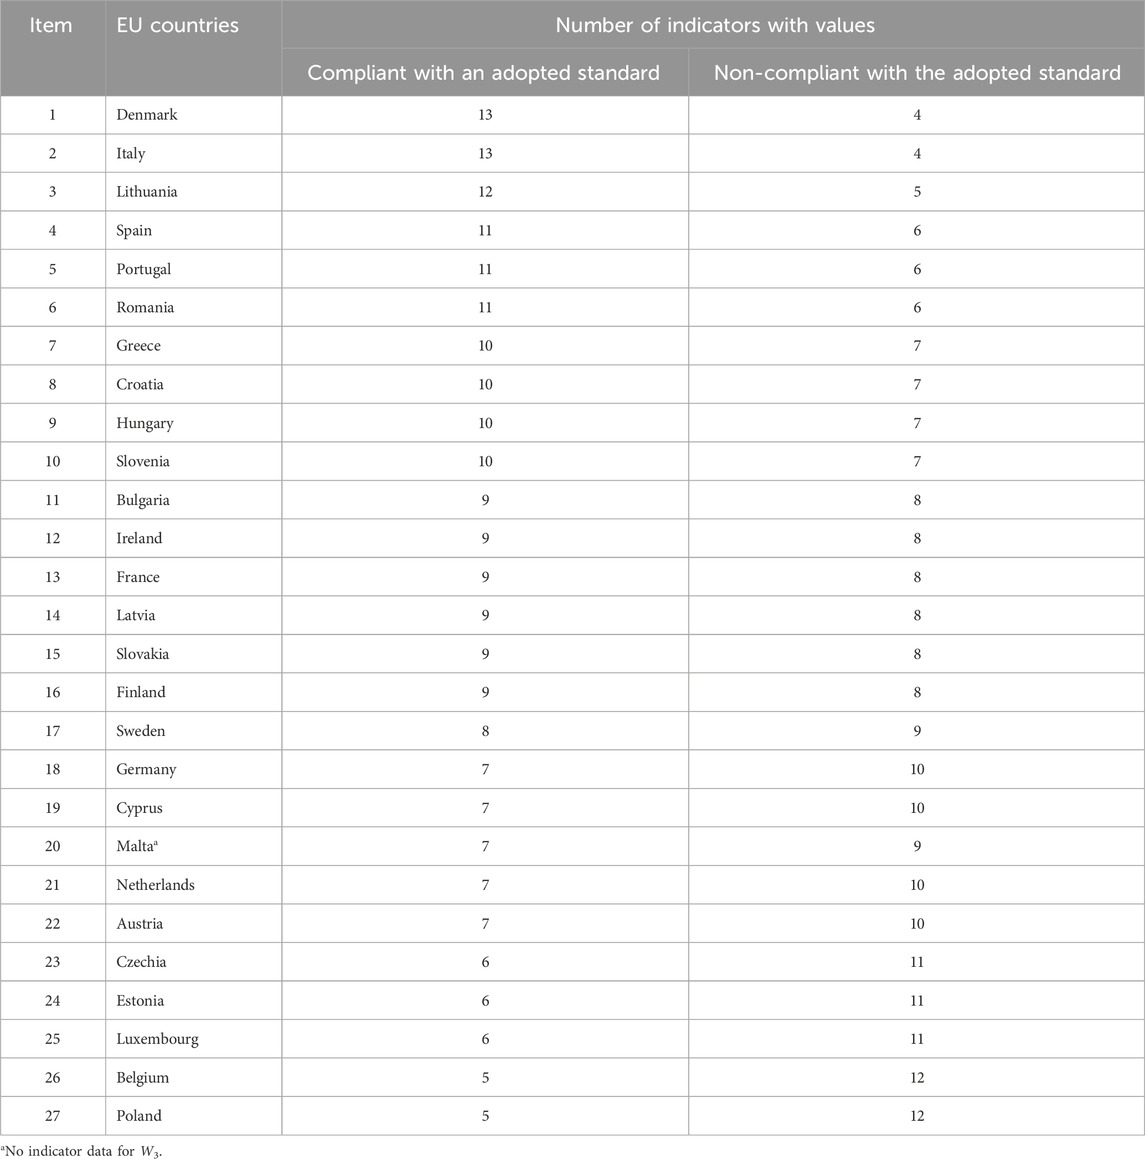
Table 1. Classification of EU countries according to the non-increasing number of indicators tested, following the adopted standard (source: own elaboration).
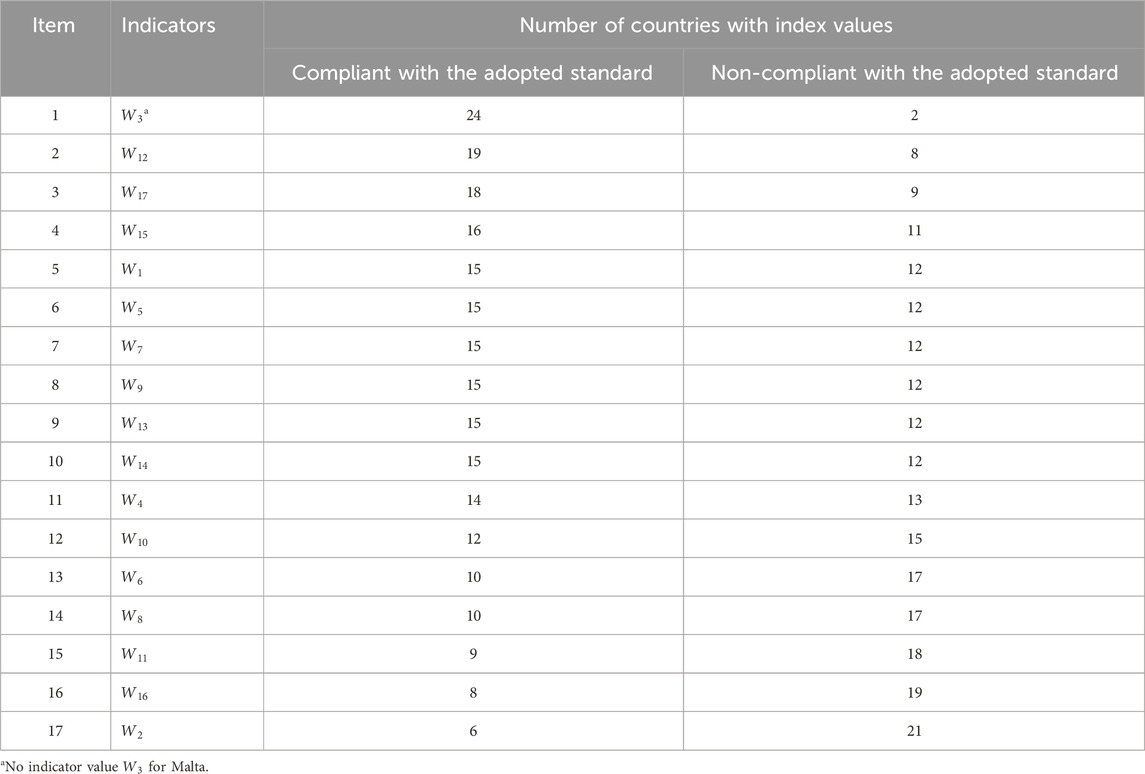
Table 2. Classification of indicators according to the non-increasing number of EU countries where a given indicator complied with the adopted standard (source: own elaboration).
Table 1 shows that in 16 EU countries, the number of indicators that met or exceeded their target values exceeded the number of indicators not reaching this value. The best situation in this area was in Denmark and Italy–in these countries, 13 indicators were in line with the standard, and only 4 indicators did not reach the target. The least compliant indicators were in Poland and Belgium - only five. It is not possible to determine from Table 1 which indicators these were. However, they can be identified by visualising the detailed information from the binary tag matrix. For example, in Denmark (Figure 2), the adopted standard was not reached for the following indicators: final energy consumption tonnes of oil equivalent per capita (
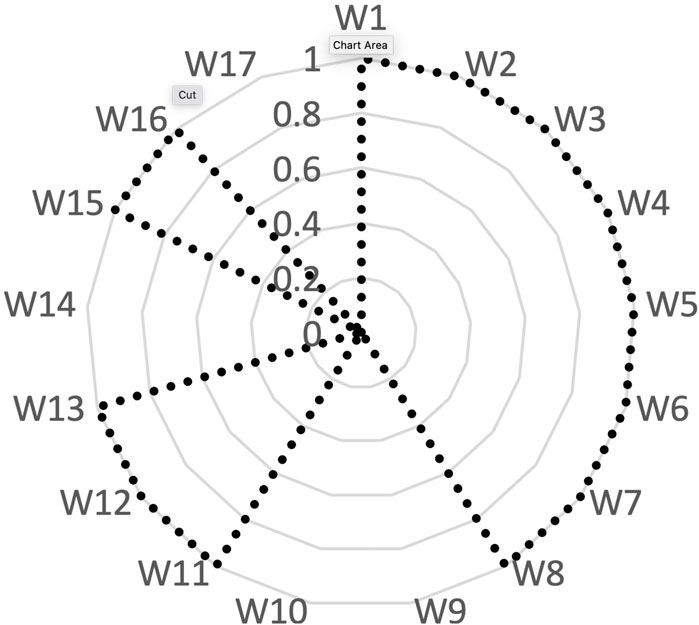
Figure 2. The degree of implementation of EU directives for indicators in Denmark (source: own elaboration).
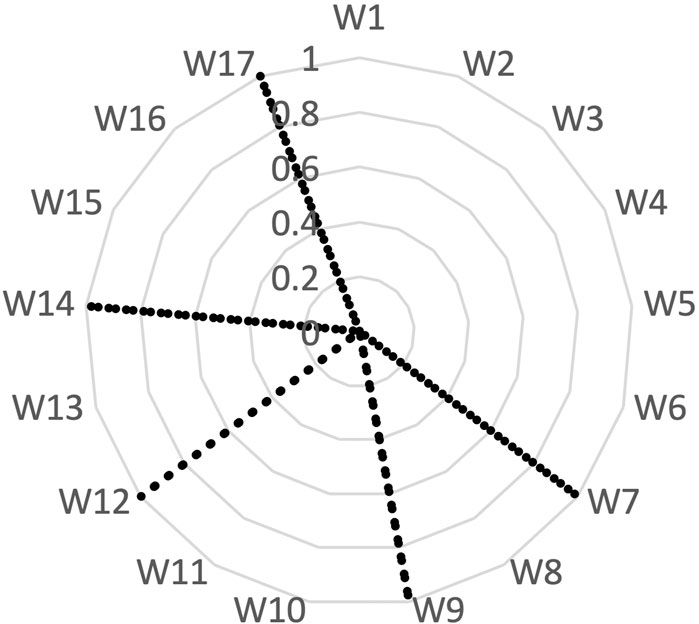
Figure 3. The degree of implementation of EU directives for indicators in Poland (source: own elaboration).
Based on Table 2, it can be noted that almost all the countries examined have implemented an EU directive for indicator
− the level of air pollution by particulate matter (particles <2.5 mm) (
− the average CO2 emissions per km from new passenger cars (
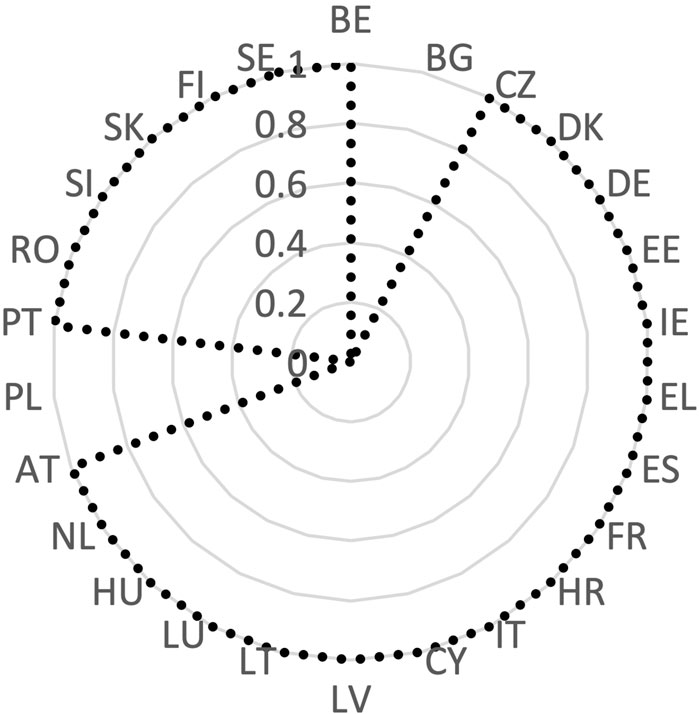
Figure 4. The degree of implementation of EU directives for suspended particulate air pollution (particles <2.5 mm) (
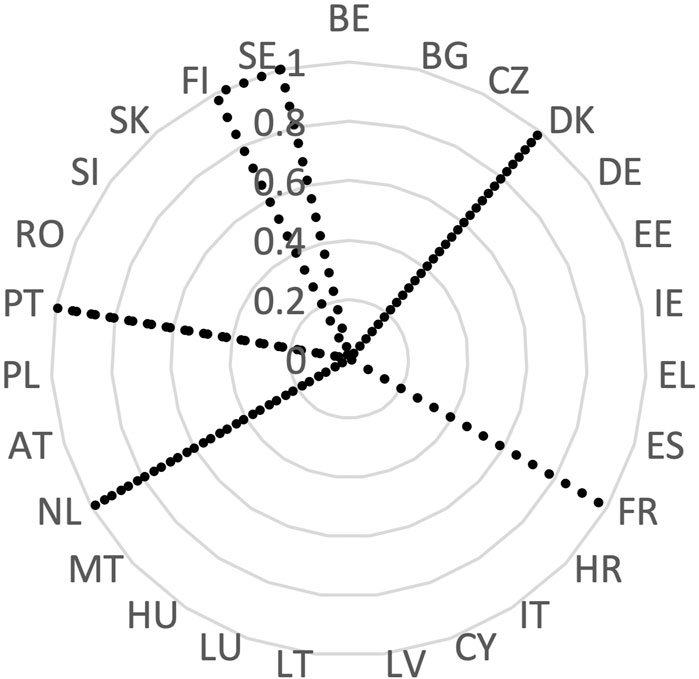
Figure 5. The degree of implementation of EU directives for average emissions of CO2 per km from new passenger cars (
The above analysis was carried out separately for countries and indicators. In contrast, classical correspondence analysis was used to identify interrelationships between EU countries and categories of binary variables assigned to indicators characterising environmental protection. The results obtained on this basis are presented below.
Table 3 lists the singularities (γk), the eigenvalues (λk), the degree of explanation of total inertia (λ) by the eigenvalues for k-th dimension (λk/λ·100%) and the degree of explanation of total inertia by the eigenvalues n k-dimensional space (τk·100%).
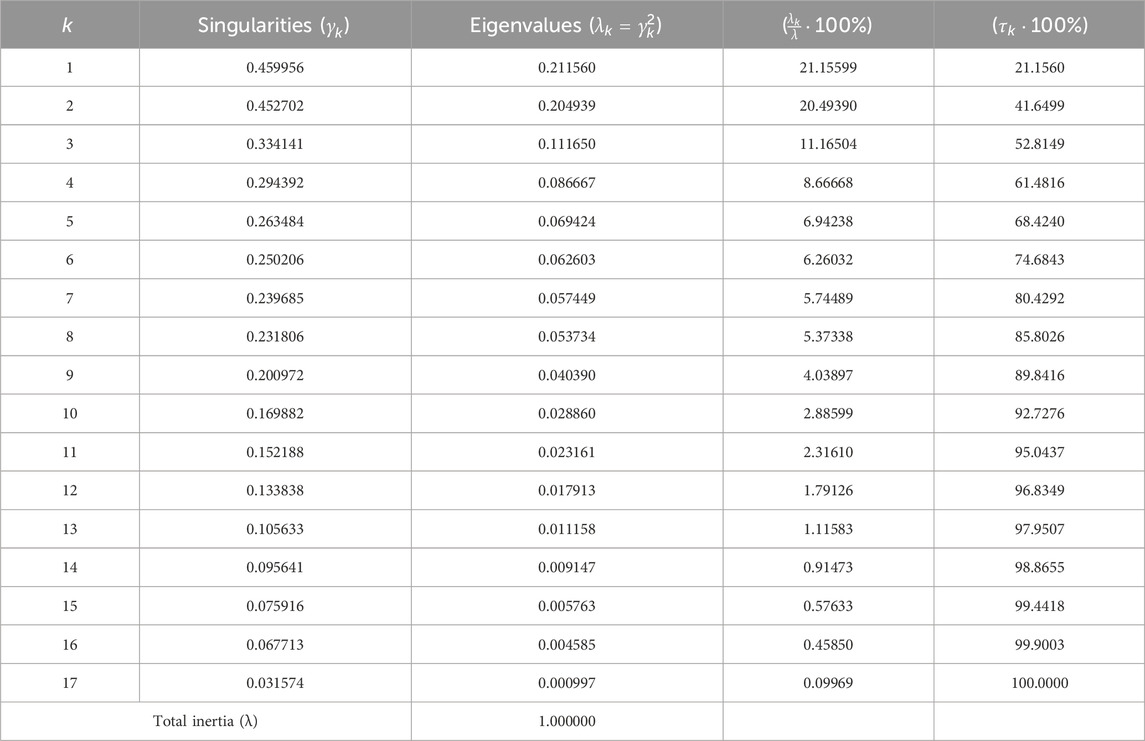
Table 3. The singularities, the eigenvalues and the degree of explanation of the total inertia by the own values for k-th dimension and for k-dimension space in the actual projection space (source: own elaboration).
According to Formula 7, the actual projection space was 26, but a complete explanation of total inertia occurred in the 17-dimensional space. Therefore, the dimensions 18 to 26 are omitted in Table 3. A seven-dimensional projection space is considered to be the optimum because it is the smallest of possible dimensions that meets the three principles previously stated at the same time, i.e.,:
− the eigenvalue for this dimension (
− the degree of explanation of total inertia above 70% begins with a 6-dimensional space, and for a 7-dimensional space is 80.43%;
− in the eigenvalue diagram (Figure 6), the dimension with the number 7 is just before the “elbow.”
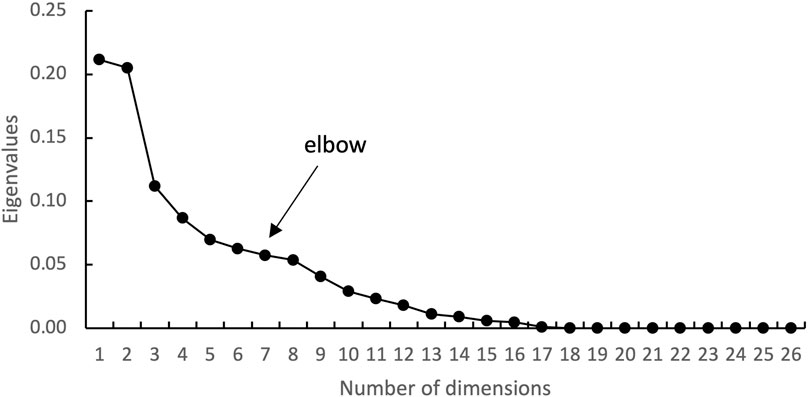
Figure 6. Eigenvalue diagram (source: own elaboration).
Ward’s method was applied for the coordinates characterising the five-dimensional projection space, which enabled the grouping of countries and categories of binary variables assigned to the examined indicators. The results of group formation are presented in Figure 7.
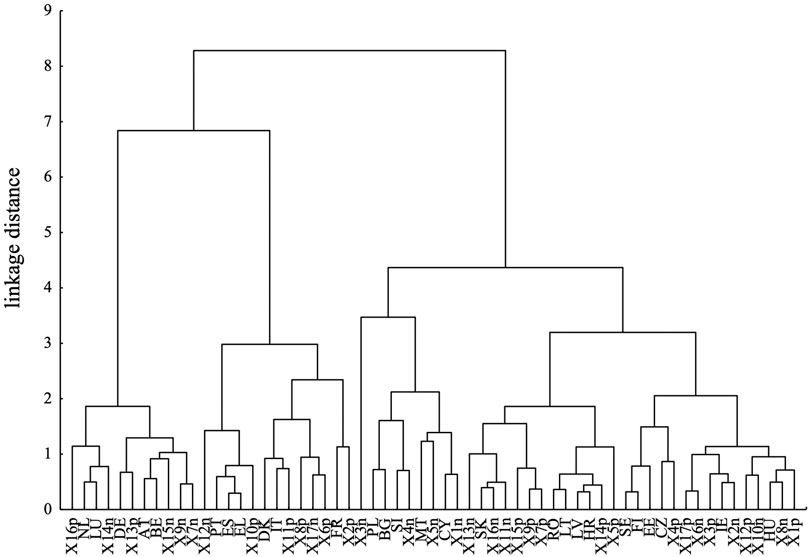
Figure 7. Grouping of EU countries and binary variable categories for individual indicators using Ward’s method (source: own elaboration).
The horizontal line marked on the graph at the height of the bond distance equal to 2.982 indicates the stage at which class bonding was interrupted. Thus, seven classes (groups) were obtained. Among them, only in the fourth group, there is no country next to one category of the binary variable, so this group will not be interpreted. In the remaining six groups, however, specific countries are linked to the categories of binary variables assigned to the individual indicators examined, allowing the degree of implementation of EU directives in this area to be assessed for those countries. These variables are common to a group of countries and distinguish them significantly from countries in other groups. Supplementary Appendix Table A4 (Appendix) presents the characteristics of countries in separate groups due to the degree of implementation of EU directives.
5 Discussion
The environmental challenges faced by EU decision-makers and legislators have changed significantly over recent decades. New environmental problems have emerged, and social support for the protection of the ecosystem has increased (Alberton, 2012). Since the 1970s, European environmental policy has rapidly evolved from a by-product of economic integration into a full-fledged, independent policy area. European environmental law has covered more and more issues and reached a high level of protection. From 1970 until the Single European Act came into force (1986), the EU adopted 173 pieces of environmental legislation or 0.82 acts per month. In the following years, legislative activity increased significantly (Table 4). The Council passed more than 700 pieces of environmental legislation between 1970 and 2013, exceeding one bill every month. Although the EU is not a country, it “pursues some of the most progressive policies of any country in the world” (Jordan and Adelle, 2013).
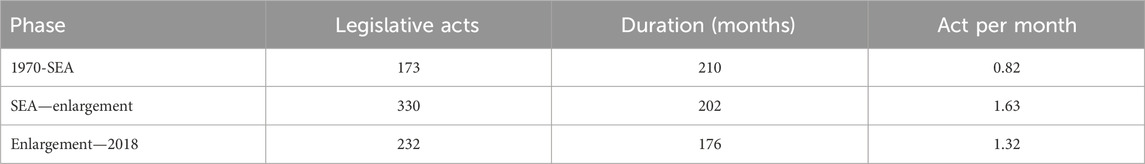
Table 4. EU legislative output in environmental policy (source: Deters, 2019, p. 318).
At the international level, the EU is a party to more than forty multilateral environmental agreements and is often an active supporter of environmental standards in environmental negotiations (Orlando, 2013). As Skjærseth (2017) emphasises, “European Commission has played a crucial role in promoting ambitious EU climate targets and policies that boost the credibility of EU leadership-by-example efforts internationally”. The Lisbon Treaty reaffirmed the EU’s commitment to the environment and sustainable development and underlined the internal and external dimensions of EU action in this area. However, there are still several important challenges in this area if the EU is to play a significant role in environmental protection and assert itself as a leader in global environmental management processes.
Implementing EU environmental policy and law is essential for present and future generations. Closing the gap between what has been decided and what has actually been implemented is crucial to ensure that citizens perform well not only in terms of environmental protection but also to maintain an equal operating framework for economic actors and create opportunities for social and technological innovation and economic development (European Commission, 2019). The effectiveness of EU environmental law depends on its implementation at Member State, regional and local levels. According to Demmke (2001), most of the shortcomings in implementing Community law result from the lack of notification, information to the public, and monitoring of the degree of implementation. According to Stern (2007), climate impacts will generate high social costs. Also costly to society are gaps in implementing environmental standards, which manifest themselves in various forms, such as reduced utility values of surface water of poor ecological quality, and increased illnesses due to air and noise pollution. According to the European Commission (2019), the total social costs resulting from the current implementation gaps in environmental policy amount to approximately €55 billion per year. In contrast, air pollution is estimated to cost health and economic activity €330–940 billion per year in the EU, including lost working days, healthcare costs, crop loss and damage to buildings, while all measures in the EU to improve air quality are estimated to cost between €70–80 billion per year (European Commission, 2021). According to the European Commission (2021), economic progress and pollution reduction can go hand in hand; for example, between 2000 and 2017, EU GDP grew by 32%, while emissions of major air pollutants fell from 10% (ammonia, mainly from agriculture) to 70% (sulphur oxides, mainly from industrial production).
According to Vogt and Pukarinen (2022), the basis for policy making in the EU is strategic planning with a time horizon of five to 10 years. However, this does not apply to environmental policy, in which time perspectives often extend much longer. The deadlines for the future differ between 2030, the 2030 Agenda and the UN Sustainable Development Goals, and 2050, by which time Europe should function as a carbon-neutral region. The results of the authors’ research indicate that the experts are optimistic about the possibilities of green transformation. One expert argued that carbon neutrality by 2050 would be a “driving force” for the whole of Europe in the coming decades, comparable to “a European Moon shot.”
6 Conclusion
Assessing the implementation of EU environmental directives in EU countries, i.e., the compliance of the level of environmental protection indicators with the target values, is a matter of great importance. The more indicators reach the assumed standards, the faster the implementation of the concept of sustainable development will be, striving to preserve natural resources and maintain the appropriate state of the environment, taking into consideration the needs of future generations. EU countries are even obliged to provide information to the European Commission to demonstrate the successful implementation of environmental regulations; therefore, the regulation on environmental reporting was published in June 2019.
Our research, whose results are presented in this article, addresses these significant issues. The use of correspondence analysis for the binary matrix of indicators and Ward’s method in the study allowed for a detailed analysis of the degree of implementation of EU directives in the field of environmental protection in separate groups of EU countries (Supplementary Appendix Table A4). The categories of binary variables identified in individual groups are typical for a given group of countries. They significantly differentiate them from the average column profile, which can be considered as an internal standard resulting from the values that the variables adopt in the studied group. On this basis, it is possible to indicate the areas of environmental protection for which the examined countries have reached or are close to meeting the standards contained in the relevant directives. In the absence of explicit target values, the authors proposed to evaluate the countries based on the trends indicated in the legislation and the EU averages. The following regularities were observed as a result of using this approach:
• the first group included countries with a small population (except Germany), which are highly developed, located in Western Europe; they are distinguished by a high level of municipal waste recycling rate and a slight increase in soil sealing, as well as environmentally unfavourable energy consumption and waste production indicators;
• the second group are countries located in southern Europe with a diverse surface area and population, characterised by relatively low final energy consumption in households and a high rate of water use;
• the third group includes countries located in different parts of Europe, characterised by high energy efficiency, reduced primary energy consumption and low CO2 emissions from new passenger cars, on the one hand, and high noise levels, on the other;
• the fifth group included the countries of Southern Europe and Poland, which joined the EU in 2004 or later. For this group, no common indicators were identified for achieving the assumed target. On the other hand, they are characterised by high greenhouse gas emissions and intensity and a low share of renewable energy in gross final energy consumption;
• the sixth group also includes the countries that joined the EU in 2004 and later; the degree of implementation of EU directives in these countries varies greatly, and they can be assessed positively for a high share of energy from renewable sources, low consumption of primary and final energy, low rate of soil sealing and waste generation, while negatively for energy efficiency, soil sealing and municipal waste recycling,
• the last seventh group comprises the Scandinavian countries and those located in northern and central Europe, characterised by low CO2 emissions, reduced greenhouse gas intensity in energy consumption, low air pollution by particulate matter, low water use and noise levels, as well as high final primary and final energy consumption and high CO2 emissions from new passenger cars.
The observed regularities show that in each group of countries there are indicators whose values do not respect the standards adopted in the EU directives or deviate from the average EU values. In the first group of countries, the main focus should be on reducing both final and primary energy consumption, as well as waste production (this is not easy, as these are highly developed countries, where economic development and the high quality of life can be the cause of both excessive energy consumption and waste production). In the second group of countries, special attention should be paid to water management, however water saving in this group–southern European countries with high temperatures basically all year round–is difficult to achieve. In group three, recommendations should be made to reduce excessive forestry. In group five, efforts should be made to reduce greenhouse gas emissions and to increase the share of renewable energy. This group includes countries that joined the EU in 2004 and later, and excessive greenhouse gas emissions and a low share of renewable energy have been noticed by the European Union. Funds have therefore been mobilised for these countries to enable improvements. In group six, the rate of soil sealing needs to be reduced and municipal waste management should be improved. On the other hand, in group seven, as in group one, there are highly developed countries, so the failure to meet standards for primary and final energy consumption and CO2 emissions from new passenger cars is a consequence of economic development and high quality of life. It can be seen from the above that the failure of EU countries to meet the standards arising from EU directives for specific indicators at present is not always intentional, and is very often a consequence of high economic development, high standard of living, climate specificities and historical circumstances (socialist bloc countries that joined the EU in 2004 and later).
It is worth noting that the research procedure proposed in the article is highly useful. It makes it possible to assess the degree of implementation of EU environmental directives at the outset (with the construction of a binary matrix). On the other hand, the final results of the correspondence analysis using Ward’s method make it possible to group the studied countries and indicate their common environmental weaknesses and strengths. On this basis, the reasons for that can be sought. The possibility of evaluation on two levels is a novel research approach, which aims to assess the situation of the studied objects (countries, regions) regardless of the specifics of the studied phenomenon.
The authors realise that the theoretical considerations and empirical results presented in the paper do not fully address the problem, and therefore it is important to continue research on the implementation of EU environmental directives. This kind of studies can provide answers to questions such as “how quickly can we stop the climate changes that threaten the existence of man and the planet?,” and “at what stage are individual EU countries?.” As a result, they can serve as an important, strong motivation to intensify the actions of their governments and institutions, as well as the entire European Union.
A major limitation in conducting this type of study is the collection of reliable and comparable statistical data. EU environmental law currently includes several hundred directives, regulations and decisions. Its effectiveness depends to a large extent on the implementation at the national, regional and local levels, and the insufficient degree of its application and enforcement remains a significant problem. It is therefore crucial to monitor both the state of the environment and the level of implementation of EU environmental law. It is worth noting that countries outside the European Union may always be in a better competitive situation because their economies will not have to adapt to EU directives.
Data availability statement
The original contributions presented in the study are included in the article/Supplementary Material, further inquiries can be directed to the corresponding author.
Author contributions
IB: Formal Analysis, Investigation, Methodology, Resources, Supervision, Validation, Writing–original draft, Writing–review and editing. KW: Formal Analysis, Investigation, Methodology, Resources, Supervision, Validation, Writing–original draft, Writing–review and editing. PS: Formal Analysis, Investigation, Methodology, Resources, Supervision, Validation, Writing–original draft, Writing–review and editing.
Funding
The author(s) declare that financial support was received for the research, authorship, and/or publication of this article. The publication was partially funded by The International Center for Inclusive Management and Economic Development (IDEAL), Faculty of Economics, West Pomeranian University of Technology in Szczecin.
Conflict of interest
The authors declare that the research was conducted in the absence of any commercial or financial relationships that could be construed as a potential conflict of interest.
Publisher’s note
All claims expressed in this article are solely those of the authors and do not necessarily represent those of their affiliated organizations, or those of the publisher, the editors and the reviewers. Any product that may be evaluated in this article, or claim that may be made by its manufacturer, is not guaranteed or endorsed by the publisher.
Supplementary material
The Supplementary Material for this article can be found online at: https://www.frontiersin.org/articles/10.3389/fenvs.2024.1324030/full#supplementary-material
Footnotes
1Database of European Union legal acts, <https://eur-lex.europa.eu/browse/directories/legislation.html>
2Ward’s method is one of the agglomeration grouping methods. It is used in empirical research both in relation to the classification of objects and features. In this method, the distance between groups is defined as the module of the difference between the sums of squares of the distance of points from the centers of the groups to which these points belong (Kaufman and Rousseeuw, 2008; Ezergár-Kiss and Caesar, 2017).
References
Adams, W. M. (2009). Green development: environment and sustainability in a developing world. 3rd Edition. London: Routledge.
Air pollution (2018). Air pollution: our health still insufficiently protected. Special Report No. 23/2018. Luxembourg: European Court of Auditors.
Alberton, M. (2012). Environmental protection in the EU member states: changing institutional scenarios and trends. Cent. Int. Form. Eur. 363, 287–300. doi:10.3917/eufor.363.0287
Andersen, E. B. (1994). The statistical analysis of categorical data. 3rd ed. Berlin, Heidelberg, New York, London, Paris, Tokyo, Hong Kong, Barcelona, Budapest: Springer-Verlag.
Bąk, I., Spoz, A., Zioło, M., and Dylewski, M. (2021). Dynamic analysis of the similarity of objects in research on the use of renewable energy resources in European Union countries. Energies 14 (13), 3952. doi:10.3390/en14133952
Batóg, J., and Batóg, B. (2016). Application of correspondence analysis to the identification of the influence of features of unemployed persons on the unemployment duration. Review 2 (16), 25–44. doi:10.18559/ebr.2016.4.2
Beh, E. J., and Lombardo, R. (2014). Correspondence analysis. Theory, practice and new strategies. John Wiley and Sons, Ltd.
Carvalho, L., Mackay, E. B., Cardoso, A. C., Baattrup-Pedersen, A., Birk, S., Blackstock, K. L., et al. (2019). Protecting and restoring Europe's waters: an analysis of the future development needs of the Water Framework Directive. Sci. Total Environ. 685, 1228–1238. doi:10.1016/j.scitotenv.2018.12.255
COM (2006). Communication from the commission to the Council, the European parliament, the European economic and social committee and the committee of the regions. Thematic strategy for soil protection. Brussels: Commission of the European Communities.
COM (2020). Communication from the commission to the European parliament, the Council, the European economic and social committee and the committee of the regions. EU biodiversity strategy for 2030 bringing nature back into our lives. Brussels: Commission of the European Communities.
Delreux, T., and Pipart, F. (2019). Climate policy in European union politics. Oxford: Oxford Research Encyclopedia of Politics. doi:10.1093/akr/9780190228637.013.1097
Department for Environment Food and Rural Affairs (2021). River basin planning guidance. Available from: https://assets.publishing.service.gov.uk/government/uploads/system/uploads/attachment_data/file/1019774/River_basin_management_planning_ministerial_guidance.pdf.
de Sadeleer, N. (2023). “Environmental law in the EU: a pathway toward the green transi-tion,” in Blue planet law. Sustainable development Goals series. Editors M. G. Garcia, and A. Cortês (Cham: Springer). doi:10.1007/978-3-031-24888-7_2
Deters, H. (2019). European environmental policy at 50: five decades of escaping decision traps? Environ. Policy Gov. 29, 315–325. doi:10.1002/eet.1855
Directive 2000/60/EC (2000). Directive 2000/60/EC of the European Parliament and of the Council of 23 October 2000 establishing a framework for Community action in the field of water policy. Available from: https://data.europa.eu/eli/dir/2000/60/oj.
Directive 2009/125/EC (2009). Directive 2009/125/EC of the European Parliament and of the Council of 21 October 2009 establishing a framework for the setting of ecodesign requirements for energy-related products (recast) (Text with EEA relevance). Available from: https://data.europa.eu/eli/dir/2009/125/oj.
Directive 2010/75/EU (2010). Directive 2010/75/EU of the European Parliament and of the Council of 24 November 2010 on industrial emissions (integrated pollution prevention and control) (recast) (Text with EEA relevance). Available from: https://data.europa.eu/eli/dir/2010/75/oj.
Directive (EU) 2015/2193 (2015). Directive (EU) 2015/2193 of the European Parliament and of the Council of 25 November 2015 on the limitation of emissions of certain pollutants into the air from medium combustion plants (Text with EEA relevance). Available from: https://data.europa.eu/eli/dir/2015/2193/oj.
Directive (EU) 2016/2284 (2016). Directive (EU) 2016/2284 of the European Parliament and of the Council of 14 December 2016 on the reduction of national emissions of certain atmospheric pollutants, amending Directive 2003/35/EC and repealing Directive 2001/81/EC (Text with EEA relevance). Available from: https://data.europa.eu/eli/dir/2016/2284/oj.
Eszergár-Kiss, D., and Caesar, B. (2017). Definition of user groups applying Ward’s method. Transp. Res. Procedia 22, 25–34. doi:10.1016/j.trpro.2017.03.004
European Commission (2019). Directorate-General for Environment. The costs of not implementing EU environmental law study: final report. Luxembourg: Publications Office. doi:10.2779/192777
European Commission (2021). Pathway to a healthy planet for all. EU action plan: 'towards zero pollution for air, water and soil'. Communication from the commission to the European parliament, the Council, the European economic and social committee and the committee of the regions empty. Available from: https://eur-lex.europa.eu/legal-content/EN/TXT/?uri=CELEX:52021DC0400.
European Council (2007). 8/9 march 2007 presidency conclusions, brussels. Available from: https://ec.europa.eu/commission/presscorner/detail/en/DOC_07_1.
European Environment Agency (2012). European waters – assessment of status and pressures. EEA report No 8/2012. Copenhagen. Available from: https://www.eea.europa.eu/publications/european-waters-assessment-2012.
European Environment Agency (2018). European waters – assessment of status and pressures 2018. EEA report No 7/2018. Luxembourg. Available from: https://www.eea.europa.eu/publications/state-of-water.
European Environment Agency (2020). Environmental noise in Europe – 2020. EEA report No 22/2019. Luxembourg. Available from: https://www.eea.europa.eu/publications/environmental-noise-in-europe.
Glæsner, N., Helming, K., and de Vries, W. (2014). Do current European policies prevent soil threats and support soil functions? Sustainability 6, 9538–9563. doi:10.3390/su6129538
Goncalves, L. C. S. (2023). EU environmental law in face of 2022 challenges: a Prufrock-like confes-sion during times when one should dare? ERA Forum 24, 1–7. doi:10.1007/s12027-023-00750-z
Greenacre, M. (1984). Theory and applications of correspondence analysis. London: Academic Press Ltd.
Greenacre, M. (2007). Correspondence analysis in practice. Second Edition. London: Chapman and Hall/CRC.
Helming, K., and Pérez-Soba, M. (2011). Landscape scenarios and multifunctionality: making land use impact assessment operational. Ecol. Soc. 16 (1), 50. doi:10.5751/es-04042-160150
Heuser, I. (2022). Special issue on soil governance of the journal of soil security: soil governance in the current European union law and in the European green deal. Soil Secur. 6, 100053. doi:10.1016/j.soisec.2022.100053
Hoffman, D. L., and Franke, G. R. (1986). Correspondence analysis: graphical representation of categorical data in marketing research. J. Mark. Res. 23 (3), 213–227. doi:10.2307/3151480
Jones, A., Panagos, P., Barcelo, S., Bouraoui, F., Bosco, C., Dewitte, O., et al. (2012). The state of soil in Europe: a contribution from jrc to the European environmental agency’s environment state and outlook report – SOER 2010. Luxembourg: Publications Office.
Jordan, A., and Adelle, C. (2013). “EU environmental policy: contexts, actors,and policy dynamics,” in Environmental policy in the EU: actors, institutions and processes. Editors A Jordan, and C Adelle. 3rd ed (London: Routledge), 1–9.
Kates, R. W., Parris, T. M., and Leiserowitz, A. A. (2005). What is sustainable development? Goals, indicators, values, and practice. Environ. Sci. Policy Sustain. Dev. 47 (3), 8–21. doi:10.1080/00139157.2005.10524444
Kaufman, L., and Rousseeuw, P. J. (2008). Finding groups in data: an introduction to cluster analysis. New York: Wiley.
Kutter, T., Louwagie, G., Schuler, J., Zander, P., Helming, K., and Hecker, J. M. (2011). Policy measures for agricultural soil conservation in the European Union and its member states: policy review and classification. Land Degrad. Dev. 22, 18–31. doi:10.1002/ldr.1015
Kyriakopoulos, G. L. (2021). Environmental legislation in European and international contexts: legal practices and social planning toward the circular economy. Laws 10 (3), 3. doi:10.3390/laws10010003
Luo, L., Wang, Y., Liu, Y., Zhang, X., and Fang, X. (2022). Where is the pathway to sustainable urban development? Coupling coordination evaluation and configuration analysis between low-carbon development and eco-environment: a case study of the Yellow River Basin, China. Ecol. Indic. 144, 109473. doi:10.1016/j.ecolind.2022.109473
Mojsiewicz, M., and Wawrzyniak, K. (2007). Recognizing of the segments on the insurance market. Folia Oeconomica Stetin. 5 (13), 77–91.
Noorollahi, Y., Pourarshad, M., and Veisi, A. (2021). The synergy of renewable energies for sustainable energy systems development in oil-rich nations; case of Iran. Renew. Energ. 173, 561–568. doi:10.1016/j.renene.2021.04.016
Panwar, N. L., Kauhsik, S. C., and Kothari, S. (2011). Role of renewable energy sources in environmental protection: a review. Renew. Sustain. Energy Rev. 15 (3), 1513–1524. doi:10.1016/j.rser.2010.11.037
Peeters, M., and Misonne, D. (2022). “The European Union and its rule-creating force on the Eu-ropean continent for moving to climate neutrality by 2050 at the latest,” in Research handbook on climate mitigation law. Editors L Reins, and J Verschuuren. 2 ed. (Cheltenham, United Kingdom: Edward Elgar Publishing), 59–102.
Pezzey, J., and Toman, M. (2002). The economics of sustainability, A review of journal articles. Resour. Future DP 2002, 5–12. Available at: https://www.researchgate.net/publication/24122700
Pouikli, K. (2020). Concretising the role of extended producer responsibility in European Union waste law and policy through the lens of the circular economy. Era Forum 20, 491–508. doi:10.1007/s12027-020-00596-9
Regulation (EC) No 715/2007 (2007). Regulation (EC) No 715/2007 of the European Parliament and of the Council of 20 June 2007 on type approval of motor vehicles with respect to emissions from light passenger and commercial vehicles (Euro 5 and Euro 6) and on access to vehicle repair and maintenance information (Text with EEA relevance). Available from: https://data.europa.eu/eli/reg/2007/715/oj.
Resolution on soil protection (2021). Resolution on soil protection. 2021. 2021/2548(RSP). European Parliament resolution of 28 April 2021 on soil protection. Available from: https://www.europarl.europa.eu/doceo/document/TA-9-2021-0143_EN.html.
Robinson, J. (2004). Squaring the circle? Some thoughts on the idea of sustainable development. Ecol. Econ. 48 (4), 369–384. doi:10.1016/j.ecolecon.2003.10.017
Sikora, A. (2021). European Green Deal – legal and financial challenges of the climate change. ERA Forum 21, 681–697. doi:10.1007/s12027-020-00637-3
Skovgaard, J. (2017). EU climate policy after the crisis. Environ. Polit. 23, 1–17. doi:10.1080/09644016.2013.818304
SOER (2020). European Environment Agency, the European environment – state and outlook 2020. Available from: https://www.eea.europa.eu/soer/2020.
Sordello, R., De Lachapelle, L. L., Livoreil, B., and Vanpeene, S. (2019). Evidence of the environmental impact of noise pollution on biodiversity: a systematic map protocol. Environ. Evid. 8 (8), 8. doi:10.1186/s13750-019-0146-6
Sourial, N., Wolfson, C., Zhu, B., Quail, J., Fletcher, J., Karunananthan, S., et al. (2010). Correspondence analysis is a useful tool to uncover the relationships among categorical variables. J. Clin. Epidemiol. 63 (6), 638–646. doi:10.1016/j.jclinepi.2009.08.008
A. Stibbe (2009). The handbook of sustainability literracy: skills for changing world (Dartington: Green Books).
The Treaty on the Functioning of the European Union (Consolidated Version) (2012). The treaty on the functioning of the European union (consolidated version) official journal of the European union C 326/49. Available from: https://data.europa.eu/eli/treaty/tfeu_2012/oj.
Wang, Y., Hu, H., Dai, W., and Burns, K. (2021). Evaluation of industrial green development and industrial green competitiveness: evidence from Chinese urban agglomerations. Ecol. Indic. 124, 107371. doi:10.1016/j.ecolind.2021.107371
Keywords: sustainable development, environmental protection, indicator standards, European Union directives, binary matrix of indicators, correspondence analysis
Citation: Bąk I, Wawrzyniak K and Sulikowski P (2024) Sustainable development and the degree of implementation of European Union environmental directives. Front. Environ. Sci. 12:1324030. doi: 10.3389/fenvs.2024.1324030
Received: 18 October 2023; Accepted: 19 March 2024;
Published: 10 April 2024.
Edited by:
Mobeen Ur Rehman, Shaheed Zulfikar Ali Bhutto Institute of Science and Technology (SZABIST), United Arab EmiratesCopyright © 2024 Bąk, Wawrzyniak and Sulikowski. This is an open-access article distributed under the terms of the Creative Commons Attribution License (CC BY). The use, distribution or reproduction in other forums is permitted, provided the original author(s) and the copyright owner(s) are credited and that the original publication in this journal is cited, in accordance with accepted academic practice. No use, distribution or reproduction is permitted which does not comply with these terms.
*Correspondence: Piotr Sulikowski, cGlvdHIuc3VsaWtvd3NraUB6dXQuZWR1LnBs