
94% of researchers rate our articles as excellent or good
Learn more about the work of our research integrity team to safeguard the quality of each article we publish.
Find out more
ORIGINAL RESEARCH article
Front. Environ. Sci., 13 February 2024
Sec. Environmental Informatics and Remote Sensing
Volume 12 - 2024 | https://doi.org/10.3389/fenvs.2024.1323673
 Haodong Liu1,2*
 Gaoqiang Zhang1,2Tianqi Li1,2Siyuan Ren1,2Baihua Chen3Kaibin Feng3Wei Li1,2Xiaoqing Zhao1,2Pengyao Qin4Junpeng Zhao5
The identification and restoration of damaged ecosystems are key to achieving ecological conservation and sustainable. Hainan Island is experiencing a serious crisis of biodiversity and habitat degradation. Therefore, its ecological conservation has become a priority and challenge for China. This study aimed to construct a multi-level ecological security pattern (ESP) based on the synergy of multiple ecosystem service functions and identify important ecological elements and ecological restoration areas. Based on the InVEST model, the circuit theory model, and a series of GIS spatial analysis methods, the importance of ecosystem functions (biodiversity maintenance, water conservation, carbon sequestration, and soil conservation) was evaluated, and ecological sources, ecological corridors, ecological pinch points, and ecological barrier points were identified. The results are as follows: 1) The best habitats in Hainan Island were distributed in the central mountainous area with diverse ecosystems, with an area of 10982.5 km2, accounting for 34.25% of the total suitable habitats. Low-level habitats are mainly distributed on tableland and coastal zones. Human disturbance is the direct cause of landscape patch fragmentation in low-level habitat areas. 2) A total of 65 large ecological sources with a total area of 8238.23 km2 were identified, which were concentrated in the biodiversity and water conservation areas in the central part of the island. 3) Crucial areas in Hainan Island mainly comprised forests and water bodies. Ecological corridors radiated across the entire area in the form of a spider web and connected all important ecological patches, including 138 ecological corridors (73 primary ecological corridors and 65 secondary ecological corridors), 222 ecological pinch points, and 198 ecological barrier points. In addition, the identified areas for restoration are primary areas in urgent need of protection and restoration. In general, the ecological pinch points are natural conservation areas supplemented by anthropogenic restoration, and the ecological barrier points demand equal attention for anthropogenic restoration and nature conservation. The ecosystem protection plan developed in this study will enrich the theoretical achievements of territorial spatial ecological planning in Hainan Island, and provides clear guidance for alleviating the contradiction between land use and economic development in Hainan Island.
Rapid urbanization has undoubtedly promoted economic and social development (Wu et al., 2020). However, extensive economic development and outdated concepts of ecological environmental protection have introduced various ecological problems (Bai et al., 2022). Various countries around the world are attempting to improve the quality and function of ecosystems by developing ecological and environmental protection technologies and planning schemes (Zha et al., 2021; Luo and Fu, 2023). However, the problems of landscape fragmentation, biodiversity loss, and ecosystem service degradation have not been effectively contained (De León et al., 2019; Dai, 2022). According to the fifth National Desertification and Desertification Monitoring, the total area of desertified land in China has reached 2,611,600 km2 (Xu et al., 2022), and it is still growing at a rate of 2,460 km2 per year. Ecological restoration, which focuses on the restoration of degraded and damaged ecosystems, is considered a global priority for improving the ecological environment and reaching a reconciliation between ecological protection and urbanization (Almenar et al., 2019). Therefore, accurately identifying key areas for ecological restoration to enhance landscape connectivity and ecosystem functions is an important goal for many countries, including China (Peng et al., 2018a; Simmonds et al., 2020).
Ecological security patterns (ESPs) are an important foundation supporting the sustainable development of natural living systems (Li et al., 2019). They refer to the landscape elements, spatial locations and connections that are critical to maintaining the health and safety of ecological processes, including continuous and complete landscape patterns, wetland systems, natural forms of river systems, and greenway systems (Yang et al., 2023). A typical landscape ESP should include landscape components such as sources, buffer zones, inter-source connections, and strategic points, forming a multi-level, continuous and complete network (Ferrari et al., 2018). Early research on ESPs mainly involved nature reserves and scenic spots, with a relatively simple goal primarily targeted at biodiversity conservation (Ye et al., 2018). Recent years have seen an increase in the number of studies on urban agglomeration (Wang et al., 2022), water conservation areas (Fu et al., 2020), and ecologically fragile areas (Li et al., 2021), and their research aims have changed from single-species protection to a regional integrated ESPs covering biodiversity conservation, climate regulation and cultural heritage (Kukkala and Moilanen, 2017). A lot of research results have also been achieved based on the research paradigm of ecological source-resistance surface-corridor. For example, Zhou provided a priority protection scheme consisting of 534 source areas and 656 corridors for ecological conservation activities in the Tibetan Plateau region (Zhou et al., 2023). Qin has identified 27 sub-regions urgently in need of restoration in the southern part of Kunming, China (Qin et al., 2023). The land use types mainly included woodland, grassland, and cultivated land, with a total area of 197.68 km2. As shown, the construction of ESPs can enable the determination of the spatial distribution of ecological security, identification of potential ecological risk areas, and ultimately improvement of the level of ecological protection and guiding urban ecological construction.
An ecological source refers to the starting point of species survival and diffusion, which is the basis and key to the construction of ESPs (Xiao et al., 2020). Some studies directly regard important ecological lands, such as water bodies, wetlands, forest lands and nature reserves as ecological sources. However, such direct considerations cannot guarantee the full play of ecosystem services and functions (Zhou et al., 2023). The InVEST model integrates multiple levels of ecosystem services such as water conservation, biodiversity, soil conservation, and carbon sequestration (Ci et al., 2023), which is more accurate for quantifying ecosystem connectivity and integrity than identifying ecological sources with a single factor (Peng et al., 2019). Landscape resistance surface refers to the resistance that ecological flow needs to overcome when crossing a land use type (Dong et al., 2021). The main method of constructing a resistance surface is to assign values based on the landscape type. Ecological corridors connect multiple ecological patches and provide channels for species migration and ecological flow (Li et al., 2019). Commonly used models for the extraction of ecological corridors include the minimum cumulative resistance (MCR) model and circuit theory (CT) model (Chen et al., 2023b). The CT model simulates species migration by means of the random walk characteristic of the current in the resistance plane, and intuitively provides feedback on the importance of the corridor and node according to the strength of the current. This model has the advantages of exploring the width of the corridor and accurately identifying the location of the node, and overcomes the shortcoming of other models that have difficulty reflecting the information exchange (Huang et al., 2022). In the connectivity model of CT, ecological pinch points refer to areas in the ecological corridor with high current density, indicating a relatively high possibility of species passing through this location during migration; they are also key locations for priority maintenance and management in ecological protection (Wang et al., 2020). Ecological barrier areas refer to areas where the migration of species between ecological sources is hindered. The identification of ecological barrier areas and their improvement or removal can greatly reduce the resistance to ecological processes and improve landscape connectivity (Peng et al., 2018b). In general, ESPs aim to improve the integrity and connectivity of ecosystems by identifying and regulating ecological sources and corridors, and seek effective ways to solve ecosystem fragmentation.
Hainan Island is one of the most biodiverse areas in China (Zhai et al., 2018). As an important ecological protection barrier in the southern coastal zone, the ecological security of this region plays a pivotal role in the ecological balance and homeland security of the whole country (Zhang et al., 2021). However, in recent years, global climate change and the overexploitation of natural resources have disturbed the ecological balance of the island, and the region is facing severe environmental issues, such as tropical rainforest degradation, loss of wildlife habitats, and agricultural non-point source pollution (Sui et al., 2012; Wang and Meng, 2018; Liu et al., 2020). The irrational use of water resources also hinders the implementation of ecological conservation measures, especially during the dry season. Although the Chinese government has launched a number of ecosystem protection and restoration projects on Hainan Island with decent results, the contradiction between the ecological environment and production and construction land remains very prominent (Fang et al., 2021). Therefore, research on land ecological restoration and the construction of an ESP for Hainan Island according to local conditions are urgently required. Such efforts are of great significance for the stable improvement of ecosystem services and high-quality economic development on the island. Previous studies on the ecological security of Hainan Island involved only some regions (Han et al., 2022) and certain ecosystem types (Luo and Fu, 2023), or only considered ecological planning from the perspective of biodiversity (Lei et al., 2022). In particular, systematic research on the whole island is lacking, especially on ESPs coupling multiple ecosystem service functions.
Temporal and spatial changes of land use pattern and the rapid development of economic construction will lead to changes in the original structure and function of ecosystems (Long et al., 2014). Moreover, ecosystems in different regions have widely differing background conditions. Consequently, it is difficult to develop a standard ESP paradigm. Some key questions need to be answered in order to build suitable ESPs. How can ecologically fragile areas be restored and reconstructed in accordance with ecological and environmental problems faced by the study area? How can individual ecological elements constituting ecosystems at different scales control the overall ecological security? Considering these questions, the following primary objectives were set in this study: 1) identify ecological sources based on the theory of ecosystem service–landscape connectivity, 2) construct landscape resistance surfaces by comprehensively considering topography, vegetation cover, human activity impact, land cover and other factors, 3) extract ecological corridors using circuit theory models, and 4) identify key ecological pinch points and ecological barrier points. Finally, based on the spatial heterogeneity of ecological resource distribution, economic development and production activities in this region, an optimization strategy is proposed for the ecosystem protection framework of Hainan Island. The findings will help enrich theoretical methods of constructing regional ESPs, and can provide a reference research paradigm for territorial spatial planning.
Hainan Island is located in the northwestern part of the South China Sea (18°10′–20°10′N, 108°37′–111°03′E). Hainan Island has a tropical monsoon marine climate, with an average annual temperature of 22.5°C–25.6°C and an average annual rainfall of 923–2459 mm (Liu et al., 2021a). With its unique hydrothermal resources, it is one of the most biodiverse regions in China and even in the world. Biologists have named it a natural species gene bank and natural museum. Vegetation on the island belongs to tropical and tropical island vegetation types, and the natural vegetation includes tropical monsoon rain forest, tropical rain forest, evergreen broad-leaved forest, mangrove forest, coniferous forest, scrubland, and grassland. Since the 1960s, 10 national nature reserves have been established on this island. In 2021, Hainan Tropical Rainforest National Park was officially established as one of China’s first national parks at the 15th Conference of the Parties to the Convention on Biological Diversity. The geographic location and current land use types of the study area are shown in Figure 1.
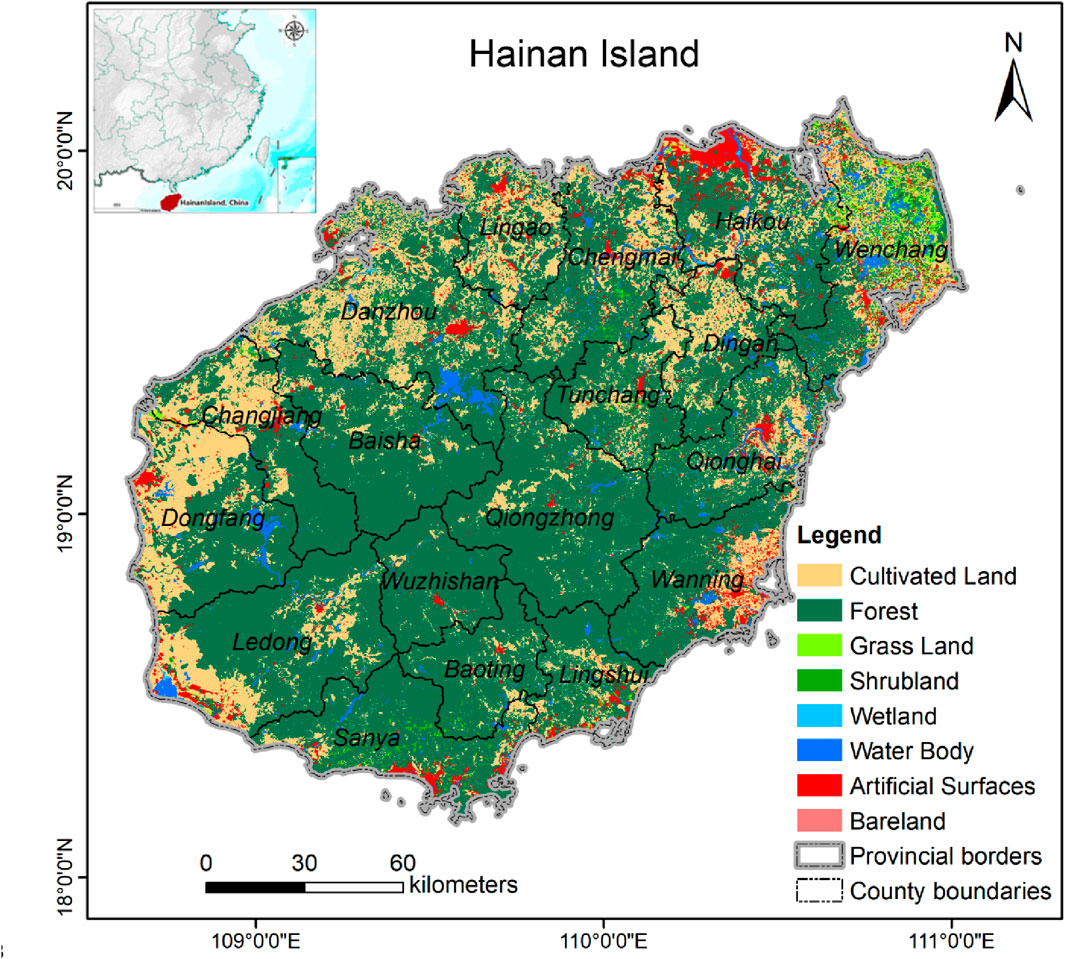
FIGURE 1. Geographical location and land use types in 2020 (Global30 data based on 30 m spatial resolution) of Hainan Island, China.
Several datasets were used in this study. These data are mainly spatial data and basic data. The spatial data include: 1) Land use data (GlobeLand30) of 30 m spatial resolution were obtained from the National Basic Geographic Information Center (http://www.globa lland cover.com/). 2) The digital elevation model (DEM) and remote sensing image data were all obtained from the geospatial data cloud website (http://www.gscloud.cn/). For DEM, ASTER GDEM V3 data with a spatial resolution of 30 m were used for the calculation of slope, topographic relief, topographic index, watershed extraction, etc. Landsat-8OLI images for August 2020, with a spatial resolution of 30 m, were used as remote sensing data and the vegetation coverage was calculated in ENVI. 3) Meteorological data, including temperature and precipitation, were obtained from the National Meteorological Data Center (http://data.cma.cn/). Grid data were interpolated using the Kriging interpolation method to calculate the average annual precipitation, potential evapotranspiration, and precipitation erosivity factors. 4) Soil datasets, covering soil organic matter content, soil texture, soil depth, and depth of root system, were obtained from the world of soil database, and they were used to calculate the soil erosion force factor and other indicators (HWSDv1.2, http://www.fao.org/soilsportal/soil-survey). The data of traffic (railway and highway), water system and residential areas were derived from the National Geographic Information Resources Directory Service System (http://www.webmap.cn). 6) The data of ecological redlines and nature reserves with a scale of 1:250,000 are derived from the delineation results of Hainan Provincial Land and Spatial Planning (2020–2035) and the scope of Hainan Provincial Nature Reserve, respectively. All raster pixels had a spatial resolution of 30 m × 30 m, and the projection coordinates were uniformly set to WGS 1984/UTM Zone 48N.
The basic data for analyzing the macro pattern of ecological protection and economic development and the status of ecosystems in Hainan Island, especially biodiversity and species distribution, were derived from the National Statistical Yearbook, Hainan Provincial Statistical Yearbook, National Ecological Function Zoning (2015 Revised Edition), and Master Plan for Major Projects for the Protection and Restoration of National Important Ecosystems (2021–2035). Using these data, environmental competitiveness was comprehensively evaluated and support was obtained for the subsequent construction of ESPs.
The rapid urbanization of Hainan Island has fragmented natural habitats and is posing threats to biodiversity (Chen et al., 2023a). The degradation of forest ecosystems in this region has reduced the carbon storage and sequestration capacity, which in turn affects the carbon cycle and climate regulation. At the same time, the shrinkage of water areas has severed the connection between water and natural elements such as vegetation, leading to a decrease in the ability to conserve water (Lei et al., 2022). In addition, ecological issues such as soil erosion, heavy rainfall, and degradation of the soil environment have been aggravated, seriously threatening the safety of human settlements (Zhao et al., 2015). Therefore, the assessment of ecological functions, including biodiversity maintenance, soil conservation, water conservation and climate regulation, is of great significance for maintaining the ecological security of Hainan Island. Accordingly, this study selected these four indicators as evaluation factors for assessing the importance of ecosystem services in Hainan Island. These indicators could be given the same weight (Zhou et al., 2023) because the characteristics of the ecosystems in the study area suggest that they are equally important for fulfilling ecological functions (Lin et al., 2023). The natural breakpoint method (ArcGIS 10.6, ESRI Inc., Redlands, CA, United States) was used to divide the evaluation results into five grades: unsuitable, low, medium, high, and optimal.
The Habitat Quality module of the InVEST model was used to calculate biodiversity maintenance as follows (Zhang et al., 2020b).
In the formula, Q is the habitat quality, j is the land cover type, x represents a grid, D is the stress level, k is the semi-saturation constant, 0.5 is taken with reference to previous studies, and z is the normalization constant, which is usually set to 2.5.
Ecological carbon sequestration was calculated using the Carbon Storage and Sequestration modules of the InVEST model (He et al., 2023)
where Ctotal is the total carbon storage of the basin (t/hm2); Cabove is the aboveground carbon storage (t/hm2); Cbelow is the underground carbon storage (t/hm2), and Csoil is the soil carbon storage (t/hm2). Cdead is the dead organic carbon stock (t/hm2).
Water conservation was estimated using the Annual Water Yield module of the InVEST model. (Li et al., 2023).
where AETx is the actual annual evapotranspiration of grid x and Px is the annual precipitation of grid x.
Soil conservation was calculated using the Sediment Delivery Ratio module of the InVEST model (Shi et al., 2012).
where RKLS is the amount of soil erosion in bare land; USLE is the amount of soil erosion where management measures or vegetation cover have been implemented; R is the rainfall erosion factor; K is the soil erodibility factor; LS is the terrain factor; C is the coverage and management factor; P is the factor of soil and water conservation measures. The P and C coefficients were assigned with reference to the relevant research results (Jiang et al., 2016). Rainfall erosivity is calculated based on monthly rainfall and annual average rainfall (Lin et al., 2023). The formula for calculating the K-factor is:
where Sand, Silt, Clay and C represent the content (%) of gravel, silt, clay and organic carbon, respectively.
The basic step of constructing ESPss is to determine ecological sources (Dai, 2022). Generally, as an important patch to maintain the stability of ecosystem and the integrity of landscape pattern, ecological source plays a key role in maintaining regional ecological security and biodiversity protection (Peng et al., 2018b). In this study, the optimal patches of ecosystem service importance were used as the preliminary identification results of ecological sources. The ecological redline covers not only important areas of ecosystem functions, but also sensitive and fragile areas of the ecological environment, such as desertification, rocky desertification, and salinization areas (Tang et al., 2020). In contrast, nature reserves refer to areas with the most intact natural ecosystems. Specifically, the data of ecological redlines and nature reserves were introduced into the identification of ecological sources (Figure 9; Figure 10), and their intersection areas were extracted to adjust the ecological sources by using the spatial overlay tool in ArcGIS 10.6. However, in the preliminarily extracted ecological sources, patches smaller than 5 km2 were found to be relatively fragmented and scattered, with very low connectivity between them and larger landscape patches. Considering that ecological sources have a certain area protecting the core area from external interference and that the radiation function of patches with smaller areas is weak (Kang et al., 2021). Therefore, by referring to relevant research results (Lin et al., 2023), the core areas of ecological sources were further screened out through morphological spatial pattern analysis (≥5 km2).
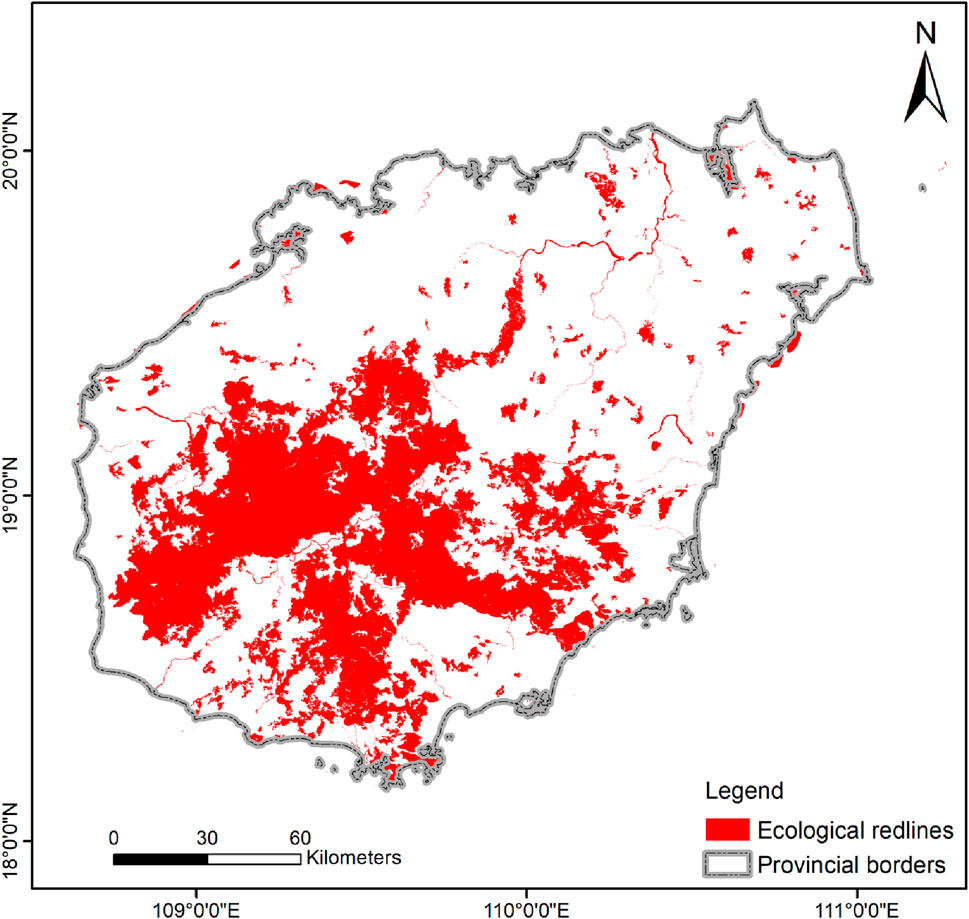
FIGURE 9. Spatial distribution of ecological protection red lines in Hainan Island.
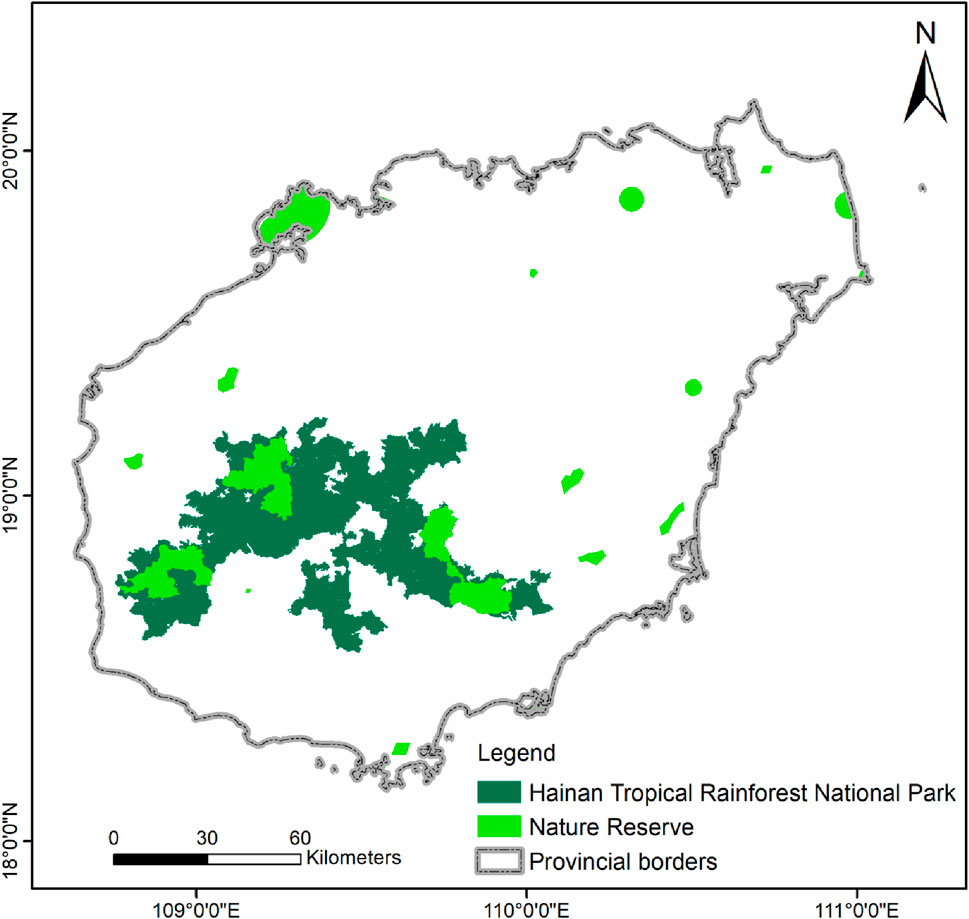
FIGURE 10. Spatial distribution of nature reserves in Hainan Island.
The landscape resistance surface is the basis for calculating the dispersal path of species in the case of overcoming resistance (Chen et al., 2020). The more perfect the landscape ecological function, the less resistance the species will be subjected to, and the greater the resistance will be on the contrary. According to previous research experience, in this study, land use, vegetation coverage, elevation, slope, topographic relief, and distance from water were taken as natural resistance, and rural settlements, urban land use, and road distance were taken as interference of human activities (Lin et al., 2023). On the basis of referring to the relevant research results (Lin et al., 2023; Qin et al., 2023), and combined with the difference of habitat suitability and the principle of distance attenuation in the study area, the ecological resistance value was assigned to the resistance factor.The index weight of each resistance factor was determined using the analytic hierarchy process (Table 1), and the landscape resistance surface was calculated using the weighted sum method.
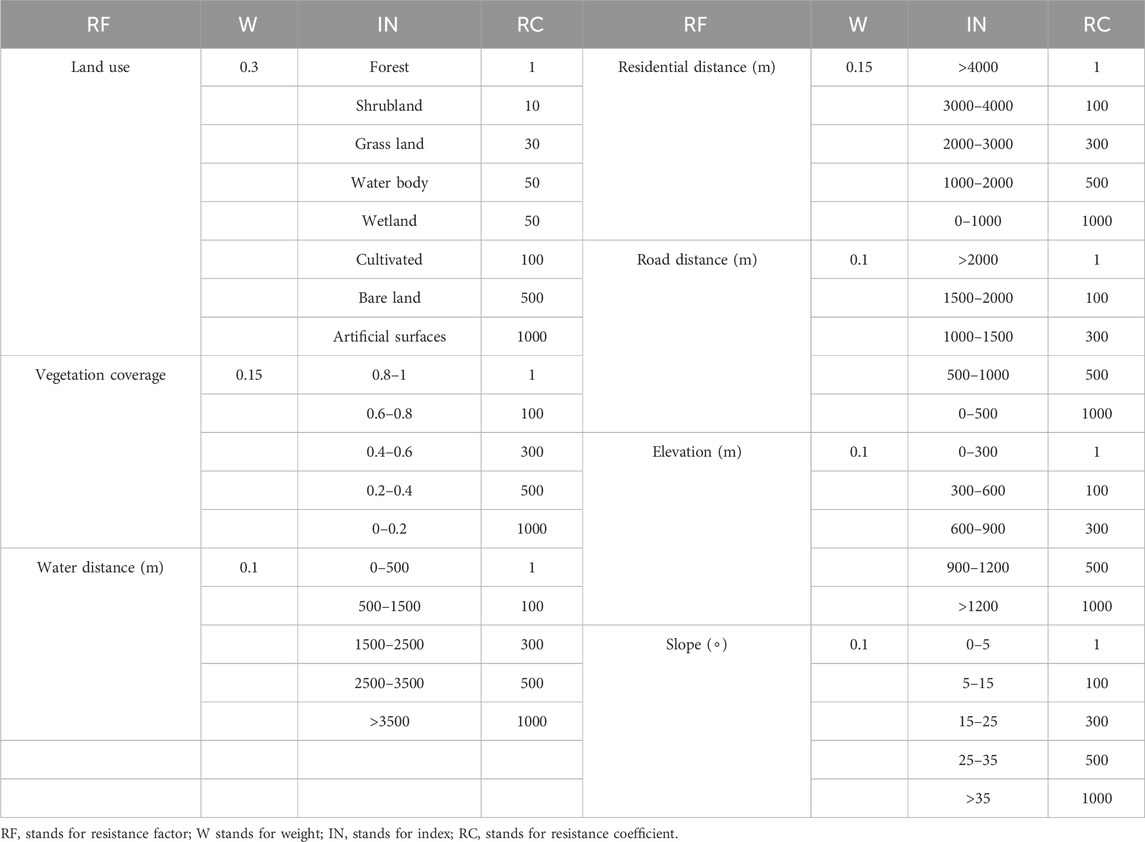
TABLE 1. Landscape resistance factors and resistance coefficients.
Ecological corridors are links that maintain the material transfer and energy flow between ecological sources, and they are also key to overcoming landscape resistance and improving landscape connectivity (Liu et al., 2021b). The connectivity model of CT considers the random walk characteristic of species and accords with the migration status of species. Even in the absence of species migration data, the multipath analysis can accurately simulate the dispersal path of species in heterogeneous landscapes (McRae et al., 2008). Therefore, potential ecological corridors can be extracted on the basis of current density distribution (Chen et al., 2022). In this study, the landscape connectivity between ecological sources in the study area was analyzed using the connectivity model of CT. Moreover, potential ecological corridors in the study area were simulated using the Linkage Mapper tool of Circuitscape and the minimum cost path was extracted as the optimal ecological corridor. In addition, on the basis of extracting the least-cost path, by referring to relevant research results (Luo and Fu, 2023), the centrality index of the least-cost path was calculated through the Centrality Mapper module of Circuitscape, and its connectivity was quantified, and the optimal ecological corridor was divided into primary and secondary ecological corridors.
Ecological pinch points characterize areas with high current density in the ecological network, and they are also known as “bottleneck points”; in other words, they are areas with a high probability of species migration or irreplaceable paths (Huang et al., 2020). In this study, ecological pinch points of the overall landscape were identified using the “all-to-one” pattern of the PinchpointMapper module of Circuitscape. Considering that the core position of the grip point is not affected by the change of the width of the corridor, the cost-weighted distance of the corridor was set to 20,000 m after several tests. Finally, the current density results were categorized into five grades using the natural breakpoint method, and the highest level was selected as the ecological pinch point of the study area.
Ecological barrier points refer to the areas where the migration of species between sources is greatly hindered, and they can be identified by calculating the cumulative current recovery value (Huang et al., 2020). The restoration of barrier points can significantly reduce the resistance to species migration. In this study, ecological barrier points were identified using the Barrier Mapper module of Circuitscape. Specifically, the ‘Maximum’ mode was selected for iterative operation, and the minimum and maximum search radii were set to 100 m and 600 m, respectively, with a step size of 100 m. After many tests, the 300 m gradient was finally selected as the most reasonable iteration radius in this study.
From the perspective of spatial pattern (Figure 3), the spatial distribution of the biodiversity maintenance function significantly varied across Hainan Island. Areas with the optimal level of the biodiversity maintenance function were mainly distributed in the central and southern mountainous regions, and unsuitable areas were distributed in the urban built-up areas and agricultural land concentration areas in the coastal zone around the island. Areas with the optimal water conservation function were distributed in the southeast coastal area, and the spatial distribution presented a trend of decline from east to west, which is basically consistent with the trend of annual precipitation. The spatial distributions of the soil conservation function, ecological carbon sequestration function, and biodiversity maintenance function were similar, and the optimal areas were centered on the central mountain area and radiated to the surrounding areas. Specifically, the land use type of optimal areas was dominated by forest, whereas that of unsuitable areas comprised construction land and agricultural land.
The spatial distribution of the importance of ecosystem services showed significant differences (Figure 2; Table 2). Optimal habitat space is widely distributed in Hainan Island, covering an area of 10,982.50 km2, accounting for 34.25% of the total suitable habitats. The areas of low, medium and high-level habitats space were 6922.96 km2, 2900.13 km2, and 11259.39 km2, accounting for 21.59%, 9.04% and 35.11%, respectively. The optimal habitat space is mainly located in the central mountainous region, including several counties such as Qiongzhong, Ledong, Wanning, Wuzhishan, Baoting, and Baisha counties. The influence of human activity is relatively low in these areas, and they have extremely high vegetation coverage and species richness, with a large area of natural forest, comprising tropical forest, tropical rainforest, evergreen broad-leaved forest and other tropical vegetation landscape. As an ideal habitat for various species, it has tropical rainforest national parks, namely, Bawangling, Limushan, Jianfengling, and Wuzhishan, as well as other national nature reserves. Moreover, a number of ecological protection priority policies and ecological restoration measures have been implemented. In addition, the optimal habitat space of Sanya is widely distributed, which may be attributed to its abundant precipitation and extremely high forest cover in the north, and limited human activities in the southern coastal area. The high level of habitat space is connected with the optimal habitat in the central mountainous area, and its distribution is also larger in the northern region, including Danzhou, Chengmai, and Wenchang counties. These areas are mostly hills and basins with less natural forest vegetation compared to central areas. As areas primarily covered by bamboo forest and rubber forest and disturbed by frequent human activities, coupled with a single ecosystem type, landscape fragmentation is prominent and their ecological environment is more fragile than that of the central mountainous area. Areas of low-level habitat space are mainly distributed in the southwestern, western, and northern island tableland and coastal zone, and the main land use type is agricultural land, with large areas of orchards and tea gardens. The habitats are seriously damaged by the intensive cultivation activities. The smallest suitable habitat areas were observed in regions, such as Haikou, Lingshui and Lingao, where built-up urban areas are dense, the population and road density are very high, and human damage to the ecological environment is more serious compared to other regions.
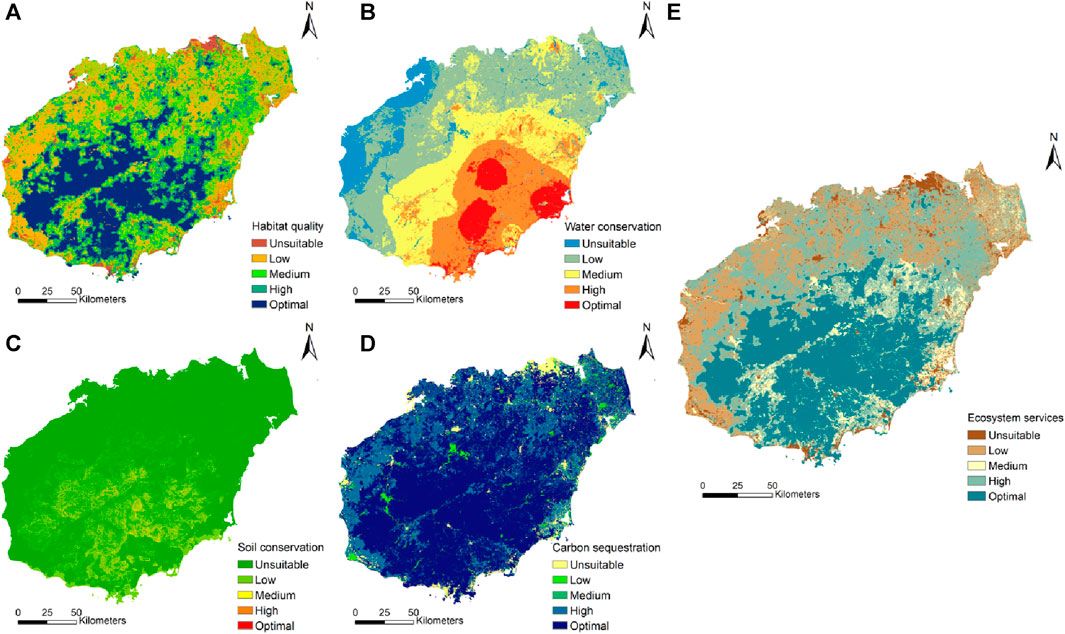
FIGURE 2. Spatial distribution pattern of the importance of ecosystem services in Hainan Island. (A) biodiversity maintenance, (B) water conservation, (C) surface soil conservation, (D) ecological carbon sequestration, and (E) importance of ecosystem services.
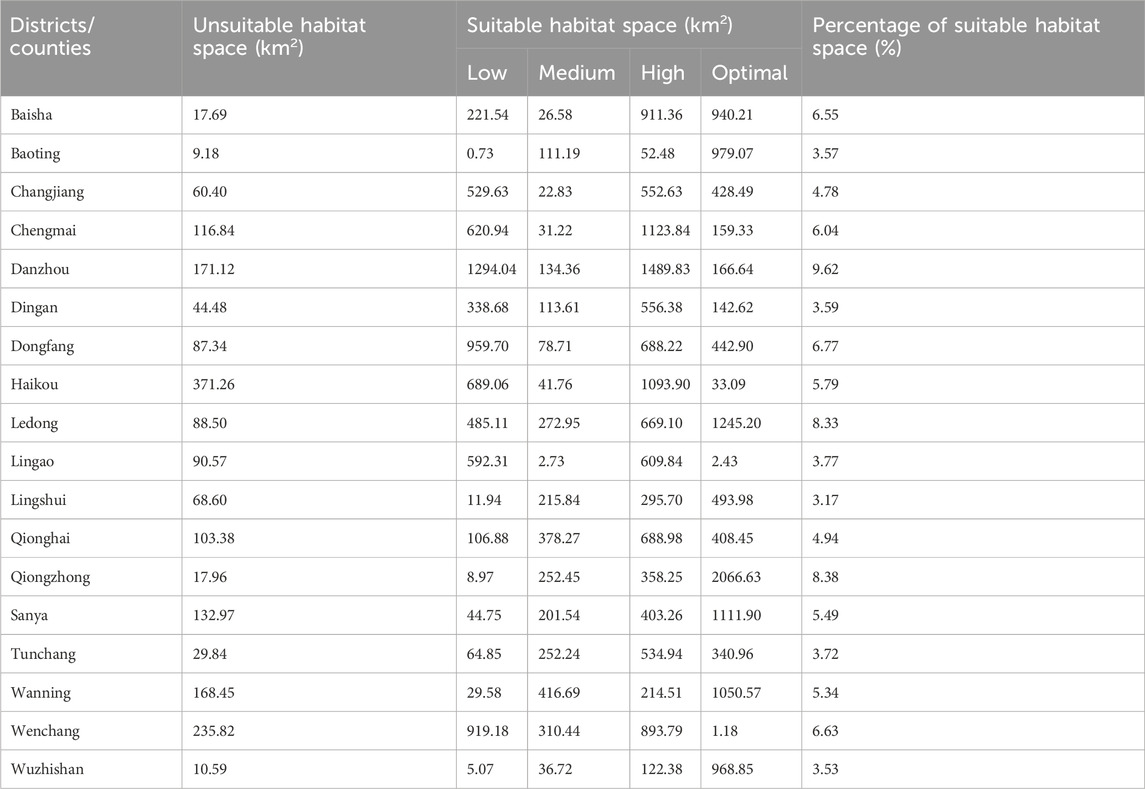
TABLE 2. Importance of ecosystem services in various districts and counties of Hainan Island.
Figure 3 shows the spatial distribution of core ecological sources in the study area (Figure 3). In this study, 65 ecological sources with a total area of 8238.23 km2 were identified, accounting for 23.27% of the total area of the study area. Through superposition analysis of ecological source areas, ecological function areas, and land vegetation types, the ecological source areas were found to essentially coincide with Hainan National Park, 40 important mountains such as Wuzhishan, Bawangling, Jianfengling and Limushan, 620,000 ha of tropical rainforest, 12 nature reserves, and 3 major rivers. The main land use type of ecological source areas was natural forest, with an area of 6151.34 km2, accounting for 74.67% of the total area of ecological sources, followed by rubber orchard and water areas (river and reservoir), with areas of 1294.80 km2 and 380.51 km2, accounting for 15.72% and 4.62% respectively. From the perspective of spatial distribution, approximately 83.67% of ecological source areas are distributed in the central region of Hainan Island, approximately 14% are distributed in the area around the island, and approximately 2.33% are distributed in the coastal zone around the island. Ecological source areas showed the widest distribution in Baisha, with an area of 1162.25 km2, accounting for 14.11%, followed by Qiongzhong and Ledong, with areas of 1130.06 km2 and 1051.67 km2, accounting for 13.72% and 12.77%, respectively. The distribution of ecological sources was relatively small in other counties and cities.
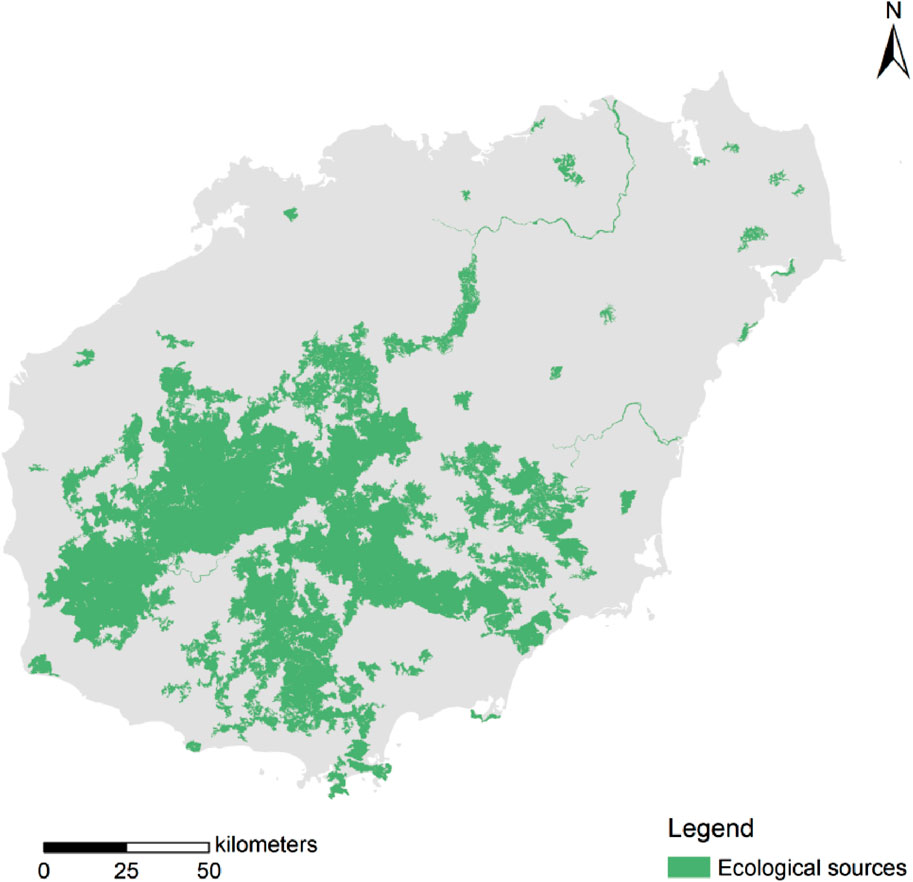
FIGURE 3. Spatial distribution of ecological sources in Hainan Island.
High-resistance patches were mainly concentrated in populated areas along the coastal zone around the island (Figure 4). In particular, Haikou in the northern coast showed the highest landscape resistance and the widest distribution of high-resistance patches. The remaining high-resistance patches were scattered, and the main land use types were urban land, rural residential land, and industrial and mining land. On the whole, the ecological connectivity between high-resistance patches was low, and the relatively frequent human activities resulted in strong disturbance and destruction of ecosystems, as well as habitat fragmentation. In contrast, the central region, with its extremely high vegetation coverage and less human disturbance, showed higher landscape connectivity among its ecosystems.
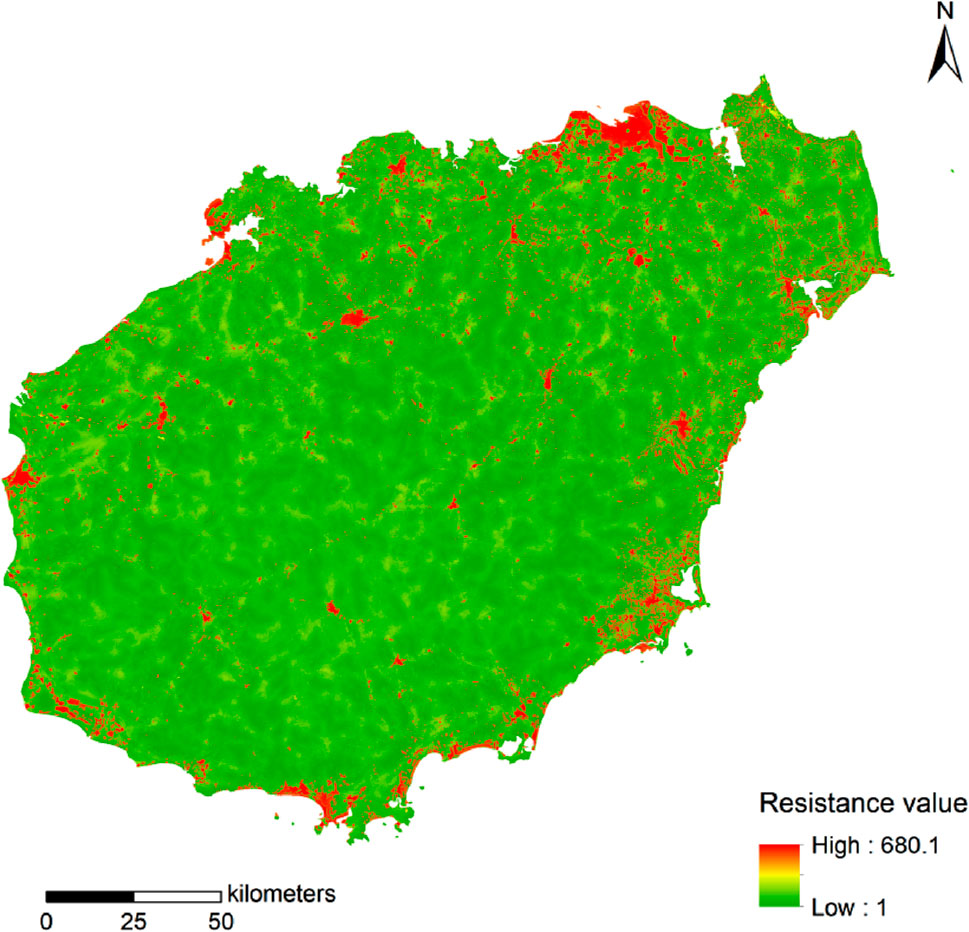
FIGURE 4. Spatial distribution of landscape resistance surface in Hainan Island.
In this study, a total of 138 ecological corridors were extracted using the CT model (Figure 5), covering an area between 0.24 km and 83.63 km, with a total length of 1851.36 km. There were 73 primary ecological corridors with a total length of 811.11 km, which radiated from the large ecological source area in the middle to the periphery. The ecological corridors showed strong central connectivity and short lengths, indicating low resistance of habitat connectivity in this area. There were 65 secondary ecological corridors with a total length of 1040.25 km, mostly distributed in the northeast, where the distribution of ecological patches was relatively scattered, indicating weak connection between ecological sources. It is difficult to construct ecological flow paths for species activities in this area.
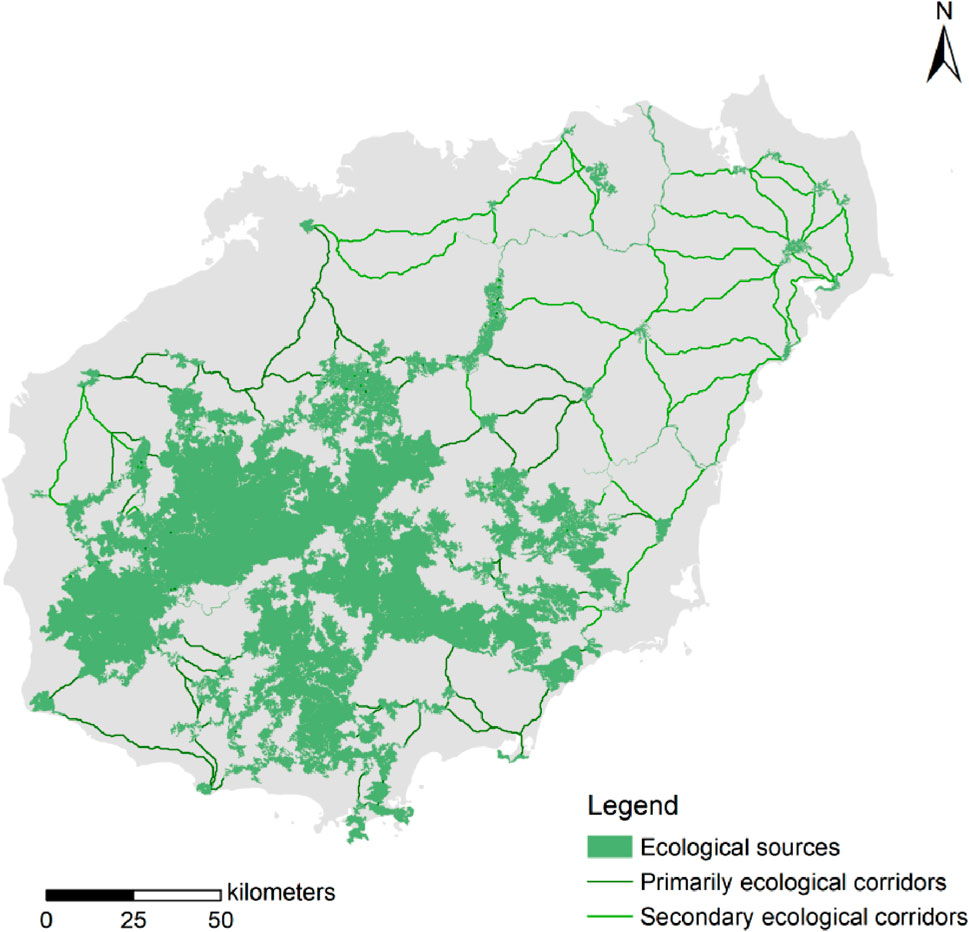
FIGURE 5. Spatial distribution of key ecological corridors in Hainan Island.
Figure 6 illustrates the CT-based extraction of ecological pinch points in regions of high current density (Figure 6). A total of 222 ecological pinch points were identified in Hainan Island, with a total area of 90.22 km2, of which the largest and smallest pinch areas were 26.16 km2 and 0.04 km2, respectively. Among the land use types at the pinch points, forest accounted for the largest proportion (46.10%), followed by farmland (28.82%), water (9.95%), artificial surface (8.09%), grassland (5.30%), and wetland (0.80%). From the perspective of spatial distribution, the ecological pinch points were mostly distributed in the northeast and are located in important ecological corridors. After superimposing on the resistance surface, the ecological pinch points were found to be all located in areas with low resistance values surrounded by areas with high resistance. This indicates that species can easily migrate through low resistance areas, and the ecological connectivity function is prominent. These areas are key protection areas for maintaining ecological stability.
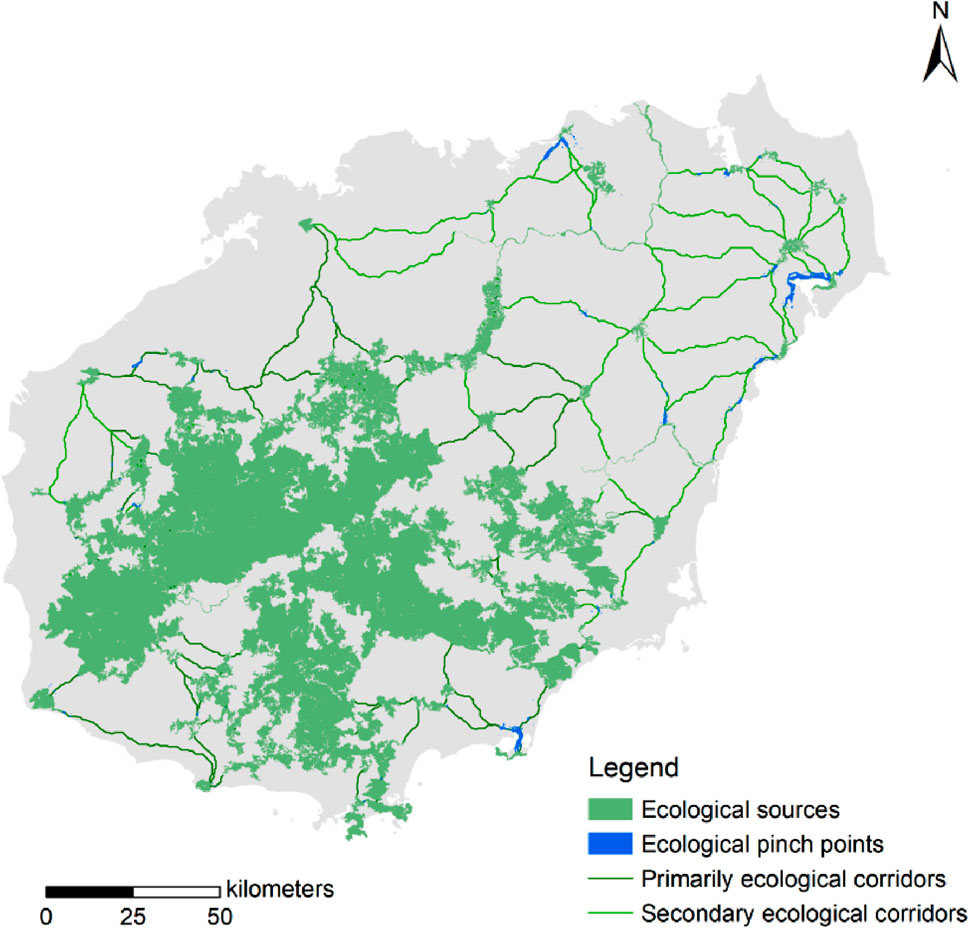
FIGURE 6. Spatial distribution of ecological pinch points in Hainan Island.
Figure 7 illustrates the spatial distribution of areas with high cumulative current recovery, i.e., ecological barrier points (Figure 7). A total of 198 ecological barrier points were identified on Hainan Island, with a total area of 50.55 km2, of which the largest and smallest areas were 2.35 km2 and 0.09 km2, respectively. Among the land use types of ecological barrier points, farmland accounted for the largest proportion (53.23%), followed by forest (23.32%), grassland (6.55%), artificial surface (8.53%), water body (7.0%), and wetland (0.1%). In terms of the spatial distribution, the ecological barrier points were distributed in the northeast and southwest, with most of them being located in areas around traffic arteries such as railways and highways around the island. Larger barrier points were located in construction land or the radiation area around construction land with serious interference by human activities. These areas have high ecological resistance, which may hinder the connection between ecological source patches and increase the risk of regional ecological degradation.
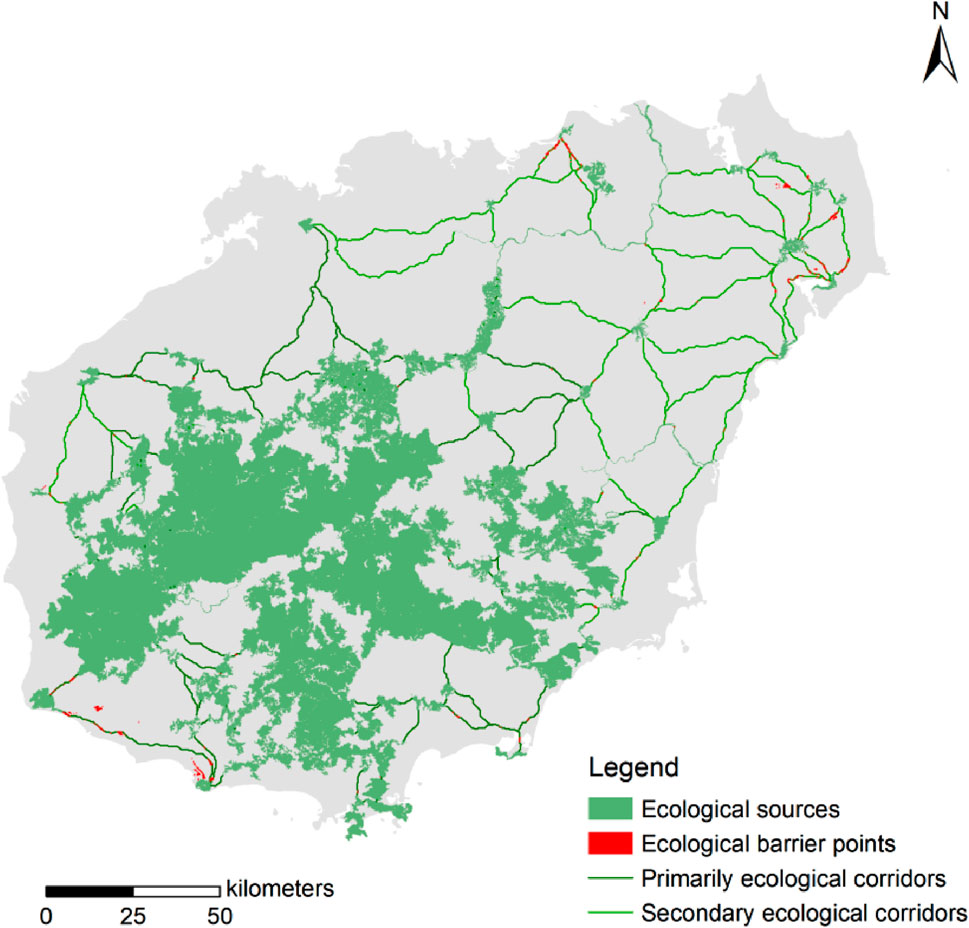
FIGURE 7. Spatial distribution of ecological barrier points.
In this study, on the basis of the traditional ‘source-resistance surface-corridor’ framework, the identification of ecological pinch points and eco-strategic points was added, and their importance was evaluated (Figure 8). The specific results of the ESPs are as follows: 1) There are 65 large-scale ecological sources in Hainan Island, with a total area of 8238.23 km2. Approximately 83.67% of the ecological sources are concentrated in the biodiversity conservation and water conservation areas in the central part of the island, covering the county-level administrative districts of Baisha, Ledong, Sanya, Baoting, Wanning, Wuzhishan, and Qiongzhong. The ‘ecological green heart’ comprises the tropical rainforest national park, which consists of 40 mountains (including Wuzhishan, Bawangling, Jianfengling and Limushan) and three major rivers (Nandu River, Changhua River and Wanquan River). In contrast, small-scale ecological source areas are dominated by woodland, with rubber plantations and water patches distributed in northern tableland area and the coastal zone around the island. 2) There are a total of 138 ecological corridors, including 73 major ecological corridors (811.11 km) and 65 minor ecological corridors (1040.25 km), which connect the central ecological green heart with the surrounding small ecological sources through a spider web-like pattern. 3) There are a total of 222 ecological pinch points with a total area of 90.22 km2, which are located in areas with small resistance values and key protection areas for maintaining ecological stability. 4) There are 198 ecological barrier points with a total area of 50.55 km2. Large barrier points have high ecological resistance, which can sever the connection between ecological source patches and increase the risk of regional ecological degradation. Therefore, they should be designated as key priority areas in the ecological planning of land space.
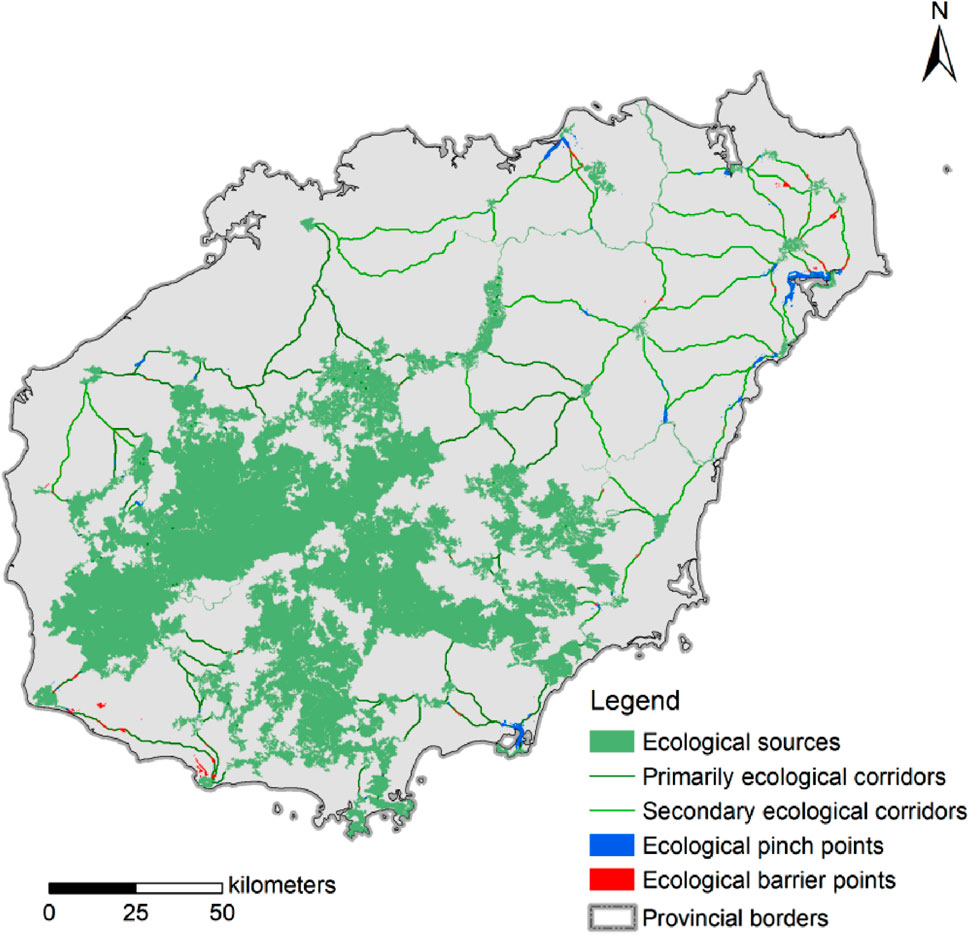
FIGURE 8. Characteristics and spatial distribution of ESPs in Hainan Island.
As an important tool for ecosystem protection and restoration, the construction of ESPs emphasizes the solution of regional ecological problems (Wang et al., 2020), for which a series of thresholds and security levels are determined according to natural ecological processes and ecosystem functions (Dai, 2022). In this manner, a spatial pattern can be designed for maintaining and controlling ecological processes, strengthening ecosystem functions, improving the landscape connectivity among various ecosystem elements (Hansen et al., 2011), and realizing the purpose of maintaining regional ecological security. In this study, the spatial variation of the importance of ecosystem services in Hainan Island was analyzed using InVEST model and CT model, and a multi-level ecological security framework was constructed, which was composed of points, lines and plane. The ESPss and ecosystem services are intrinsically interconnected and critical to human wellbeing (Li et al., 2016). Therefore, it is necessary to evaluate the importance of ecosystem services quantitatively before constructing ESPss (Zhang et al., 2020a). Ecosystem service functions were found to be strongly correlated with vegetation coverage and ecological environment quality, and the optimal habitat scale may be related to the degree of landscape patch fragmentation and other factors (Gao et al., 2015). Areas of high-value ecosystem services are distributed in the forest area of the central mountain, whereas low-value areas are distributed in urban built-up area and other areas with intensive human activities in the coastal zone around the island. This indicates that the increase of human activities has disturbed the natural landscape conditions. In particular, urban expansion has intensified the fragmentation of landscape patches, which seriously threatens species migration, biodiversity protection, and regional ecological security (Wang et al., 2019). The threat of natural factors to ecosystem services is relatively small compared to human disturbances such as population and socio-economic factors (DeFries et al., 2010). Therefore, it is necessary to focus on the protection and restoration of areas with high levels of human disturbance, while also focusing on the integrity of ecosystems in areas with weak ecological foundations.
Methods of identifying ecological sources have gradually changed from the direct delineation of nature reserves to indirect identification oriented towards the importance of ecological service functions and landscape connectivity (Kéfi et al., 2014). Some scholars have also revised ecological sources obtained using indirect identification methods through nature reserves or ecological protection red lines, with the aim of obtaining more complete and continuous ecological patches (Yu et al., 2009; Xu et al., 2015). Based on prior knowledge and ecological background conditions of the study area, this study comprehensively considered landscape connectivity assessment, integrated ecosystem service importance assessment, and ecological protection red lines to identify ecological source areas, and compensated for the shortcomings of single identification methods as well as the lack of theoretical support in previous studies. The results of the study are more likely to reflect the core role of ecological sources. The results show the presence of 65 large ecological sources in Hainan Island, with approximately 83.67% of the core ecological sources being distributed in the central mountainous area, and approximately 16.33% being distributed in the tableland and coastal zone around the island. Forests occupy a large proportion of the identified ecological source patches. Meanwhile, these areas are also an important ecological functional area in the country, a major river source area, an important water conservation area, and an important area for soil and water conservation. They play a key role in maintaining the ecological balance of the island, alleviating natural disasters, and ensuring the ecological security of the island. Therefore, it is necessary to strictly protect the ecological resources of the ecological green heart, implement local protection policies for rare and endangered animal and plant populations, repair ecologically damaged areas, formulate protection plans for priority areas of biodiversity protection.
This study focused not only on the core role of ecological source areas, but also on priority protection areas of the ecological corridor in the construction of ecological security pattern. Ecological corridors are important links expressing regional landscape connectivity, directly reflecting the habitat and feeding range of species (Williams and Snyder, 2005). However, due to the limitations of ecosystems and geospatial heterogeneity, the identification of priority areas through ecological corridors remains challenging (Xiao et al., 2020). Using the advantages of CT to simulate species random walk and identify ecological nodes, 73 primary ecological corridors, 65 secondary ecological corridors, 222 ecological pinch points and 198 ecological barrier points were effectively identified. This comprehensive identification method of corridors and nodes perfectly combines the attributes of ecological sources with the contributions of ecological corridors to landscape integrity (Zhu et al., 2020). It can determine the priority of ecological corridor scientifically and reduce the subjectivity and uncertainty involved in existing methods (Dai, 2022).
Under the influence of human activities, global climate change and other factors, Hainan Island is facing ecological risks such as biodiversity decline, wildlife habitat reduction, water conservation capacity reduction, and serious soil erosion in local areas, which threaten ecosystem stability, ecological security, and human wellbeing (Geng et al., 2022). This study adequately describes the spatial variation of the importance of ecosystem services and ecological security elements. Based on the findings, several priority conservation actions can be fully considered. Firstly, ecological sources, ecological corridors, ecological pinch points and ecological barrier points should be incorporated into long-term ecological conservation planning, especially forest ecosystems in the central part of the study area, which is covered by 620,000 ha of tropical rain forest resources. The entire tropical forest can increase biodiversity by 15%–84% with reference to degraded ecosystems (Dinerstein et al., 2019). Secondly, the ecosystem of the tableland around the island in the northern part of the study area is fragmented and has serious marginal effects due to frequent farming activities. Therefore, it is urgent to prioritize the protection of the ecological source in this area and to restore degraded ecosystems through artificial restoration or reconstruction projects in a planned and stepwise manner, especially for ecosystems facing strong resistance. In addition, wetland resources accounted for only 2.33% of the identified ecological sources. Hainan Island’s wetland resources, especially mangroves, are among the most productive ecosystems in the world (Wang and Gu, 2021). In future priority conservation plans, it is necessary to avoid the degradation of wetland ecosystems caused by pollution, excessive logging, and alien biological invasion. Therefore, the ecological crisis of biodiversity degradation, habitat fragmentation, habitat quality decline, and ecological function reduction on Hainan Island demand urgent attention. Moreover, land use and conservation goals and plans should be coordinated to formulate strategies and actions for the protection and restoration of various precious ecological resources.
Based on the importance of four ecosystem service functions (biodiversity maintenance, water conservation, ecological carbon sequestration, and soil conservation) in Hainan Island, this study used the “source-resistance surface-corridor” paradigm to construct an ecological security pattern and identify key areas of ecological restoration. The results showed that the optimal habitats in Hainan Island are distributed in the central region with diverse ecosystems. In contrast, landscape patches in the coastal zone around the island are fragmented because of human activities. The region features 65 large ecological sources, mainly composed of forests and water bodies, and 138 ecological corridors (73 primary ecological corridors and 65 secondary ecological corridors). The large ecological sources are concentrated in biodiversity and water conservation areas in the central part of the region, and the ecological corridors radiate across the whole area in the form of a spider web, connecting all important ecological patches. In addition, 222 ecological pinch points and 198 ecological barrier points have been identified as key areas of protection and restoration for the improvement of ecosystem functions.
The original contributions presented in the study are included in the article/Supplementary material, further inquiries can be directed to the corresponding author.
HL: Conceptualization, Data curation, Methodology, Software, Writing–original draft. GZ: Conceptualization, Data curation, Investigation, Methodology, Writing–review and editing. TL: Conceptualization, Data curation, Software, Writing–review and editing. SR: Conceptualization, Data curation, Methodology, Software, Writing–review and editing. BC: Conceptualization, Data curation, Methodology, Writing–review and editing. KF: Conceptualization, Data curation, Methodology, Writing–review and editing. WL: Conceptualization, Data curation, Methodology, Software, Writing–review and editing. XZ: Conceptualization, Data curation, Methodology, Software, Writing–review and editing. PQ: Conceptualization, Methodology, Software, Writing–review and editing. JZ: Conceptualization, Data curation, Methodology, Software, Writing–review and editing.
The author(s) declare financial support was received for the research, authorship, and/or publication of this article. This work was supported by the National Natural Science Foundation of China (Grant/Award Number: 32201557) and the China Aero Geophysical Survey and Remote Sensing Center for Natural Resources Fund (Grant/Award Number: 300012000000230031).
I would like to thank the national natural science foundation of China, the China Aero Geophysical Survey and Remote Sensing Center for Natural Resources and the Technology Innovation Center for Geohazards Identification and Monitoring with Earth Observation System, Ministry of Natural Resources of the People’s Republic of China to support and help the work.
The authors declare that the research was conducted in the absence of any commercial or financial relationships that could be construed as a potential conflict of interest.
All claims expressed in this article are solely those of the authors and do not necessarily represent those of their affiliated organizations, or those of the publisher, the editors and the reviewers. Any product that may be evaluated in this article, or claim that may be made by its manufacturer, is not guaranteed or endorsed by the publisher.
Almenar, J. B., Bolowich, A., Elliot, T., Geneletti, D., Sonnemann, G., and Rugani, B. (2019). Assessing habitat loss, fragmentation and ecological connectivity in Luxembourg to support spatial planning. Landsc. Urban Plan. 189, 335–351. doi:10.1016/j.landurbplan.2019.05.004
Bai, H., Li, Z., Guo, H., Chen, H., and Luo, P. (2022). Urban green space planning based on remote sensing and geographic information systems. Remote Sens. 14, 4213. doi:10.3390/rs14174213
Chen, C., Shi, L., Lu, Y., Yang, S., and Liu, S. (2020). The optimization of urban ecological network planning based on the minimum cumulative resistance model and granularity reverse method: a case study of Haikou, China. IEEE Access 8, 43592–43605. doi:10.1109/access.2020.2976548
Chen, H., Li, D., Chen, Y., and Zhao, Z. (2023a). Spatial–temporal evolution monitoring and ecological risk assessment of coastal wetlands on hainan island, China. Remote Sens. 15, 1035. doi:10.3390/rs15041035
Chen, J., Wang, S., and Zou, Y. (2022). Construction of an ecological security pattern based on ecosystem sensitivity and the importance of ecological services: a case study of the Guanzhong Plain urban agglomeration, China. Ecol. Indic. 136, 108688. doi:10.1016/j.ecolind.2022.108688
Chen, X., Kang, B., Li, M., Du, Z., Zhang, L., and Li, H. (2023b). Identification of priority areas for territorial ecological conservation and restoration based on ecological networks: a case study of Tianjin City, China. Ecol. Indic. 146, 109809. doi:10.1016/j.ecolind.2022.109809
Ci, M., Ye, L., Liao, C., Yao, L., Tu, Z., Xing, Q., et al. (2023). Long-term dynamics of ecosystem services and their influencing factors in ecologically fragile southwest China. Sustainability 15, 12331. doi:10.3390/su151612331
Dai, Y. (2022). Identifying the ecological security patterns of the three gorges reservoir region, China. Environ. Sci. Pollut. Res. 29, 45837–45847. doi:10.1007/s11356-022-19173-3
DeFries, R., Karanth, K. K., and Pareeth, S. (2010). Interactions between protected areas and their surroundings in human-dominated tropical landscapes. Biol. Conserv. 143, 2870–2880. doi:10.1016/j.biocon.2010.02.010
De León, L. F., Sharpe, D. M., Gotanda, K. M., Raeymaekers, J. A., Chaves, J. A., Hendry, A. P., et al. (2019). Urbanization erodes niche segregation in Darwin's finches. Evol. Appl. 12, 1329–1343. doi:10.1111/eva.12721
Dinerstein, E., Vynne, C., Sala, E., Joshi, A. R., Fernando, S., Lovejoy, T. E., et al. (2019). A global deal for nature: guiding principles, milestones, and targets. Sci. Adv. 5, eaaw2869. doi:10.1126/sciadv.aaw2869
Dong, J., Peng, J., Xu, Z., Liu, Y., Wang, X., and Li, B. (2021). Integrating regional and interregional approaches to identify ecological security patterns. Landsc. Ecol. 36, 2151–2164. doi:10.1007/s10980-021-01233-7
Fang, X., Zou, J., Wu, Y., Zhang, Y., Zhao, Y., and Zhang, H. (2021). Evaluation of the sustainable development of an island “Blue Economy”: a case study of Hainan, China. Sustain. Cities Soc. 66, 102662. doi:10.1016/j.scs.2020.102662
Ferrari, R., Malcolm, H., Neilson, J., Lucieer, V., Jordan, A., Ingleton, T., et al. (2018). Integrating distribution models and habitat classification maps into marine protected area planning. Estuar. Coast. Shelf Sci. 212, 40–50. doi:10.1016/j.ecss.2018.06.015
Fu, Y., Shi, X., He, J., Yuan, Y., and Qu, L. (2020). Identification and optimization strategy of county ecological security pattern: a case study in the Loess Plateau, China. Ecol. Indic. 112, 106030. doi:10.1016/j.ecolind.2019.106030
Gao, P., Niu, X., Wang, B., and Zheng, Y. (2015). Land use changes and its driving forces in hilly ecological restoration area based on gis and rs of northern China. Sci. Rep. 5, 11038. doi:10.1038/srep11038
Geng, J., Yuan, M., Xu, S., Bai, T., Xiao, Y., Li, X., et al. (2022). Urban expansion was the main driving force for the decline in ecosystem services in hainan island during 1980–2015. Int. J. Environ. Res. Public Health 19, 15665. doi:10.3390/ijerph192315665
Han, N., Hu, K., Yu, M., Jia, P., and Zhang, Y. (2022). Incorporating ecological constraints into the simulations of tropical urban growth boundaries: a case study of Sanya city on hainan island, China. Appl. Sci. 12, 6409. doi:10.3390/app12136409
Hansen, A. J., Davis, C. R., Piekielek, N., Gross, J., Theobald, D. M., Goetz, S., et al. (2011). Delineating the ecosystems containing protected areas for monitoring and management. BioScience 61, 363–373. doi:10.1525/bio.2011.61.5.5
He, Y., Ma, J., Zhang, C., and Yang, H. (2023). Spatio-temporal evolution and prediction of carbon storage in guilin based on FLUS and InVEST models. Remote Sens. 15, 1445. doi:10.3390/rs15051445
Huang, J., Hu, Y., and Zheng, F. (2020). Research on recognition and protection of ecological security patterns based on circuit theory: a case study of Jinan City. Environ. Sci. Pollut. Res. 27, 12414–12427. doi:10.1007/s11356-020-07764-x
Huang, K., Peng, L., Wang, X., and Deng, W. (2022). Integrating circuit theory and landscape pattern index to identify and optimize ecological networks: a case study of the Sichuan Basin, China. Environ. Sci. Pollut. Res. 29, 66874–66887. doi:10.1007/s11356-022-20383-y
Jiang, C., Li, D., Wang, D., and Zhang, L. (2016). Quantification and assessment of changes in ecosystem service in the Three-River Headwaters Region, China as a result of climate variability and land cover change. Ecol. Indic. 66, 199–211. doi:10.1016/j.ecolind.2016.01.051
Kang, J., Zhang, X., Zhu, X., and Zhang, B. (2021). Ecological security pattern: a new idea for balancing regional development and ecological protection. A case study of the Jiaodong Peninsula, China. Glob. Ecol. Conservation 26, e01472. doi:10.1016/j.gecco.2021.e01472
Kéfi, S., Guttal, V., Brock, W. A., Carpenter, S. R., Ellison, A. M., Livina, V. N., et al. (2014). Early warning signals of ecological transitions: methods for spatial patterns. PloS one 9, e92097. doi:10.1371/journal.pone.0092097
Kukkala, A. S., and Moilanen, A. (2017). Ecosystem services and connectivity in spatial conservation prioritization. Landsc. Ecol. 32, 5–14. doi:10.1007/s10980-016-0446-y
Lei, J., Chen, Y., Li, L., Chen, Z., Chen, X., Wu, T., et al. (2022). Spatiotemporal change of habitat quality in Hainan Island of China based on changes in land use. Ecol. Indic. 145, 109707. doi:10.1016/j.ecolind.2022.109707
Li, C., Wu, Y., Gao, B., Zheng, K., Wu, Y., and Li, C. (2021). Multi-scenario simulation of ecosystem service value for optimization of land use in the Sichuan-Yunnan ecological barrier, China. Ecol. Indic. 132, 108328. doi:10.1016/j.ecolind.2021.108328
Li, G., Fang, C., and Wang, S. (2016). Exploring spatiotemporal changes in ecosystem-service values and hotspots in China. Sci. Total Environ. 545, 609–620. doi:10.1016/j.scitotenv.2015.12.067
Li, S., Xiao, W., Zhao, Y., Xu, J., Da, H., and Lv, X. (2019). Quantitative analysis of the ecological security pattern for regional sustainable development: case study of Chaohu Basin in Eastern China. J. Urban Plan. Dev. 145, 04019009. doi:10.1061/(asce)up.1943-5444.0000508
Li, Y., He, Y., Liu, W., Jia, L., and Zhang, Y. (2023). Evaluation and prediction of water Yield services in shaanxi province, China. Forests 14, 229. doi:10.3390/f14020229
Lin, L., Wei, X., Luo, P., Wang, S., Kong, D., and Yang, J. (2023). Ecological security patterns at different spatial scales on the Loess Plateau. Remote Sens. 15, 1011. doi:10.3390/rs15041011
Liu, H., Chen, Q., Liu, X., Xu, Z., Dai, Y., Liu, Y., et al. (2020). Variation patterns of plant composition/diversity in Dacrydium pectinatum communities and their driving factors in a biodiversity hotspot on Hainan Island, China. Glob. Ecol. Conservation 22, e01034. doi:10.1016/j.gecco.2020.e01034
Liu, H., Liu, H., Chen, Y., Xu, Z., Dai, Y., Chen, Q., et al. (2021a). Identifying the patterns of changes in α-and β-diversity across Dacrydium pectinatum communities in Hainan Island, China. Ecol. Evol. 11, 4616–4630. doi:10.1002/ece3.7361
Liu, Z., Huang, Q., and Tang, G. (2021b). Identification of urban flight corridors for migratory birds in the coastal regions of Shenzhen city based on three-dimensional landscapes. Landsc. Ecol. 36, 2043–2057. doi:10.1007/s10980-020-01032-6
Long, H., Liu, Y., Hou, X., Li, T., and Li, Y. (2014). Effects of land use transitions due to rapid urbanization on ecosystem services: implications for urban planning in the new developing area of China. Habitat Int. 44, 536–544. doi:10.1016/j.habitatint.2014.10.011
Luo, J., and Fu, H. (2023). Construct the future wetland ecological security pattern with multi-scenario simulation. Ecol. Indic. 153, 110473. doi:10.1016/j.ecolind.2023.110473
McRae, B. H., Dickson, B. G., Keitt, T. H., and Shah, V. B. (2008). Using circuit theory to model connectivity in ecology, evolution, and conservation. Ecology 89, 2712–2724. doi:10.1890/07-1861.1
Peng, J., Pan, Y., Liu, Y., Zhao, H., and Wang, Y. (2018a). Linking ecological degradation risk to identify ecological security patterns in a rapidly urbanizing landscape. Habitat Int. 71, 110–124. doi:10.1016/j.habitatint.2017.11.010
Peng, J., Yang, Y., Liu, Y., Du, Y., Meersmans, J., Qiu, S., et al. (2018b). Linking ecosystem services and circuit theory to identify ecological security patterns. Sci. Total Environ. 644, 781–790. doi:10.1016/j.scitotenv.2018.06.292
Peng, J., Zhao, S., Dong, J., Liu, Y., Meersmans, J., Li, H., et al. (2019). Applying ant colony algorithm to identify ecological security patterns in megacities. Environ. Model. Softw. 117, 214–222. doi:10.1016/j.envsoft.2019.03.017
Qin, B., Lin, Y., Zhao, J., Chen, G., He, W., and Lü, Q. (2023). Identification of key areas for the ecological restoration of territorial space in kunming based on the InVEST model and circuit theory. China Environ. Sci. 43, 809–820.
Shi, Z., Ai, L., Fang, N., and Zhu, H. (2012). Modeling the impacts of integrated small watershed management on soil erosion and sediment delivery: a case study in the Three Gorges Area, China. J. Hydrology 438, 156–167. doi:10.1016/j.jhydrol.2012.03.016
Simmonds, J. S., Sonter, L. J., Watson, J. E., Bennun, L., Costa, H. M., Dutson, G., et al. (2020). Moving from biodiversity offsets to a target-based approach for ecological compensation. Conserv. Lett. 13, e12695. doi:10.1111/conl.12695
Sui, L., Zhao, Z., Jin, Y., Guan, X., and Xiao, M. (2012). Dynamic evaluation of natural ecosystem service in Hainan Island. Resour. Sci. 34, 572–580.
Tang, F., Wang, L., Zhang, P., and Fu, M. (2020). Construction of county-level ecological security pattern based on ecological protection red line and network in China. Trans. Chin. Soc. Agric. Eng. 36, 263–272.
Wang, C., Yu, C., Chen, T., Feng, Z., Hu, Y., and Wu, K. (2020). Can the establishment of ecological security patterns improve ecological protection? An example of Nanchang, China. Sci. Total Environ. 740, 140051. doi:10.1016/j.scitotenv.2020.140051
Wang, D., Chen, J., Zhang, L., Sun, Z., Wang, X., Zhang, X., et al. (2019). Establishing an ecological security pattern for urban agglomeration, taking ecosystem services and human interference factors into consideration. PeerJ 7, e7306. doi:10.7717/peerj.7306
Wang, J.-j., and Meng, J.-h. (2018). Identifying indigenous tree species for land reforestation, forest restoration, and plantation transformation on Hainan Island, China. J. Mt. Sci. 15, 2433–2444. doi:10.1007/s11629-018-4861-1
Wang, Y., Qu, Z., Zhong, Q., Zhang, Q., Zhang, L., Zhang, R., et al. (2022). Delimitation of ecological corridors in a highly urbanizing region based on circuit theory and MSPA. Ecol. Indic. 142, 109258. doi:10.1016/j.ecolind.2022.109258
Wang, Y.-S., and Gu, J.-D. (2021). Ecological responses, adaptation and mechanisms of mangrove wetland ecosystem to global climate change and anthropogenic activities. Int. Biodeterior. Biodegrad. 162, 105248. doi:10.1016/j.ibiod.2021.105248
Williams, J. C., and Snyder, S. A. (2005). Restoring habitat corridors in fragmented landscapes using optimization and percolation models. Environ. Model. Assess. 10, 239–250. doi:10.1007/s10666-005-9003-9
Wu, C., Chen, B., Huang, X., and Wei, Y. D. (2020). Effect of land-use change and optimization on the ecosystem service values of Jiangsu province, China. Ecol. Indic. 117, 106507. doi:10.1016/j.ecolind.2020.106507
Xiao, S., Wu, W., Guo, J., Ou, M., Pueppke, S. G., Ou, W., et al. (2020). An evaluation framework for designing ecological security patterns and prioritizing ecological corridors: application in Jiangsu Province, China. Landsc. Ecol. 35, 2517–2534. doi:10.1007/s10980-020-01113-6
Xu, D., Wang, Y., and Wang, Z. (2022). Linking priority areas and land restoration options to support desertification control in northern China. Ecol. Indic. 137, 108747. doi:10.1016/j.ecolind.2022.108747
Xu, D., Zou, C., Xu, M., You, G., and Wu, D. (2015). Ecological security pattern construction based on ecological protection redlines. Biodivers. Sci. 23, 740–746. doi:10.17520/biods.2015132
Yang, L. a., Li, Y., Jia, L., Ji, Y., and Hu, G. (2023). Ecological risk assessment and ecological security pattern optimization in the middle reaches of the Yellow River based on ERI+ MCR model. J. Geogr. Sci. 33, 823–844. doi:10.1007/s11442-023-2108-8
Ye, X., Zou, C., Liu, G., Lin, N., and Xu, M. (2018). Main research contents and advances in the ecological security pattern. Acta Ecol. Sin. 38, 3382–3392. doi:10.5846/stxb201701110083
Yu, K., Wang, S., Li, D., and Li, C. (2009). The function of ecological security patterns as an urban growth framework in Beijing. Acta Ecol. Sin. 29, 1189–1204.
Zha, X., Luo, P., Zhu, W., Wang, S., Lyu, J., Zhou, M., et al. (2021). A bibliometric analysis of the research on Sponge City: current situation and future development direction. Ecohydrology 14, e2328. doi:10.1002/eco.2328
Zhai, J., Hou, P., Cao, W., Yang, M., Cai, M., and Li, J. (2018). Ecosystem assessment and protection effectiveness of a tropical rainforest region in Hainan Island, China. J. Geogr. Sci. 28, 415–428. doi:10.1007/s11442-018-1481-1
Zhang, J., Qu, M., Wang, C., Zhao, J., and Cao, Y. (2020a). Quantifying landscape pattern and ecosystem service value changes: a case study at the county level in the Chinese Loess Plateau. Glob. Ecol. Conservation 23, e01110. doi:10.1016/j.gecco.2020.e01110
Zhang, X., Mou, X., and Wang, X. (2021). Study on the ecological restoration zoning of territorial space: taking Hainan Island as an example. Ecol. Econ. 37, 183–189.
Zhang, X., Zhou, J., Li, G., Chen, C., Li, M., and Luo, J. (2020b). Spatial pattern reconstruction of regional habitat quality based on the simulation of land use changes from 1975 to 2010. J. Geogr. Sci. 30, 601–620. doi:10.1007/s11442-020-1745-4
Zhao, G., Liu, J., Kuang, W., Ouyang, Z., and Xie, Z. (2015). Disturbance impacts of land use change on biodiversity conservation priority areas across China: 1990–2010. J. Geogr. Sci. 25, 515–529. doi:10.1007/s11442-015-1184-9
Zhou, G., Huan, Y., Wang, L., Zhang, R., Liang, T., Han, X., et al. (2023). Constructing a multi-leveled ecological security pattern for improving ecosystem connectivity in the Asian water Tower region. Ecol. Indic. 154, 110597. doi:10.1016/j.ecolind.2023.110597
Keywords: Hainan Island, ecological crisis, ecosystem services, ecological red line, ecological security, circuit theory
Citation: Liu H, Zhang G, Li T, Ren S, Chen B, Feng K, Li W, Zhao X, Qin P and Zhao J (2024) Importance of ecosystem services and ecological security patterns on Hainan Island, China. Front. Environ. Sci. 12:1323673. doi: 10.3389/fenvs.2024.1323673
Received: 18 October 2023; Accepted: 31 January 2024;
Published: 13 February 2024.
Edited by:
Kaishan Song, Chinese Academy of Sciences (CAS), ChinaReviewed by:
Hengxing Xiang, Chinese Academy of Sciences (CAS), ChinaCopyright © 2024 Liu, Zhang, Li, Ren, Chen, Feng, Li, Zhao, Qin and Zhao. This is an open-access article distributed under the terms of the Creative Commons Attribution License (CC BY). The use, distribution or reproduction in other forums is permitted, provided the original author(s) and the copyright owner(s) are credited and that the original publication in this journal is cited, in accordance with accepted academic practice. No use, distribution or reproduction is permitted which does not comply with these terms.
*Correspondence: Haodong Liu, SmFtZXNsaXVoZEAxNjMuY29t
Disclaimer: All claims expressed in this article are solely those of the authors and do not necessarily represent those of their affiliated organizations, or those of the publisher, the editors and the reviewers. Any product that may be evaluated in this article or claim that may be made by its manufacturer is not guaranteed or endorsed by the publisher.
Research integrity at Frontiers
Learn more about the work of our research integrity team to safeguard the quality of each article we publish.