 Magdalena Worsa-Kozak
 Justyna Górniak-Zimroz
 Aleksandra Szrek
 Krzysztof Chudy
95% of researchers rate our articles as excellent or good
Learn more about the work of our research integrity team to safeguard the quality of each article we publish.
Find out more
ORIGINAL RESEARCH article
Front. Environ. Sci. , 26 February 2024
Sec. Environmental Informatics and Remote Sensing
Volume 12 - 2024 | https://doi.org/10.3389/fenvs.2024.1305149
This article is part of the Research Topic Women in Environmental Informatics and Remote Sensing View all 8 articles
Underground hard coal mining activity in southern Poland has lasted more than 200 years. Among many factors related to mining and influencing the natural environment, the longest-active are coal waste heaps and tailings ponds. Several hundred objects are inventoried in Lower and Upper Silesia, of which 109 are located in the Lower Silesian Coal Basin (LSCB). These remnants of mining activity are built of gangue, waste coal, and coal silt (post-mining wastes). They cause environmental hazards, i.e., soil, air, groundwater, and surface water pollution in the storage area. They also tend to combust spontaneously, emitting enormous amounts of greenhouse gases into the atmosphere and increasing their neighborhood’s air, soil, and water temperature. Indigenous fires occur more than 20 years after the end of the waste disposal phase. The post-mining heat island (PMHI) phenomena, related to thermal activity development of the post-coal mining heaps and tailings ponds, is still under-recognition and research. Therefore, our study aims to improve and develop a methodology for remote detection and monitoring of heat islands resulting from coal mining operations to track the thermal activity of heaps and tailings ponds in LSCB from mines closure to 2023. The study used open satellite data from the Landsat program to identify and track post-mining heat islands over 23 years within the former mining area and verify the results within the borders of the inventoried heaps and tailings ponds. As a result, geospatial analysis on a time scale was carried out to identify post-mining hot spots. The self-heating intensity index (SHII) and the air temperature thermal indicator (ATTI) were calculated for identified and confirmed objects. SHII ranged between 0.00 and 10.07, and ATTI, on the other hand, varied from −12.68 to 25.18. Moreover, maps of the thermal activity of selected heaps were developed, the characteristics of the self-combustion phenomena were identified, and the remote detection of PMHI and its monitoring methodology was developed. The provided method can be used in the future to regularly monitor coal mining areas to prevent and identify hazardous hot spots and verify the maturity stage of the self-combustion processes.
Mining activity is an anthropogenic factor affecting, among other things, landforms, the structure and quality of surface water and groundwater, the quality of atmospheric air, and the condition of living organisms residing in the vicinity, where works related to the exploration, access and exploitation of the deposit and the processing of the mineral are carried out (Dirner et al., 2010; Hendrychová and Kabrna, 2016; Milbourne and Mason, 2017; Xu et al., 2019; Abramowicz et al., 2021a). The landform changes created in the process of mineral exploitation are coal waste dumps and tailings ponds that are an integral part of the landscape of Europe’s coalfields (the Ruhr and Saarland in Germany, Leeds and Cardiff in the UK, the Upper and Lower Silesian Coal Basins in Poland), Asia (Datong, Fushun and Shanxi in China, Damodar in India, Karagandz and Ekibastus in Kazakhstan), Africa (Witwatersrand and Transvaal in South Africa), Australia (New South. Wales, Queensland, and Newcastle) and America (the Appalachian and Lake District in the United States). These facilities are filled with waste rock, coal waste, flotation waste, and coal silt. Very often, they are thermally active, and spontaneous combustion occurs, causing endogenous fires and raising the temperature in their interior, on the surface, and in fissures locally extending to the surface (Scheme 1). Heap and tailings fires negatively affect the environment and cause emissions of pollutants such as CH4, CO, CO2, H2S, SO2, NH3, aromatic hydrocarbons (PAHs), or containing toxic metals (Ba, Cr, Cd, Hg, Pb, and Z) (Carras et al., 2009; Ribeiro et al., 2010; Elsevier et al., 2012; Kuna-Gwoździewicz, 2013; Melody and Johnston, 2015; Liang et al., 2016; Stankevich et al., 2016; Gawor, 2017; Fabiańska et al., 2019; Nádudvari et al., 2020; Swolkień, 2020; Abramowicz et al., 2021a; Nádudvari et al., 2021a; Abramowicz et al., 2021b; Nádudvari et al., 2021b; Smoliński et al., 2021; Górka et al., 2022; Nádudvari et al., 2022; Rykała et al., 2022; Dąbrowska et al., 2023).
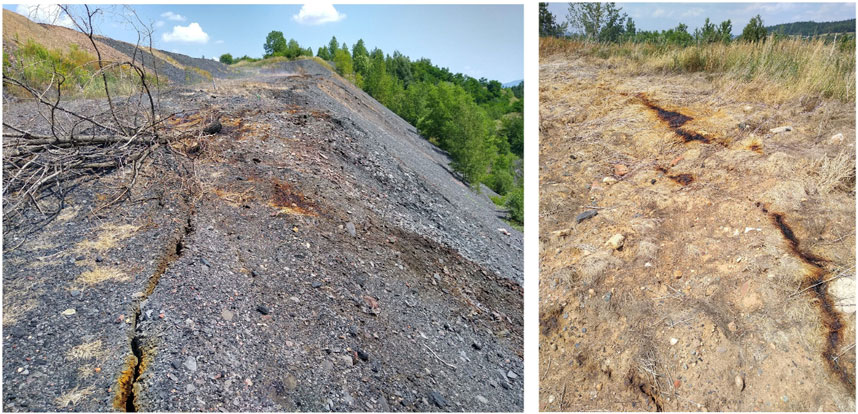
SCHEME 1. Slupiec waste dump–view of fire fissures on the surface of the heap (credit: K. Chudy 2021).
Several investigations of coal waste heaps and tailings ponds with high temperatures are described in the literature, carried out by various methods, mainly by direct methods. Fire can be identified by examining the presence of emitted gases, for example, by gas chromatography of collected samples (Fabiańska et al., 2018; Nádudvari et al., 2021b; Karacan et al., 2021; Nádudvari et al., 2022; Singh et al., 2022) or by measuring the temperature directly in a heap spot-wise with a pyrometer (Kruszewski et al., 2018; Allen et al., 2019; Protasov et al., 2021), or using thermal imaging cameras and thermal image analysis (Abramowicz and Chybiorz, 2019; Sobocińska and Sobociński, 2019; Nádudvari et al., 2020; Nádudvari et al., 2021a). However, these methods require researchers to be present in a hazardous area. For this reason, remote sensing methods are increasingly used to identify fires (Huo et al., 2014; Nádudvari, 2014; Fabiańska et al., 2019; Fix et al., 2019; Stracher, 2019; Nádudvari et al., 2020; Wasilewski, 2020; Almeida et al., 2021; Nádudvari et al., 2021a; Ren et al., 2022). Non-contact measurement, low cost, as well as time-saving, and safe implementation of measurements, especially in the case of large-scale sites, are unquestionable benefits of remote sensing methods. The advantage over direct methods is also the wide range of imaging, which ensures simultaneous data acquisition on entire objects (Wang et al., 2022).
Data for remote sensing studies of heap and tailings ponds high temperatures or fire effects can be obtained by thermal sensors placed on satellites, Unmanned Aerial Vehicle (UAV), or by thermal handheld cameras (Nádudvari, 2014; Abramowicz and Chybiorz, 2019; Nádudvari et al., 2020; Nádudvari et al., 2021a). Active remote sensing techniques are also used, performing surveys from satellite radar data (Akcin et al., 2007; Jiang et al., 2011; Nádudvari, 2014; Nádudvari et al., 2020; Nádudvari et al., 2021a; Karanam et al., 2021; Yu et al., 2022) or from Light Detection and Ranging (LiDAR) data acquired from a UAV airstrike (McKenna et al., 2017; Nguyen et al., 2021; Jońca et al., 2022). With these techniques it is possible to study landslides and land subsidence due to fire. Indeed, many studies show a correlation between temperature anomalies and land subsidence (Jiang et al., 2011; Syed et al., 2018; Karanam et al., 2021).
In the case of satellite imaging data, not only thermal imaging but also multispectral imaging – visible and near-infrared range (VIS-NIR) are used. Based on multispectral imaging, studies of the presence and condition of vegetation can be carried out, e.g., using the Normalized Difference Vegetation Index (NDVI). An index stating the condition of the vegetation can provide information about high-temperature sites on the heap or tailings ponds, as thermal processes affect vegetation characteristics. Vegetation’s absence in a given place, or its variability in time and space, can indicate fire’s presence or movement (Abramowicz et al., 2021b; Ren et al., 2022). Multi-period observations of vegetation cover can also provide information on the effectiveness of site restoration (Xiaoyang et al., 2016; Nourani et al., 2021). Lush vegetation on the surface of a heap does not always mean no overheating. If the fire does not reach the root system of the plants and the temperature is higher, an environment favorable to the growth of plants with high heat requirements is created. Some species exceed their standard maximum size due to higher concentrations of CO2 and nitrogen compounds, and some thrive even in winter (Ciesielczuk et al., 2015). By identifying and monitoring such anomalies, fire processes can also be detected.
Satellites that have a sensor capable of thermal imaging are Landsat 4-5 TM, Landsat 7 ETM+, Landsat 8-9 OLI TIRS, Terra ASTER, Terra MODIS, NOAA-AVHRR, or Sentinel-3 (NASA, 2023a; United States Geological Survey, 2023e; NASA, 2023b; Copernicus, 2023; NOAA, 2023). In studies of the temperature of coal mining tailings ponds and heaps, thermal data are primarily from Landsat or ASTER systems (Chatterjee, 2006; Martha et al., 2010; Nádudvari, 2014; Huo et al., 2015; Mishra et al., 2020; Nádudvari et al., 2020; Nádudvari et al., 2021a; Wang et al., 2022). Thermal channels of satellites such as NOAA-AVHRR, Terra MODIS, and Sentinel-3 have a spatial resolution of 1 km. Thus, looking for and investigating small objects such as mine coal dumps is impossible. ASTER is one of the sensors on board the Terra satellite launched at the end of 1999. The Land Processes Distributed Active Archive Center (LP DAAC) provides image data with varying degrees of processing, from unprocessed data at full resolution with ancillary information to data processed to sensor units and with uniform space-time grid scales. The spectral channels cover the range from 0.52 to 11.65 µm, providing data with a spatial resolution of 15 m for Visible and Near-Infrared (VNIR), 30 m for Shortwave Infrared (SWIR), and 90 m for Thermal Infrared (TIR). Availability and temporal resolution from ASTER data make multi-temporal studies difficult. LP DAAC distributes ASTER products, which are produced from on-demand data acquisition requests. Thus, products are not in regular temporal ranges (https://lpdaac.usgs.gov, 2023).
The Landsat mission has been providing thermal data since 1982 when Landsat 4 (and Landsat 5 two years later) was launched with a set of sensors: the MSS and the Thematic Mapper recording in the thermal infrared range in channel 6 with a spatial resolution of 120 m. Launched in 1999, Landsat 7 ETM+ recording in the thermal range with twice the spatial resolution of 60 m, was followed by Landsat 8 and Landsat 9 carrying multispectral OLI and thermal (TIRS) sensors (spatial resolution 100 m). The revisit time for each Landsat satellite is 16 days, but for currently operating Landsat 8 and Landsat 9 data is available every 8 days due to the same flight and sensor parameters and an 8-day interval from each other. A major advantage of using Landsat data for multitemporal studies is free access to archival and current data and the availability of science products. United States Geological Survey (USGS) provides Landsat Level-1 data - raw images with standard processing parameters, applied Landsat Level-2 Science Products, including Landsat Surface Reflectance, Landsat Surface Temperature, Landsat Surface Reflectance (derived spectral indices) and Provisional Aquatic Reflectance and Level-3 Science Products: Analysis Ready Data available only for U.S. and Alaska. Science Products are generated at 30-m spatial resolution from Landsat Level-1 data and processed to be ready for use by researchers. Landsat Surface Temperature product is calculated using the Global Emissivity Database and NDVI data derived from ASTER data, air temperature, humidity, and atmospheric profiles of geopotential height obtained from Goddard Earth Observing System (Model Version 5) or Modern-Era Retrospective analysis for Research and Applications Version 2. Calculating LST from a raw image requires a lot of processing, time, software, and knowledge. The Level-2 data provided by the USGS is extremely useful for many scientists, allowing them to conduct research faster and skip the imaging processing step (United States Geological Survey, 2023a). The quality and accuracy of this data are comparable to independently processed LST from Level-1 data. Evaluation research showed that the mean percent absolute error of Landsat 7 and Landsat 8 data compared to in-situ measurements is similar for both levels (Pinto et al., 2020).
Nádudvari et al. (2020, 2021a) presented the approach to Polish and Ukrainian waste heaps based on Landsat, Aster thermal bands supported by drone thermal camera images. They also proposed a self-heating intensity index (SHII) to value the thermal activity of the analyzed research objects based on the highest (pixel max.) and lowest (pixel min.) temperatures taken from satellite thermal maps. This research used night-time and snow-covered images with zero cloud-, haze- and fog cover from https://earthexplorer.usgs.gov (2019). It calculated Land Surface Temperature (LST) independently from Level-1 data according to the methodology given in Landsat, 2023. This work covered two examples from LSCB and was partially continued in Lewińska-Preis et al. (2021), considering two additional objects. Until now, it was the only research using satellite data to classify the thermal activity of coal waste heaps in Poland.
Despite the many studies described above that have been done so far, and despite the availability of many sources of free remotely acquired data, there is still ample room for the improvement and development of remote testing methods and the use of remote sensing and satellite imaging to identify and monitor the thermal activity of coal mine tailings ponds and waste heaps. Self-combustion and spontaneous fires in post-mining facilities are not only a source of harmful gas emissions into the atmosphere, but most importantly, they threaten public safety and the lives of those in the area or the vicinity. Therefore, developing a simple, reliable, and inexpensive method to remotely find and track thermal changes occurring in waste deposition areas of past and present coal mining is essential. The specific area in this context is Lower Silesian Voivodeship and LSCB, where coal mining relicts are still active and need easy and cheap methods to monitor, classify, and prevent hazardous fires.
Thus, our study addresses the need to screen large post-mining areas remotely and trace surface temperature changes to identify burning tailings ponds and dumps. Our approach is dedicated to the early identification of indigenous fire hazards. In addition, the goal of our research is the spatiotemporal analysis of the heat island generated by the self-ignition of coal heaps and tailings ponds to study its variability over time and, in further stages, also the dependence of PMHI on geological, climatic conditions or anthropogenic activity within the research areas. Therefore, our study presents a methodology for remote detection and monitoring of heat islands resulting from coal mining operations to track the thermal activity of heaps and tailings ponds in LSCB from the time of mines closure (1999) to nowadays. The study first used open satellite data from the Landsat program to identify hot spots and verify the heat sources using GIS (ArcGIS Pro) tools and CORINE Land Cover data together with an inventory database of post-mining waste disposal areas. The next goal was to indicate PMHI and track the LST changes within the inventoried heaps and tailings ponds over 23 years. The article presents a step-by-step methodology and results for 18 post-coal-mining facilities (11 waste heaps and seven tailings ponds). As an example of the methodology utilization, geospatial analysis on a time scale was carried out, and maps of the thermal activity of selected heaps were developed. Based on that, the characteristics of the self-combustion phenomena in chosen locations were also determined by analyzing calculated indicators (SHII and ATTI).
The study improved and developed a methodology for remote detection and monitoring of heat islands resulting from anthropogenic coal mining activities (Figure 1). A multi-temporal geospatial analysis was carried out using open satellite data at a selected time scale, along with the development of surface temperature maps for thermally active heaps and settlements left over from coal mining. On this basis, spontaneous combustion phenomena were characterized, and a methodology for remote detection and monitoring of spontaneous combustion processes at these sites was developed. The presented method can be used in the future for regularly monitoring post-mining areas to identify dangerous hotspots and verify the advancement of spontaneous ignition processes occurring on the studied objects.
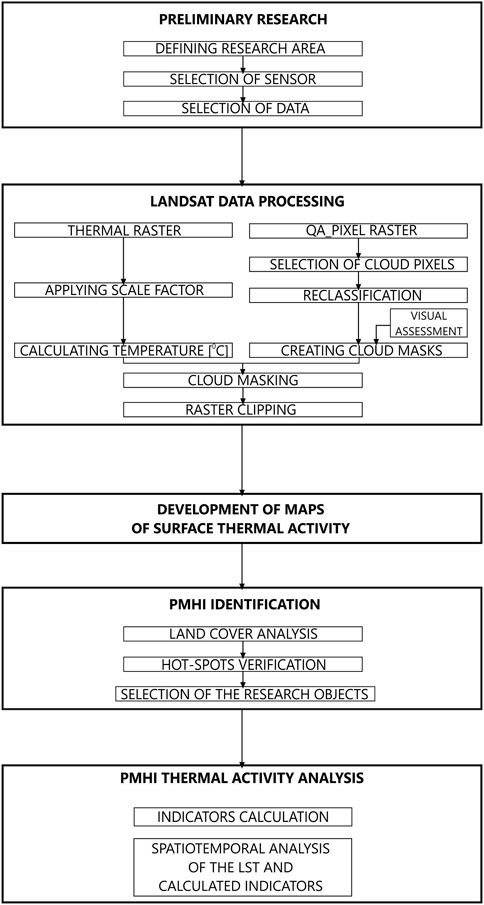
FIGURE 1. Methodology for post-mining heat islands (PMHI) analysis.
The Lower Silesian Coal Basin (LSCB), where the post-mining districts of Walbrzych and Nowa Ruda (S-W Poland–Figure 2) are located, was chosen as the study region.
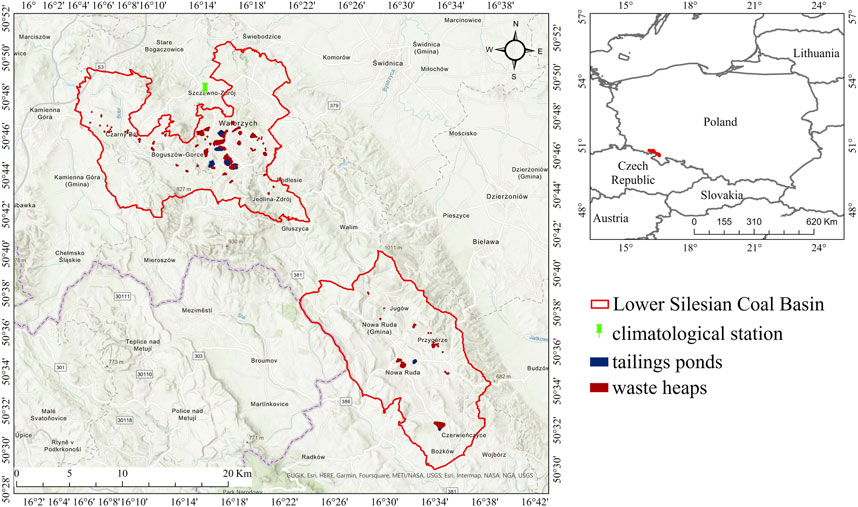
FIGURE 2. Lower Silesian coal basin compiled from the Mine Heaps Database, (2023)
The LSCB area is in southwestern Poland in the Walbrzych and Nowa Ruda regions. The area where the coal seams occur was about 530 km2. It covers part of the Sudetes Mountains of both Poland and the Czech Republic. This area is characterized by a very varied morphology evidently related to geological and structural conditions, with a basin character. It is located in the eastern and northeastern part of the Intra-Sudetic Basin, the morphological axis of which runs from northwest to southeast and follows the direction of the Sudetic structure (Kondracki, 2000).
Geologically, the area belongs to the Intra-Sudetic Basin (northeastern part of the Bohemian Massif, the eastern part of the European Variscan Orogen). The Intra-Sudetic Basin consists of Carboniferous-Permian clastic rocks with hard-coal intercalations and basaltic/andesitic composition lavas related to post-orogenic delamination and mantle upwelling (Ulrych et al., 2004). The Paleozoic rocks are partially covered by Quaternary, mainly fluvial and fluvioglacial sediments.
According to the regional classification of groundwater, aquifers of the Walbrzych and Nowa Ruda area are settled in the Sudetic region. They are formed in crystalline and sedimentary, Carboniferous and Permian formations, and Carboniferous and Permian volcanites (Paczynski, 1995).
The history of coal mining in this area dates back to the 15th century when the first records of the sale of mines appeared in the town book of Nowa Ruda. From the 16th century, numerous written records indicate organized coal mining in the LSCB (Piątek and Piątek, 1999). Exploitation was carried out mainly on outcrops through adits. At the beginning of the 19th century, the depth of the shafts was shallow and reached a maximum of 90 m, leading to the excavation of the coal seams on several levels. The late 18th and early 19th centuries brought the application of explosives for adit tunneling. In the second half of the 19th century, the use of horses to transport the excavated material to the surface became widespread (Piątek, 1989). The 19th century was the time of the implementation of steam engines, mainly to operate dewatering pumps. This allowed the depth of coal seams to be increased. The new mines were already deep, and mining took place below the adit level. The impulse for the development of coal mining in the area of Nowa Ruda and Wałbrzych was the construction of a railway line from Wrocław to Wałbrzych in 1843, which greatly expanded the markets for the sale of coal.
The turn of the 19th and 20th centuries brought important changes in the ownership and structure of mines towards the consolidation of industrial capital, centralization of management, and concentration of coal production and sales. It increased coal production from about 500,000 tonnes in 1854 to 4,760,000 tonnes in 1900 (Piątek and Piątek, 1999).
The period between World War I and World War II was a period of complete stagnation, in which the mines declined due to a lack of funds and qualified personnel. In addition, this time was marked by a high risk of gas emissions, mainly CO2, which killed more than 300 miners (Piątek and Piątek, 1977).
After World War II, the mines of the Lower Silesian Coal Basin became part of Poland. The mines were nationalized, and the most significant emphasis was placed on increasing coal production, which was difficult in the post-war period due to the lack of capital and qualified staff. Improvements in this area were not recorded until after 1957. However, due to the problematic geological situation and the decreasing importance of this coal basin compared to the Upper Silesian Coal Basin, proper economic effects were not achieved, and the mines were in deficit (Skiba, 1979).
Coal mining in the LSCB lasted continuously from 1434 to 2000. During this period, about 450 million tonnes of hard coal were extracted from the mined coal seams without exhausting the coal reserves, which were estimated at 1.2 billion tonnes (Bossowski and Ihnatowicz, 2006).
Until the end of the 20th century, Lower Silesia was one of Poland’s most important mining districts. In the 1990s, a decision was taken to close the mining. It was a time of political and economic changes in Poland, during which decisions were made to close selected branches of the mining industry due to outdated mining technology and the resulting high costs of the mines. Closing the mines and flooding the mine workings was finished around 2004–2006 (Chudy et al., 2014).
According to the Polish Geological Institute - National Research Institute (PGI-NRI) (Mine Heaps Database, 2023) database, 109 heaps and nine tailings ponds accumulating coal mining waste were inventoried within the defined research area. Their current state is highly variable. For the most part, these facilities have been recultivated. However, according to Lasak and Zemska’s (2021) analysis, the heap reclamation processes carried out were inadequately financed, prepared, and monitored, which was due to, among other things, inexperience and organizational and economic chaos during the period of mine decommissioning in the LSCB. It has been estimated that 20% of the heaps in the area have again experienced degradation processes and require proper reclamation due to the risk of dust emissions and a source of potential fires with gas emissions.
On the other hand, the tailings ponds have been rehabilitated to a small extent, mainly due to their sale to private investors. Their operation of tailings ponds is a source of secondary dust and gas emissions into the environment. These facilities are located near residential areas and were interesting to our research.
The research uses satellite data from the Landsat system. This system was selected considering the availability of open-source thermal data, the large archive containing data from the desired years and months, the resolution to identify the phenomenon (30 m), and the possibility of downloading Level-2 data. The use of Level 2 data makes the research process faster and easier. Data for the years 1999–2011 are collected by Landsat 5 TM. Data from 2013 to 2023 are provided by Landsat 8-9 OLI TIRS. The year 2012 was excluded from the analyses. This year’s only available data was from Landsat 7 ETM+, which provides incomplete data due to the Scan Line Corrector Failure. Surface Temperature product generated from the Thermal Infrared band (Band 6 for Landsat 5, Band 10 for Landsat 8–9) was used to analyze surface temperature values. The Pixel Quality Assessment product (QA_PIXEL) was used to inspect present cloud coverage over the heap and tailings ponds area at the time of image acquisition.
The research was conducted on data covering a time range of 23 years, from 1999, when coal exploitation in the LSCB ceased, to 2023. Our goal was to analyze data in more or less equal 1-year time steps, which were defined by data availability.
Data was collected from late spring and summer (April to July). During winter, very low external temperatures can reduce the temperature on the surface of heaps and settling ponds. In summer, on the other hand, when there is high insolation, the remotely measured surface temperature of heaps and settling ponds can also result from the heated ground surface cover and not just the thermal processes occurring inside the object. Using night-time acquisition data (United States Geological Survey, 2023d) to be processed to surface temperatures is also not advised. It is because data products must contain both optical and thermal components to be successfully transformed to surface temperature, as ASTER NDVI is required to temporally adjust the ASTER GED product to the target Landsat scene. Supplementary Appendix SA contains information about the downloaded data and the date and time of their acquisition. The varying months of downloaded data result from the visibility of the surveyed objects. When selecting the data, the degree of cloud cover was analyzed, and the images with the most minor cloud cover over the objects were selected. It was attempted to have all images from April, but it was impossible due to cloud cover.
The first step was to process satellite thermal data to convert each pixel’s Digital Number (DN) into a surface temperature value. The United States Geological Survey (USGS) provides the satellite data used in this study. Therefore, the surface temperature value was calculated using instructions provided in the Product Guide (United States Geological Survey, 2023c) with the support of ArcGIS Pro tools. First, the scale factor was applied to obtain the surface temperature value in Kelvins, which was then converted to degrees Celsius. Eq. 1 presents the applied raster calculations.
where DN (Digital Number) is the pixel value of the raster, 0.00341802 + 149.0 is a scale factor, 273.15 is the Kelvin-Celsius conversion value.
Due to visible cloud cover on selected satellite data, image and spatial analyses of cloudiness were performed using ArcGIS Pro (Spatial Analyst Tools, Image Analyst Tools, Data Management Tools). Remote sensing and GIS methods are instrumental in estimating cloudiness in the long term. Such a case is described in detail in the work by Valjarević et al. (2022). Considering the significance of cloud cover on the surface temperature measured on satellite imagery, clouded areas must be excluded from temperature measurements. Landsat raster product “QA_PIXEL” was used to mask clouds. It contains the quality assessment of each image pixel in the form of pixel value. Interpretations of these values are provided in the Science Product Guide documentation for Landsat 4-7 and Landsat 8–9 (United States Geological Survey, 2023c; United States Geological Survey, 2023b). Selected pixel values and their description are presented in Table 1. Cloud masks were created for each image by applying simple reclassification to the QA_PIXEL raster. Classes existing in the QA_PIXEL raster containing pixel values corresponding to the cloud cover were selected and given the ‘clouds’ class, while all remaining pixels were classified as ‘no data’ and removed from the QA_PIXEL raster. Created masks were verified by visually analyzing and comparing the mask with the cloud cover visible in the RGB image. The mask was not applied when it contained several single and scattered pixels that were not over object boundaries. The percentage of cloud cover over the entire image was calculated using ArcGIS Pro spatial analyst tools.
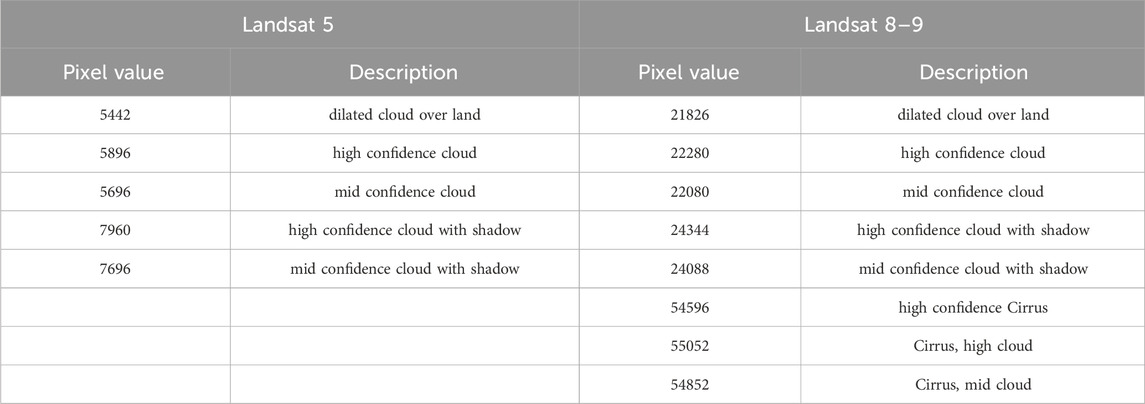
TABLE 1. Selected pixel values and description for Landsat 5 and Landsat 8–9.
The masked temperature images prepared for each year of study were clipped to the research areas. Coherent temperature ranges were defined to ensure comprehensible visualization. Temperature values were graded in a step of 5°, and symbolization was selected. Based on that, the land surface thermal activity maps were created (Supplementary Appendix SB).
Moreover, for the entire observation period, air temperature measured at a height of 2 m above the ground in the shade at the Szczawno-Zdrój climatological station No. 250160130 (50°48′24.0“N 16°14′28.0“E − Figure 2) was also analyzed. This station was the only existing and located closest to the study areas with continuous historical measurements, which is why it was selected for the study. The Institute of Meteorology and Water Management (IMGW) shared the data. Maximum, average, and minimum temperatures for the exact days on which satellite images were taken were extracted from the temperature databases (Supplementary Appendix SD). These data are presented in the table in Supplementary Appendix SC and the graph (Figure 3). The above data were used for comparative analyses with the surface temperature of the study sites and an indicator calculation.
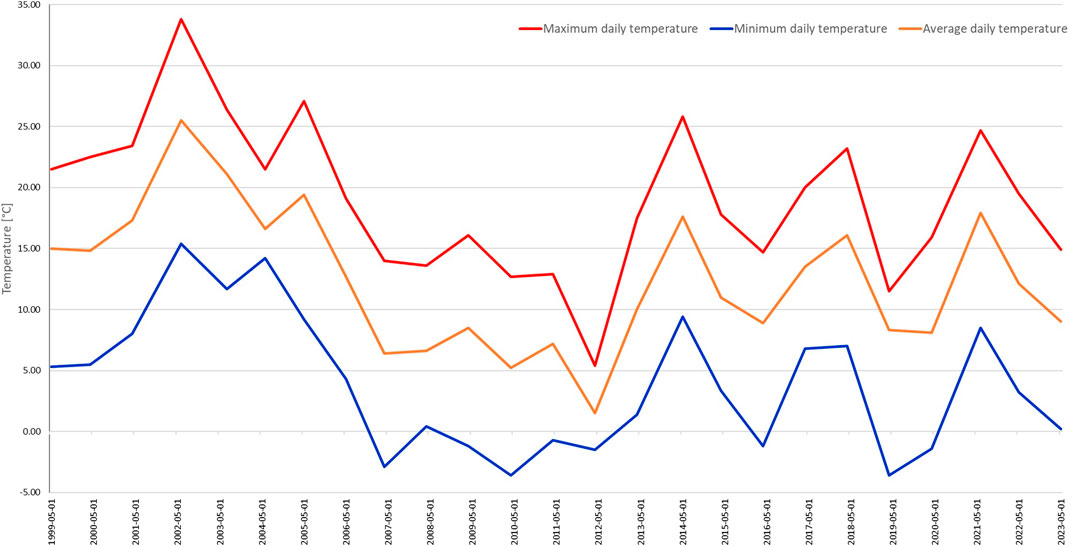
FIGURE 3. Air temperature from Szczawno-Zdroj station on selected measuring days compiled from the Institute of Meteorology and Water Management (2023).
According to the methodology proposed in Section 2.3, 24 maps of the thermal activity of the land surface were created for two study areas, Walbrzych (1) and Nowa Ruda (2) of the LSCB as part of the tests. Supplementary Appendix SB shows one map from each year of observation between 1999 and 2023, except for 2012 when satellite data was unavailable. For comparison purposes, an attempt was made to keep each year’s imagery roughly evenly timed. Still, due to cloud cover or lack of data, they are contained between April and July, with most of the imagery falling in April. These maps made it possible to identify heat islands.
The three-step approach was adapted to exclude heat island effects from factors other than post-coal-mining waste heaps and tailings ponds and identify the heat island resulting from other land cover forms. For that purpose, data from three sources were compilated:
− CORINE Land Cover data from the third level of detail with the following technical assumptions: land cover mapping is carried out with an accuracy corresponding to a map at a scale of 1:100000, the minimum mapping unit (MMU) is 25 ha, the minimum width of linear elements is 100 m, the accuracy of guiding the boundaries of individual land cover forms is 100 m, the mapping of tangible changes with a minimum area of 5 ha and a width of at least 100 m visible on satellite images.
− Data in the form of current orthophotos was obtained from the Central Office of Geodesy and Cartography resources.
− Data showing the boundaries of heaps and settlements after coal mining in the study area was obtained from the National Geological Institute (Mine Heaps Database, 2023).
In the first step, the thermal activity maps were overlaid with land cover data downloaded from the European CORINE Land Cover (CLC) database belonging to the pan-European land monitoring service component of the Copernicus program, part of the European Copernicus program coordinated by the EEA, which provides environmental information from a combination of airborne and space-based observation and in situ monitoring data (Copernicus, 2023). The data are updated periodically, allowing observation of changes occurring at the turn of the year. The first CLC inventory took place in 1990. The first update was made in 2000, and subsequent updates were made in 2006, 2012, and 2018. The data, details, and themes were adapted to the European Union’s and the EEA’s needs, which coordinates CLC projects in Europe. Data from 2000, 2006, 2012, and 2018 were downloaded for the study (Supplementary Appendix SB). Using GIS tools (ArcGIS Pro), they were compared with available orthophoto maps, and the areas other than industrial, mineral extraction, and dump sites were excluded from further analysis. This way, we eliminated Urban Heat Islands (UHI), which were large hot spots on the maps. Next, the hot spots outside excluded areas were analyzed and indicated as potential PMHI. To verify if mining activities caused all the spots, we used data from the PGI-NRI (Mine Heaps Database, 2023). In all 18 cases, our preliminary observation of the hot spots overlapped with the borders of the objects inventoried in the PGI-NRI database. Thus, for further study, 11 heaps and seven tailings ponds were selected, where the process of spontaneous combustion may have occurred during the 23 years since the end of coal mining in the LSCB. The visibility of the sites was analyzed against the spatial resolution of satellite imagery and those with an area of min. 30,000 m2 were selected. Two study sub-areas were delineated: area one, Walbrzych, including eight heaps and four tailings ponds showing temperature changes, and area two, Nowa Ruda, where three heaps and three tailings ponds are located. Figure 4 shows the study areas with the boundaries of the numbered heaps and tailings ponds, and Supplementary Appendix SC collects basic information about the studied objects.
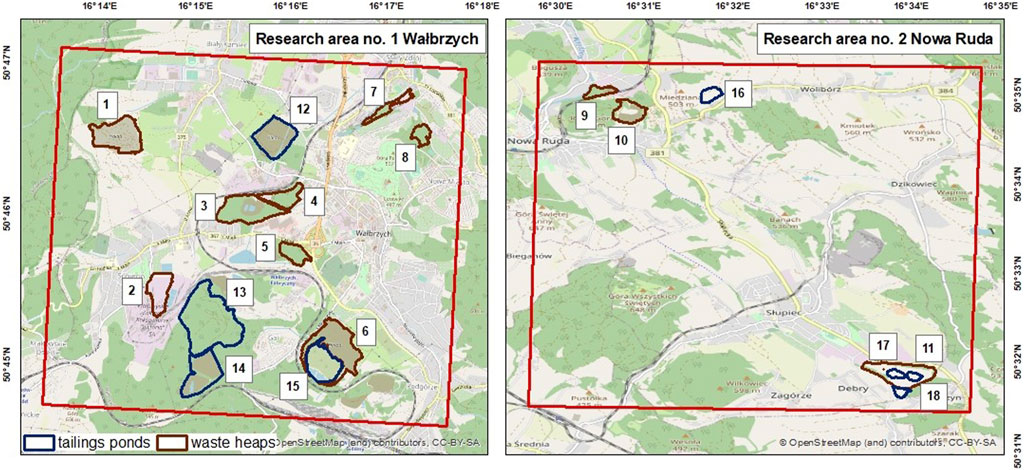
FIGURE 4. Location of heaps and tailings ponds selected for study in the LSCB compiled from the Mine Heaps Database, (2023) and Open Street Map (2023)
In the next step, based on the created maps of thermal activity, the values of the lowest (pixel min) and highest temperature (pixel max) within the boundaries of the verified objects in the given years were obtained. Due to cloud mask usage, minimum and maximum temperature values were derived from non-clouded pixels. Based on the count of pixels and the number of no-data pixels, the cloud cover percentage of each object in the given years was estimated (Supplementary Appendix SB). Objects with 70% or more cloud coverage were classified as entirely clouded.
Based on the modified methodology from Nádudvari et al. (2020), in the following step, the self-heating intensity index (SHII) was calculated for each object with cloud cover equal to or less than 50% and each year according to the Equation 2:
where: pixel max–the highest LST [oC] within the object,
pixel min–the lowest LST [oC] within the object
The modification was related to the use of Landsat Collection 2 Surface Temperature that is already corrected to atmospheric profiles of geopotential height, specific humidity, and air temperature extracted from Goddard Earth Observing System (GEOS) Model Version 5 Forward Processing Instrument Teams (FP-IT) (United States Geological Survey, 2023d). It makes the whole procedure easier, less time-consuming, and available for less advanced satellite data users. It also allows the use of daylight acquisitions.
To track the thermal activity and classify observed objects, we used five SHII ranges proposed by Nádudvari et al. (2020): extreme thermal activity (>7), advanced (3–7), moderate (3–1.5), initial (1.5–1), no activity (<1). Supplementary Appendix SD and Figure 9 show the SHII index calculated for the studied heaps and settling ponds from the LSCB area.
Moreover, we developed an air temperature thermal indicator (ATTI) characterized by differences between maximal object temperature and maximal air temperature, measured on the same day, according to the Equation 3:
where: TO max–the maximal object temperature [oC]
TA max–the maximal air temperature [oC]
ATTI indicates the potential of the object to generate heat and greenhouse gas (GHG) emissions, which is in the scope of our future research. It was already proved that the highest temperature difference is the convective heat transfer coefficient (CHTC) increases, and an almost linear relationship is established (Hagishima and Tanimoto, 2003). A similar situation concerns GHG emission, where an approximately linear trend of increasing emission flux with increasing surface temperature was observed (Carras et al., 2009; Engle et al., 2011).
We assumed the higher ATTI, the higher the heat and GHG emission potential. Thus, we introduced five classes: extreme generator (>15.0), advanced generator (15.0–10.0), moderate generator (10.0–5.0), low generator (0.0–5.0), and inactive (<0.0). The results are presented in Supplementary Appendix SD; Figure 11.
The last step was a spatio-temporal analysis of the LST and calculated indicators to check if tracking the thermal activity changes in time with the implementation of our methodology is feasible and what the constraints and pros and cons of the approach are. It was conducted based on the visual analysis of the thermal maps (Supplementary Appendix SB) and temperature graphs (Supplementary Appendix SC) and a detailed SHII and ATTI frequency and distribution graphs analysis for each object (Figures 10–12) and each year.
The first results of our research were maps of thermal activity for the research areas and each year of observation (Supplementary Appendix SB). We observed temporal variability and the possibility of hotspot identification in these maps. However, to classify the hotspots as the results of mining activity, we needed the tool to extract the areas of increased land surface temperature caused by factors other than self-ignition. Thus, we decided to use GIS tools to analyze landscaping. It was possible by implementing filters created based on CORINE Land Cover data (Figure 5) and compared with an orthophoto map (Figures 6, 7). When we excluded urban heat islands and other hotspots caused by human activity (industrial, transportation, etc.), we verified the remaining hot areas with mining heaps and tailings ponds database to prove the accuracy of the chosen method. What was challenging was the resolution of satellite data, which excluded the identification of small objects with a surface of less than one pixel equal to 900 m2. However, all the 18 hotspots we identified were verified as post-mining objects. It proves our approach is accurate and gives a good base for fast and cheap pre-identification of objects like coal mining waste heaps and tailings ponds, which are or were thermal active.
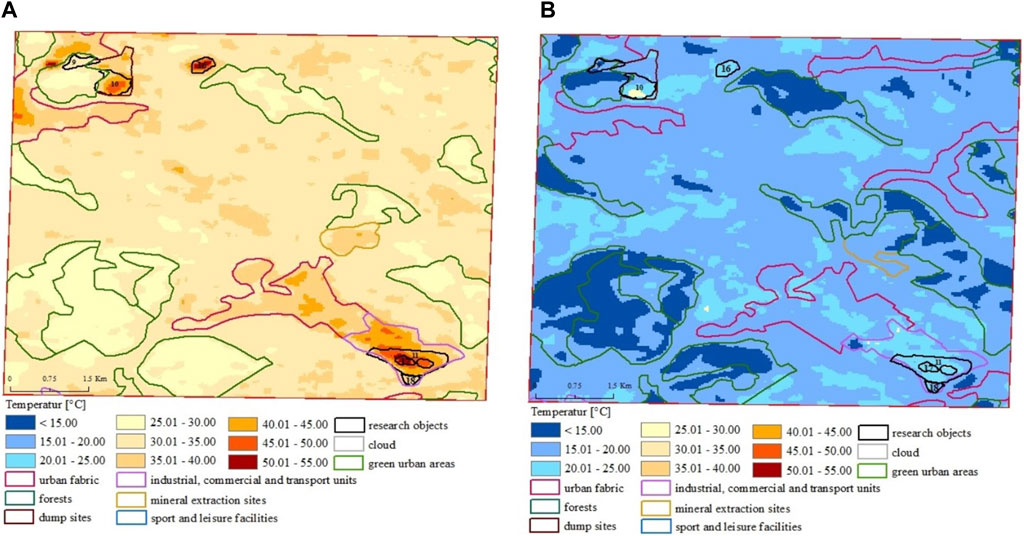
FIGURE 5. Thermal activity map dated 20.06.2002 (A), 16.04.2019 (B) and orthophoto map of study area No. 2 Nowa Ruda with CORINE Land Cover filter.
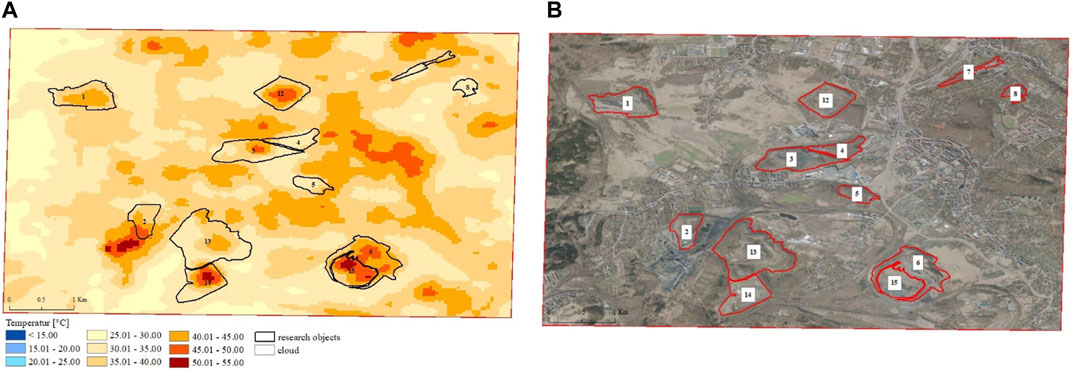
FIGURE 6. Thermal activity map dated 20.06.2002 (A), and orthophoto map (B) of study area No. 1 Walbrzych.
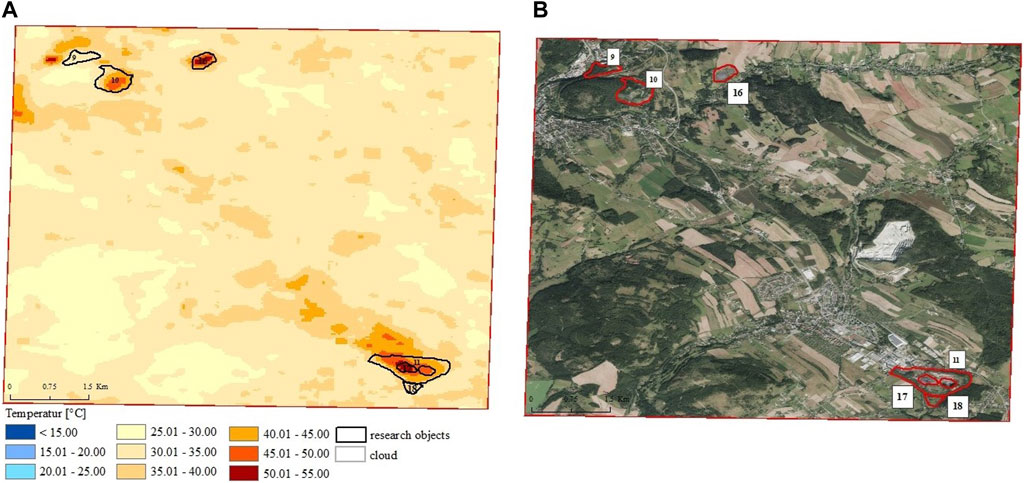
FIGURE 7. Thermal activity map dated 20.06.2002 (A), and orthophoto map (B) of study area No 2 Nowa Ruda.
Figure 6A shows a map of study area No. 1 Walbrzych dated 20.06.2002, where elevated temperatures can be seen at sites 1, 3, 6, 12, 14, and 15. The map was compared with an orthophoto (Figure 6B to verify land cover forms. Objects No. 1, 3, 4, 6, 8, 12, 13, and 14 are covered entirely or partially with green areas in the form of vegetation. Site No. 2 and 7 are covered with green spaces and industrial buildings. Built-up areas and industrial areas exhibit more thermal activity. Therefore, it can be concluded that sites No. 1, 3, 6, 12, 14, and 15 show thermal activity, and they can be identified as heat islands caused by former mining performance. Sites 2, 4, 5, and 7 are adjacent to built-up and industrial areas, which show higher thermal activity than these sites. It indicates that when analyzing thermal maps of the land surface after identifying heat islands, it is vital to recognize what forms of land cover there are, in this case, done with a CORINE Land Cover filter.
A similar analysis was performed for study area No. 2 Nowa Ruda (Figure 7). Sites 9 and 16 are fully covered with vegetation, and sites 10, 11, 17, and 18 are covered partially. In the vicinity of sites No 10 and 16 are green and agricultural areas with lower thermal activity. In contrast, in the setting of sites 11, 17, and 10 are built-up and industrial areas with higher thermal activity. Based on the map, thermal activity on 20.06.2002 was identified in objects No. 10, 11, 16, 17, and 18.
Having confirmed and chosen research objects, we could conduct a detailed analysis of particular sites. We started with minimal and maximal temperatures within objects (Supplementary Appendix SD) and their temporal analysis. For that, the graphs of the lowest (pixel min) and highest (pixel max) temperatures within the object were prepared (Supplementary Appendix SC).
The temperatures vary between years and objects, ranging from 53.95 (object 11 in 2002) to 8.82°C (object 8 in 1999) in the case of maximal and from 44.5 (object 17 in 2002) to 7.34°C (object 1 in 2011) in case of maximal temperature. It was somewhat surprising that all sites’ highest maxima and minima occurred simultaneously in 2002, regardless of their history. It led to analyzing the simultaneous temporal air temperatures at the nearest meteorological station.
We have concluded that the pattern of the temperature path of the objects follows the temperature curve of the air, which, in principle, is a natural and proven phenomenon (Good et al., 2017). However, we can observe several sudden changes and drops or ups of the surface temperatures not directly related to the air (e.g., objects 3–5, 17 and 18 between 2010–2011, object 13 between 2005–2006) (Supplementary Appendix SC), which could be probably caused by human activity on the waste heaps and ponds. As we recognized during the social interview, there were periods of different actions taken by the waste heaps owners, like covering with soil mass to distinguish fires or digging to extract coal-based material. Thus, to interpret the time series of thermal activity and self-heating phenomena of a particular object, it is crucial to recognize the history of human activity within its borders.
Nevertheless, the relation of surface temperature to air temperature is evident in most cases. For example, Figure 8 shows the temperature for objects 1 and 11, with temperature increases on 20.06.2002, 22.04.2007, 20.04.2009, and 15.06.2021. The maximal temperatures of the sites occur at the same time as the maximal air temperatures measured at the Szczawno-Zdrój meteorological station (Figure 4).
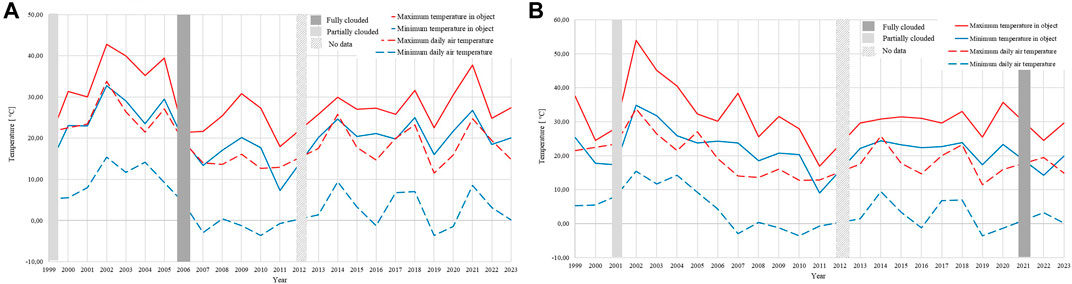
FIGURE 8. Graph of temperature changes for objects 1(A) and 11(B).
The year 2002, however, is unique in that all the highest temperatures, both minimum and maximum, at all objects fall within it. This temperature peak may indicate a systematic error made by the authors of the LST source maps used in the study. However, the air temperature at this time was relatively high (33°C), and the image was taken during summertime (June) after several days of hot and sunny weather, which could also influence the surface temperatures naturally.
Putting this aside and looking at the rest of the dataset, it can be assumed that for historical data, when it is impossible to refer to the air temperature directly from above the object, observations from the nearest meteorological station available at the time are equally valuable, but morphological factors play a role (Mutiibwa et al., 2015), so it is necessary to check the morphology carefully. Moreover, thermal activity is affected by other climatic conditions (atmospheric pressure, wind speed and direction, insolation, and precipitation) (Onifade and Genc, 2018) and human factors (Querol et al., 2011). Still, air temperature is one of the most frequently measured and readily available meteorological parameters. Hence, it can be used for indicator analyses.
Further research was run to track the thermal activity, and the self-heating intensity index (SHII) was calculated (Nádudvari et al., 2020) (Supplementary Appendix SD). Based on the SHII classification, we observed that both research areas, Wałbrzych and Nowa Ruda, are still thermally active despite more than 20 years when waste deposition stopped.
What can be observed is that the thermal activity of the majority of the investigated objects was higher in the years 2002–2010 (Figure 9) when even seven objects in 2002 and 2004 were classified as extremely thermal active (SHII >7). In the next 10 years, thermal activity in both areas lowered to advanced and moderate. However, the vast majority of the objects were still visibly active. There were also several sites where SHII mostly oscillated between inactive and initial classes (e.g., objects 8 and 18).
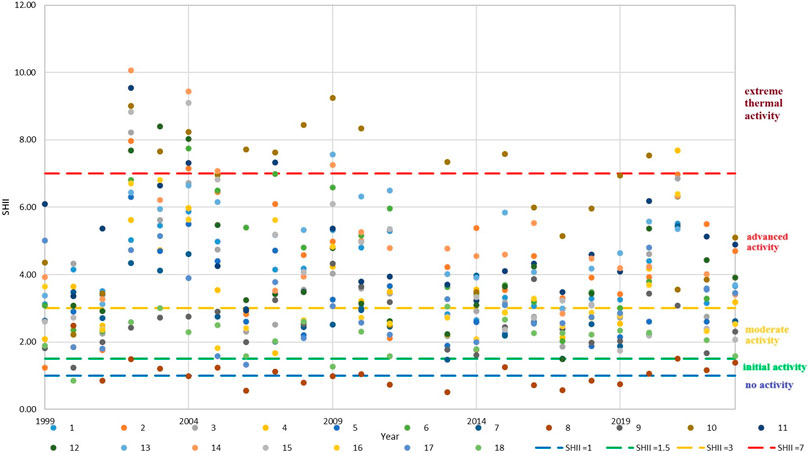
FIGURE 9. The SHII index calculated for heaps and tailings ponds.
Among the most thermally active sites, there are classified waste heaps 1 and 2 located in the Wałbrzych area, waste heaps 10 and 11 situated in the Nowa Ruda area, and tailings ponds from Wałbrzych no 12 and 13 (Figure 10). The highest thermal activity sustained on the level of extreme and advanced we noticed in the waste heap no 10 - Piast in Nowa Ruda. The waste heap Ceglana in Wałbrzych - object 8 was inactive or initially active during the observation period. However, it was identified as a hot spot on the map in 2000, 2014, and 2018.
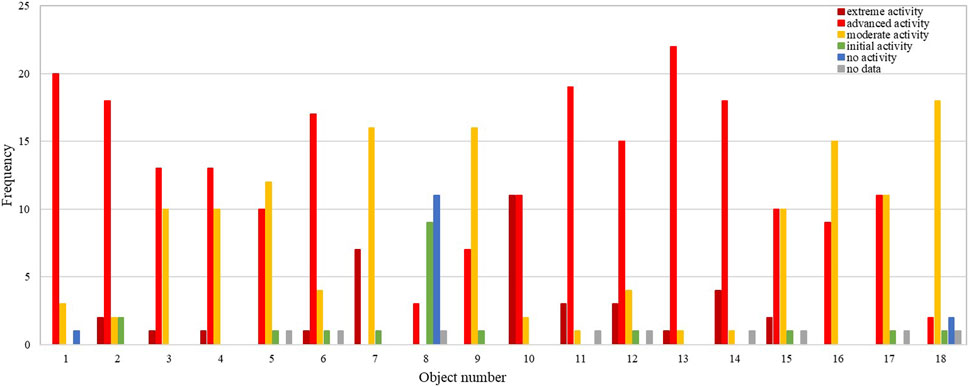
FIGURE 10. SHII frequency for heaps and tailings ponds.
Object surface temperature difference characterizes SHII; thus, even if its temperature is relatively low (e.g., 8 and 23), SHII will be high - in this case, 7.5, which relates to the extreme level of thermal activity. However, its environmental impacts, like heat and GHG emissions, would be much smaller than in case of the same difference but with higher temperatures.
To somehow estimate the potential of particular objects to generate harmful emissions, we defined and calculated the air temperature thermal indicator. ATTI values can be negative numbers when the air temperature is higher than the object’s surface temperature and heat transfer to the atmosphere is blocked.
Comparing the results (Supplementary Appendix SD, Figure 11) we can state that ATTI is less diverse than SHII; still, the activity of the research areas shows two more active phases, 2002–2010 and 2015–2020, when most of the sites manifested a higher capacity to generate emissions - advanced or extreme. We observed that over 23 years, each research object showed activity related to heat generation and possible GHG emissions (Górka et al., 2022). The most active facilities are heaps 10 and 11 in the Nowa Ruda area, tailings ponds 16 and 17 in the Nowa Ruda area, and settling pond 12 in the Walbrzych area (Figure 11). Even site no 8, which was classified as no active or initial active according to SHII, showed ATTI on the moderate generator level for 14 times (Figure 12).
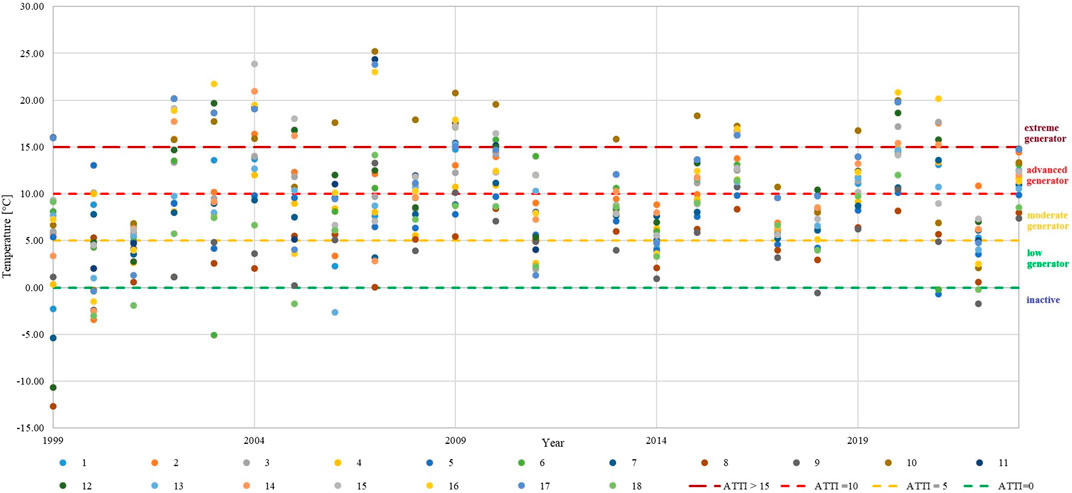
FIGURE 11. ATTI index calculated for heaps and tailings ponds.
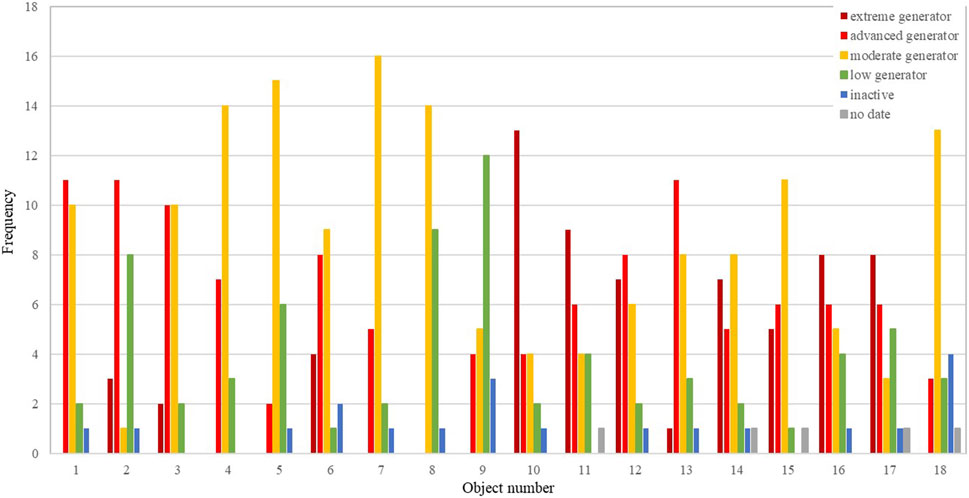
FIGURE 12. ATTI frequency for heaps and tailings ponds.
Based on the procedure carried out, we could identify PMHIs and analyze their thermal activity over time. We have indicated the most active sites that should be monitored permanently and in detail, using satellite imagery supported by drone thermal monitoring and in-situ equipment as well, due to the potential of heat and GHG emissions, which can harm the environment and people living nearby. This knowledge also gave us information on which sites should be covered by detailed investigations on the performance of measurements of pollutant emissions from heaps and tailings ponds, along with chemical analysis of their composition. Such studies are planned for the most active facility.
We demonstrated the advantages of the proposed methodology for identifying and tracking historical changes within the PMHI. Based only on publicly available archival satellite imagery, free air temperature data in the study area, and archival land use maps, we can track thermal changes at post-mining sites and determine those still active and hazardous. However, to apply our approach to real-time analysis and obtain more accurate values for indicators, especially ATTI, it is necessary to pay attention to some limitations of this study.
The first issue is the air temperature inaccuracy related to the limited availability of meteorological stations in the research area. Due to the investigation of many objects over a large area, no precise in-situ meteorological data from each object could be obtained. Basing on just one air temperature measuring point several kilometers away from the investigated sites was the only option for historical analysis. However, to avoid in future research the influence of distance, morphology, atmospheric conditions, etc. (Querol et al., 2011; Mutiibwa et al., 2015; Hammerle et al., 2017; Onifade and Genc, 2018), in-situ measurements of air temperature, wind direction and speed, precipitation, insolation and humidity at each object should be run. Such a plan exists to implement in-situ observation and then develop the temperature correction coefficient for more accurate ATTI calculations in selected areas with the most visible PMHI effect.
Another limitation related to the use of historical data is that the authors could not read the air temperature precisely at the same time when the satellite passed over the research area. Therefore, the study is subject to some systematic error. However, the identified thermal activity of the PMHI is noticeable in the study area in different years, and ATTI reflects this. As the preliminary method, the research allowed us to observe the thermal activity of post-mining sites and select objects. For further, long-term, detailed research, it is planned to synchronize the readings of meteo-data with satellite images.
One of the most critical issues for the presented research is calibrating the satellite imagery with ground temperature in situ measurements as well. The authors did not have the opportunity to perform in-situ calibrating measurements for historical data, and no such data exists from that time. However, conducting in-situ ground temperature measurements for satellite LST data calibration is also considered necessary for regular real-time monitoring. For that reason, a pilot series of measurements was already done. Applying the proposed method, we have chosen the case-study site where, in May 2023, a thermal imaging survey using low-altitude photogrammetry was carried out with a Matrice 300 platform with a FLIR XT2 camera. It was site No. 11 Nowa Ruda Slupiec heap. A calibration method for LST will be developed based on the forthcoming series. However, this limitation did not affect the goal of the manuscript, which was to introduce the method that will enable PMHI identification in the areas where we do not have any other information on the ground temperature except the satellite one and to perform backward analysis of historical data, which we fully achieved.
Another limitation we identified is the spatial resolution and availability of satellite imagery from open-source archival collections. However, every year, satellite Earth observations become more accurate and frequent due to the sensors’ development and the increasing number of satellites. Despite its limitations, the advantage of our method is the possibility of backward analysis and tracking the historical changes, which would be impossible without remote sensing archival open data.
The last important factor for further research that needs to be mentioned here is GHG emission and its quantitative relation to ATTI. In the study, we did not investigate GHG’s origin and emissivity. Still, based on the analysis of other researchers (Carras et al., 2009; Engle et al., 2011; Górka et al., 2022), we can assume that thermal activity in coal-waste facilities always generates GHG emissions. For further research, verifying greenhouse gas emissions based on satellite data with high spatial resolution and in situ calibration of the results is essential. For that, field studies are planned at the Nowa Ruda Slupiec heap to identify emissions of pollutants from the heap to water, soil, and atmospheric air in the context of covering the heap with a comprehensive monitoring system. Moreover, it is planned to develop remote methods and use data of better resolution unavailable in the open repositories.
As we proved in the article, the methodology developed within our research can be successfully applied as a preliminary method for remote identification of post-mining objects demonstrating thermal activity in larger areas. For the first time on such a large scale, we tested this method for the Lower Silesian Coal Basin, where mining activities ceased in the late 1990s, leaving behind tailings ponds and waste heaps that are still thermal active due to self-ignition and spontaneous combustion of coal wastes phenomena that have run with varying intensity over the years.
We confirmed that using Landsat system Level 2 data for surface temperature estimation makes the research process faster and easier. It simplifies the process of hotspot identification and makes it possible for less advanced satellite data users to do so. In compilation with GIS-based analysis of CORINE Land Cover data and visual analysis of orthophoto maps, it was possible to separate areas of increased land surface temperature unrelated to mining activity and indicate sites that resulted in PMHI, which is a novelty in the existing approach. The accuracy of the proposed process of PMHI extraction was proved by verification with an existing database of postmining objects, also showing the issues related to the size of the objects and resolution of satellite imagery. However, the developed method gave accurate and reliable results for sites of size of at least one pixel equal to 900 m2.
Proposed indicators, SHII (Nádudvari et al., 2020) and ATTI, developed by us, made it possible to classify PMHIs and run long-term thermal activity analyses. Both classifications, SHII and ATTI, may help monitor ongoing self-combustion processes in abandoned coal waste heaps and tailings ponds, and they can be applied worldwide. Moreover, ATTI allows site evaluation regarding environmental hazards, thus indicating objects for further, detailed research and the permanent monitoring of GHG and heat emission.
Our studies have also proven that remote sensing, especially satellite data, gives a unique opportunity to run a backward analysis and reach for historical data that are unavailable in traditional ways.
In summary, the developed methodology proves successful in remotely identifying and analyzing thermal activity in post-mining areas. The findings contribute valuable insights for environmental monitoring, hazard assessment, and future detailed research on these objects’ heat and greenhouse gas emissions. The study emphasizes the potential of remote sensing data for large-scale environmental analyses and highlights the need for continuous monitoring of PMHIs to mitigate environmental risks. That is why we continue the research and development of our methodology. One of the most critical issues for our ongoing study is calibrating the satellite imagery with in situ measurements (meteorological parameters and thermal imaging surveys using low-altitude photogrammetry) to work on calibration factors. Moreover, we aim to develop backward analysis based on historical human activity records in selected areas where the activity is well documented–together with analysis of LST with higher frequency (e.g., monthly), we will be able to implement statistical methods for the characterization of PMHI phenomena in particular sites and identify the causes of outliers/peaks, what is impossible without knowledge about the reclamation works done within the observed objects. Further development of thermal activity and GHG emissions indicators will also be run, together with emitted GHG identification and regular monitoring.
The original contributions presented in the study are included in the article/Supplementary Materials, further inquiries can be directed to the corresponding author.
MW-K: Conceptualization, Formal Analysis, Investigation, Methodology, Resources, Supervision, Validation, Writing–original draft, Writing–review and editing. JG-Z: Data curation, Investigation, Methodology, Resources, Software, Supervision, Validation, Visualization, Writing–original draft, Writing–review and editing. AS: Data curation, Investigation, Methodology, Software, Visualization, Writing–original draft. KC: Visualization, Writing–review and editing.
The author(s) declare financial support was received for the research, authorship, and/or publication of this article. The research is funded by a subsidy for 2024 from the Polish Ministry of Science and Higher Education granted to Politechnika Wrocławska.
We thank the Institute of Meteorology and Water Management in Warsaw for providing data from the Szczawno-Zdrój meteorological station.
The authors declare that the research was conducted in the absence of any commercial or financial relationships that could be construed as a potential conflict of interest.
All claims expressed in this article are solely those of the authors and do not necessarily represent those of their affiliated organizations, or those of the publisher, the editors and the reviewers. Any product that may be evaluated in this article, or claim that may be made by its manufacturer, is not guaranteed or endorsed by the publisher.
The Supplementary Material for this article can be found online at: https://www.frontiersin.org/articles/10.3389/fenvs.2024.1305149/full#supplementary-material
Abramowicz, A., and Chybiorz, R. (2019). Fire detection based on a series of thermal images and point measurements: the case study of coal-waste dumps. The International Archives of the Photogrammetry. Remote Sens. Spatial Inf. Sci., 9–12. doi:10.5194/isprs-archives-XLII-1-W2-9-2019
Abramowicz, A., Rahmonov, O., and Chybiorz, R. (2021a). Environmental management and landscape transformation on self-heating coal-waste dumps in the upper silesian Coal Basin. Land 10, 23. doi:10.3390/land10010023
Abramowicz, A., Rahmonov, O., Chybiorz, R., and Ciesielczuk, J. (2021b). Vegetation as an indicator of underground smoldering fire on coal-waste dumps. Fire Saf. J. 121, 103287. doi:10.1016/j.firesaf.2021.103287
Abramowicz, A., Rahmonov, O., Fabiańska, M. J., Nádudvari, A., Chybiorz, R., and Michalak, M. (2021c). Changes in soil chemical composition caused by self-heating of a coal-waste dump. Land Degrad. Dev. 32 (15), 4340–4349. doi:10.1002/ldr.4040
Akcin, H., Kutoglu, S., and Degucci, T. (2007). Integrating GPS and SAR: monitoring coalfield subsidence. GIM Internatıonal 21, 41.
Allen, G., Hollingsworth, P., Kabbabe, K., Pitt, J. R., Mead, M. I., Illingworth, S., et al. (2019). The development and trial of an unmanned aerial system for the measurement of methane flux from landfill and greenhouse gas emission hotspots. Waste Manag. 87, 883–892. doi:10.1016/j.wasman.2017.12.024
Almeida, C. R. d., Teodoro, A. C., and Gonçalves, A. (2021). Study of the urban heat island (UHI) using remote sensing data/techniques: a systematic review. Environments 8, 105. doi:10.3390/environments8100105
Bossowski, A., and Ihnatowicz, A. (2006). Geological atlas of the lower silesian Coal Basin. Warsaw Poland: Geological Institute Warsaw.
Carras, J. N., Day, S. J., Abou, S., and Williams, D. J. (2009). Greenhouse gas emissions from low-temperature oxidation and spontaneous combustion at open-cut coal mines in Australia. Int. J. Coal Geol. 78 (2), 161–168. doi:10.1016/j.coal.2008.12.001
Chatterjee, R. S. (2006). Coal fire mapping from satellite thermal IR data – a case example in Jharia Coalfield, Jharkhand, India. ISPRS J. Photogrammetry Remote Sens. 60 (2), 113–128. doi:10.1016/j.isprsjprs.2005.12.002
Chudy, K., Marszałek, H., and Kierczak, J. (2014). Impact of hard-coal waste dump on water quality — a case study of Ludwikowice Kłodzkie (Nowa Ruda Coalfield, SW Poland). J. Geochem. Explor. 146, 127–135. doi:10.1016/j.gexplo.2014.08.011
Ciesielczuk, J., Czylok, A., Fabiańska, M. J., and Misz-Kennan, M. (2015). Plant occurrence on burning coal waste – a case study from the Katowice-Wełnowiec dump, Poland. Environ. Socio-economic Stud. 3 (2), 1–10. doi:10.1515/environ-2015-0057
Copernicus (2023). Copernicus land monitoring service. https://land.copernicus.eu/.
Dabrowska, D., Rykala, W., and Nourani, V. (2023). Causes, types and consequences of municipal waste landfill fires—literature review. Sustainability 15, 5713. doi:10.3390/su15075713
Dirner, V., Kulova, E., and Dobes, A. (2010). “Impact of mining on the environment,” in The 12. International symposium on environmental issues and waste management in energy and mineral production. SWEMP 2010, Prague, Czech Republic, May 2010.
Elsevier (2012). Coal and peat fires: a global perspective. Berlin, Germany: Elsevier, 375–405. doi:10.1016/C2010-0-68843-2
Engle, M. A., Radke, L. F., Heffern, E. L., O'Keefe, J. M., Smeltzer, C. D., Hower, J. C., et al. (2011). Quantifying greenhouse gas emissions from coal fires using airborne and ground-based methods. Int. J. Coal Geol. 88 (2-3), 147–151. doi:10.1016/j.coal.2011.09.003
Fabiańska, M., Ciesielczuk, J., Nádudvari, Á., Misz-Kennan, M., Kowalski, A., and Kruszewski, Ł. (2019). Environmental influence of gaseous emissions from self-heating coal waste dumps in Silesia, Poland. Environ. Geochem Health 41, 575–601. doi:10.1007/s10653-018-0153-5
Fix, A., Axel, A., Büdenbender, Ch., Ehret, G., Kiemle, Ch., Quatrevalet, M., et al. (2018). “CH4 and CO2 IPDA LIDAR measurements during the COMET 2018 Airborne field campaign,” in 29th International Laser Radar Conference (ILRC29). EPJ Web of Conferences. 237, Hefei. China, June, 2018.
Gawor, Ł. (2017). Potential conflicts connected with the recovery of secondary materials from post mining waste dump. Environ. Socio-economic Stud. 5 (4), 82–86. doi:10.1515/environ-2017-0023
Good, E. J., Ghent, D. J., Bulgin, C. E., and Remedios, J. J. (2017). A spatiotemporal analysis of the relationship between near-surface air temperature and satellite land surface temperatures using 17 years of data from the ATSR series. J. Geophys. Res. Atmos. 122 (17), 9185–9210. doi:10.1002/2017JD026880
Górka, M., Bezyk, Y., Strąpoć, D., and Nęcki, J. (2022). The origin of GHG's emission from self-heating coal waste dump: atmogeochemical interactions and environmental implications. Int. J. Coal Geol. 250, 103912. doi:10.1016/j.coal.2021.103912
Hagishima, A., and Tanimoto, J. (2003). Field measurements for estimating the convective heat transfer coefficient at building surfaces. Build. Environ. 38 (7), 873–881. doi:10.1016/S0360-1323(03)00033-7
Hammerle, A., Meier, F., Heinl, M., Egger, A., and Leitinger, G. (2017). Implications of atmospheric conditions for analysis of surface temperature variability derived from landscape-scale thermography. Int. J. Biometeorol. 61, 575–588. doi:10.1007/s00484-016-1234-8
Hendrychová, M., and Kabrna, M. (2016). An analysis of 200-year-long changes in a landscape affected by large-scale surface coal mining: history, present and future. Appl. Geogr. 74, 151–159. doi:10.1016/j.apgeog.2016.07.009
Huo, H., Jiang, X., Pieśń, X., Li, Z.-L., Ni, Z., and Gao, C. (2014). Detection of coal fire dynamics and propagation direction from multi-temporal night-time Landsat SWIR and tir data: a case study on the rujigou coalfield, northwest (NW) China. Remote Sens. 6, 1234–1259. doi:10.3390/rs6021234
Huo, H., Ni, Z., Gao, C., Zhao, E., Zhang, Y., Lian, Y., et al. (2015). A study of coal fire propagation with remotely sensed thermal infrared data. Remote Sens. 7, 3088–3113. doi:10.3390/rs70303088
Jiang, L., Lin, H., Ma, J., Kong, B., and Wang, Y. (2011). Potential of small-baseline SAR interferometry for monitoring land subsidence related to underground coal fires: wuda (Northern China) case study. Remote Sens. Environ. 115 (2), 257–268. doi:10.1016/j.rse.2010.08.008
Jońca, J., Pawnuk, M., Bezyk, Y., Arsen, A., and Sówka, I. (2022). Drone-assisted monitoring of atmospheric pollution - a comprehensive review. Sustainability 14, 11516. doi:10.3390/su141811516
Karacan, C. Ö., Martín-Fernández, J. A., Ruppert, L. F., and Olea, R. A. (2021). Insights on the characteristics and sources of gas from an underground coal mine using compositional data analysis. Int. J. Coal Geol. 241, 103767. doi:10.1016/j.coal.2021.103767
Karanam, V., Motagh, M., Garg, S., and Jain, K. (2021). Multi-sensor remote sensing analysis of coal fire induced land subsidence in Jharia Coalfields, Jharkhand, India. Int. J. Appl. Earth Observation Geoinformation 102, 102439. doi:10.1016/j.jag.2021.102439
Kondracki, J. (2000). Geografia regionalna polski (Regional geography of Poland). Wydawn. Naukowe PWN., Warszawa.
Kruszewski, Ł., Fabiańska, M. J., Ciesielczuk, J., Segit, T., Orłowski, R., Motyliński, R., et al. (2018). First multi-tool exploration of a gas-condensate-pyrolysate system from the environment of burning coal mine heaps: an in situ FTIR and laboratory GC and PXRD study based on Upper Silesian materials. Sci. Total Environ. 640–641, 1044–1071. doi:10.1016/j.scitotenv.2018.05.319
Kuna-Gwoździewicz, P. (2013). Emission of polycyclic aromatic hydrocarbons from the exhalation zones of thermally active mine waste dumps. J. Sustain. Min. 12 (1), 7–12. doi:10.7424/jsm130103
Landsat (2023). Landsat science. https://landsat.gsfc.nasa.gov/.
Lasak, J., and Zemska, A. (2021). “Territorial plan of justice transformation for the voivodeship lower Silesia 2021-2030 Wałbrzych subregion,” in Polish (Wrocław: Department of Economy Marshal's Office of Lower Silesia), 1–23.
Lewińska-Preis, L., Szram, E., Nádudvari, A., Misz-Kennan, M., Abramowicz, A., Kruszewski, Ł., et al. (2021). Selected ions and major and trace elements as contaminants in coal-waste dump water from the Lower and Upper Silesian Coal Basins (Poland). Int. J. Coal Sci. Technol. 8, 790–814. doi:10.1007/s40789-021-00421-9
Liang, Y., Liang, H., and Zhu, S. (2016). Mercury emission from spontaneously ignited coal gangue hill in Wuda coalfield, Inner Mongolia, China. Fuel 182, 525–530. doi:10.1016/j.fuel.2016.05.092
Martha, T. R., Guha, A., Kumar, K. V., Kamaraju, M. V. V., and Raju, E. V. R. (2010). Recent coal-fire and land-use status of Jharia Coalfield, India from satellite data. Int. J. Remote Sens. 31 (12), 3243–3262. doi:10.1080/01431160903159340
McKenna, P., Erskine, P. D., Lechner, A. M., and Phinn, S. (2017). Measuring fire severity using UAV imagery in semi-arid central Queensland, Australia. Int. J. Remote Sens. 38 (14), 4244–4264. doi:10.1080/01431161.2017.1317942
Melody, S. M., and Johnston, F. H. (2015). Coal mine fires and human health: what do we know? Int. J. Coal Geol. 152, 1–14. doi:10.1016/j.coal.2015.11.001
Milbourne, P., and Mason, K. (2017). Environmental injustice and post-colonial environmentalism: opencast coal mining, landscape and place. Environ. Plan. A Econ. Space 49 (1), 29–46. doi:10.1177/0308518X16665843
Mine Heaps Database (2023). The polish geological Institute. https://cbdgportal.pgi.gov.pl/haldy.
Mishra, R. K., Pandey, J. K., Pandey, J., Kumar, S., and Roy, P. N. S. (2020). Detection and analysis of coal fire in jharia coalfield (JCF) using Landsat remote sensing data. J. Indian Soc. Remote Sens. 48, 181–195. doi:10.1007/s12524-019-01067-6
Mo, F., Li, H., Jing, Q., Zhang, X., Cao, B., and Liu, Q. (2018). “Research on high resolution thermal infrared satellite technology and applications,” in IGARSS 2018 - 2018 IEEE International Geoscience and Remote Sensing Symposium, Valencia, Spain, July, 2018, 5674–5677. doi:10.1109/IGARSS.2018.8517512
Mutiibwa, D., Strachan, S., and Albright, T. (2015). Land surface temperature and surface air temperature in complex terrain. IEEE J. Sel. Top. Appl. Earth Observations Remote Sens. 8 (10), 4762–4774. doi:10.1109/JSTARS.2015.2468594
Nádudvari, A. (2014). Thermal mapping of self-heating zones on coal waste dumps in Upper Silesia (Poland) - a case study. Int. J. Coal Geol. 128–129, 47–54. doi:10.1016/j.coal.2014.04.005
Nádudvari, A., Abramowicz, A., Ciesielczuk, J., Cabała, J., Misz-Kennan, M., and Fabiańska, M. (2021a). Self-heating coal waste fire monitoring and related environmental problems: case studies from Poland and Ukraine. J. Environ. Geogr. 14, 26–38. doi:10.2478/jengeo-2021-0009
Nádudvari, Á., Abramowicz, A., Fabiańska, M., Misz-Kennan, M., and Ciesielczuk, J. (2020). Classification of fires in coal waste dumps based on Landsat, Aster thermal bands and thermal camera in Polish and Ukrainian mining regions. Int. J. Coal Science&Technology 8, 441–456. doi:10.1007/s40789-020-00375-4
Nádudvari, A., Cabała, J., Marynowski, L., Jabłońska, M., Dziurowicz, M., Malczewski, D., et al. (2022). High concentrations of HgS, MeHg and toxic gas emissions in thermally affected waste dumps from hard coal mining in Poland. J. Hazard. Mater. 431, 128542. doi:10.1016/j.jhazmat.2022.128542
Nádudvari, A., Kozielska, B., Abramowicz, A., Fabiańska, M., Ciesielczuk, J., Cabała, J., et al. (2021b). Heavy metal- and organic-matter pollution due to self-heating coal-waste dumps in the Upper Silesian Coal Basin (Poland). J. Hazard. Mater. 412, 125244. doi:10.1016/j.jhazmat.2021.125244
NASA (2023a). The EOS Flagship is a multinational NASA scientific research satellite. https://terra.nasa.gov.
NASA (2023b). Moderate resolution imaging spectroradiometer in NASA. https://modis.gsfc.nasa.gov.
Nguyen, T. X. B., Rosser, K., and Chahl, J. A. (2021). A review of modern thermal imaging sensor technology and applications for autonomous aerial navigation. J. Imaging 7, 217. doi:10.3390/jimaging7100217
NOAA (2023). National oceanic and atmospheric administration U.S. Department of commerce. https://www.avl.class.noaa.gov.
Nourani, V., Foroumandi, E., Sharghi, E., and Dąbrowska, D. (2021). Ecological-environmental quality estimation using remote sensing and combined artificial intelligence techniques. J. Hydroinformatics 23 (1), 47–65. doi:10.2166/hydro.2020.048
Onifade, M., and Genc, B. (2019). A review of spontaneous combustion studies – South African context. Int. J. Min. Reclam. Environ. 33 (8), 527–547. doi:10.1080/17480930.2018.1466402
Paczyński, B. (1995). Atlas hydrogeologiczny Polski (Hydrogeological Atlas of Poland). PAE, Warszawa.
Piątek, E. (1989). History of coal mining in Nowa Ruda area in lower Silesia from 15th to 18th century. Min. Rev. 58 (10), 38–44.
Piątek, E., and Piątek, Z. (1977). First documented methane explosion in mining on Polish territory. Min. News 10, 291–294.
Piątek, E., and Piątek, Z. (1999). Outline of the history of the Lower Silesian coal mining industry. http://www.boehm-chronik.com/bergbau/gorn1434-2000.pdf.
Pinto, C., Jing, X., and Leigh, L. (2020). Evaluation analysis of Landsat level-1 and level-2 data products using in situ measurements. Remote Sens. 12, 2597. doi:10.3390/rs12162597
Protasov, S., Seregin, E., Portola, V., Bobrovnikova, A., and Gorbacheva, M. (2021). Study of the parameters of spontaneous fire seats in coal pit rock dumps. E3S Web Conf. 315, 02007. doi:10.1051/e3sconf/202131502007
Querol, X., Zhuang, X., Font, O., Izquierdo, M., Alastuey, A., Castro, I., et al. (2011). Influence of soil cover on reducing the environmental impact of spontaneous coal combustion in coal waste gobs: a review and new experimental data. Int. J. Coal Geol. 85 (1), 2–22. doi:10.1016/j.coal.2010.09.002
Ren, H., Zhao, Y., Xiao, W., Zhang, J., Chen, Ch., Ding, B., et al. (2022). Vegetation growth status as an early warning indicator for the spontaneous combustion disaster of coal waste dump after reclamation: an unmanned aerial vehicle remote sensing approach. J. Environ. Manag. 317, 115502. doi:10.1016/j.jenvman.2022.115502
Ribeiro, J., Ferreira da Silva, E., and Flores, D. (2010). Burning of coal waste piles from Douro Coalfield (Portugal): petrological, geochemical and mineralogical characterization. Int. J. Coal Geol. 81 (4), 359–372. doi:10.1016/j.coal.2009.10.005
Rykała, W., Fabiańska, M. J., and Dąbrowska, D. (2022). The influence of a fire at an illegal landfill in southern Poland on the formation of toxic compounds and their impact on the natural environment. Int. J. Environ. Res. Public Health 19, 13613. doi:10.3390/ijerph192013613
Sentinels (2023). The European space agency. https://sentinels.copernicus.eu.
Singh, A. K., Singh, U., Panigrahi, D. C., and Singh, J. (2022). Updated greenhouse gas inventory estimates for Indian underground coal mining based on the 2019 IPCC refinements. iScience 25, 104946. doi:10.1016/j.isci.2022.104946
Skiba, L. (1979). Lower silesian Coal Basin in the communist Poland's economy establishment. Warsaw: National Scientific Publishing House.
Smoliński, A., Dombek, V., Pertile, E., Drobek, L., Gogola, K., Żechowska, S. W., et al. (2021). An analysis of self-ignition of mine waste dumps in terms of environmental protection in industrial areas in Poland. Sci. Rep. 11, 8851. doi:10.1038/s41598-021-88470-7
Sobocińska, A., and Sobociński, M. (2019). The use of thermovision in the monitoring of coal storage facilities as an element of safety management in the warehouse management. Syst. Saf. Hum. - Tech. Facil. - Environ. 1 (1), 449–456. doi:10.2478/czoto-2019-0058
Stankevich, S., Titarenko, O., Svideniuk, M., Kharytonov, M., Benselhoub, A., and Khlopova, V. (2016). Air pollution mapping with nitrogen and sulfur dioxides in the south-eastern part of Ukraine using satellite data. Min. Sci. 23, 21–31. doi:10.5277/msc162302
Stracher, G. B. (2019). “Chapter 18 - remote sensing techniques for detecting self-heated hot spots on coal waste dumps in upper Silesia, Poland,” in G.B. Coal and peat fires: a global perspective (Amsterdam, Netherlands: Elsevier). doi:10.1016/B978-0-12-849885-9.00018-4
Swolkień, J. (2020). Polish underground coal mines as point sources of methane emission to the atmosphere. Int. J. Greenh. Gas Control 94, 102921. doi:10.1016/j.ijggc.2019.102921
Syed, T. H., Riyas, M. J., and Kuenzer, C. (2018). Remote sensing of coal fires in India: a review. Earth-Science Rev. 187, 338–355. doi:10.1016/j.earscirev.2018.10.009
Ulrych, J., Fediuk, F., Lang, M., and Martinec, P. (2004). Late paleozoic volcanic rocks of the Intra Sudetic Basin, bohemian Massif: petrological and geochemical characteristics. Chem. Erde Geochem. 64 (2), 127–153. doi:10.1016/j.chemer.2003.11.002
United States Geological Survey (2023a) What-are-acquisition-schedules-landsat-satellites https://www.usgs.gov.
United States Geological Survey (2023b). Landsat 4-7 collection 2 level 2 science product Guide. https://www.usgs.gov.
United States Geological Survey (2023c). Landsat 8-9 collection 2 level 2 ScienceProduct Guide. https://www.usgs.gov.
United States Geological Survey (2023d). Landsat collection 2 surface temperature. https://www.usgs.gov/landsat-missions/landsat-collection-2-surface-temperature.
United States Geological Survey (2023e). United States geological survey. https://www.usgs.gov.
Valjarević, A., Popovici, C., Štilić, A., and Radojković, M. (2022). Cloudiness and water from cloud seeding in connection with plants distribution in the Republic of Moldova. Appl. Water Sci. 12 (12), 262. doi:10.1007/s13201-022-01784-3
Wang, T., Wang, Y., Zhao, F., Feng, H., Liu, J., Zhang, L., et al. (2022). A spatio-temporal temperature-based thresholding algorithm for underground coal fire detection with satellite thermal infrared and radar remote sensing. Int. J. Appl. Earth Observation Geoinformation 110, 102805. doi:10.1016/j.jag.2022.102805
Wasilewski, S. (2020). Monitoring the thermal and gaseous activity of coal waste dumps. Environ. Earth Sci. 79, 474. doi:10.1007/s12665-020-09229-3
Xiaoyang, L., Zhou, W., and Bai, Z. (2016). Vegetation coverage change and stability in large open-pit coal mine dumps in China during 1990–2015. Ecol. Eng. 95, 447–451. doi:10.1016/j.ecoleng.2016.06.051
Xu, J., Zhao, H., Yin, P., Wu, L., and Li, G. (2019). Landscape ecological quality assessment and its dynamic change in coal mining area: a case study of Peixian. Environ. Earth Sci. 78, 708. doi:10.1007/s12665-019-8747-5
Yu, B., She, J., Liu, G., Ma, D., Zhang, R., Zhou, Z., et al. (2022). Coal fire identification and state assessment by integrating multitemporal thermal infrared and InSAR remote sensing data: a case study of Midong District, Urumqi, China. ISPRS J. Photogrammetry Remote Sens. 190, 144–164. doi:10.1016/j.isprsjprs.2022.06.007
Keywords: hard coal mining, waste heaps, tailings ponds, open satellite data, thermal remote sensing, spatiotemporal analysis, LST, PMHI
Citation: Worsa-Kozak M, Górniak-Zimroz J, Szrek A and Chudy K (2024) Remote detection and monitoring of post-mining heat island. Front. Environ. Sci. 12:1305149. doi: 10.3389/fenvs.2024.1305149
Received: 30 September 2023; Accepted: 05 February 2024;
Published: 26 February 2024.
Edited by:
Monica Rivas Casado, Cranfield University, United KingdomReviewed by:
Aleksandar Valjarević, University of Belgrade, SerbiaCopyright © 2024 Worsa-Kozak, Górniak-Zimroz, Szrek and Chudy. This is an open-access article distributed under the terms of the Creative Commons Attribution License (CC BY). The use, distribution or reproduction in other forums is permitted, provided the original author(s) and the copyright owner(s) are credited and that the original publication in this journal is cited, in accordance with accepted academic practice. No use, distribution or reproduction is permitted which does not comply with these terms.
*Correspondence: Magdalena Worsa-Kozak, bWFnZGFsZW5hLndvcnNhLWtvemFrQHB3ci5lZHUucGw=
Disclaimer: All claims expressed in this article are solely those of the authors and do not necessarily represent those of their affiliated organizations, or those of the publisher, the editors and the reviewers. Any product that may be evaluated in this article or claim that may be made by its manufacturer is not guaranteed or endorsed by the publisher.
Research integrity at Frontiers
Learn more about the work of our research integrity team to safeguard the quality of each article we publish.