 Fernando Jarrin-Perez
 Jaehak Jeong
 Rolando Célleri
 Patricio Crespo3
- 1Scheibe Consulting LLC, Austin, TX, United States
- 2Blackland Research and Extension Center, Texas A&M AgriLife Research, Temple, TX, United States
- 3Departamento de Recursos Hídricos y Ciencias Ambientales, Facultad de Ciencias Químicas, Facultad de Ingeniería, Universidad de Cuenca, Cuenca, Ecuador
- 4Department of Biological and Agricultural Engineering, Texas A&M University, College Station, TX, United States
Highly conductive topsoils in neotropical high-elevation grassland-dominated ecosystems, or so-called paramos in the Andean region, influence the local rainfall-runoff processes predominated by saturation-excess overland flow as the primary source of freshwater. The Soil and Water Assessment Tool (SWAT) model has shown limitations when applied to mountainous catchments with highly conductive soils that generate surface runoff as saturation-excess overland flow. In this study, we enhanced SWAT to simulate runoff as saturation-excess overland flow and examined the hydrological responses of an intensively monitored paramo catchment in Ecuador. The model setup considered a detailed representation of the hydro-physical properties of the soils at different depths, including high infiltration and lateral flow rates in the hillslopes and restricted groundwater interactions, a characteristic of the páramo catchments. SWAT reasonably reproduced the daily discharge during dry and wet periods and the cumulative occurrence of high and low flows. The performance metrics NSE, RSR, and PBIAS values during calibration/validation period were 0.86/0.84, 0.31/0.4, and −11.2/-7.58, respectively. The runoff ratio and partitioning of the total runoff into the lateral flow and surface runoff were physically meaningful. More significantly, SWAT was able to simulate saturation-excess overland flow, which is dominant compared to infiltration excess, and it is a distinctive characteristic of páramo catchments. Nevertheless, the model showed limitations in simulating low flows.
1 Introduction
The Soil and Water Assessment Tool (SWAT) (Arnold et al., 1998) SWAT has shown limitations when applied to tropical alpine catchments where highly conductive soils generate surface runoff as saturation excess overland flow (Moges et al., 2017). These limitations are particularly pronounced in high-elevation peat-dominated areas that remain saturated with water throughout the year, such as the marshy grasslands in Scotland, the Afro-alpine wetlands of South-central Ethiopia, or the Andean Páramo in South America, among others. In paramos, the soil infiltration rates usually exceed rainfall intensities (Buytaert et al., 2005) and, therefore, surface runoff by infiltration excess (which is SWAT’s default assumption) is negligible (Poyck et al., 2006; Buytaert et al., 2007; Crespo et al., 2011). For example, in a model intercomparison study in a tropical alpine catchment in the tropical Andes, Plesca et al. (2012) stated that the main disadvantage of SWAT in comparison to other models was that it required a detailed description of soil physical properties while soil data are relatively scarce in the tropical Andes and other mountainous regions. In another model comparison study in the Ethiopian Highlands of Africa, Moges et al. (2017) explained that, despite the inadequacy of SWAT to simulate saturation excess surface runoff, infiltration excess could generate satisfactory results at the monthly scale. Finally, two studies in a catchment with a predominance of saturation excess surface runoff in New York (Hoang et al., 2017; Steenhuis et al., 2019) showed that SWAT failed to identify saturated areas that generate surface runoff. Despite the limitations, SWAT is still widely applied in paramo catchments. In fact, in the last decades, research efforts on understanding the paramos’ hydrological processes have increased substantially and generated a large body of knowledge and data that have improved rainfall-runoff simulations through hydrological models (Correa et al., 2020).
Efforts to improve SWAT applications in tropical alpine catchments have focused on calibrating vegetation-related model parameters and simulating surface runoff by saturation excess. However, few studies reported the significant role of the soil’s physical properties and local soils' massive water storage capacity. For example, modified SWAT versions such as SWAT-T (Alemayehu et al., 2017) and SWAT-Tb (Valencia et al., 2021) reported satisfactory model performance (Nash-Sutcliffe efficiency (NSE) values over 0.5) when reproducing the streamflow and Leaf Area Index (LAI) variability of tropical Andean forests. In the Peruvian Andes, Fernandez-Palomino et al. (2021) improved the prediction capacity of SWAT by adjusting LAI-related parameters using remote sensing data and applying a multi-objective calibration scheme based on a statistical performance metric and hydrological signatures (e.g., flow duration curves (FDC) and baseflow index (BFI)). These modifications have improved SWAT simulations in Andean basins, but their application in paramos was limited because surface runoff estimation was still modeled through infiltration excess.
Although SWAT versions such as SWAT-Hillslope (SWAT-HS) (Hoang et al., 2017) and SWAT-with-impermeable-layers (SWAT-wil) (Steenhuis et al., 2019) can reproduce surface runoff by saturation excess, these models are based on topographical characteristics. Thus, these models disregard the significant role of soil’s physical properties in the local watershed hydrology. For example, SWAT-HS and SWAT-wil were tested in the Town Brook watershed, a mountainous catchment in the U.S. on moderate slopes with impermeable bedrock layers and shallow soils with high saturated conductivity (∼33 m h−1) and high soil water storage capacity (∼136 mm)infiltration rates that resemble the Paramo characteristics. These models divide the watershed into subbasins and classify them by wetness classes using a topographic wetness index. Then, saturation excess surface runoff is reproduced by restricting overland flow in wet areas, usually near the riparian zone. Both models (SWAT-HS and SWAT-wil) reasonably identified saturated areas and simulated the runoff components' spatial distribution, such as surface runoff and lateral flow. However, these models assumed riparian soils' reduced water storage capacity to generate overland flow in saturated areas. This assumption is unsuitable for paramo catchments, whose soils exhibit excellent water retention capacity (Buytaert et al., 2007). So far, SWAT applications in tropical Andean catchments have not modeled paramos’ runoff as saturation excess or considered the variability of soil properties at several depths.
Therefore, we propose a soil-based SWAT simulation with an improved representation of saturation excess overland flow that can accurately simulate the rainfall-runoff responses of neotropical alpine catchments in the Paramo. Our approach considers a detailed representation of soil physical properties at several depths and constraining soil-related model parameters based on field measurements. The model setup assumes an absence of groundwater return flow with an impermeable bedrock layer below the soil root zone and a controlled generation of overland surface runoff. Overland flow generation is reduced at steep slopes but increased at lower slopes. Finally, the modeling outcomes are evaluated based on statistical performance metrics, flow duration curves, and the distribution of the water balance components. The study also highlights how SWAT simulations that commonly calculate surface runoff by infiltration excess may lead to inaccurate outcomes (Kirchner, 2006), despite satisfactory results. Given the versatility of the SWAT model for simulating processes in land surface and water at the catchment level and over long periods, our soil-based SWAT model can be suitable to explore short- and long-term impacts due to links among land-use change, changes in the soil physical properties, and streamflow generation of Andean Paramo catchments.
2 Data and methods
2.1 Study area
The Zhurucay Ecohydrological Observatory (ZEO) is an intensively monitored experimental site established in 2010 by the University of Cuenca in the Tropical Andes in southern Ecuador (Figure 1). The drainage area comprises 7.53 km2 of nested catchments in which altitude spans between 3400 and 3900 m.a.s.l (Mosquera et al., 2015). Its geomorphology consists of U-shaped glacial valleys with slopes ranging between 0% and 20%, although slopes up to 40% can be found (Mosquera et al., 2016b). The geology is dominated by the Quimsacocha (basalts, feldspars, and andesitic pyroclasts) and the Turi formations (tuffaceous andesitic breccias, conglomerates, and stratified fluvial sands), and Quaternary deposits in a smaller proportion (Pratt et al., 1997).
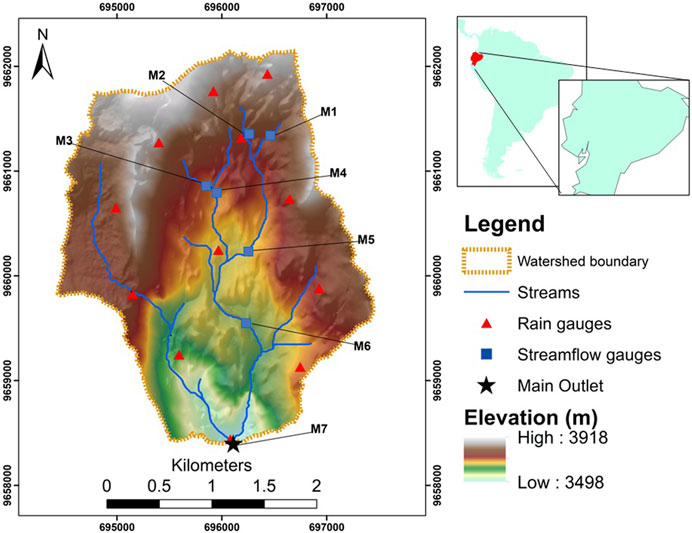
FIGURE 1. Location of the study area and monitoring network of rain gauges and streamflow weirs (M) within the Zhurucay Ecohydrological Observatory in Ecuador.
The climate is mainly influenced by the Pacific regime from the west and by air masses originating from the Amazon Basin in the east (Vuille et al., 2000). The mean air temperature is 6 °C at 3780 m.a.s.l. (Cordova et al., 2015) and primarily constant throughout the year (Crespo et al., 2011). The annual precipitation is 1345 mm (Mosquera et al., 2016a), but fog and drizzle interception account for an additional 15% (Padrón et al., 2015). Rainfall intensities are low and rarely exceed 5 mm h−1 (Padrón et al., 2015). The annual average discharge is 864 mm y−1, representing about 60% of the total rainfall (Mosquera et al., 2015). Reported runoff coefficient values of 0.68 (Mosquera et al., 2015) and 0.8 (Correa et al., 2016) suggest the catchment is highly responsive to rainfall events. Annual reference evapotranspiration is 732 mm (Cordova et al., 2015), representing about 40% of the yearly precipitation volume (Mosquera et al., 2015).
The primary soils in the Zhurucay River catchment are Histosol and Andosol (IUSSWorkingGroup, 2015) (approximately 24% and 76% of the catchment area, respectively), although there are small areas of Cambisol and Leptosol soils (Correa et al., 2016). Histosol is found at the bottom of the valleys and the foot of the hillslopes (Buytaert et al., 2006). However, small isolated patches of Histosol can also be found at the hilltops, which are hydrologically disconnected from the slopes (Mosquera et al., 2016a). Histosols usually consist of a highly organic H horizon, ranging from 24 to 70 cm depth, and a mineral C horizon with an average depth of 30 cm; however, they may be several meters deep in wetland areas (Buytaert and Beven, 2011).
In most paramos, Andosols are shallower at the hillslopes than Histosols, and their depth varies according to the physiographic position (Aucapiña and Marín, 2014). For example, Andosols in the middle slopes exhibit an organic Ah horizon and a C horizon. They are thicker than other soils in the upper slopes and hilltops, where Andosols only show an Ah horizon (Aucapiña and Marín, 2014). Due to their high organic carbon content, low bulk density, and high saturated hydraulic conductivity, both soils present a high infiltration rate and a water storage capacity of up to 90% of their volume (Buytaert et al., 2004; Iñiguez et al., 2015).
Vegetation coverage mainly comprises tussock grasses and cushion plants and is highly correlated with the main soil types (Ramsay and Oxley, 1997; Sklenář and Jørgensen, 1999). Cushions plants dominate the bottom of the valley, and its surface extent matches closely with Histosols (Mosquera et al., 2015), while the Andosol extension is occupied mainly by tussock grasses and small patches of riparian forest species and introduced pine trees (Correa et al., 2017b).
2.2 Available data
Zhurucay arguably counts with the densest hydro-meteorological monitoring network in the Andean Paramo. Over the years, Zhurucay has been equipped with Two automatic meteorological stations that record temperature, relative humidity, precipitation, atmospheric pressure, wind speed and direction, solar radiation, and long and short wave net radiation; a network of 5 permanent rain gauges, which, during experimental periods, has been extended to twelve gauges; a water quality monitoring system based on isotopic tracers; 38 sensors for monitoring soil moisture dynamics in a hillslope; two sets of energy balance sensors; a LICOR Eddy Covariance station; and nine weirs for discharge measurements spatially distributed in the upper, middle, and lower watershed. Additional information about Zhurucay is available at https://www.ucuenca.edu.ec/idrhica/index.php/en/laboratories-and-observatories/zhurucay-ecohydrological-observatory/.
This study used weather data (e.g., air temperature, relative humidity, solar radiation, and wind speed) from two locations, precipitation volume from 12 gauges, and discharge rate from 7 weirs (Figure 1). Observed streamflow at the main outlet was used to calibrate and evaluate the model. Model performance metrics were also calculated at internal weirs. Hydro-meteorological data were available at the 5-min temporal resolution but were aggregated into daily timesteps. Data for this study covered the period from 8/2010 to 2/2016. However, the period used for the simulation was from 1/1/2011 to 12/31/2015.
2.3 The SWAT model
SWAT is a semi-distributed physically-based model developed to predict the impact of management practices in watersheds and large river basins over long periods (Neitsch et al., 2011). For modeling purposes, SWAT divides the watershed into spatially related subbasins subdivided into hydrological response units (HRU), portions of the subbasin with a unique combination of land use and management and soil attributes (Neitsch et al., 2002).
SWAT has two simulation phases: a land phase that determines the number of loadings (e.g., water, sediment, nutrient, and pesticide) discharged to the main channel of each subbasin and a routing phase that simulates the movement of loadings through the channel network towards the main outlet. SWAT hydrologic cycle representation (Eq. 1) is based on the water balance equation:
Where SWt is the final soil water content, SW0 is the initial soil water content on day i, Rday is the amount of precipitation on day i, Qsurf is the amount of surface runoff on day i, Ea is the amount of rainfall on day i, wseep is the amount of water entering in the vadose zone on day i, and Qgw is the amount of return flow on day i.
2.4 Model setup
The ArcSWAT 2012 interface was used to set up and parameterize a SWAT model. We used a 3-m resolution digital elevation model (DEM) from the National System of Information and Management of Rural Lands and Technological Infrastructure of Ecuador (SIGTIERRAS). We used the DEM to delineate the watershed area, internal sub-catchments, and stream network and calculate morphometric basin parameters. We applied a threshold drainage area of 20ha that generated 28 subbasins and 251 hydrological response units (HRUs). Slopes, expressed as a percentage, were classified into five slope categories: 0–5, 5–10, 10–20, 20–40, and >40 (Figure 1). The Curve Number (CN) method was selected to simulate surface runoff. We allowed the SWAT model to adjust the curve number automatically based on the slope gradient. Potential evapotranspiration (PET) was estimated using the Penman-Monteith method. The simulation period was set from 1/1/2011 to 12/31/2015 and divided into 3 years for model warm-up (2011–2013), 1 year for calibration (2014), and one for validation (2015).
The University of Cuenca’s Department of Water Resources and Environmental Sciences (iDRHICA) provided land coverage and soil data. Land coverage in the ZEO catchment consists of tussock grasses (78%), cushion plants (17%), small patches of pine forest (4%), and Polylepys forest (1%). However, land use distribution was reclassified for hydrological modeling purposes to match SWAT’s land use classification.
Based on a previous application of SWAT in Andean watersheds (Quintero et al., 2013; Uribe et al., 2013), the land uses at ZEO were reclassified as follows: Winter pasture (WPAS) for representing tussock grasses, bluegrass (BLUG) for representing cushion plants, pine forest (PINE) for representing pine plantations, and deciduous forest (FRSD) for representing the polylepis forest. For the features WPAS and BLUG, we modified the leaf area index (LAI) according to Krajenbrink (2007). The growing season for these features was set from January 1 to December/31 to represent the local perennial vegetation system better.
The soil map was reclassified into two classes: Andosol and Histosol. Because of their small extension, areas with Leptosols and Cambisols were assigned with more dominant soil—Andosol. To assimilate the soil data into the SWAT model, each soil type’s physical properties were compiled in a table and linked to the SWAT model database. Soil parameters were derived from three sources: Field measurements at 62 points across the catchment—provided by iDRHICA—and previous studies by Quichimbo et al. (2012) and Aucapiña and Marín (2014) in the same catchment. The soil sequence for each soil type was defined as follows: Horizons Ah, A, and C for Andosols and horizons H, A, and C for Histosols. A list of averaged soil-related SWAT parameters classified by soil horizon, soil type and land coverage are presented in Table 1.
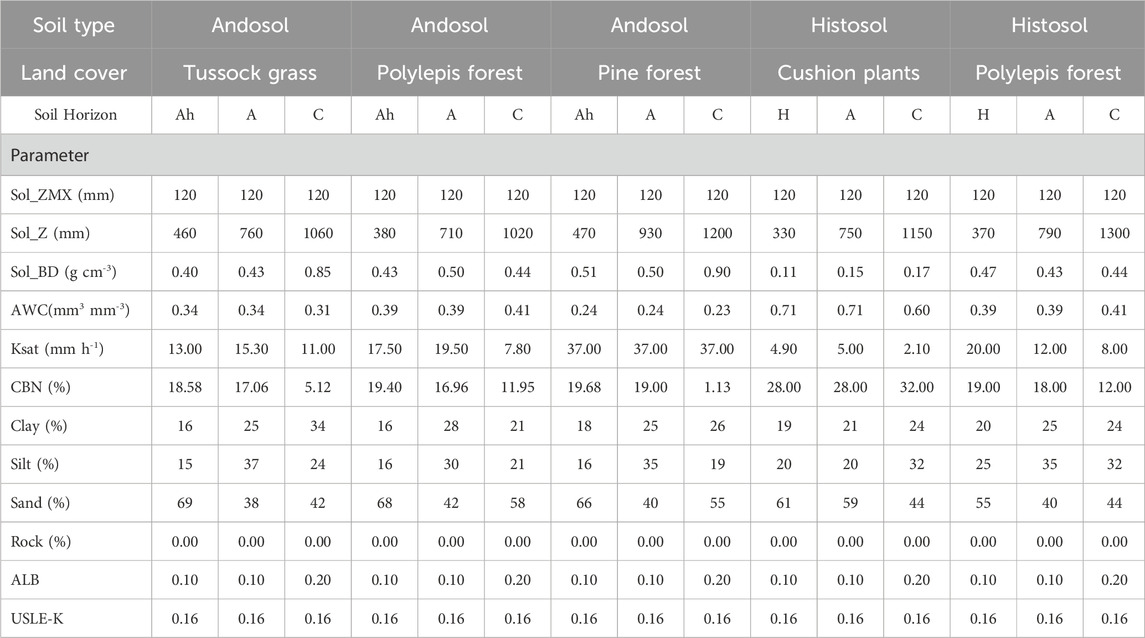
TABLE 1. Soil-related input parameter used by SWAT model. Parameters are classified by soil type, soil horizon, and vegetation coverage.
Average values for each parameter were used to create two soil classes in the SWAT soil database. In contrast, maximum and minimum values were used as reference thresholds during calibration. The soil parameters required by SWAT are Maximum rooting depth (Sol_ZMX), Soil layer thickness (Sol_Z), Moist bulk density (Sol_BD), Available water capacity of the soil layer (AWC), saturated hydraulic conductivity (KSat), organic carbon content (CBN), Clay content (Clay), Silt content (Silt), Sand content (Sand), Rock fragment content (Rock), Moist soil albedo (ALB) and USLE equation soil erodibility (K) factor (USLE-K).
2.5 Model calibration
Two rainfall-runoff simulation approaches resulted from the calibration process: a SWAT model that, by default, represented infiltration excess runoff and a SWAT model that emulated a saturation excess surface runoff signal. SWAT has been applied with the infiltration excess runoff calculation in several Andean catchments (Quintero et al., 2009; Plesca et al., 2012; Espinosa and Rivera, 2016; Hasan and Wyseure, 2018), with all of them have reported satisfactory results. Modified SWAT versions that simulate saturation excess surface runoff, such as SWAT-HS and SWAT-wil, have not been tested in the Andes. However, the application of these models in catchments with steep slopes and impermeable bedrock layers (Hoang et al., 2017; Steenhuis et al., 2019), which resembles the Andean paramos’ configuration, demonstrates that an improved representation of the saturation excess overland flow may be suitable to simulate ZEO.
The initial model setup aimed to represent two assumptions related to the natural characteristics of ZEO: the absence of groundwater contribution and the virtual nonexistence of overland surface runoff. To represent the first assumption in the model setup, we created an impermeable layer that prevented deep percolation or groundwater recharge using the depth-to-the-impermeable layer parameter (DEP_IMP). We set DEP_IMP equal to the depth of the deepest soil horizon for each soil type. This action restricted the conversion of infiltrated rainfall into aquifer recharge or groundwater return flow (GWQ). The elimination of groundwater losses consequently increased the water availability for water storage in the soil profile (SW), for lateral flow through the soil profile (LATQ), and for overland surface runoff (SURQ). Hence, for the second assumption, we focused on minimizing SURQ by increasing LATQ and SW.
For the second assumption, we aimed to maximize the amount of water in the soil profile by modifying parameters that represent the hydro-physical properties of the soils. We set the saturated hydraulic conductivity (Ksat) and the soil available water content (AWC) parameters to their maximum feasible values presented in Table 1. The High Ksat values increased the soil infiltration rate and favored lateral flow in the model, while higher AWC increased water retention in the soils.
To minimize superficial runoff generation by the model, we modified the average-slope-length (SLSUBSSN) parameter, which controls the distance sheet flow as the dominant runoff process. Given that in the Zhurucay catchment, the overland flow has been reported to occur only in the flat areas downstream, and we allowed sheet flow to extend longer in these areas and restricted sheet flow in the hillslopes. We set a higher SLSUBSSN value to HRUs with flatter slopes for sheet flow to extend longer. For HRUs with steep slopes, we set lower SLSUBSSN values (Table 2). Since there were no measurements of the average slope length in ZEO, we used automatic calibration to define the optimal value for this parameter. However, the SLSUBSSN parameter required additional manual calibration and further refinement to represent surface runoff as saturation excess overland flow.
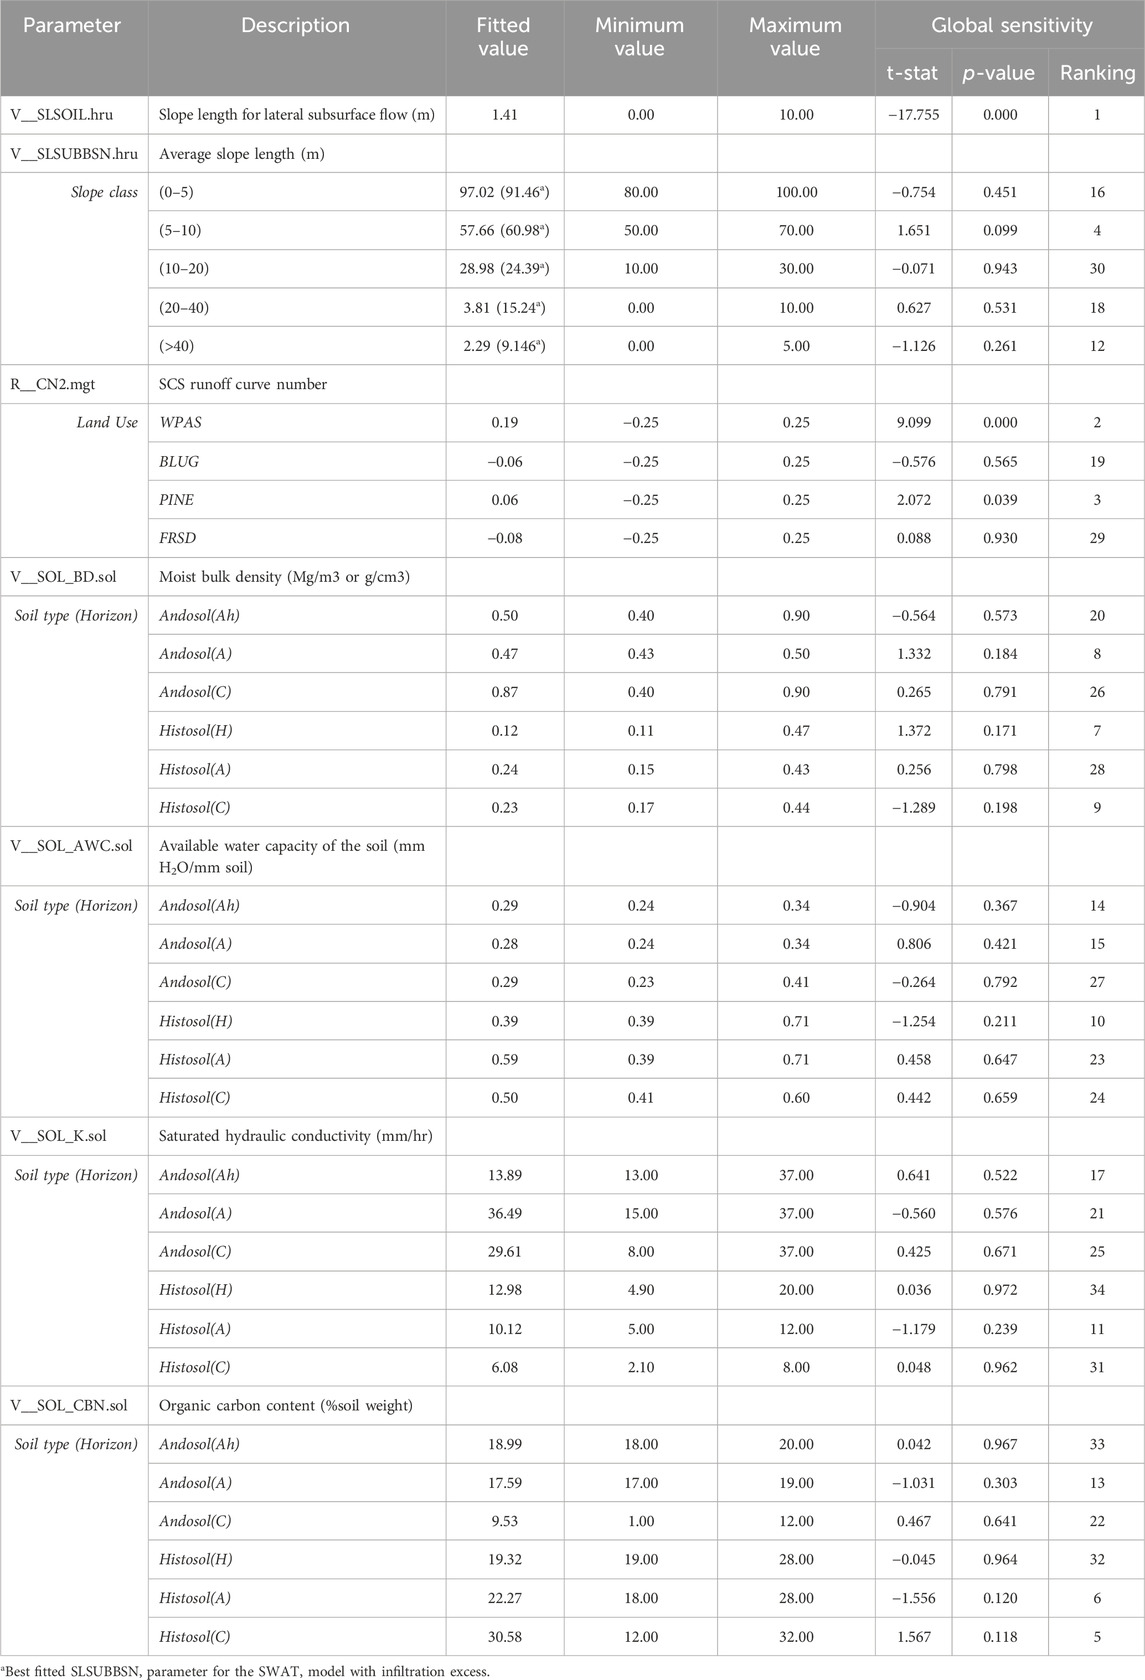
TABLE 2. SWAT best-fitted parameters values and sensitivity ranking.
The calibration process of the SLSUBSSN parameter generated two different model signals: a SWAT with infiltration excess surface runoff and a SWAT with saturation excess. Both approaches had a similar setup except for the value for the SLSUBSSN parameter for HRUs with steep slopes (as shown in Table 2). Without properly adjusting the SLSUBSSN value at the steeper slopes, the SWAT model with infiltration excess can capture the peak flows but overestimate surface runoff generation and base flow. However, when the SLSUBSSN was adjusted, the SWAT model with saturation excess consistently represented high and low flow throughout the simulation period. The differences in model performance and simulation outputs between the two approaches are presented in the results section.
2.5.1 Automatic calibration
An automatic calibration process was performed at daily time steps using the software SWAT-CUP (Abbaspour, 2011). Within SWAT-CUP, we selected the Sequential uncertainty fitting (SUFI-2) algorithm (Abbaspour et al., 2004) for model calibration and used NSE as an objective function. SWAT-CUP was set on 500 iteration batches to find a set of parameters that optimizes the model performance. Several batches were required to optimize the model. Table 2 presents the list of calibrated parameters with their minimum, maximum and best-fitted values. The analyses of model uncertainties and parameter sensitivity were also performed using SWAT-CUP.
2.6 Uncertainty and parameter sensitivity analysis
Uncertainties from all sources (e.g., input data, model parameters, conceptual model) in SWAT-CUP are expressed as the 95% probability distributions calculated at the 2.75% and 97.5% levels of the cumulative distribution of an output variable by using Latin hypercube sampling. The 95% prediction uncertainty, or 95PPU, defines a threshold of possible reasonable solutions generated by specific parameter ranges. The goodness of fit is determined by two indices: The P-factor and the R-factor. The P- and R-factor both range between 0 and 1. The P factor represents the percentage of observations bracketed by the 95PPU (1 indicates 100% bracketing), and the R-factor denotes the width of 95PPU, respectively.
A global parameter sensitivity analysis was performed using SWAT-CUP. Parameter sensitivity is expressed in terms of the t-stat and p-value. Sensitive parameters are the ones having more significant t-stat values and lower p-values.
2.7 Model evaluation
Model calibration based solely on observed discharge records may not guarantee the global optimization of the model parameters or the reliability of modeling outputs (Larabi et al., 2018; Triana et al., 2019). This study evaluated hydrological signatures such as flow duration curves (FDC), the water balance and runoff components' evaluation of the paramo’s hydrological behavior, and estimated statistical performance metrics to improve calibration accuracy.
2.7.1 Statistical performance metrics
Statistical metrics used to evaluate the model performance during the calibration and validation process included the coefficient of determination (R2), which describes the degree of collinearity between observed and simulated data, the Nash-Sutcliffe efficiency coefficient (NSE) (Nash and Sutcliffe, 1970), which evaluate the overall fit between the observed and simulated hydrograph, and the Percent Bias (PBIAS) (Gupta et al., 1999), which measures the average overestimation or underestimation of the simulated data against observations.
2.7.2 Flow duration curves (FDCs)
FDCs were used to compare the flow characteristics observed at ZEO with the flow characteristics generated by the two SWAT models because Crespo et al. (2011) found that, despite differences in climate and altitude, FDCs from high-elevation tropical catchments show the same particular shape, (except for highly intervened catchments) with moderate slope and predominance of low flows. Flow rates were expressed on a unit area basis (specific water yield), and flow regimes were defined in the same catchment based on a previous study by Mosquera et al. (2015). Flow regime classification was described as follows: high flow regime corresponds to non-exceedance runoff values between Qmax and Q90; moderate flow regime corresponds to values between Q90 and Q35, and low flow regime corresponds to values below Q35.
2.7.3 Water balance distribution
In the ZEO catchment, there is little groundwater flow coming in or out of the catchment (Correa et al., 2017a); therefore, precipitation (P) was assumed to be the only water input. Water outputs were restricted to evapotranspiration (ET) and water yield (WYLD). This latter comprises overland surface runoff (SURQ) and subsurface or lateral flow through the soils (LATQ). The simulated average volume of each water balance component was compared to values reported from ZEO and other Andean Paramo catchments.
2.7.4 Total runoff components
The model evaluation process used the simulated fractions of SURQ and LATQ concerning the total runoff. Given that overland surface runoff at ZEO is minuscule, we considered SWAT performance satisfactory if the simulated fraction of SURQ was considerably lesser than LATQ. The soils’ infiltration rate at ZEO vastly exceeds the average rainfall intensities; thus, Hortonian flow is negligible, and surface runoff occurs as saturation overland flow only after extreme rainfall events (Crespo et al., 2012; Correa et al., 2017a). Lazo et al. (2019) report that maximum, mean, and minimum rainfall intensities from 42 storm events recorded at ZEO ranged between 0.6 and 22.3, 0.1 to 5.4, and 0–1.1 mm h−1, respectively. These rainfall intensities are much smaller than the hydraulic conductivity of local soils, ranging between 5 and 41 mm h-1, as shown in Table 1.
3 Results
3.1 Streamflow simulation
The SWAT model with either saturation excess or infiltration excess runoff approach reasonably reproduced daily discharge at the watershed outlet. With saturation excess runoff, SWAT generated low and high flows that consistently matched observations throughout the calibration and validation periods (Figure 2B). SWAT with infiltration excess runoff accurately simulated daily discharge during rainy periods but consistently overestimated flow during dry periods (Figure 2A). However, considerable differences were found between the SWAT model with saturation excess and the SWAT model with infiltration excess after further analysis of the modeling outcomes.
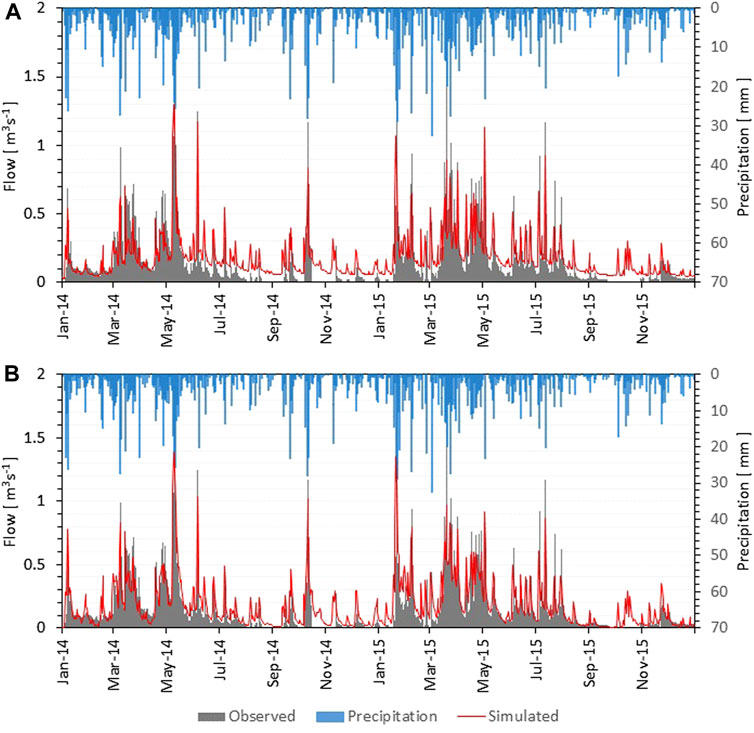
FIGURE 2. Daily precipitation (blue) and observed (gray) and simulated (red) discharge at the main outlet of Zhurucay Ecohydrological Observatory for two modeling approaches: (A) SWAT with infiltration excess runoff and (B) SWAT with saturation excess runoff.
3.2 Model performance
Overall, the performance of both models was satisfactory (i.e., with either runoff estimation approach). SWAT with saturation excess runoff generated NSE = 0.86, RSR = 0.38, PBIAS = −11.2 during calibration, and NSE = 0.84, RSR = 0.40, and PBIAS = −7.58 during validation. SWAT with infiltration excess runoff generated NSE = 0.80, RSR = 0.45, PBIAS = −6.26, and NSE = 0.75, RSR = 0.50, and PBIAS = −13.58 for calibration and validation, respectively. Sucozhañay and Célleri (2018) reported similar performance (NSE ranging from 0.8 to 0.83) when they tested the Hydrologiska Byråns Vattenbalansavdelning (HBV-light) model at the same catchment. Buytaert and Beven (2011) also reported similar results (NSE 0.72–0.87) after testing the TOPMODEL in a 2.53 km2 paramo-covered catchment at a similar altitude. The performance metrics from both SWAT modeling approaches were satisfactory and similar to previous studies in paramo catchments.
3.3 Flow duration curves
The analysis of flow duration curves (FDCs) (Figure 3) showed considerable differences in the streamflow simulation of each SWAT model. The FDC (Figure 3B) from the SWAT with saturation excess runoff resembled typical FDCs of small tropical Andean catchments with the predominance of natural grasslands. FDCs from this catchment type are usually dominated by low flows and present a moderate slope that denotes good regulation capacity. Examples of FDCs from small paramo catchments across Ecuador can be found in Crespo et al. (2011). The frequency of flow rates generated by the SWAT model with saturation excess indicated the runoff was generated mainly by flows lower than 60 L s−1 km-2 or 0.45 m3 s−1. This flow rate was exceeded only 10% of the time, which agreed with the results from Mosquera et al. (2015) in the same catchment. SWAT with saturation excess runoff reasonably simulated the streamflow characteristics for high, moderate, and low flow regimes at ZEO. However, the model showed limitations for simulating low flow rates below 1 L s−1 km-2 or 0.0075 m3 s−1.
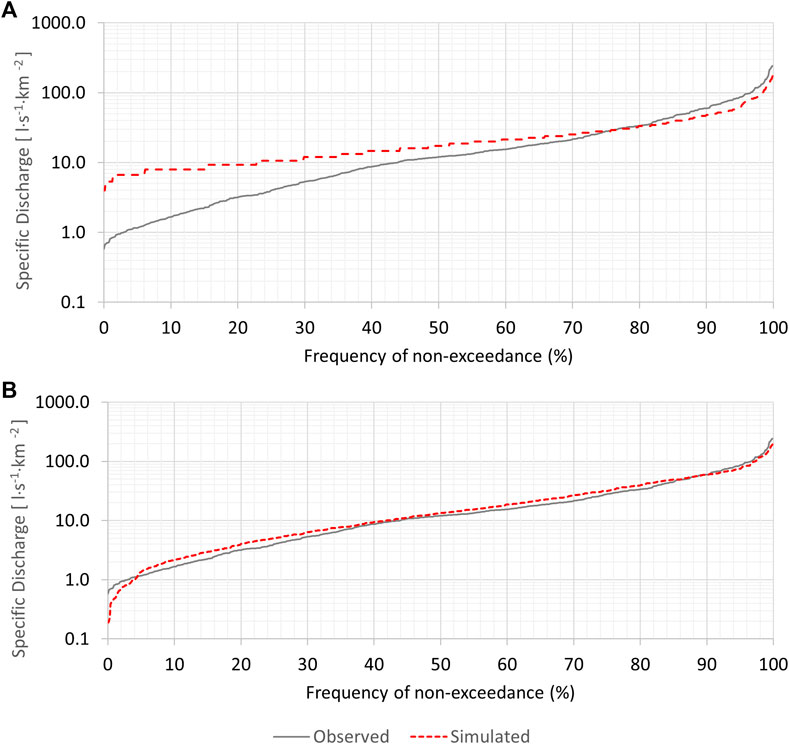
FIGURE 3. Observed (black) and simulated (red) flow duration curves for Zhurucay using two modeling approaches: (A) SWAT with infiltration excess runoff and (B) SWAT with saturation excess runoff.
Simulated runoff from the SWAT with infiltration excess runoff (Figure 3A) was generated mainly by flows lower than 50 L s−1 km-2 or 0.38 m3 s−1. This flow rate was exceeded only 10% of the time, which is reasonable for paramo catchments. Simulated flow characteristics were similar to ZEO’s streamflow for high flow regimes but differed for moderate and low flow regimes. Moreover, SWAT with infiltration runoff excess could not simulate flow rates below 4 L s−1 km-2 or 0.03 m3 s−1. Differences between both models were identifiable through the FDCs, in contrast to the analysis of hydrographs and statistical performance metrics, in which modeling outcomes were virtually identical.
3.4 Water balance and runoff components
The water balance distributions of both simulation approaches were similar and reasonable for natural paramo catchments. The average annual precipitation (1206 mm) was partitioned to 446 mm (37%) evapotranspiration and 760 mm (63%) water yield in the SWAT with saturation excess runoff. The same model with the infiltration excess approach yielded similar partitioning of rainfall: 434 mm (36%) ET and 772 mm (64%) water yield (Table 3). The ratio of water yield to precipitation (runoff ratio) for both approaches was virtually the same (0.64 and 0.63). These values agree with runoff ratios for tropical alpine regions, ranging from 0.54 in the Simien Mountains in the Ethiopian Highlands (Liu et al., 2008) up to 0.73 in the northern Andes of Ecuador and Colombia (Buytaert et al., 2007). Moreover, in a sub-catchment of Zhurucay, Crespo et al. (2011) reported a runoff ratio of 0.73, while Mosquera et al. (2015) reported 0.68 for the entire observatory. Even though the water balance components (PET, and WYLD) from both simulations were similar, the evaluation of the total runoff components differed.
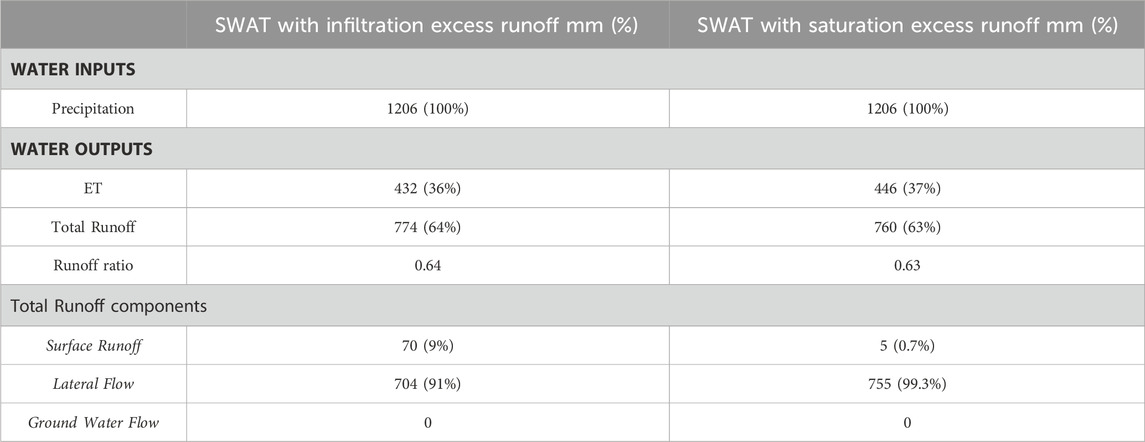
TABLE 3. Distribution of the water balance components and partition of the total runoff into surface runoff and lateral flow.
Simulated total runoff from the SWAT with saturation excess runoff comprised 99.3% lateral flow and 0.7% surface runoff, while the SWAT with infiltration excess runoff consisted of 91% lateral flow and 9% surface runoff. The former distribution of the runoff components resembled the paramos’ hydrologic behavior, in which overland surface runoff (Hortonian) is virtually nonexistent but occurs only a few times a year after extreme rainfall events as saturation excess surface runoff.
Figure 4 shows the total simulated water yield (gray) and its components (lateral flow (blue) and surface runoff (red) for the period April to October 2015. The simulated water yield was mainly composed of lateral flow in both modeling approaches. However, the daily volume of surface runoff generated by the SWAT with saturation excess runoff (Figure 4B) was substantially lower than that with infiltration excess runoff (Figure 4A). Daily surface runoff generated by the SWAT with saturation excess was very low (minimum, average, and maximum were 0.01, 0.16, and 1.24 mm, respectively). Moreover, the contribution of surface runoff to the total runoff was almost negligible even during peak discharge, which is consistent with the notion that Hortonian flow is negligible in paramo catchments (Correa et al., 2017a; Correa et al., 2019).
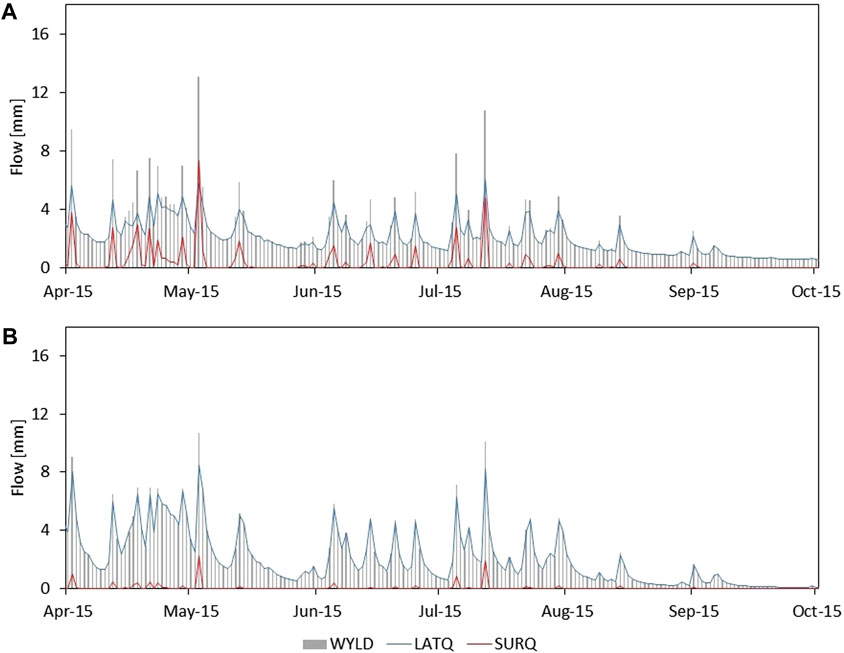
FIGURE 4. Partition of the simulated water yield (gray) into lateral flow (blue) and surface runoff (red) for two modeling approaches from April to October 2015: (A) SWAT with infiltration excess runoff and (B) SWAT with saturation excess runoff.
On the other hand, the SWAT with infiltration excess runoff consistently generated higher surface runoff than the other SWAT model. Besides, the contribution of surface runoff to the total runoff was also more significant. This was evident during peak discharge (for example, May and July 2015 in Figure 4A), in which both components (surface runoff and lateral flow) contributed almost the same to the total runoff. This behavior misrepresents the functioning of undisturbed paramo catchments and, therefore, denotes a limitation of the SWAT with infiltration excess runoff to simulate neotropical alpine wetlands. Thus, modeling outcomes from the SWAT with infiltration excess runoff were disregarded from further analysis.
3.5 Uncertainty analysis
The uncertainty analysis from the SWAT with saturation excess runoff showed satisfactory results. The values of P- and R-factors were 0.76 and 0.82, respectively, which indicate that the range of calibrated parameters generated a set of promising solutions (the 95PPU) that bracketed 76% of the streamflow observations (Figure 5). P-factors greater than 0.7 and R-factors close to 1 indicate that the model uncertainty is insignificant (Abbaspour, 2013). However, in Figure 5, the 95PPU (green) brackets more observations (blue) in the first half of the year (2014) than in the second half. Moreover, the best simulation (red) notably underestimates low flows during the year’s first half while overestimating low flows during the second half. These results and the previous analysis of FDCs (Figure 4) exhibit that SWAT is somewhat limited in the simulation of low flows in high-elevation tropical grasslands despite the overall satisfactory model performance. This conclusion agrees with other studies conducted in Zhurucay and paramo catchments (Buytaert and Beven, 2011; Crespo et al., 2012; Sucozhañay and Célleri, 2018).
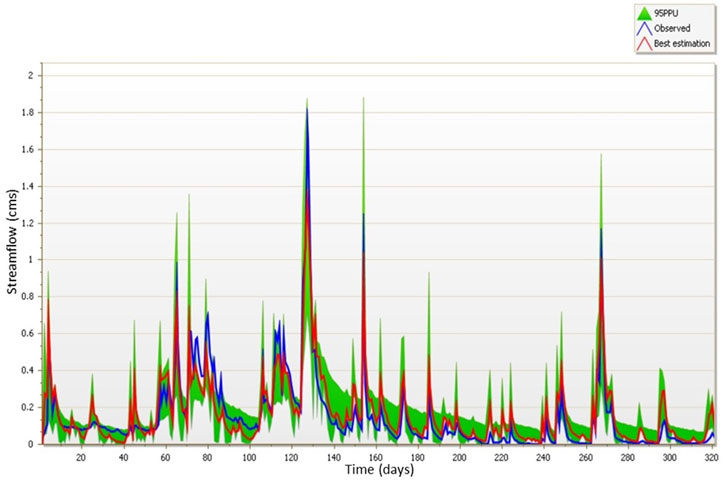
FIGURE 5. Observed (blue) and best simulated (red) daily flow series and the 95% prediction uncertainty envelope (95PPU) (green) at the main outlet of Zhurucay Ecohydrological Observatory from a SWAT simulation with saturation excess runoff.
4 Discussion
Our results show that a soil-based SWAT model with an improved simulation of saturation excess overland flow and a detailed representation of the soil’s physical properties is suitable for representing rainfall-runoff processes at the daily time scale in the neotropical alpine catchment. Controlling surface runoff generation according to the terrain slope was critical to enabling SWAT to generate surface runoff as saturation excess overland flow. In addition, constraining the soil-related model parameters based on field measurements reduced model uncertainties. Hydrological signatures such as FDCs and the analysis of the water balance components were reliable criteria for model evaluation. Finally, our findings highlighted how SWAT applications, which by default assume surface runoff is driven by infiltration excess, may lead to inaccurate hydrological assessments in paramo catchments.
4.1 Streamflow simulation
The similarity between observed and simulated hydrographs has been commonly used to evaluate the performance of hydrological models. However, this simple approach may lead to inadequate optimization of hydrological models when simulating tropical alpine catchments. This inadequacy is demonstrated by the results of the SWAT with infiltration excess runoff. The analysis of FDCs and the distribution of the runoff components (surface runoff and lateral flow) showed that SWAT with infiltration excess runoff misrepresented the generation of low flows despite a satisfactory fitting of simulated and observed daily hydrographs. Improvement in the streamflow simulation was slightly visible by comparing simulated and observed hydrographs.
The differences between the hydrographs of our two modeling approaches, SWAT with infiltration excess and SWAT with saturation excess runoff, were minimal but more pronounced than in other studies. For example, in the studies conducted by Steenhuis et al. (2019) and (Hoang et al., 2017), the simulated hydrographs from SWAT 2012 (default) and SWAT-wil and SWAT-HS (models that simulate saturation excess runoff) were virtually identical. However, differences within these modeling approaches were only visible in the distribution of the runoff components. Similarly, the differences among several SWAT calibration approaches tested by Fernandez-Palomino et al. (2021) were invisible in the simulated hydrographs but identifiable through the evaluation of FDCs. Therefore, it can be said that exclusively considering the similarity between observed and simulated hydrographs is an insufficient criterion to validate hydrological modeling outcomes in paramo catchments.
4.2 Model performance
Our findings reinforce that using statistical metrics to quantify the similarity between observed and simulated discharge cannot guarantee the reliability of hydrological simulations in paramo catchments. Interestingly, the performance of the SWAT model with the default infiltration excess runoff approach was comparable to other studies in paramo micro catchments and larger Andean watersheds. The highest NSE value (0.8) with the infiltration excess approach found in the current study was comparable to the results of the saturation excess approach, such as the TOPMODEL (NSE = 0.89) (Buytaert and Beven, 2011) and HBV-light (NSE = 0.83) (Sucozhañay and Célleri, 2018). Studies that applied SWAT in large Andean watersheds, which reported NSE values ranged between 0.53 and 0.7 (Yacoub and Foguet, 2012; Espinosa and Rivera, 2016; Hasan and Wyseure, 2018), qualified the modeling outcomes as reliable based on recommended statistical performance measures (Moriasi et al., 2007). However, further analyses of FDCs showed that the infiltration excess method misrepresented paramos’ hydrological behavior, suggesting that streamflow calibration is insufficient to replicate hydrological processes in Andean Paramo catchments, requiring additional graphical and statistical performance metrics, as recommended by Moriasi et al. (2007).
4.3 Flow duration curves
FDCs proved to be an effective measure to evaluate the suitability of the SWAT model for simulating Andean Paramo catchments. Limitations of the SWAT with infiltration excess approach for simulating low flows were evident in the analysis of FDCs. In the same way, FDCs showed that forcing surface runoff driven by saturation excess improved the overall streamflow simulation, especially for low-flow regimes. The FDC from the SWAT with saturation excess runoff differed from the observed FDC at the lower end of the curve only. This behavior was similar to results from Hoang et al. (2017), who compared simulated FDCs from SWAT 2012 and a modified SWAT (SWAT-HS) that simulated saturation excess surface runoff. These studies suggest that the SWAT model may be limited in reproducing low flows in mountainous catchments where saturation excess surface runoff is dominant concerning infiltration excess. However, the performance issue is not limited to SWAT. Other studies that applied the TOPMODEL (Buytaert and Beven, 2011) and HBV-light model (Sucozhañay and Célleri, 2018) in small paramo catchments have reported the same issue, despite a satisfactory model performance. These findings imply that hydrological models can reasonably represent the total runoff of paramos. Still, properly representing the low-flow regime remains a challenge that requires further investigation.
4.4 Limitations
The application of our soil-based SWAT model is limited to daily streamflow dynamics, the distribution of the water balance components, and the partition of the total runoff into the surface and lateral flow. Using a soil-based SWAT model is limited for explaining the cause-effect relationships that control the generation of low flows in Andean Paramo catchments but may support hypotheses that contribute to understanding these cause-effect relationships. For example, in the SWAT model, rainfall water that flows out from each modeling unit (Hydrological Response Unit) is aggregated at the subbasin level, routed through a tributary, and finally routed from the head of the main channel to the main outlet. However, in the paramos, rainfall water rapidly infiltrates through the soils in the hillslopes (which remain unsaturated) and flows laterally towards the valley bottoms near riparian areas. In these areas, soil water in the saturated soil is pushed towards the streambanks by a piston flow mechanism. This study’s soil-based approach of simulating excess saturation flow replicates these processes conceptually. Still, it is not a physically-based simulation of excess saturation flow.
Due to limited daily weather data availability, the SWAT model was calibrated for only 1 year and then validated for another year with a 3-year warm-up simulation prior to the calibration period. Remote-sensed global reanalysis products such as the Climate Prediction Center morphing method (CMORPH; Joyce et al., 2004), Tropical Rainfall Measuring Mission (TRMM; Huffman et al., 2007), or Precipitation Estimation from Remotely Sensed Information using Artificial Neural Networks (PERSIANN; Sorooshian et al., 2000) can be used to extend historical rainfall period for extended model simulation with sufficient spatial and temporal scales. However, these reanalysis rainfall products are less accurate in high-elevation mountainous areas (Han et al., 2023), thus needing to be tested for application in the Tropical Andes. This is beyond the scope of the current work, but the model evaluation can be extended in future work using global reanalysis products.
5 Conclusion
The SWAT model exhibited reliable performance in simulating the catchment hydrology of neotropical alpine grasslands, also called paramos. With saturation excess overland flow and detailed characteristics of the hydro-physical properties of Andean soils, SWAT reasonably simulated high and low flows and their cumulative occurrences. Although SWAT showed limitations for simulating extremely low flows (below 1 L·s−1·km-2), the soil-based modeling approach satisfactorily simulated streamflow, local water balances, and the distribution of total runoff between surface runoff and lateral flow. Our findings reinforce that an evaluation of hydrological models, when applied in Andean catchments, must consider the analysis of hydrological signatures (such as FDCs) in addition to commonly used graphical and statistical performance metrics. Finally, this study showed that assuming infiltration excess runoff as the dominant runoff process in Andean paramo catchments can generate inadequate hydrological modeling outcomes. Given the characteristics of SWAT and the reasonability of our findings, our soil-based SWAT model can be applied to other paramo catchments to explore short- and long-term hydrological impacts due to land use and climate change, which is currently a main concern in the Andean region.
Representing these highly complex grassland-dominated ecosystems in the high Andes, or so-called paramos, still constitutes a challenging hydrological modeling exercise that demands observational data with high spatio-temporal resolution and a clear understanding of the governing hydrological processes. Even though the availability of detailed soil data and the dense network of rain and streamflow gauges allowed us to represent the properties of the soil, capture the rainfall distribution across the catchment, and adequately set and calibrate the model, it was the large body of literature generated through the observatory that allowed us to evaluate and interpret the modeling outcomes. Given the importance of tropical alpine catchments in providing freshwater and ecosystem services, our study highlights the necessity of replicating initiatives such as the Zhurucay Ecohydrological Observatory.
Data availability statement
The original contributions presented in the study are included in the article/Supplementary material, further inquiries can be directed to the corresponding author.
Author contributions
FJ-P: Conceptualization, Formal Analysis, Investigation, Methodology, Visualization, Writing–original draft, Writing–review and editing. JJ: Conceptualization, Project administration, Supervision, Writing–review and editing. RC: Data curation, Writing–review and editing. PC: Data curation, Writing–review and editing. CM: Conceptualization, Supervision, Writing–review and editing.
Funding
The author(s) declare financial support was received for the research, authorship, and/or publication of this article. While preparing this manuscript, FJ-P was supported by SENESCYT and Texas A&M AgriLife Research. JJ was funded by Korea University grant K2319801. RC was supported by the project “A research network for the resilience of headwater systems and water availability for downstream communities across the Americas”, funded by the Vice-rectorate for Research of the University of Cuenca.
Acknowledgments
We kindly acknowledge the staff of Departamento de Recursos Hídricos y Ciencias Ambientales of the Universidad de Cuenca for providing the data for this study. The statements made in this manuscript reflect the authors' views and do not necessarily reflect the views of the funding agencies.
Conflict of interest
Author FJ-P was employed by the company Scheibe Consulting LLC.
The remaining authors declare that the research was conducted in the absence of any commercial or financial relationships that could be construed as a potential conflict of interest.
Publisher’s note
All claims expressed in this article are solely those of the authors and do not necessarily represent those of their affiliated organizations, or those of the publisher, the editors and the reviewers. Any product that may be evaluated in this article, or claim that may be made by its manufacturer, is not guaranteed or endorsed by the publisher.
References
Abbaspour, K. (2011). User manual for SWAT-CUP: SWAT calibration and uncertainty analysis programs. Eawag Swiss Fed. Inst. Aquat. Sci. Technol., 103.
Abbaspour, K. C., Johnson, C., and Van Genuchten, M. T. (2004). Estimating uncertain flow and transport parameters using a sequential uncertainty fitting procedure. Vadose Zone J. 3 (4), 1340–1352. doi:10.2113/3.4.1340
Alemayehu, T., Griensven, A. v., Woldegiorgis, B. T., and Bauwens, W. (2017). An improved SWAT vegetation growth module and its evaluation for four tropical ecosystems. Hydrology Earth Syst. Sci. 21 (9), 4449–4467. doi:10.5194/hess-21-4449-2017
Arnold, J. G., Srinivasan, R., Muttiah, R. S., and Williams, J. R. (1998). Large area hydrologic modeling and assessment part I: model development. JAWRA J. Am. Water Resour. Assoc. 34 (1), 73–89. doi:10.1111/j.1752-1688.1998.tb05961.x
Aucapiña, G., and Marín, F. (2014). Efectos de la Posición Fisiográfica en las Propiedades Hidrofísicas de los Suelos de Páramo de la Microcuenca del río Zhurucay. Ecuador: Universidad de Cuenca: Cuenca.
Buytaert, W., and Beven, K. (2011). Models as multiple working hypotheses: hydrological simulation of tropical alpine wetlands. Hydrol. Process. 25 (11), 1784–1799. doi:10.1002/hyp.7936
Buytaert, W., Bievre, B. D., and Iniguez, V. (2007). The effects of afforestation and cultivation on water yield in the Andean páramo. For. Ecol. Manag. 251 (1-2), 22–30. doi:10.1016/j.foreco.2007.06.035
Buytaert, W., De Bievre, B., Wyseure, G., and Deckers, J. (2004). The use of the linear reservoir concept to quantify the impact of changes in land use on the hydrology of catchments in the Andes. Hydrology Earth Syst. Sci. 8 (1), 108–114. doi:10.5194/hess-8-108-2004
Buytaert, W., Deckers, J., and Wyseure, G. (2006). Description and classification of nonallophanic Andosols in south Ecuadorian alpine grasslands (páramo). Geomorphology 73, 207–221. doi:10.1016/j.geomorph.2005.06.012
Buytaert, W., Wyseure, G., Bièvre, B. D., and Deckers, J. (2005). The effect of land-use changes on the hydrological behaviour of Histic Andosols in south Ecuador. Hydrol. Process. 19 (20), 3985–3997. doi:10.1002/hyp.5867
Cordova, M., Carrillo-Rojas, G., Crespo, P., Wilcox, B., and Celleri, R. (2015). Evaluation of the penman-monteith (FAO 56 PM) method for calculating reference evapotranspiration using limited data. Mt. Res. Dev. 35 (3), 230–239. doi:10.1659/mrd-journal-d-14-0024.1
Correa, A., Breuer, L., Crespo, P., Célleri, R., Feyen, J., Birkel, C., et al. (2019). Spatially distributed hydro-chemical data with temporally high-resolution is needed to adequately assess the hydrological functioning of headwater catchments. Sci. Total Environ. 651, 1613–1626. doi:10.1016/j.scitotenv.2018.09.189
Correa, A., Ochoa-Tocachi, B. F., Birkel, C., Ochoa-Sánchez, A., Zogheib, C., Tovar, C., et al. (2020). A concerted research effort to advance the hydrological understanding of tropical páramos. Hydrol. Process. 34, 4609–4627. doi:10.1002/hyp.13904
Correa, A., Windhorst, D., Crespo, P., Célleri, R., Feyen, J., and Breuer, L. (2016). Continuous versus event-based sampling: how many samples are required for deriving general hydrological understanding on Ecuador's páramo region? Hydrol. Process. 30 (22), 4059–4073. doi:10.1002/hyp.10975
Correa, A., Windhorst, D., Tetzlaff, D., Crespo, P., Célleri, R., Feyen, J., et al. (2017a). Temporal dynamics in dominant runoff sources and flow paths in the Andean Páramo. Water Resources Research 53(7) 5998–6017.
Correa, A., Windhorst, D., Tetzlaff, D., Silva, C., Crespo, P., Celleri, R., et al. (2017b). Runoff sources and flow paths dynamics in the Andean Páramo.
Crespo, P., Feyen, J., Buytaert, W., Bucker, A., Breuer, L., Frede, H. G., et al. (2011). Identifying controls of the rainfall-runoff response of small catchments in the tropical Andes (Ecuador). J. Hydrology 407 (1-4), 164–174. doi:10.1016/j.jhydrol.2011.07.021
Crespo, P., Feyen, J., Buytaert, W., Célleri, R., Frede, H.-G., Ramírez, M., et al. (2012). Development of a conceptual model of the hydrologic response of tropical Andean micro-catchments in Southern Ecuador. Hydrology Earth Syst. Sci. Discuss. 9 (2), 2475–2510. doi:10.5194/hessd-9-2475-2012
Espinosa, J., and Rivera, D. (2016). Variations in water resources availability at the Ecuadorian páramo due to land-use changes. Environ. Earth Sci. 75 (16), 1173–1215. doi:10.1007/s12665-016-5962-1
Fernandez-Palomino, C. A., Hattermann, F. F., Krysanova, V., Vega-Jácome, F., and Bronstert, A. (2021). Towards a more consistent eco-hydrological modelling through multi-objective calibration: a case study in the Andean Vilcanota River basin, Peru. Hydrological Sci. J. 66 (1), 59–74. doi:10.1080/02626667.2020.1846740
Gupta, H. V., Sorooshian, S., and Yapo, P. O. (1999). Status of automatic calibration for hydrologic models: comparison with multilevel expert calibration. J. Hydrologic Eng. 4 (2), 135–143. doi:10.1061/(asce)1084-0699(1999)4:2(135)
Han, H., Abitew, T. A., Park, S., Green, C. H. M., and Jeong, J. (2023). Spatiotemporal evaluation of satellite-based precipitation products in the Colorado river basin. J. Hydrometeorol. 24, 1739–1754. doi:10.1175/jhm-d-23-0003.1
Hasan, M. M., and Wyseure, G. (2018). Impact of climate change on hydropower generation in Rio Jubones Basin, Ecuador. Water Sci. Eng. 11 (2), 157–166. doi:10.1016/j.wse.2018.07.002
Hoang, L., Schneiderman, E. M., Moore, K. E., Mukundan, R., Owens, E. M., and Steenhuis, T. S. (2017). Predicting saturation-excess runoff distribution with a lumped hillslope model: SWAT-HS. Hydrol. Process. 31 (12), 2226–2243. doi:10.1002/hyp.11179
Huffman, G. J., Bolvin, D. T., Nelkin, E. J., Wolff, D. B., Adler, R. F., Gu, G., et al. (2007). The TRMM multisatellite precipitation analysis (TMPA): quasi-global, multiyear, combined-sensor precipitation estimates at fine scales. J. Hydrometeorol. 8, 38–55. doi:10.1175/jhm560.1
Iñiguez, V., Morales, O., Cisneros, F., Bauwens, W., and Wyseure, G. (2015). Analysis of the drought resilience of Andosols on southern Ecuadorian Andean páramos. Hydrology Earth Syst. Sci. Discuss. 12 (11), 11449. doi:10.5194/hessd-12-11449-2015
IUSSWorkingGroup (2015). “WRB. 2015. World Reference Base for Soil Resources 2014, update 2015. International soil classification system for naming soils and creating legends for soil maps,” in World soil Resources reports No. 106 (Rome: FAO).
Joyce, R. J., Janowiak, J. E., Arkin, P. A., and Xie, P. (2004). CMORPH: a method that produces global precipitation estimates from passive microwave and infrared data at high spatial and temporal resolution. J. Hydrometeorol. 5, 487–503. doi:10.1175/1525-7541(2004)005<0487:camtpg>2.0.co;2
Kirchner, J. W. (2006). Getting the right answers for the right reasons: linking measurements, analyses, and models to advance the science of hydrology. Water Resour. Res. 42 (3). doi:10.1029/2005wr004362
Krajenbrink, H. J. (2007). Application of SWAT for rainfall-runoff modelling in small tropical mountainous catchments in Ecuador. Doctoral dissertation, MSc Thesis. Netherlands: Wageningen University.
Larabi, S., St-Hilaire, A., Chebana, F., and Latraverse, M. (2018). Using functional data analysis to calibrate and evaluate hydrological model performance. J. Hydrologic Eng. 23 (7), 04018026. doi:10.1061/(asce)he.1943-5584.0001669
Lazo, P. X., Mosquera, G. M., McDonnell, J. J., and Crespo, P. (2019). The role of vegetation, soils, and precipitation on water storage and hydrological services in Andean Páramo catchments. J. Hydrology 572, 805–819. doi:10.1016/j.jhydrol.2019.03.050
Liu, B. M., Collick, A. S., Zeleke, G., Adgo, E., Easton, Z. M., and Steenhuis, T. S. (2008). Rainfall-discharge relationships for a monsoonal climate in the Ethiopian highlands. Hydrological Process. Int. J. 22 (7), 1059–1067. doi:10.1002/hyp.7022
Moges, M. A., Schmitter, P., Tilahun, S. A., Langan, S., Dagnew, D. C., Akale, A. T., et al. (2017). Suitability of watershed models to predict distributed hydrologic response in the awramba watershed in lake Tana basin. Land Degrad. Dev. 28 (4), 1386–1397. doi:10.1002/ldr.2608
Moriasi, D. N., Arnold, J. G., Van Liew, M. W., Bingner, R. L., Harmel, R. D., and Veith, T. L. (2007). Model evaluation guidelines for systematic quantification of accuracy in watershed simulations. Trans. ASABE 50 (3), 885–900. doi:10.13031/2013.23153
Mosquera, G. M., Célleri, R., Lazo, P. X., Vaché, K. B., Perakis, S. S., and Crespo, P. (2016a). Combined use of isotopic and hydrometric data to conceptualize ecohydrological processes in a high-elevation tropical ecosystem. Hydrol. Process. 30 (17), 2930–2947. doi:10.1002/hyp.10927
Mosquera, G. M., Lazo, P. X., Célleri, R., Wilcox, B. P., and Crespo, P. (2015). Runoff from tropical alpine grasslands increases with areal extent of wetlands. Catena 125, 120–128. doi:10.1016/j.catena.2014.10.010
Mosquera, G. M., Segura, C., Vaché, K. B., Windhorst, D., Breuer, L., and Crespo, P. (2016b). Insights into the water mean transit time in a high-elevation tropical ecosystem. Hydrology Earth Syst. Sci. 20 (7), 2987–3004. doi:10.5194/hess-20-2987-2016
Nash, J. E., and Sutcliffe, J. V. (1970). River flow forecasting through conceptual models part I—a discussion of principles. J. Hydrology 10 (3), 282–290. doi:10.1016/0022-1694(70)90255-6
Neitsch, S., Arnold, J., Kiniry, J., Williams, J., and King, K. (2002). SWAT manual. TX: US Department of Agriculture, Agricultural Research Service and Blackland Research Center Texas A&M University.
Neitsch, S. L., Arnold, J. G., Kiniry, J. R., and Williams, J. R. (2011). “Soil and water assessment tool theoretical documentation version 2009,” in Texas Water Resources Institute. Report No.: 406. College Station, TX: Texas A&M University System.
Padrón, R. S., Wilcox, B. P., Crespo, P., and Célleri, R. (2015). Rainfall in the Andean Páramo: new insights from high-resolution monitoring in Southern Ecuador. J. Hydrometeorol. 16 (3), 985–996. doi:10.1175/jhm-d-14-0135.1
Plesca, I., Timbe, E., Exbrayat, J. F., Windhorst, D., Kraft, P., Crespo, P., et al. (2012). Model intercomparison to explore catchment functioning: results from a remote montane tropical rainforest. Ecol. Model. 239, 3–13. doi:10.1016/j.ecolmodel.2011.05.005
Poyck, S., de Rooij, G., Uijlenhoet, R., de Bièvre, B., and Buytaert, W. (2006). Closing the waterbalance for a hillslope plot in the Ecuadorian páramo, 2. Enschede: at the University of Twente.
Pratt, W., Figueroa, J., and Flores, B. (1997). Geology and mineralization of the area between 3 and 48S, western cordillera, Ecuador. in Open File Report, WCr97r28, British Geological Survey. Ecuador. Publicación digital en la página web del Missouri Botanical Garden (USA).
Quichimbo, P., Tenorio, G., Borja, P., Cárdenas, I., Crespo, P., and Célleri, R. (2012). Efectos sobre las propiedades físicas y químicas de los suelos por el cambio de la cobertura vegetal y uso del suelo: páramo de Quimsacocha al sur del Ecuador. Suelos Ecuat. 42 (2), 138–153.
Quintero, M., Uribe, N., and Valencia, J. (2013). Estimated calibration parameters in swat model for andean watersheds. in Proceedings of the 2013 international SWAT conference.
Quintero, M., Wunder, S., and Estrada, R. D. (2009). For services rendered? Modeling hydrology and livelihoods in Andean payments for environmental services schemes. For. Ecol. Manag. 258 (9), 1871–1880. doi:10.1016/j.foreco.2009.04.032
Ramsay, P., and Oxley, E. (1997). The growth form composition of plant communities in the Ecuadorian páramos. Plant Ecol. 131 (2), 173–192. doi:10.1023/a:1009796224479
Sklenář, P., and Jørgensen, P. (1999). Distribution patterns of páramo plants in Ecuador. J. Biogeogr. 26 (4), 681–691. doi:10.1046/j.1365-2699.1999.00324.x
Sorooshian, S., Hsu, K. L., Gao, X., Gupta, H. V., Imam, B., and Braithwaite, D. (2000). Evaluation of PERSIANN system satellite-based estimates of tropical rainfall. Bull. Am. Meteorol. Soc. 81, 2035–2046. doi:10.1175/1520-0477(2000)081<2035:eopsse>2.3.co;2
Steenhuis, T. S., Schneiderman, E. M., Mukundan, R., Hoang, L., Moges, M., and Owens, E. M. (2019). Revisiting SWAT as a saturation-excess runoff model. Water 11 (7), 1427. doi:10.3390/w11071427
Sucozhañay, A., and Célleri, R. (2018). Impact of rain gauges distribution on the runoff simulation of a small mountain catchment in Southern Ecuador. Water 10 (9), 1169. doi:10.3390/w10091169
Triana, J. S. A., Chu, M. L., Guzman, J. A., Moriasi, D. N., and Steiner, J. L. (2019). Beyond model metrics: the perils of calibrating hydrologic models. J. Hydrology 578, 124032. doi:10.1016/j.jhydrol.2019.124032
Uribe, N., Quintero, M., and Valencia, J. (2013). Aplicación del Modelo Hidrológico SWAT (Soil and Water Assessment Tool) a la Cuenca del Río Cañete (SWAT). Technical Report.
Valencia, S., Salazar, J. F., Villegas, J. C., Hoyos, N., and Duque-Villegas, M. (2021). SWAT-Tb with improved LAI representation in the tropics highlights the role of forests in watershed regulation. Earth Space Sci. Open Archive ESSOAr. doi:10.1002/essoar.10506110.1
Vuille, M., Bradley, R. S., and Keimig, F. (2000). Climate variability in the Andes of Ecuador and its relation to tropical Pacific and Atlantic sea surface temperature anomalies. J. Clim. 13 (14), 2520–2535. doi:10.1175/1520-0442(2000)013<2520:cvitao>2.0.co;2
Keywords: paramos, saturation-excess flow, SWAT, soil hydro-physical properties, runoff partitioning
Citation: Jarrin-Perez F, Jeong J, Célleri R, Crespo P and Munster C (2024) Hydrologic simulation of a neotropical alpine catchment influenced by conductive topsoils in the Ecuadorian Andes. Front. Environ. Sci. 12:1303388. doi: 10.3389/fenvs.2024.1303388
Received: 27 September 2023; Accepted: 26 January 2024;
Published: 13 February 2024.
Edited by:
Zhihao Xu, Guangdong University of Technology, ChinaReviewed by:
Junyu Qi, University of Maryland, United StatesKritika Kothari, Indian Institute of Technology Roorkee, India
Hsi-Kai Chou, Cardiff University, United Kingdom
Copyright © 2024 Jarrin-Perez, Jeong, Célleri, Crespo and Munster. This is an open-access article distributed under the terms of the Creative Commons Attribution License (CC BY). The use, distribution or reproduction in other forums is permitted, provided the original author(s) and the copyright owner(s) are credited and that the original publication in this journal is cited, in accordance with accepted academic practice. No use, distribution or reproduction is permitted which does not comply with these terms.
*Correspondence: Jaehak Jeong, amVvbmdqQHRhbXUuZWR1