 Wanlu Xia
 Wen Zhang
 Sen Wu
94% of researchers rate our articles as excellent or good
Learn more about the work of our research integrity team to safeguard the quality of each article we publish.
Find out more
BRIEF RESEARCH REPORT article
Front. Environ. Sci., 20 February 2024
Sec. Environmental Informatics and Remote Sensing
Volume 12 - 2024 | https://doi.org/10.3389/fenvs.2024.1298327
This article is part of the Research TopicAdvances and Applications of Artificial Intelligence and Numerical Simulation in Risk Emergency Management and Treatment, volume IIView all 13 articles
Jiajin Mountain, where the giant pandas reside, is an essential nature reserve in China. To comprehend the land use classification of the habitat, this article proposes a remote sensing interpretation algorithm based on spatial case reasoning, known as spatial case-based reasoning (SCBR). The algorithm incorporates specific spatial factors into its framework and does not require an extensive amount of domain knowledge and eliminates the need for a complex model training process, making it capable of completing land use classification in the study area. SCBR comprises a spatial case expression model and a spatial case similarity reasoning model. The paper conducted comparative experiments between the proposed algorithm and support vector machine (SVM), U-Net, vision transformer (ViT), and Trans-Unet, and the results demonstrate that spatial case-based reasoning produces superior classification outcomes. The land use classification experiment based on spatial case-based reasoning at the Jiajinshan giant panda habitat produced satisfactory experimental results. In the comparative experiments, the overall accuracy of SCBR classification reached 95%, and the Kappa coefficient reached 90%. The paper further analyzed the changes in land use classification from 2018 to 2022, and the average accuracy consistently exceeds 80%. We discovered that the ecological environment in the region where the giant pandas reside has experienced significant improvement, particularly in forest protection and restoration. This study provides a theoretical basis for the ecological environment protection of the area.
As one of China’s nature reserves, the Jiajinshan Giant Panda Reserve is an important part of China’s giant panda habitat network. It is also a World Heritage Site, a national-level nature reserve, a national key scenic area, and a key biodiversity area. The Chinese government attaches great importance to the conservation of ecological resources in the Jiajinshan giant panda habitat. It has already implemented a series of policies, such as establishing national-level nature reserves; strengthening, monitoring, and management of the habitat; and controlling environmental damages caused by human activities. Land use classification refers to the classification, division, and statistics of land within a certain area to understand the types, distribution, and area of land use in that region, which provides important information about land use types, distribution, and area. It also provides basic data support for rational land resource utilization, environmental protection, and sustainable development. It has important scientific and practical value (Xu et al., 2022; Zhang et al., 2022). Therefore, conducting land use classification for the Jiajinshan giant panda habitat is crucial for its scientific protection and sustainable development.
At present, land use classification based on remote sensing imagery is a commonly used method (Castelluccio et al., 2017). In particular, it involves a process of using satellite or aerial image data obtained using remote sensing technology to classify and identify land cover through digital image processing and classification algorithms. Common classification methods include supervised classification (Shi et al., 2012; Rwanga and Ndambuki, 2017), unsupervised classification (Riese et al., 2019; Zhang et al., 2021), and semi-supervised classification (Dalsasso et al., 2021; Xia et al., 2022). Among these, supervised classification in the field of land use classification of remote sensing images has always been an active research area. Its development trajectory has gradually transitioned from traditional methods to machine learning, and then to deep learning, while emphasizing technological innovations such as multisource data fusion and semi-supervised learning. In traditional methods, land use classification mainly relied on manually designed features, such as texture, color, and shape. The classification methods used included minimum distance classification (Haapanen et al., 2004), support vector machine (SVM; Ustuner et al., 2015), and decision trees (Pham et al., 2022). These methods achieved success to a certain extent, but the classification performance for complex land cover categories and high-dimensional data was relatively poor. With the rise of machine learning, artificial intelligence methods have gradually replaced traditional methods. Significant achievements have been made in land use classification using structures such as convolutional neural networks (CNN; Liu et al., 2022) and transformers (Kaselimi et al., 2022). Simultaneously, various improved deep learning architectures, such as U-Net (Wang et al., 2022) and ResNet (Wang et al., 2023), have emerged to address different land use classification problems. These network structures perform well in handling different scales and complexities of land cover categories. However, machine learning-based methods have obvious drawbacks, such as requiring extensive training based on a large number of annotated samples for an extended period and being prone to overfitting. This makes AI-based methods still have considerable room for improvement. Table 1 lists the strengths and weaknesses of some recent algorithms.

TABLE 1. Advantages and disadvantages of various algorithms for remote sensing land use classification.
Case-based reasoning (CBR) (Schank and Abelson, 1977; Aamodt and Plaza, 1994), as an artificial intelligence method for solving complex problems, has been widely researched and applied. Its basic idea can be summarized as follows: for the given case (or new problems), CBR can search for similar cases in a historical case bank and reuse the solutions of those similar cases in the given case. If the solution through direct reuse is deemed impractical, modifications to the case solution are made based on domain knowledge or alternative approaches, resulting in the ultimate resolution. Furthermore, the typical cases with direct or revised solutions are added to the case bank to expand its contents. CBR does not require precise domain models but rather uses historical case knowledge to deduce solutions for new cases. It has significant advantages in solving complex and uncertain problems, especially in domains where specialized knowledge is abstract and difficult to generalize and express.
In recent years, CBR has been widely researched and applied in various fields, such as environmental science (Bajo et al., 2010; Lee et al., 2014; Mounce et al., 2016; Caro et al., 2017), urban development (Li and Liu, 2006; Liu et al., 2014; Yu and Li, 2018), land use (Shi and Zhu, 2004; Du et al., 2010), geological engineering (Fyson and Toll, 2008; Dou et al., 2015), mineral resource evaluation (Chen et al., 2010), oil and gas engineering (Skalle and Aamodt, 2004; Popa and Wood, 2011; Shokouhi et al., 2014; Mazhari et al., 2018), and oil and gas resource evaluation (Chen et al., 2010; Chen et al., 2014), and has achieved good results. However, from the current research, there are still relatively few attempts to use CBR for land use classification. In the aforementioned studies, the reasoning models mainly employs the classical attribute similarity reasoning, with less emphasis on spatial similarity reasoning based on spatial features. The few studies that have explored spatial similarity reasoning are focused on specific domain problems. While spatial features of different research objects vary from different domains to problems, and because of the different features, the spatial similarity reasoning methods tend to be different. Therefore, for land-use classification, in addition to the attribute features, it is meaningful to explore the spatial features and construct corresponding integrated reasoning models to enhance the effectiveness and accuracy of land use classification in the Jiajinshan giant panda habitat.
Therefore, this paper proposes a land use remote sensing interpretation algorithm based on spatial case-based reasoning (S-CBR). In particular, it comprises the construction of a spatial case expression model and a spatial case similarity reasoning model. Based on this, comparative experiments were conducted with ablative analysis and land use classification experiments in the Jiajinshan giant panda habitat. Further discussions analyze the changes in land use classification from 2018 to 2022 over a 5-year period. This provides decision support for relevant departments in protection planning, rational resource utilization, monitoring of land use changes, and even scientific research and education in the region.
The remaining structure of the article is as follows: Section 2 provides a detailed introduction to the study area; Section 3 elaborates on the proposed spatial case reasoning algorithm; Section 4 expounds on the experimental results of the algorithm and related discussions; and Section 5 provides the conclusion of this paper.
The Jiajinshan giant panda habitat is located in the Jiajin Mountain region at the junction of Wenchuan County, Li County, and Songpan County in Aba Tibetan and Qiang Autonomous Prefecture, Sichuan Province, China (Figure 1). It includes the Jiajinshan Nature Reserve, Shapinggou Nature Reserve in Barkam County, Ma’anshan Nature Reserve in Xiaojin County, and Baishuigou Nature Reserve in Wenchuan County. It has an alpine sub-frigid humid climate, with an annual average temperature ranging from −2°C to 12°C. The region receives abundant rainfall, with an annual precipitation of approximately 800–1,200 mm, mainly concentrated from May to October. Due to high altitude, the climate in the Jiajinshan giant panda habitat changes dramatically, with large temperature differences between day and night, and the temperature at night can drop to below −20°C. The Jiajinshan giant panda habitat is located in the mountain area with complex terrain, numerous rivers, and a forest coverage rate of over 70%. The region has undulating topography, with mountain peaks over 3,000 m, and the highest peak exceeding 5,000 m. The area is crisscrossed by many rivers, including the Barkam River, Qingyi River, Songpan River, and Dadu River. These rivers have abundant water resources and are mostly tributaries of the Yangtze River. Due to its unique geographical location and climatic conditions, the Jiajinshan giant panda habitat possesses rich natural resources, including many rare wildlife and plants. Endangered species such as giant pandas, golden monkeys, and snow leopards live and reproduce here. Therefore, research on land classification in this area is of great significance to the protection of China’s ecological environment and biodiversity.
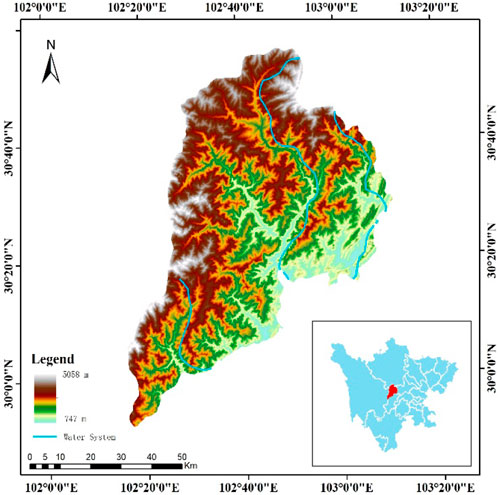
FIGURE 1. Topographic map and location of the study area.
In this paper, multi-sources and multi-temporal data were used as the basis for land use classification in the Jiajinshan giant panda habitat. All the data were obtained from Google Earth Engine and OpenStreetMap, more specifically, including Sentinel-2 satellite remote sensing data, MODIS normalized difference vegetation index (NDVI), MODIS NDWI time series data, digital elevation model (DEM) data, and hydrological and meteorological data. The specific data contents are given in Table 2.
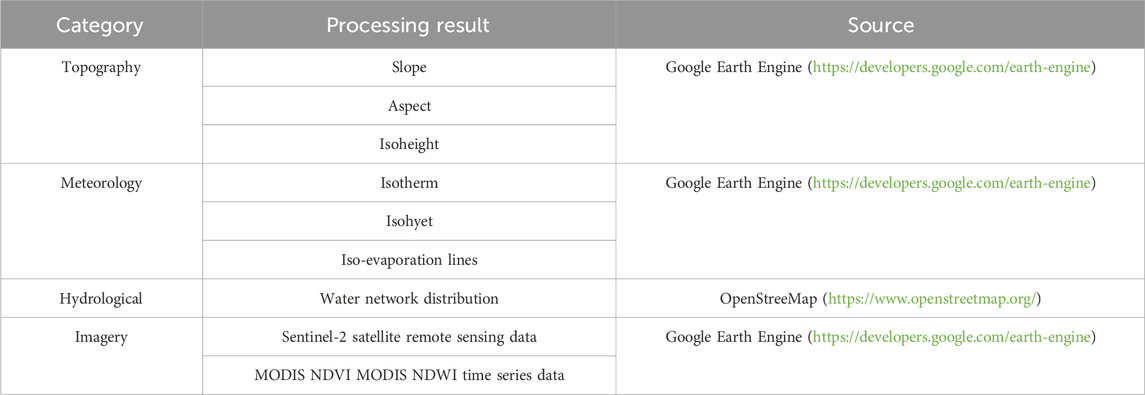
TABLE 2. Data types and their acquisition sources.
The multiple-source data have various formats, and usually, the resolution and coordinate systems are inconsistent, making them difficult to use directly. To accurately and correctly identify land use types, tools such as ArcMap and ENVI were used to process the raw data. For DEM, hydrological and meteorological data, basic elements such as slope, aspect, isoheight, distribution of water network, isotherm, isohyet, and isothyme, and other calculations were performed. Additionally, the size of the grid cells will greatly affect the calculation amount and precision of the model. Considering the calculation amount after dividing the cells and whether the attributes of the grid cells can effectively reflect the real features of the area and in combination with the available resolution of multi-source and multi-temporal data, the research proposed to use a regular grid cell at a size of 30 m × 30 m as the minimum unit for land use classification, regarding each cell as homogeneity.
In case reasoning, each grid cell represents a case, where cases with known land use categories are called known cases, and cases that are unknown and awaiting classification are called unknown cases. Unlike traditional case reasoning, which only uses attribute features to construct case expression models, the proposed spatial case reasoning model in this paper adopts an integrated approach that incorporates attribute features, spatial features, and auxiliary features in the construction of spatial case expression models.
Attribute features are extracted from multiple data sources, including topography and imagery data. The Sentinel-2 satellite imagery comprises 13 bands ranging from 440 nm to 2,090 nm. The spectral information can reflect land cover types and biological growth from different perspectives, providing an important basis for land use classification. MODIS NDVI data contain NDVI values for each grid cell during 23 periods within a year. They directly reflect the changes in surface vegetation and water resources during different periods of the year, making a strong factor for identifying land use types. Additionally, factors such as temperature, precipitation, evaporation, slope, and aspect indirectly affect land cover, local climate, and biological distribution, and thus, they are also essential reference factors for land classification. In summary, each case in the study comprises 19 factors, including Sentinel-2 spectral imagery, MODIS NDVI, temperature, precipitation, evaporation, slope, and aspect as its attribute features.
Spatial features are derived from topographic data, meteorological data, and hydrological data. After fully considering the spatial features of various land types, spatial metric relationships were selected as spatial features.
Spatial metric relationships quantify the distance between two geographic units. First, isolines with appropriate intervals are obtained for the four basic data of elevation, temperature, precipitation, and evaporation. For any grid cell within the study area, the distances from the center of each grid cell to the isolines of elevation, temperature, precipitation, evaporation, and the distance to the water network are calculated as the spatial metric relationship features of the case.
Auxiliary features are designed to supplement case features and enrich the feature factors of case features. Auxiliary features are further derived from attribute features or spatial features, and often have special meanings for case features, so they are not repetitions of the aforementioned features. The auxiliary features in this study are obtained from MODIS NDVI time series data and consist of the peak area (S) and coupling value of the growth rate.
Generally, different land use types exhibit different MODIS NDVI time series curves, as shown in Figure 2A. The peak area (S) and coupling value of the growth rate are designed to reflect this feature. The peak area represents the area enclosed by the time curve and the x-axis, which is composed of trapezoids formed by discrete data, as shown in Figure 2B.
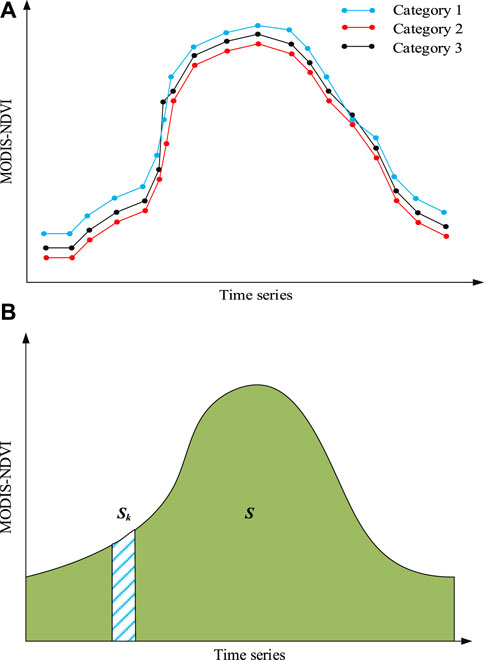
FIGURE 2. MODIS NDVI time series curve. (A) Different land use types tend to have different time series curves. (B) Different land use types tend to have different peak areas.
The formula is as follows:
In Eq. 1, S represents the peak area; n represents the number of time series; yk represents the NDVI value of the kth time series; and Δx represents the time interval, which is set as 1 in the study.
The coupling value of the growth rate is composed of the slope of the fitted curve during the growth phase of the MODIS NDVI time series curve and the maximum value of the fitted curve (Figure 3). This is because different land use types had different growth rates during the growth phase of the MODIS NDVI time series curve, and they also have different peak values (Figure 2A). The coupling value of the growth rate is calculated as follows:
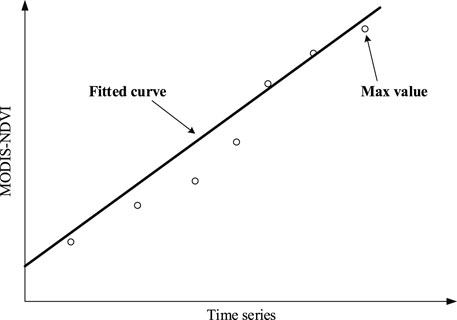
FIGURE 3. MODIS NDVI growth rate fitting curve. Different land use types tend to have different growth rate fitting curves.
In Eq. 2, β represents the slope of the fitted curve, which is obtained through the least squares method. maxNDVI represents the maximum value of the fitted curve.
In summary, the spatial case expression model can be expressed as follows:
In Eq. 3, ak represents the attribute feature value; k represents the number of basic parameters; dqm represents the distance value from the case to the mth isoline of the qth basic data; S represents the feature value of the peak area of the case; E represents the coupling value of growth rate feature value; and R represents the land use category of the case. For unknown cases, the value of R is left blank.
The spatial case similarity reasoning model consists of two parts: attribute similarity reasoning model and spatial similarity reasoning model.
The similarity reasoning formula of attribute features and auxiliary features is as follows:
In Eq. 4, i represents a feature item corresponding to an attribute feature; n represents the total number of attribute features; vih represents the ith attribute feature value of the known-layer case; viu represents the ith attribute feature value of the unknown case; wi represents the weight of the ith attribute feature; and Sa represents the attribute feature similarity between the known and unknown cases.
The similarity reasoning formula of spatial metric relationship is as follows:
In Eq. 5, j represents the index of spatial metric relationships; n represents the total number of items; djh represents the feature value of jth spatial metric relationship of the known case; dju represents the feature value of the jth spatial metric relation of the unknown case; wjx represents the weight of the corresponding metric relationship feature; and Sd represents the spatial metric relationship similarity value between the known and unknown cases.
The integrated reasoning formula of spatial similarity and attribute similarity is as follows:
In Eq. 6, Ws and Wa represent the weights of spatial similarity reasoning and attribute similarity reasoning, respectively. Ss and Sa represent the similarity values of spatial and attribute similarity, respectively. S represents the similarity of the integrated inference of spatial similarity and attributes similarity integrated reasoning.
In the context of spatial inference models for remote sensing image analysis, the quality of inference results needs to be measured using appropriate accuracy evaluation metrics. This paper adopts two accuracy evaluation metrics: accuracy, commonly referred to as accuracy or correctness, and evaluation metrics, such as recall, precision, and F-measure.
The accuracy or correctness metric is the most widely used accuracy evaluation measure. It is generally expressed as the ratio of the number of correctly classified samples to the total number of samples in the validation set, as shown in Eq. 7:
In the formula, c represents the number of correctly classified samples, n represents the total number of validation samples, and a represents accuracy.
The evaluation metrics of recall, precision, and F-measure are derived from the fields of machine learning and statistics. Compared to simple accuracy or correctness metrics, these indicators provide a more effective and detailed assessment of the results of model classification. For a specific class to be predicted, this class is referred to as the positive class, while the rest are considered negative classes. True positives (TPs) represent the number of samples in the validation set where the true class is positive and the predicted result is also positive. False positives (FPs) represent the number of samples in the validation set where the true class is negative, but the predicted result is positive. False negatives (FNs) represent the number of samples in the validation set where the true class is positive, but the predicted result is negative. True negatives (TNs) represent the number of samples in the validation set where the true class is negative, and the predicted class is also negative.
Thus, the calculation for recall is given by Eq. 8:
It calculates the proportion of all correctly classified samples to all samples that should have been predicted as positive class.
The calculation for precision is given by Eq. 9:
It calculates the proportion of all correctly classified samples to all samples predicted as positive class.
Precision and recall are interrelated; ideally, the higher both values are, the better the classification performance. However, in general, when precision is high, recall tends to be low and vice versa. If both are low, the classification performance is considered poor. Therefore, when both high precision and high recall are desired, the F-measure metric can be used to measure the trade-off between them. Its calculation is shown in Eq. 10:
In the formula, P represents the precision value, R represents the recall value, and when the parameter α = 1, F-measure is commonly referred to as the F1 evaluation metric, expressed as in Eq. 11
In addition, in the comparative experiments, we employed overall accuracy (OA), average accuracy (AA), and Cohen’s kappa coefficient to measure the overall effectiveness of different methods. OA is a straightforward evaluation metric representing the proportion of correctly classified samples to the total number of samples. AA calculates the average accuracy of each class in a multi-class classification problem, balancing the sample distribution across different classes. Kappa is a measure of consistency that considers random classification, addressing the issue of imbalanced sample distribution affecting OA.
According to the aforementioned research methods, this study employs Python as the programming language for algorithm development. Remote sensing imagery and meteorological, hydrological, and topographic data from 2018 to 2022 were collected in the Jiajinshan giant panda habitat. In addition, the land use of the study area was classified for each year, including 10 categories: water bodies, forests, grasslands, wetlands, cultivated lands, shrub lands, building lands, bare lands, snowfields, and clouds. In the experimental project, multiple remote sensing images of each year were mosaicked with a median composition method. Through visual interpretation, regions were uniformly selected as the case bank, while the remaining regions were taken as unknown cases. In the case bank, 30% of the cases were randomly chosen as test cases to evaluate the effectiveness of the model.
Before conducting the spatial case reasoning of strata, it is necessary to determine the internal and mutual weights of attribute features, spatial features, and auxiliary features. The weights of each factor can be determined as follows: first, case reasoning was performed with individual feature sub-items to obtain the classification precision based solely on that feature sub-item. After performing case reasoning on all feature sub-items, the importance ranking of all feature sub-items can be obtained. Then, the analytic hierarchy process (AHP) is used to determine the specific weights of each feature sub-item, as shown in Table 3. The specific process of case-based reasoning used in the experiment is shown in Figure 4.
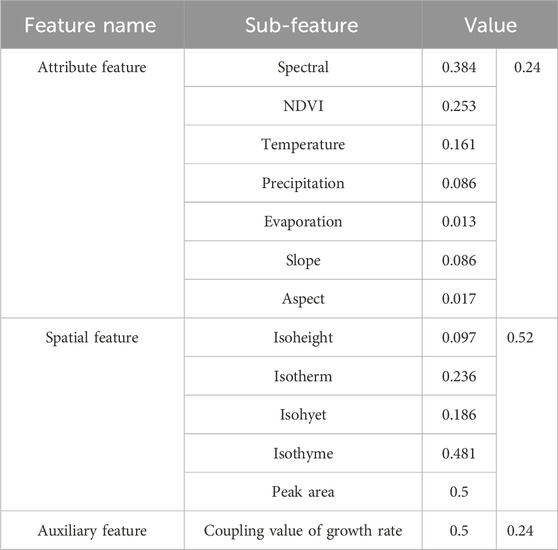
TABLE 3. Allocation of weights for each feature.
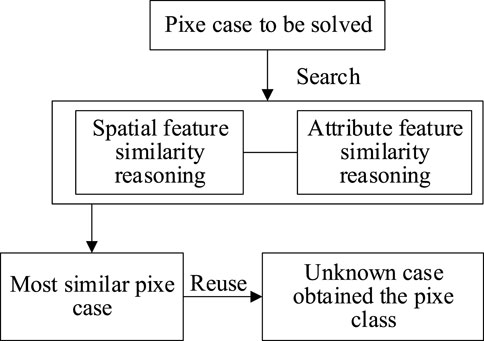
FIGURE 4. Spatial case-based reasoning process.
To verify the effectiveness of spatial features in the model, we conducted three sets of controlled experiments based on the dataset of 2020. These experiments include the ordinary case-based reasoning (O-CBR) model with only attribute features, case-based reasoning (A-CBR) model combining attribute and auxiliary features, and spatial feature-integrated case-based reasoning model. The experimental results are shown in Table 4.
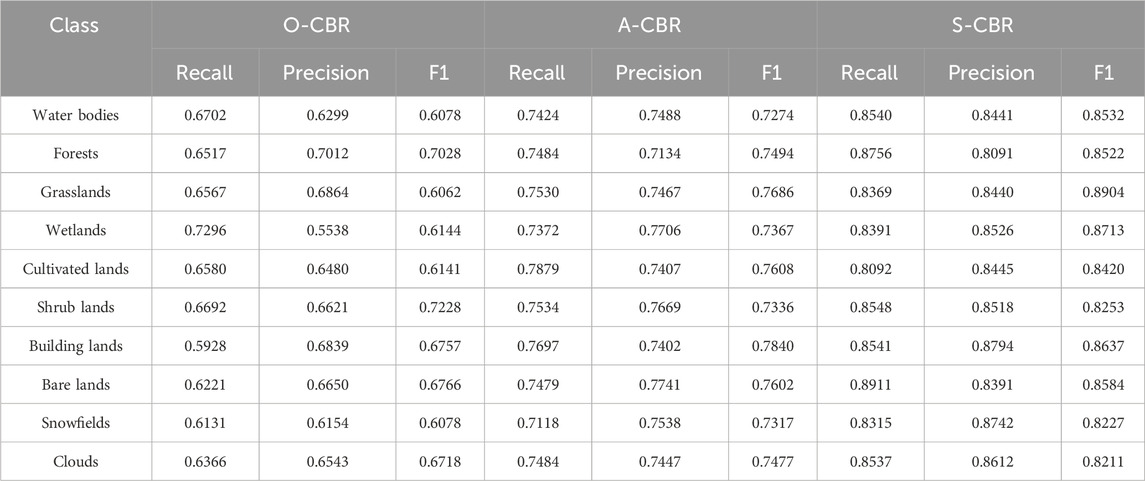
TABLE 4. Results of the ablation experiment.
Among the three CBR methods, the S-CBR method, which incorporates spatial features, achieved the best performance, while the O-CBR method, only using attribute features, had the worst performance. The A-CBR method, which combines attribute and auxiliary features, achieved moderate classification results. This indicates that auxiliary features and spatial features play an important role in remote sensing image segmentation, especially in land use classification. It also proves that exploring features with spatial significance is one of the approaches to applying general artificial intelligence methods to land use classification of remote sensing images.
To validate the advancement of the proposed algorithm, we conducted comparative experiments based on imagery from the study area in 2020. The selected algorithms for experimentation range from traditional statistical learning algorithms to advanced machine learning algorithms, including SVM (Burges, 1998), U-Net (Ronneberger et al., 2015), vision transformer (ViT) (Dosovitskiy et al., 2020), and Trans-Unet (Chen et al., 2021). Among these, support vector machine represents traditional statistical learning algorithms, U-Net is a convolutional neural network-based algorithm, ViT utilizes the transformer structure, and Trans-Unet combines the CNN and transformer. In the comparative experiments, we fine-tuned the hyperparameters for some methods. In particular, for the SVM, we used cross-validation to set the regularization parameter (C), gamma parameter, and degree of the polynomial kernel. The kernel function chosen was the default radial basis function (RBF) kernel. In practical implementation, we used GridSearchCV from scikit-learn to carry out this process. For several other deep learning methods, we conducted comparative experiments by referring to the optimal parameters mentioned in their respective papers.
Table 5 presents the results of the comparative experiments. It can be observed that the proposed S-CBR algorithm exhibits optimal experimental results for the majority of categories, although its performance is less satisfactory for a few categories. In terms of overall accuracy, S-CBR demonstrates the best results. This indicates that the proposed algorithm has advantages in experimental accuracy and is relatively straightforward in its algorithmic principles.
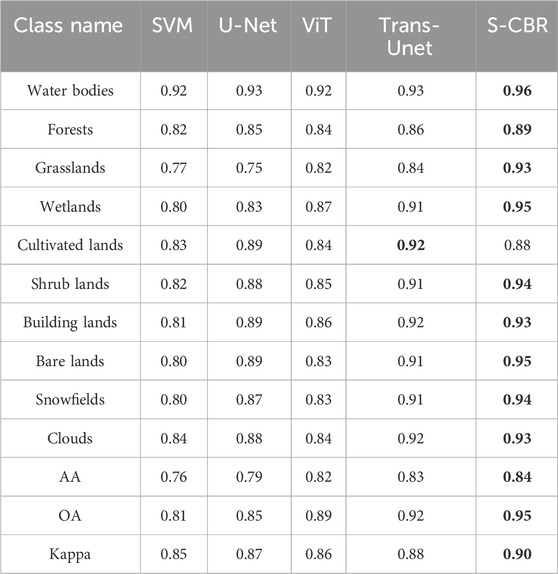
TABLE 5. Results of the comparative experiments in 2020. Bolded entries indicate the optimal results.
Figure 5 illustrates the results of the comparative experiments, and it aligns with the findings given in Table 5.
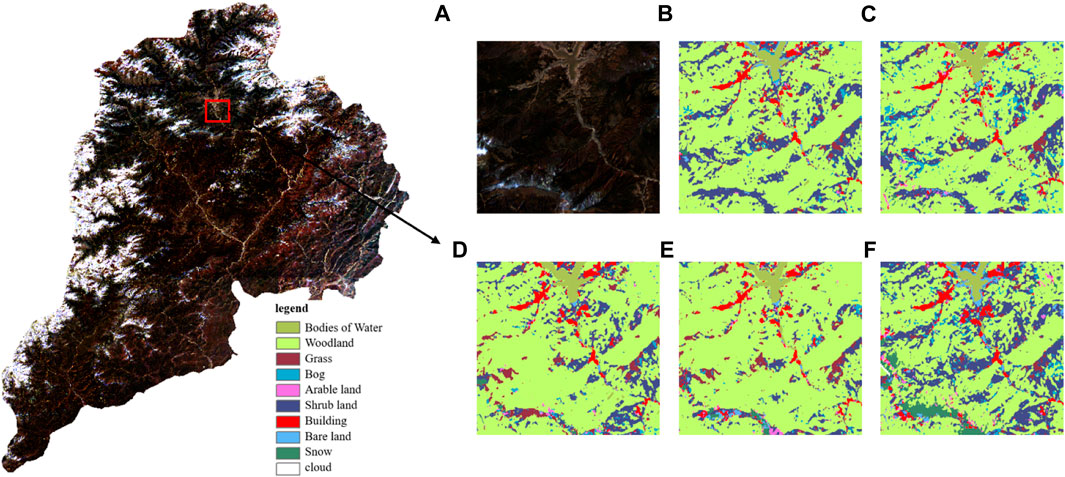
FIGURE 5. Results of comparative experiments on land use classification in the study area using different methods. Subfigures include (A) image; (B) SVM; (C) U-Net; (E) Trans-Unet; and (F) S-CBR.
The results of an ablation experiment show that S-CBR achieves the best land use classification performance of the Jiajinshan giant panda habitat. Therefore, we chose the S-CBR method to classify the land use of the Jiajinshan giant panda habitat based on remote sensing images from 2018 to 2022. The classification results are shown in Figure 6 and Table 6.
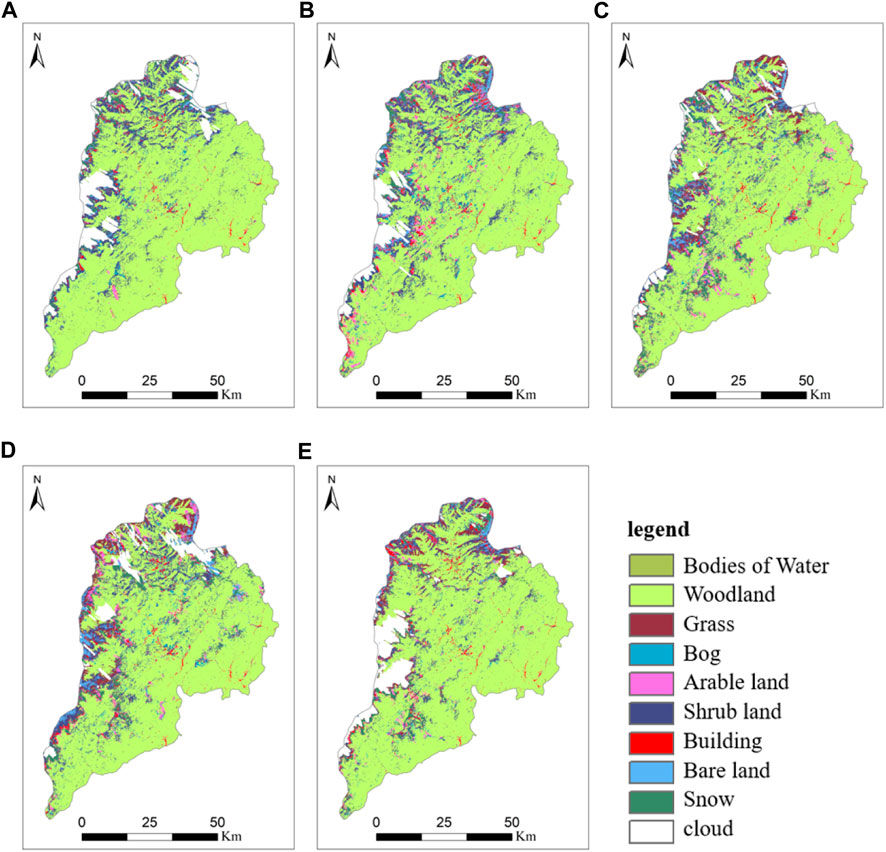
FIGURE 6. Land use classification results: (A–E) represent the land use classification results from 2018 to 2022, respectively.
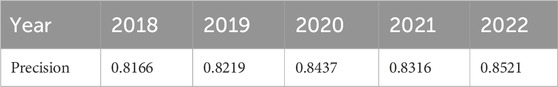
TABLE 6. Total precision of land use classification by year.
The results of the evaluation indicators given in Table 7 show that the classification precision of land use in the Jiajinshan giant panda habitat, based on spatial case-based reasoning, is above 80% for various categories. The precision is higher for water bodies and snowfields while lower for grasslands, wetlands, and cultivated lands (Table 7).
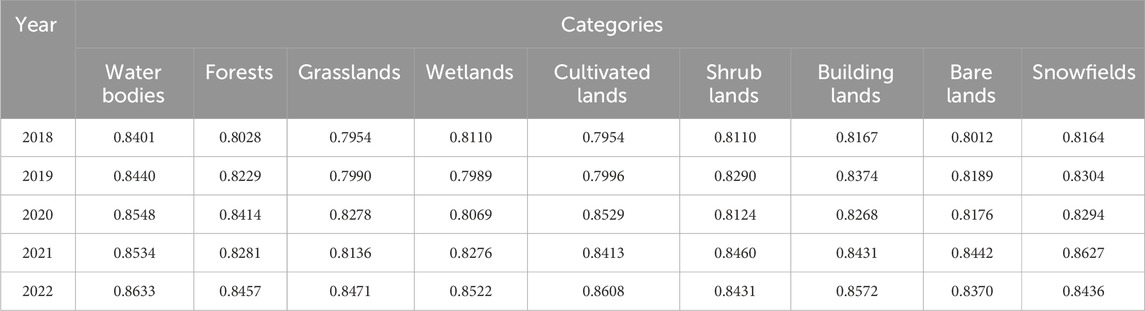
TABLE 7. Evaluation of land use classification indicators by category (2018–2022).
This may be because water bodies and snowfields have more distinctive spectral features and are greatly influenced by topographic images, which play a significant role in the classification process. On the other hand, the spectral features of cultivated lands, grasslands, and wetlands are relatively similar, and from a spatial perspective, their distribution patterns are not closely related to climate and topographic factors. Hence, their classification results perform worse. From the perspective of a 5-year span, the precision of classification results in 2022 is the highest, while it is the lowest in 2018. This is because the satellite imagery in 2022 had the lowest cloud coverage, so the image quality is the best, while the opposite was true for 2018. This indicates that image quality can affect the characterization degree of image spectral features on land objects, thus affecting the quality of classification results.
Figures 7A, B show the land use changes in the Jiajinshan giant panda habitat from 2018 to 2022. Over the past 5 years, the forest land has been the dominant land use type, with its proportion decreasing first and then increasing. The trend in grassland area changes is similar to the forest land, but its proportion has been increasing year by year. The area of the cultivated land reached its peak in 2020, and since then, it decreased to some extent. The aforementioned changes in land use types reflect that the ecological environment of the giant panda habitat area in Jiajinshan has been improved, especially in forest protection and restoration.
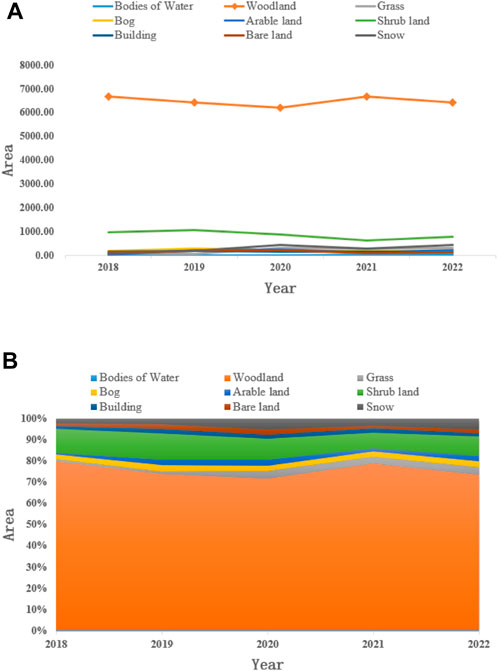
FIGURE 7. Changes in the land use types of the Jiajinshan giant panda habitat. (A) Changes in the proportion of land use categories in the habitat of giant pandas in Jiajin Mountain. (B) Changes in the land use types and areas of the Jiajinshan giant panda habitat.
In order to understand the land use classification of the Jiajinshan giant panda habitat, this paper proposes a land use remote sensing interpretation algorithm based on spatial case-based reasoning, including the construction of a spatial case expression model and a spatial case similarity reasoning model. On this basis, comparative experiments were conducted through ablation analysis, and the results showed that the spatial feature-integrated case-based reasoning model (S-CBR) achieved better classification results. Then, using S-CBR as the representative algorithm, land use classification experiments were carried out in the Jiajinshan giant panda habitat. The experimental results showed that S-CBR had better performance in land use classification. This paper further analyzed the land use classification changes from 2018 to 2022 over a 5-year period, and the results can provide a theoretical basis for the ecological environment protection in this region.
The raw data supporting the conclusion of this article will be made available by the authors, without undue reservation.
WX: data curation, investigation, methodology, and writing–original draft. WZ: data curation, investigation, supervision, writing–original draft, and writing–review and editing. SW: methodology, supervision, validation, and writing–review and editing.
The author(s) declare that no financial support was received for the research, authorship, and/or publication of this article.
Author WZ was employed by Sichuan Institute of Geological Engineering Investigation Group Co. Ltd.
The remaining authors declare that the research was conducted in the absence of any commercial or financial relationships that could be construed as a potential conflict of interest.
All claims expressed in this article are solely those of the authors and do not necessarily represent those of their affiliated organizations, or those of the publisher, the editors, and the reviewers. Any product that may be evaluated in this article, or claim that may be made by its manufacturer, is not guaranteed or endorsed by the publisher.
Aamodt, A., and Plaza, E. (1994). Case-based reasoning: foundational issues, methodological variations, and system approaches. Artif. Intell. Commun. 7 (1), 39–59. doi:10.3233/aic-1994-7104
Bajo, J., De Paz, J. F., Rodriguez, S., and González, A. (2010). Multi-agent system to monitor oceanic environments. Computer-Aided Eng. 17 (2), 131–144. doi:10.3233/ica-2010-0332
Burges, C. J. C. (1998). A tutorial on support vector machines for pattern recognition. Data Min. Knowl. Discov. 2 (2), 121–167. doi:10.1023/a:1009715923555
Caro, F. D., Vaccaro, A., and Villacci, D. (2017). Spatial and temporal wind power forecasting by case-based reasoning using big-data. Energies 10 (2), 1–14. doi:10.3390/en10020252
Castelluccio, M., Poggi, G., Sansone, C., and Verdoliva, L.(2017). Land use classification in remote sensing images by convolutional neural networks. arXiv preprint arXiv:1508.00092.
Chen, J., He, B., and Cui, Y. (2010). “Case-based reasoning and GIS approach to regional metallogenic prediction,” in International Conference on Geoinformatics, 1–4.
Chen, J., Lu, Y., Yu, Q., Luo, X., Adeli, E., Wang, Y., et al. (2021). Transunet: Transformers make strong encoders for medical image segmentation. arXiv preprint arXiv:2102.04306.
Chen, J., Wang, W., and Li, J. W. (2014). Case-based reasoning with GIS to oil-gas reservoir comprehensive mapping. Adv. Mater. Res. 1073-1076, 2010–2014. doi:10.4028/www.scientific.net/amr.1073-1076.2010
Dalsasso, E., Denis, L., and Tupin, F. (2021). SAR2SAR: a semi-supervised despeckling algorithm for SAR images. IEEE J. Sel. Top. Appl. Earth Observations Remote Sens. 14, 4321–4329. doi:10.1109/jstars.2021.3071864
Dosovitskiy, A., Beyer, L., Kolesnikov, A., Weissenborn, D., Zhai, X., Unterthiner, T., et al. (2020). An image is worth 16x16 words: Transformers for image recognition at scale. arXiv preprint arXiv:2010.11929.
Dou, J., Chang, K., Chen, S., Yunus, A., Liu, J. K., Xia, H., et al. (2015). Automatic case-based reasoning approach for landslide detection: integration of object-oriented image analysis and a genetic algorithm. Remote Sens. 7 (4), 4318–4342. doi:10.3390/rs70404318
Du, Y., Wen, W., Cao, F., and Ji, M. (2010). A case-based reasoning approach for land use change prediction. Expert Syst. Appl. 37 (8), 5745–5750. doi:10.1016/j.eswa.2010.02.035
Fyson, M., and Toll, D. G. (2008). Case-based system for slope design. Comput. Geotechnics 35 (3), 468–478. doi:10.1016/j.compgeo.2007.06.007
Haapanen, R., Ek, A. R., Bauer, M. E., and Finley, A. O. (2004). Delineation of forest/nonforest land use classes using nearest neighbor methods. Remote Sens. Environ. 89 (3), 265–271. doi:10.1016/j.rse.2003.10.002
He, K., Zhang, X., Ren, S., and Sun, J. (2016). “Deep residual learning for image recognition,” in Proceedings of the IEEE conference on computer vision and pattern recognition, 770–778.
Hotelling, H. (1933). Analysis of a complex of statistical variables into principal components. J. Educ. Psychol. 24 (6), 417–441. doi:10.1037/h0071325
Kaselimi, M., Voulodimos, A., Daskalopoulos, I., Doulamis, N., and Doulamis, A. (2022). A vision transformer model for convolution-free multilabel classification of satellite imagery in deforestation monitoring. IEEE Trans. Neural Netw. Learn. Syst. 34, 3299–3307. doi:10.1109/tnnls.2022.3144791
Krizhevsky, A., Sutskever, I., and Hinton, G. E. (2012). Imagenet classification with deep convolutional neural networks. Adv. neural Inf. Process. Syst. 25. doi:10.1145/3065386
Lee, M., Koo, C., Hong, T., and Park, H. S. (2014). Framework for the mapping of the monthly average daily solar radiation using an advanced case-based reasoning and a geostatistical technique. Environ. Sci. Technol. 48 (8), 4604–4612. doi:10.1021/es405293u
Li, X., and Liu, X. (2006). An extended cellular automaton using case-based reasoning for simulating urban development in a large complex region. Int. J. Geogr. Inf. Sci. 20 (10), 1109–1136. doi:10.1080/13658810600816870
Liu, X., Ma, L., Li, X., Ai, B., Li, S., and He, Z. (2014). Simulating urban growth by integrating landscape expansion index LEI and cellular automata. Int. J. Geogr. Inf. Sci. 28 (1), 148–163. doi:10.1080/13658816.2013.831097
Liu, Z. Q., Tang, P., Zhang, W., and Zhang, Z. (2022). CNN-enhanced heterogeneous graph convolutional network: inferring land use from land cover with a case study of park segmentation. Remote Sens. 14 (19), 5027. doi:10.3390/rs14195027
Mazhari, S. M., Memarian, H., and Tokhmechi, B. (2018). A hybrid learning automata and case-based reasoning for fractured zone detection using petrophysical logs. Arabian J. Geosciences 11 (19), 577. doi:10.1007/s12517-018-3934-3
Mounce, S. R., Mounce, R., and Boxall, J. B. (2016). Case-based reasoning to support decision making for managing drinking water quality events in distribution systems. Urban Water J. 13 (7), 727–738. doi:10.1080/1573062x.2015.1036082
Pan, S. J., and Yang, Q. (2009). A survey on transfer learning. IEEE Trans. Knowl. data Eng. 22 (10), 1345–1359. doi:10.1109/tkde.2009.191
Pham, Q. B., Chandra Pal, S., Chakrabortty, R., Saha, A., Janizadeh, S., Ahmadi, K., et al. (2022). Predicting landslide susceptibility based on decision tree machine learning models under climate and land use changes. Geocarto Int. 37 (25), 7881–7907. doi:10.1080/10106049.2021.1986579
Popa, A., and Wood, W. (2011). Application of case-based reasoning for well fracturing planning and execution. J. Nat. Gas Sci. Eng. 3 (6), 687–696. doi:10.1016/j.jngse.2011.07.013
Riese, F. M., Keller, S., and Hinz, S. (2019). Supervised and semi-supervised self-organizing maps for regression and classification focusing on hyperspectral data. Remote Sens. 12 (1), 7. doi:10.3390/rs12010007
Ronneberger, O., Fischer, P., and Brox, T. (2015). “U-net: convolutional networks for biomedical image segmentation,” in Proceedings, Part III 18 Medical Image Computing and Computer-Assisted Intervention–MICCAI 2015: 18th International Conference, Munich, Germany, October 5-9, 2015 (Springer International Publishing), 234–241.
Rwanga, S. S., and Ndambuki, J. M. (2017). Accuracy assessment of land use/land cover classification using remote sensing and GIS. Int. J. Geosciences 8 (4), 611–622. doi:10.4236/ijg.2017.84033
Schank, R. C., and Abelson, R. P. (1977). Scripts, plans, goals, and understanding: an inquiry into human knowledge structures. Oxford, UK: Lawrence Erlbaum.
Shi, X., Zhu, A., Burt, J. E., Qi, F., and Simonson, D. (2004). A case-based reasoning approach to fuzzy soil mapping. Soil Sci. Soc. Am. J. 68 (3), 885–894. doi:10.2136/sssaj2004.8850
Shi, Z., Ma, Y., Wang, Y., Ma, Z. W., Huang, Q., and Huang, Y. Y. (2012). Review on the classification methods of land use/cover based on remote sensing image. Chin. Agric. Sci. Bull. 28 (12), 273–278. doi:10.12677/AG.2020.106047
Shokouhi, S. V., Skalle, P., and Aamodt, A. (2014). An overview of case-based reasoning applications in drilling engineering. Artif. Intell. Rev. 41 (3), 317–329. doi:10.1007/s10462-011-9310-2
Skalle, P., and Aamodt, A. (2004). Knowledge-based decision support in oil well drilling. Int. Conf. Intelligent Inf. Process., 443–455. doi:10.5555/1139563.1139627
Ustuner, M., Sanli, F. B., and Dixon, B. (2015). Application of support vector machines for landuse classification using high-resolution rapideye images: a sensitivity analysis. Eur. J. Remote Sens. 48 (1), 403–422. doi:10.5721/eujrs20154823
Wang, C., Chen, T., and Plaza, A. (2023). MFE-ResNet: a new extraction framework for land cover characterization in mining areas. Future Gener. Comput. Syst. 145, 550–562. doi:10.1016/j.future.2023.04.001
Wang, J., Hadjikakou, M., Hewitt, R. J., and Bryan, B. A. (2022). Simulating large-scale urban land-use patterns and dynamics using the U-Net deep learning architecture. Comput. Environ. Urban Syst. 97, 101855. doi:10.1016/j.compenvurbsys.2022.101855
Xia, Y., Li, J. Y., and Guo, D. E. (2022). Semi-supervised remote sensing image scene classification based on GAN. Acta Photonica Sin. 51 (3), 0310003. doi:10.3788/gzxb20225103.0310003
Xu, Y., Zhou, B., Jin, S., Xie, X., Chen, Z., Hu, S., et al. (2022). A framework for urban land use classification by integrating the spatial context of points of interest and graph convolutional neural network method. Comput. Environ. Urban Syst. 95, 101807. doi:10.1016/j.compenvurbsys.2022.101807
Yu, F., and Li, X. (2018). Improving emergency response to cascading disasters: applying case-based reasoning towards urban critical infrastructure. Int. J. Disaster Risk Reduct. 30, 244–256. doi:10.1016/j.ijdrr.2018.04.012
Zhang, C., Li, F., Li, J., Xing, J., Yang, J., Guo, J., et al. (2022). Recognition of land use on open-pit coal mining area based on DeepLab v3+ and GF-2 high-resolution images. Coal Geol. Explor. 50, 94–103.
Keywords: remote sensing image segmentation, land use, case-based reasoning, spatial features, machine learning, Jiajinshan giant panda habitat
Citation: Xia W, Zhang W and Wu S (2024) Classification algorithm for land use in the giant panda habitat of Jiajinshan based on spatial case-based reasoning. Front. Environ. Sci. 12:1298327. doi: 10.3389/fenvs.2024.1298327
Received: 21 September 2023; Accepted: 29 January 2024;
Published: 20 February 2024.
Edited by:
Yihuai Zhang, University of Glasgow, United KingdomReviewed by:
Jakub Nalepa, Silesian University of Technology, PolandCopyright © 2024 Xia, Zhang and Wu. This is an open-access article distributed under the terms of the Creative Commons Attribution License (CC BY). The use, distribution or reproduction in other forums is permitted, provided the original author(s) and the copyright owner(s) are credited and that the original publication in this journal is cited, in accordance with accepted academic practice. No use, distribution or reproduction is permitted which does not comply with these terms.
*Correspondence: Wen Zhang, MzQ2MzI4N0BxcS5jb20=
Disclaimer: All claims expressed in this article are solely those of the authors and do not necessarily represent those of their affiliated organizations, or those of the publisher, the editors and the reviewers. Any product that may be evaluated in this article or claim that may be made by its manufacturer is not guaranteed or endorsed by the publisher.
Research integrity at Frontiers
Learn more about the work of our research integrity team to safeguard the quality of each article we publish.