 Yoonji Kim
 Jieun Yu2
 Sangchul Lee
- 1Department of Environmental Sciences and Ecological Engineering, Korea University, Seoul, Republic of Korea
- 2Sustainability Team, Hyundai-Rotem, Uiwang, Republic of Korea
- 3School of Environmental Engineering, University of Seoul, Seoul, Republic of Korea
Best management practices (BMPs) are widely applied to address water quality degradation issues attributed to non-point source pollutants. The objective of this study was to assess the efficiency of two types of BMPs, vegetation filter strips (VFS) and wetlands, in reducing total nitrogen (TN) and total phosphorus (TP) in a watershed, and to investigate whether the efficiency of the two BMPs is maintained under future climate scenarios by employing the Soil and Water Assessment Tool (SWAT). A set of parameters was calibrated using the SWAT Calibration and Uncertainty Program (SWAT-CUP) to ensure acceptable simulation results. Three BMP scenarios were developed by applying VFS and wetlands individually and in combination. Projected climate data from 18 global circulation models under Shared Socioeconomic Pathways (SSP1-2.6, SSP2-4.5, SSP3-7.0, and SSP5-8.5) were used to depict climate change conditions. VFS demonstrated 18.2% and 22.9% greater reduction efficiency for TN and TP, respectively, relative to wetlands. When the two BMPs were simultaneously applied, the reduction efficiency was even greater than that of single-BMP implementation (by 7.4% for TN and 6.8% for TP compared to VFS alone and by 25.5% for TN and 29.7% for TP compared to wetlands alone). To assess the effect of climate change, the model simulated results for the period of 2021–2,100. The differences in efficiency between the combined BMP scenario and the individual BMPs increased with greater intensity of climate change, especially in the distant future. Therefore, this study supports the effectiveness of nutrient pollution control by applying multiple BMPs rather than by applying individual BMPs. Furthermore, this research underscores the adaptability and reliability of natural-based solutions in mitigating non-point source pollution in a changing climate, which is essential for effective ecological restoration in complex urban-agricultural landscapes. The study provides valuable insights for watershed managers and policymakers seeking effective strategies to combat nutrient pollution in the face of a changing climate within the unique landscape of South Korea.
1 Introduction
Non-point source (NPS) pollutant loads pose a significant challenge to global water resource management, characterized by their intricate transport through surface and subsurface pathways. The complexity and nonlinearity of NPS pollutant pathways, originating from anthropogenic sources and extending into aquatic systems, contribute to multifaceted issues such as proliferation of toxic algae, oxygen depletion, and loss of biodiversity (Adu and Kumarasamy, 2018; Nie et al., 2018; Liu et al., 2021; Li et al., 2022; Liu et al., 2022). These challenges are particularly pronounced in the context of South Korea, where the interplay of topographical and climatic characteristics adds an additional layer of complexity to the management of water quality.
South Korea’s landscape features intricate urban-agricultural regions, where urban centers and agricultural areas coexist, posing unique challenges for pollution control dilemmas (Choi et al., 2017; Kim et al., 2019). The steep slopes within the relatively compact national territory amplify these challenges, as rapid runoff from rainfall events on such slopes accelerates the transport of pollutants into nearby water bodies. Furthermore, South Korea experiences concentrated precipitation, primarily during the summer months of June, July, and August (Kim et al., 2002; Kim et al., 2021). These distinctive characteristics underscore the need for tailored strategies for ecological restoration in such areas, emphasizing the urgency for effective non-point source pollution control.
To mitigate the adverse consequences of excessive NPS pollutant loads, best management practices (BMPs) have emerged as crucial nature-based solutions (Chaubey et al., 2010). Structural BMPs encompass a range of interventions designed to address water body contamination by reducing pollutant levels or impeding pollutant transport. While numerous studies highlight the efficiency of individual BMPs, including wetlands (Qi et al., 2019; Yeo et al., 2019; Bauwe et al., 2022), grassed waterways (Qiu et al., 2019; Hassen et al., 2022), vegetation filter strips (Cao et al., 2018; Leh et al., 2018; Ramesh et al., 2021), and riparian zones (Chua et al., 2019; Chen et al., 2023), this study delves into a research gap by assessing the effectiveness of BMP combinations. This aspect, while gaining some attention in recent literature (Dai et al., 2018; Uniyal et al., 2020), remains relatively unexplored, especially within the context of South Korea’s unique landscape.
This study contributes to the existing body of knowledge by examining the potential synergistic or conflicting effects that may arise when deploying various BMPs collectively within South Korea’s distinct topographical and climatic conditions. Specifically, the assessment involves the reduction efficiencies of NPS pollutant loads, including total nitrogen (TN) and total phosphorus (TP). This research underscores the necessity of formulating region-specific strategies for ecological restoration, considering the intricate interplay between urban and agricultural landscapes and the pronounced seasonality of precipitation.
Furthermore, recognizing climate change as a catalyst for increased water quality degradation caused by NPS pollutants (Liu et al., 2020; Badrzadeh et al., 2022; Li et al., 2022; Wan et al., 2022), the second part of the study delves into how BMP scenarios’ effectiveness may evolve in response to shifting climate conditions. Climate data projections from 18 global circulation models (GCMs) under varying Shared Socioeconomic Pathways (SSPs) are employed to gain insights into the adaptability of BMP strategies in anticipation of climate pattern shifts. The selection of the newly introduced SSPs, instead of traditional RCPs, reflects our commitment to addressing the evolving challenges posed by climate change in the South Korean context.
In summary, the study, rooted in the intricate topographical and climatic attributes of South Korea, emphasizes the need for tailored BMP strategies. By scrutinizing the effectiveness of BMP combinations and assessing their resilience amid evolving climate conditions, the study contributes to the body of knowledge required for effective ecological restoration in complex urban-agricultural landscapes.
2 Materials and methods
2.1 Study area
Daecheong Lake stands as a pivotal water supply source within the Geumgang River basin, one of South Korea’s four major river basins. It has a high ratio of basin area to reservoir area, rendering it susceptible to water quality degradation when compared to other reservoirs of similar size. This vulnerability arises due to a substantial resident population and concurrent pollution load upstream (Park et al., 2016). During the summer season, rainfall events introduce substantial nitrogen and phosphorus concentrations into the lake, primarily from the So-okcheon watershed, the focal point of this study (Figure 1). The So-okcheon watershed’s geographical characteristics amplify the risk of algal blooms in the lake, characterized by numerous bights and a reduced streamflow. The confluence of the So-okcheon watershed’s stream with the downstream watershed creates a bottleneck, creating highly conducive conditions for algal blooms. Consequently, the recurrent prevalence of algal blooms in Daecheong Lake has emerged as a significant concern for regional water security (Kim et al., 2021). Hence, the So-okcheon watershed serves as the ideal study site for the implementation of BMPs designed to mitigate nutrient loads.
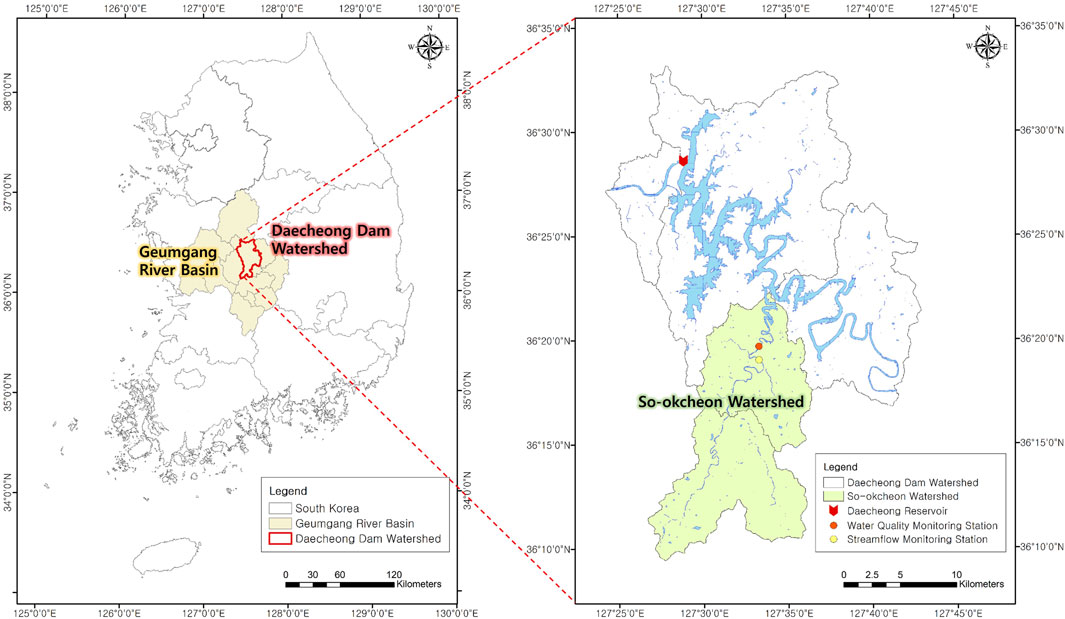
FIGURE 1. Target area of study.
The small So-okcheon watershed lies within the coordinates of 36°9′40″–36°22′50″N and 127°26′15″–127°36′10″E. Covering an overall area of 185.61 km2, it accounts for approximately 27.8% of the mid-sized Daecheong Dam watershed’s total expanse (667.48 km2). The So-okcheon watershed is divided into seven smaller areas, controlled by the national Total Pollution Load Management System. While the TP concentration of discharged water from the two sewage treatment plants within the watershed currently complies with water quality standards (below 0.2 mg/L), the inflow TP concentration remains alarmingly high, posing challenges in controlling algal growth in Daecheong Lake (Park et al., 2016).
An evaluation of land use within the So-okcheon watershed was conducted using the 2019 national land-cover map provided by the Ministry of the Environment. Urban areas within the region encompass approximately 7.52% or 13.96 km2 of the total 85.61 km2 area, while agricultural land occupies 14.06% or 26.10 km2 (Table 1). Recognizing that urban and agricultural areas stand as the primary sources of NPS pollution, effective management within these domains is imperative.

TABLE 1. Land use in the study area.
2.2 Soil and Water Assessment Tool (SWAT)
The Soil and Water Assessment Tool (SWAT) was developed by the United States Department of Agriculture (USDA) as a comprehensive tool for evaluating long-term hydrological changes, water supply, and NPS discharge in large watersheds (Neitsch et al., 2011). SWAT operates on a physical computational model, necessitating input data such as meteorological information, soil characteristics, topography, and land management practices. It employs these data to partition the target watershed into sub-watersheds and hydrological response units (HRUs) based on slope, land use, and soil properties. Subsequently, SWAT computes the water balance for each HRU, encompassing aspects like precipitation, surface runoff, evapotranspiration, percolation, and groundwater recharge. The model aggregates these outputs at sub-watershed and watershed scales (Neitsch et al., 2011).
SWAT’s nutrient transport module quantifies nutrient loads, including nitrogen and phosphorus, by tracking their transformations and movements at various stages (Arnold et al., 2012). The model represents diverse processes within the nitrogen and phosphorus cycles, encompassing both organic and inorganic forms of these nutrients. Plant nutrient uptake is estimated using the supply-and-demand approach. The loading function calculates daily nitrogen and phosphorus runoff losses, considering factors like topsoil concentration, sediment yield based on the Modified universal Soil Loss Equation (MUSLE), and the enrichment ratio, which relates nitrogen or phosphorus concentration in sediment to that in the soil (Neitsch et al., 2011).
2.3 Input data for the SWAT model establishment
In the meticulous preparation for constructing the SWAT model, a careful selection and preparation of various datasets were undertaken, as summarized in Table 2. The success of any modeling effort hinges on the quality and relevance of the input data, and thus the data selection and collection processes were executed with utmost care.
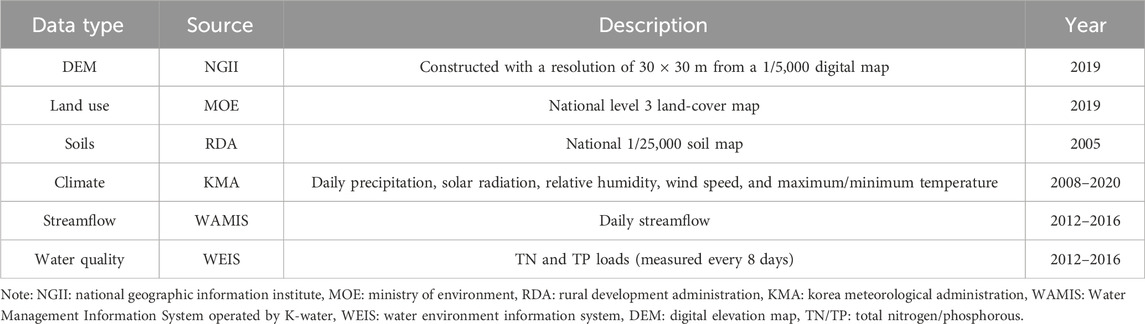
TABLE 2. SWAT input data.
The digital elevation model (DEM) grid map, a foundational element for watershed configuration in hydrological modeling, was created with a high-resolution of 30 × 30 m. Utilizing a 1/5,000 digital map from the National Geographic Information Institute (NGII) in 2019, this DEM is integral to the SWAT model, serving to delineate streams, define watersheds, and establish outlets. The precision of the DEM is paramount, enabling the model to accurately capture the intricate topographical features of the study area.
Land use information from the Ministry of Environment (MOE), representing the national land-cover map of 2019, was matched to SWAT land-use codes. This integration is crucial, as land use status plays a pivotal role in determining the distribution of various land activities impacting hydrological and water quality processes. Understanding land use intricacies is indispensable for predicting non-point source pollutant loads, facilitating the model’s simulation of dynamic interactions between land surfaces and water bodies.
Precise soil data, derived from 1/25,000 soil maps provided by the Rural Development Administration, represents conditions as of 2005. These detailed soil maps serve as a cornerstone in the SWAT model, enabling the simulation of hydrological and nutrient cycling processes. Attributes such as soil texture, hydraulic conductivity, and nutrient content shape the model’s response to land management practices and climatic conditions, enhancing its accuracy in capturing the complexities of water movement, nutrient transport, and pollutant dynamics within the study area.
Daily meteorological records, encompassing variables such as precipitation, solar radiation, relative humidity, wind speed, and maximum/minimum temperatures, were sourced from the Korea Meteorological Administration (KMA). While meteorological data for an extended period was available, the subsequent utilization of daily streamflow and TN and TP measurement data for calibration and validation purposes was limited to the period from 2012 to 2016. To incorporate a warm-up period for model initialization and considering the availability of reliable daily streamflow and water quality data only from 2012 to 2016, additional meteorological data covering the years 2008–2011 were acquired. Subsequent simulations were then conducted based on a decade-long period from 2011 to 2020, providing insights into hydrological and water quality dynamics over the 10-year climatic cycle.
Recognizing the imperative to account for potential climate change impacts, this study incorporates scenarios based on Shared Socioeconomic Pathways (SSPs) introduced in the sixth Intergovernmental Panel on Climate Change (IPCC) report. These pathways, encompassing factors such as demographics, economic development, environmental considerations, and policies, provide a holistic framework for understanding climate trajectories (O’Neill et al., 2014). Four distinct SSPs (SSP1-2.6, SSP2-4.5, SSP3-7.0, and SSP5-8.5) were selected to explore a range of climate change scenarios. SSP1-2.6 represents an optimistic scenario characterized by extensive use of renewable energy sources, while SSP5-8.5 portrays a pessimistic scenario with continued high reliance on fossil fuels. Climate data from 18 Global Circulation Models (GCMs), provided by the RDA, were incorporated into the simulations. Recognizing the inherent uncertainties associated with individual model variations, we averaged the results from the 18 models for each SSP scenario, enhancing the robustness of our climate change impact assessments.
This comprehensive selection of input data, characterized by accuracy, relevance, and adaptability to potential future scenarios, forms the backbone of our SWAT modeling efforts. The integration of various datasets and thoughtful consideration of climate change scenarios underscore the commitment to a nuanced exploration of non-point source pollutant dynamics in the unique context of South Korea.
2.4 Model calibration and validation
Due to an extensive input dataset and parameters required by SWAT, stringent calibration and validation processes are essential prior to commencing simulations (Yang et al., 2008; Arnold et al., 2012; Yu et al., 2020). SWAT offers manual calibration functions, but these methods often involve subjective judgment, making it challenging to ascertain the results’ reliability. To address these limitations, this study leveraged the SWAT Calibration and Uncertainty Programs (SWAT-CUP), which provides semi-automatic parameter correction precision and encompasses five algorithms within a unified interface: SUFI-2, PSO, GLUE, ParaSol, and MCMC (Abbaspour et al., 2007). Numerous studies have underscored the reliability of the SUFI-2 algorithm for SWAT calibration when utilizing SWAT-CUP (Abbaspour et al., 2015; Hosseini and Khaleghi, 2020; Malik et al., 2022). Consequently, this study adopted the SUFI-2 algorithm for the calibration and validation of streamflow and water quality.
The calibration and validation of the SWAT model were executed at daily and monthly time intervals, covering a 5-year span from 2012 to 2016 under the baseline conditions, without the implementation of BMPs. Specifically, the calibration phase encompassed a 3-year window from 2012 to 2014, followed by a 2-year validation period from 2015 to 2016. Understanding the significance of data availability in model calibration and validation, this study acknowledges the difficulties presented by the relatively short 5-year simulation period. These constraints are a direct result of the limited availability of observed data in the region, a common scenario in places where water resource management practices are still in the developmental stages. Consequently, the study adjusted the calibration and validation period to maximize the utilization of available data, addressing the practical constraints associated with data availability in these regions.
The calibration and validation processes utilized data collected from two monitoring stations, one for streamflow and another for water quality, both located near the outflow of the So-okcheon watershed. While daily flow data were accessible, water quality measurements were conducted every 8 days. Due to the differing measurement intervals between these datasets, calibration and validation for streamflow were performed using daily data, whereas water quality calibration and validation relied on monthly averages. Calibration and validation were first completed based on the parameters for the flow rate, and then sequentially based on the parameters for the water quality components, TN and TP.
To confirm the applicability of the model, the coefficient of determination (R2) and the Nash–Sutcliffe model efficiency coefficient (NSE) were used as statistical performance measures. R2 represents the correlation between the predicted value of the model and the observed value. The calculation process is shown in Eq. (1). The NSE is a statistical value commonly used in hydrological models and represents the predictability of the model, as shown in Eq. (2):
Both R2 and NSE values closer to 1 indicate a higher degree of accuracy in replicating observed values. The identification of an acceptable parameter set relied on meeting predefined model performance criteria, specifically targeting satisfactory, good, and very good performance levels, as recommended in a prior study (Moriasi et al., 2015). Refer to Table 3 for details.
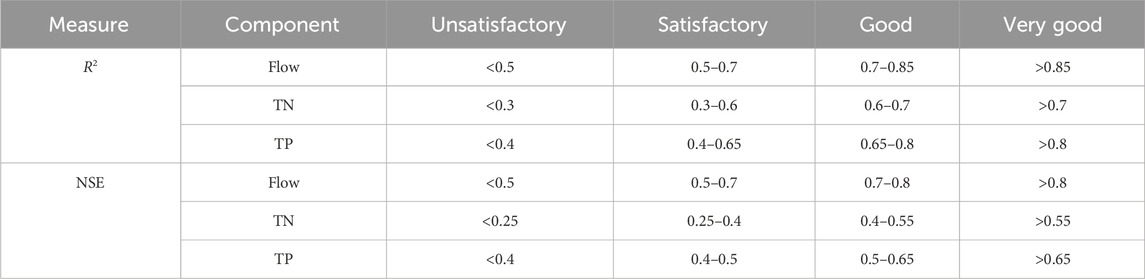
TABLE 3. Model performance evaluation criteria for R2 and NSE.
2.5 Assessing the reduction efficiency of BMPs
In this section, the effectiveness of BMPs in reducing TN and TP loads within the study area is evaluated. These BMPs play a crucial role in the management of water quality, particularly in regions encompassing both urban and agricultural land uses. Wetlands and VFS were selected as representative BMPs due to their suitability for various land use contexts and their ecological value as natural-based solutions. Wetlands were chosen as a BMP option for their capacity to act as retention facilities, effectively trapping and treating pollutants. In contrast, VFS was selected for their ability to absorb nutrients and filter contaminants from runoff due to their vegetative nature.
The decision to apply VFS and wetlands in this study aligns with the recommendations outlined in the Korean Ministry of Environment’s ‘Guidelines for the Installation and Management of Non-Point Source Pollution Control Facilities (2008)’. This manual emphasizes considerations such as land use characteristics, physical feasibility, cost-effectiveness, ease of maintenance, and stability when selecting NPS pollution control facilities. Following these guidelines, wetlands and VFS were identified as the most suitable options for the specific characteristics of the studied watershed. This strategic selection enhances the relevance and applicability of the chosen BMPs in addressing the unique challenges posed by the study area.
To assess the efficiency of these BMPs, three distinct scenarios (Table 4) were formulated, applying VFS and wetlands individually and in combination. In scenario 1 (SC.1), a 10-m-wide VFS was applied along both riversides. Scenario 2 (SC.2) involved the implementation of wetlands, covering a total area equivalent to that of the VFS in SC.1. In scenario 3 (SC.3), both VFS and wetlands were employed, with their combined area matching that of the previous scenarios.
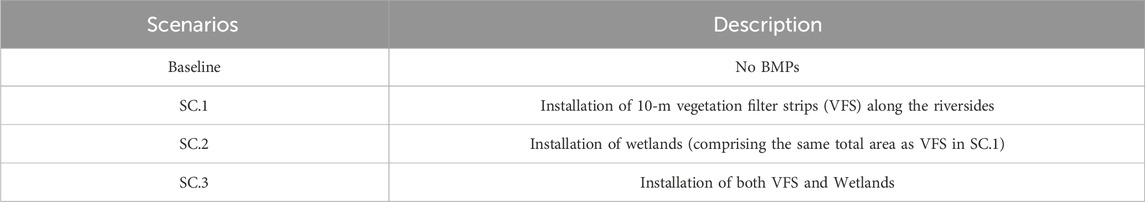
TABLE 4. Summary of the BMP scenarios.
The assessment began by simulating TN and TP loads transported from the watershed outlet. A warm-up period from 2008 to 2010 was utilized to establish baseline conditions, followed by a 10-year assessment phase from 2011 to 2020. These simulations were conducted using calibrated parameters applied to SWAT. Reduction efficiencies for the three BMP scenarios (SC.1–3) were then calculated using Eq. (3):
To explore the dynamic nature of reduction efficiencies under changing climate conditions, TN and TP loads for the three scenarios were projected over an 80-year period from 2021 to 2100, considering four distinct SSP pathways. Subsequently, the reduction efficiency of each BMP scenario was assessed in 20-year intervals: 2021–2040, 2041–2060, 2061–2080, and 2081–2100. Finally, a comparison was made between the future reduction efficiencies of the BMP scenarios and those observed under current climate conditions.
3 Results
3.1 Model calibration and validation results
The presentation of the model calibration and validation results begins with an emphasis on the comprehensive calibration and validation processes for streamflow and water quality parameters, TN and TP, using the SWAT model. The primary parameter values derived from this meticulous process are succinctly listed in Table 5, establishing a foundation for subsequent simulations and analyses.
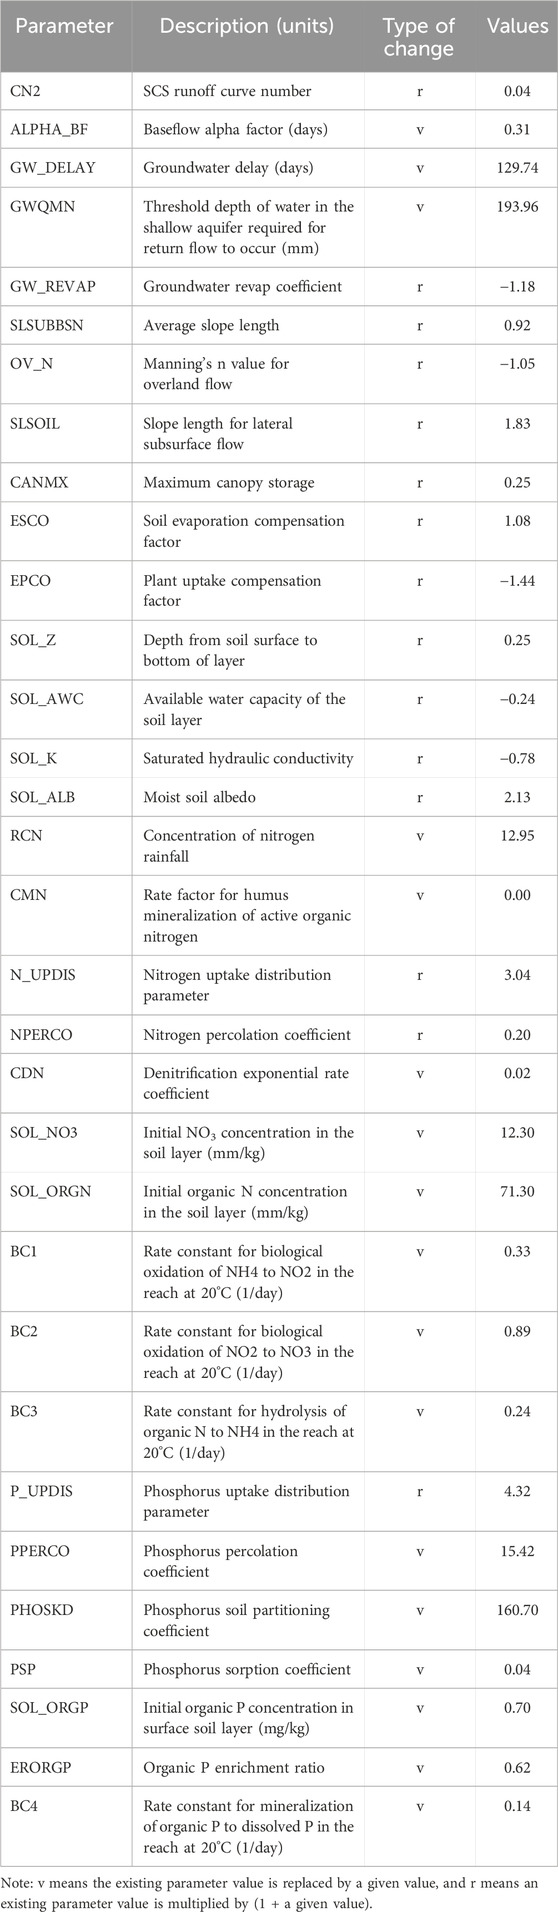
TABLE 5. List of calibrated parameters.
The outcomes of the model calibration and validation processes are presented in Table 6 and Figure 2. To ensure the robustness of the SWAT model, parameters related to streamflow were initially calibrated and validated, followed by those associated with the water quality components of TN and TP. Overall, the model’s performance, as indicated by the values of R2 and NSE, fell within the acceptable range defined as satisfactory, good, and very good (Table 3). These results reflect a commendable agreement between the simulated values and observed data, instilling high confidence in the utilization of the optimized parameter set for subsequent simulations.
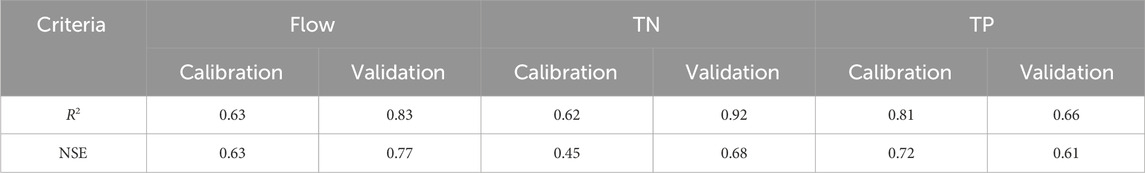
TABLE 6. Calibration and validation results represented in model performance measures of R2 and NSE.
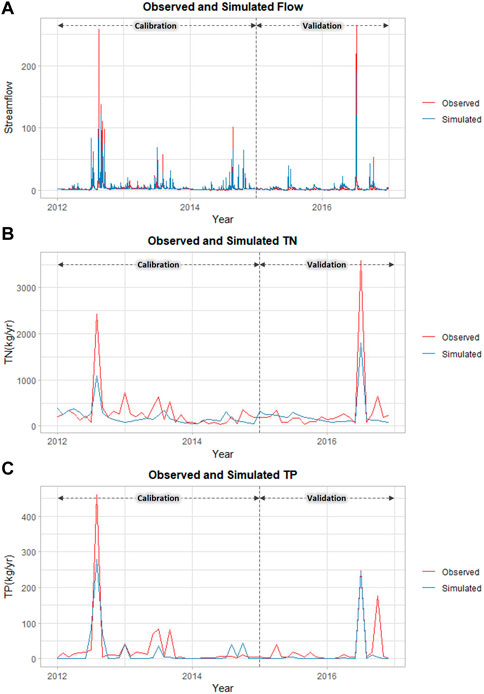
FIGURE 2. Observed and simulated (A) streamflow, (B) TN loads, and (C) TP loads.
However, an intriguing observation arose from the results, showing higher statistical indicators for streamflow and TN during the validation period compared to the calibration period. This uncommon phenomenon can be attributed to the dataset’s characteristics, notably the relative scarcity of extreme rainfall events during the validation period. These extreme events typically lead to underestimations of streamflow and nutrient loads. This improvement in model performance during the validation period highlights the complex interplay between climate conditions and model sensitivity. Precipitation intensity and duration, which play a pivotal role in nutrient transport, influence the model’s ability to accurately simulate these processes (Kim and Lee, 2008; Qiu and Wang, 2014).
Additionally, the occurrence of peak TN and TP loads following heavy rainfall events underscores the significance of surface runoff in nutrient transport. Heavy rainfall events generate substantial runoff, resulting in elevated TN and TP loads in water bodies (Lee et al., 2020). This observation accentuates the importance of targeted management practices to mitigate nutrient pollution, especially in areas prone to intense precipitation.
3.2 Efficiency of BMPs on reducing NPS pollutants
During the 10-year simulation period (2011–2020), the annual average TN and TP loads from the final outlet of the watershed and reduction efficiencies of the three BMP scenarios in comparison with the baseline are presented in Figure 3. These results clearly indicate the substantial effectiveness of VFS and wetlands in reducing nutrient loads within the study area.
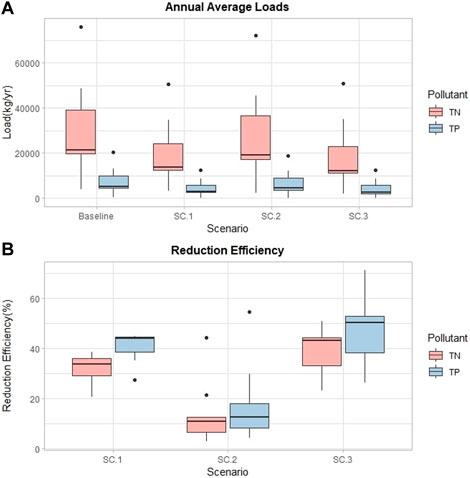
FIGURE 3. Effectiveness of BMPs represented by the (A) annual average loads and (B) reduction efficiency.
In the baseline scenario, the average annual TN and TP loads were approximately 29.8 t and 7.6 t, respectively. Implementing SC.1, which involved the application of VFS, led to a notable reduction in nutrient loads. The average TN and TP loads decreased significantly to 19.9 t and 4.6 t, respectively. The reduction efficiency of VFS for TN ranged from 20.6% to 38.6%, with an average of 31.8%, while that for TP ranged from 27.4% to 45.0%, with an average of 40.8%. These results emphasize the considerable impact of VFS in mitigating both TN and TP loads.
In SC.2, where wetlands were applied, the average loads were reduced to 27.3 t for TN and 6.8 t for TP. The reduction efficiency of wetlands exhibited variability, ranging from 2.9% to 44.3% for TN and 4.5%–54.7% for TP, with average values of 13.7% and 17.9%, respectively. It is important to note that all wetlands still contributed to reducing nutrient loads, albeit to a less extent compared to VFS. The interaction between these two BMPs was notably different in terms of their effect on TN and TP loads.
The scenario in which both VFS and wetlands were applied together, SC.3, yielded the most effective reduction, with average TN and TP loads reduced to 19.2 t and 4.5 t, respectively. The TN reduction rate ranged from 23.3% to 50.9%, with an average of 39.2%, while the TP reduction rate ranged from 26.5% to 71.4%, with an average of 47.6%. Remarkably, combining these two management practices resulted in the highest efficiency in reducing TN and TP loads.
The results illustrate the substantial effectiveness of VFS and wetlands in reducing nutrient loads within the study area. VFS, characterized by their ability to promote infiltration and nutrient absorption, excel during less intense rainfall events, leading to notable reductions in both TN and TP loads. Wetlands, on the other hand, shine in their capacity to store runoff and facilitate sedimentation and nutrient adsorption, particularly during periods of substantial precipitation. However, when these two BMPs are implemented together, as in SC.3, a synergistic effect emerges, resulting in the highest overall reduction efficiency for TN and TP loads. This synergy underscores the potential benefits of employing multiple BMPs in watershed management strategies, particularly in regions characterized by diverse precipitation patterns and runoff dynamics.
Understanding the specific characteristics of a target area, such as its climate and hydrological conditions, is crucial for optimizing BMP selection. The choice between VFS and wetlands, or their combination, should be tailored to the area’s characteristics. In regions with frequent heavy rainfall events, the concurrent implementation of VFS and wetlands (SC.3) can be particularly advantageous in achieving the most effective reduction in nutrient.
3.3 Reduction efficiency of BMPs under climate change conditions
To investigate the future performance of the three BMP scenarios under changing climatic conditions, annual average TN loads were simulated over an 80-year period, spanning from 2021 to 2,100, considering four SSP scenarios: SSP1-2.6, SSP2-4.5, SSP3-7.0, and SSP4-8.5. The simulation results were analyzed for four distinct 20-year intervals: 2021–2040, 2041–2060, 2061–2080, and 2081–2,100.
The results reveal dynamic variations in TN reduction efficiency within each BMP scenario over time and across different SSP scenarios (Figure 4). Notably, SC.3, involving the combination of VFS and wetlands, consistently demonstrated the highest reduction efficiency across all SSP scenarios. In contrast, SC.2, which solely employed wetlands, exhibited the lowest efficiency. Remarkably, regardless of the degree of climate change represented by the SSP scenarios, the pollutant reduction efficiency of SC.1 and SC.3 displayed an upward trend towards the distant future, while SC.2 witnessed a marginal decline over time.
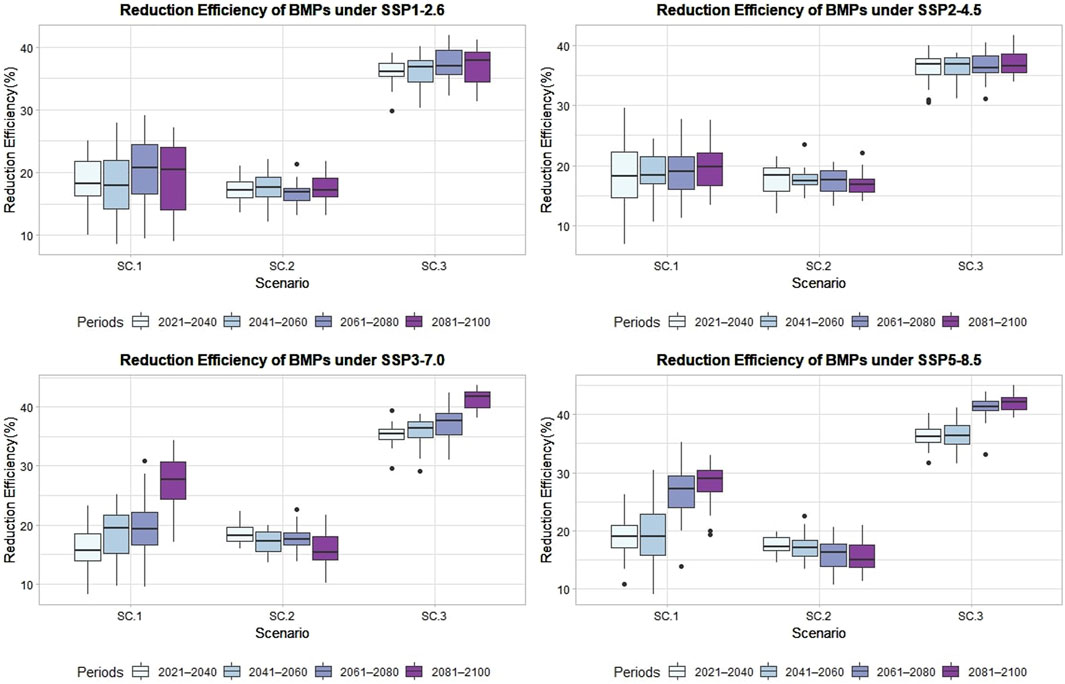
FIGURE 4. Reduction efficiency of BMPs under different climate change scenarios represented by SSP1-2.5, SSP2-4.5, SSP3-7.0, and SSP5.8.5.
The amplified increase in the efficiency of SC.1 and SC.3, particularly under the more severe climate change scenarios, underscores the influence of different SSP assumptions. SSP1-2.6, characterized by proactive greenhouse gas reduction measures, anticipates relatively stable climate change patterns. Conversely, SSP5-8.5 represents the worst-case scenario, characterized by extensive fossil-fuel-based development, resulting in high erratic climate fluctuations. The widening disparity in reduction efficiency between near and distant futures can be attributed to these diverse SSP assumptions.
To provide context for these findings, a comparison was conducted between the reduction efficiencies achieved under changing climate conditions and those observed under the current climate conditions in the watershed. Under the present climate, the 10-year average TN reduction efficiency stands at 31.8% for SC.1, 13.7% for SC.2, and 39.2% for SC.3. Interestingly, as climate change progressed, the relative performance of the BMP scenarios remained consistent. For instance, in the SSP5-8.5 scenario for the period 2081–2,100, TN reduction efficiency was measured at 27.97% for SC.1, 15.81% for SC.2, and 41.88% for SC.3. This observation suggests that SC.3, characterized by the combination of VFS and wetlands, consistently outperformed other scenarios in terms of reducing nutrient pollutant loads.
In practical terms, these findings highlight the importance of tailoring BMP selection not only to current hydrological and climatic conditions but also to expected future climate scenarios. SC.3, the combined use of VFS and wetlands, emerges as a robust choice, offering consistent performance across diverse climate change scenarios. This underscores the adaptability and reliability of natural-based solutions in mitigating non-point source pollution in a changing climate.
Moreover, these results underscore the need for informed decision-making when implementing BMPs, considering regional climate characteristics, and accounting for potential climate change impacts. This study provides valuable insights for watershed managers and policymakers seeking effective strategies to combat nutrient pollution in the face of a changing climate. It emphasizes that, in addition to achieving numerical reductions in pollutant loads, BMP selection should be guided by the resilience and versatility of these solutions in varying climatic conditions.
By understanding the interaction between BMPs and climate change, stakeholders can make informed choices that promote sustainable watershed management, ultimately benefiting both aquatic ecosystems and human communities reliant on clean water resources.
4 Discussion
This section delves into the nuanced analysis, extending beyond aggregated results, to focus on the specific outlets of distinct subbasins where various BMPs were hypothetically implemented (Figure 5). The unique approach connects BMP efficiencies with subbasin characteristics in the dynamic context of South Korea’s landscape, offering innovative insights into localized impacts and shedding light on the effectiveness of BMPs in mitigating NPS pollutants, particularly TN and TP loads.
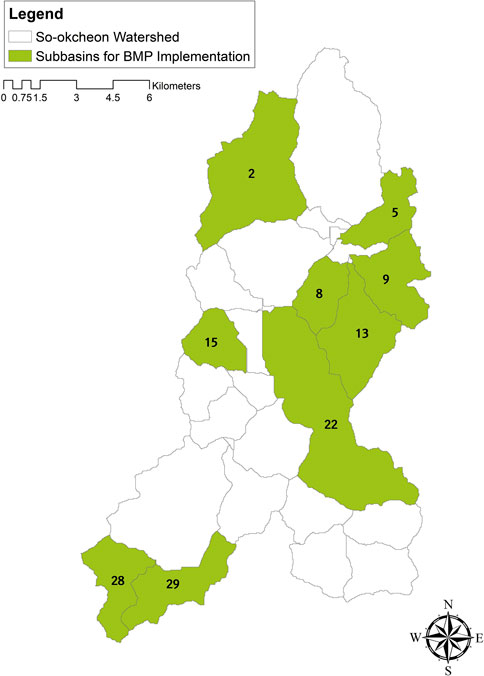
FIGURE 5. Subbasins for BMP implementation.
The study’s innovation lies in the comprehensive examination of localized impacts and the synergistic effects of BMPs. This approach goes beyond existing simulation studies on BMP efficiencies, particularly in the South Korean landscape, where few studies have explored the intricate dynamics of pollutant behavior within the broader hydrological context. The scarcity of research that connects BMP efficiencies to subbasin characteristics in South Korea underscores the distinctive contribution of this study.
Table 7 serves as a comprehensive overview, delineating key features of each subbasin such as land use percentages and slope gradients. These features form the basis for a detailed analysis of how distinct landscape attributes influence BMP performance in reducing nutrient loads. The annual TN and TP reduction efficiencies of BMP scenarios in each subbasin, presented in the table, offer localized insights into the outcomes of watershed management strategies.
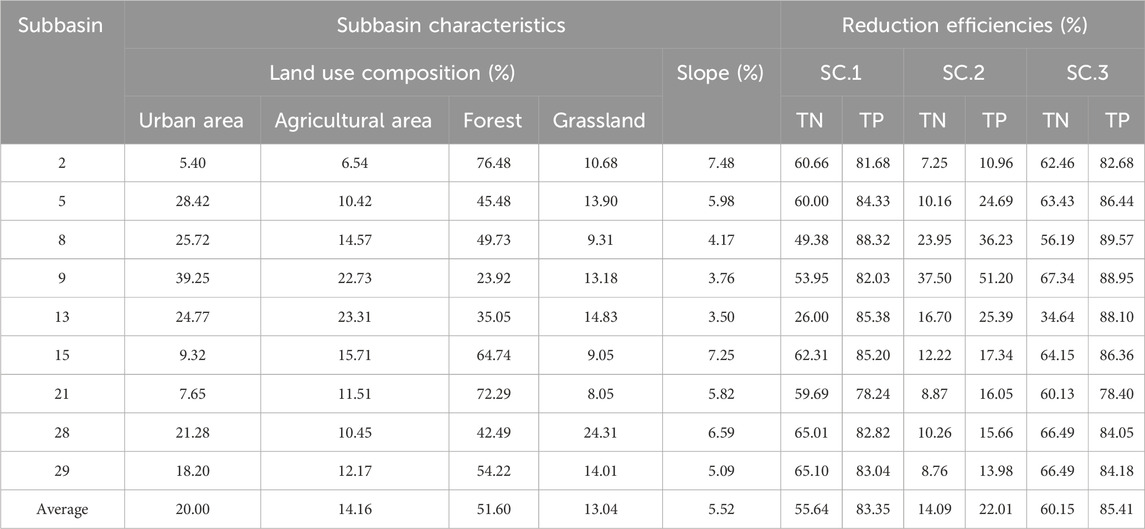
TABLE 7. Subbasin characteristics and BMP efficiency.
In the comprehensive analysis, a consistent observation emerged: employing a combined application of VFS and wetlands resulted in higher annual reduction efficiency across all subbasins compared to individual facility applications. The nuances and variations observed among subbasins and BMP scenarios led to insightful findings, emphasizing the significance of local nuances in shaping the outcomes of watershed management strategies.
Examining Subbasins 8, 9, and 13 provided compelling insights into the interplay of land characteristics and BMP effectiveness. Despite a notable urban presence in these subbasins (ranging from 24.77% to 39.25%), lower slopes proved pivotal in enhancing the performance of wetlands in reducing both TN and TP loads. Significant wetlands reduction efficiencies were observed (TN: 16.7%, 23.95%, 37.50%; TP: 36.23%, 51.20%, 25.39%), surpassing watershed averages and emphasizing the synergistic impact of wetland implementation in areas of lower slopes. Moreover, in Subbasin 13, distinguished by high proportions of agricultural areas (23.31%), particularly rice paddies, challenges in achieving TN reduction through VFS were evident. The observed low efficiency (26% compared to the average of 55.64% in all subbasins) underscores the specific challenges in using VFS for nitrogenous pollutant removal in regions dominated by rice paddies. VFS mechanisms, primarily sediment filtration and vegetation uptake, may face limitations in addressing the unique characteristics of nitrogen runoff from rice fields.
The reduction efficiencies in Subbasins 2, 15, and 21, each featuring forest cover exceeding 60%, demonstrated a noteworthy trend. In these areas, the BMP scenario combining VFS and wetlands emerged as the most effective in reducing nutrient loads. What is particularly notable is the minimal difference in reduction efficiencies between employing VFS alone and the combined VFS and wetlands scenario for both TN and TP in these subbasins. This observation suggests that, while the combined scenario yielded the best results in terms of pollutant reduction, economic considerations may become a significant factor when deciding on facility combinations over specific areas. For instance, in Subbasin 21, efficiencies for TN were 59.69% with VFS alone and 60.13% with the combination of VFS and wetlands. Similarly, for TP, efficiencies were 78.24% with VFS alone and 78.40% with the combined VFS and wetlands scenario. These minimal differences prompt a thoughtful consideration of cost-effectiveness when implementing BMP combinations, especially in subbasins where disparities between scenarios are the smallest.
These findings underscore the need for site-specific and targeted approaches to ensure effective NPS pollution mitigation, emphasizing the significance of local nuances in shaping the outcomes of watershed management strategies. While the study provides valuable insights, it is essential to acknowledge limitations. Notably, a detailed cost-effectiveness analysis was not conducted, opening avenues for future research to delve deeper into the economic implications of implementing BMP combinations in specific subbasins.
5 Conclusion
This study aimed to assess the efficiency of BMPs in controlling NPS pollution, particularly TN and TP, under current and future climate conditions in the context of South Korea. Three BMP scenarios, involving the application of VFS and wetlands individually and in combination, were established. The results revealed that the combined application of VFS and wetlands outperformed individual BMPs, showcasing a synergistic effect that addressed each BMP’s limitations. This dynamic interplay proved effective in navigating the complexities of urban and agricultural landscapes and the pronounced seasonality of precipitation in South Korea.
In response to SSP scenarios, this study verified changes in NPS pollution reduction attributable to climate change. The intensification of climate change and the progression into the future accentuated differences in reduction efficiency among BMP scenarios. Notably, the study observed a continuation of the trends identified under current climate conditions, offering insights into the challenges posed by evolving climate patterns.
The findings of this study carry significant implications for tailored BMP strategies in the South Korean context. The combined application of VFS and wetlands demonstrated superior efficiency under both current and future climate conditions, providing robust evidence to support water quality management goals in the watershed. Furthermore, the study underscores the adaptability and reliability of natural-based solutions in mitigating NPS pollution, particularly in complex urban-agricultural landscapes prevalent in South Korea.
Practically, the study recommends that BMP selection align not only with existing hydrological and climatic conditions but also with anticipated future climate scenarios. This commitment to addressing the evolving challenges posed by climate change emphasizes the importance of informed decision-making when implementing BMPs. These insights cater to watershed managers and policymakers seeking effective strategies to combat nutrient pollution within South Korea’s unique landscape.
Recognizing and addressing the study’s limitations is pivotal. While the analyzed BMP scenarios yield valuable insights, there is room for future research to broaden its perspective by including diverse BMP types and delving deeper into specific watershed characteristics. For instance, a more nuanced exploration of attributes like the specific locations or layout of NPS elements, such as agriculture and urban areas, could provide a more comprehensive understanding. Furthermore, the economic dimensions of implementing and managing BMPs should be integral considerations when determining optimal strategies for NPS pollution reduction, as previously discussed. Acknowledging these limitations not only facilitates a clearer understanding of the research scope but also lays the groundwork for future investigations to optimize BMP selection and management practices. This is particularly pertinent for policymakers and practitioners, underscoring the need for an in-depth cost-effectiveness analysis. Such an analysis is not just a theoretical exercise but a practical necessity for well-informed decision-making, aligning economic considerations with sustainable and effective BMP strategies for NPS pollution mitigation.
In conclusion, this study bridges a critical gap in understanding BMP efficiency within the complex dynamics of South Korea’s urban-agricultural landscapes, offering a foundation for region-specific ecological restoration strategies. The identified trends and synergies among BMPs not only contribute to the scientific discourse but also provide actionable insights for sustainable water resource management in the face of a changing climate.
Data availability statement
The original contributions presented in the study are included in the article/Supplementary Material, further inquiries can be directed to the corresponding authors.
Author contributions
YK: Formal Analysis, Investigation, Methodology, Validation, Visualization, Writing–original draft. JY: Conceptualization, Formal Analysis, Investigation, Methodology, Writing–review and editing. SL: Supervision, Writing–review and editing. SJ: Funding acquisition, Supervision, Writing–review and editing.
Funding
The author(s) declare financial support was received for the research, authorship, and/or publication of this article. This work was supported by the Korea Environment Industry and Technology Institute (KEITI) through the Decision Support System Development Project for Environmental Impact Assessment, funded by the Korea Ministry of Environment (MOE) (Grant No. 2020002990009). This work was supported by the 2023 Research Fund of the University of Seoul for Sangchul Lee.
Conflict of interest
The authors declare that the research was conducted in the absence of any commercial or financial relationships that could be construed as a potential conflict of interest.
Publisher’s note
All claims expressed in this article are solely those of the authors and do not necessarily represent those of their affiliated organizations, or those of the publisher, the editors and the reviewers. Any product that may be evaluated in this article, or claim that may be made by its manufacturer, is not guaranteed or endorsed by the publisher.
References
Abbaspour, K. C., Rouholahnejad, E., Vaghefi, S., Srinivasan, R., Yang, H., and Kløve, B. (2015). A continental-scale hydrology and water quality model for Europe: calibration and uncertainty of a high-resolution large-scale SWAT model. J. Hydrology 524, 733–752. doi:10.1016/j.jhydrol.2015.03.027
Abbaspour, K. C., Yang, J., Maximov, I., Siber, R., Bogner, K., Mieleitner, J., et al. (2007). Modelling hydrology and water quality in the pre-alpine/alpine Thur watershed using SWAT. J. Hydrology 333 (2-4), 413–430. doi:10.1016/j.jhydrol.2006.09.014
Adu, J. T., and Kumarasamy, M. V. (2018). Assessing non-point source pollution models: a review. Pol. J. Environ. Stud. 27 (5), 1913–1922. doi:10.15244/pjoes/76497
Arnold, J. G., Moriasi, D. N., Gassman, P. W., Abbaspour, K. C., White, M. J., Srinivasan, R., et al. (2012). SWAT: model use, calibration, and validation. Trans. ASABE 55 (4), 1491–1508. doi:10.13031/2013.42256
Badrzadeh, N., Samani, J. M. V., Mazaheri, M., and Kuriqi, A. (2022). Evaluation of management practices on agricultural nonpoint source pollution discharges into the rivers under climate change effects. Sci. Total Environ. 838, 156643. doi:10.1016/j.scitotenv.2022.156643
Bauwe, A., Eckhardt, K.-U., and Lennartz, B. (2022). Potential of constructed wetlands to reduce nitrate pollution in agricultural catchments. Ecol. Eng. 178, 106597. doi:10.1016/j.ecoleng.2022.106597
Cao, X., Song, C., Xiao, J., and Zhou, Y. (2018). The optimal width and mechanism of riparian buffers for storm water nutrient removal in the Chinese eutrophic Lake Chaohu watershed. Water 10 (10), 1489. doi:10.3390/w10101489
Chaubey, I., Chiang, L., Gitau, M. W., and Mohamed, S. (2010). Effectiveness of best management practices in improving water quality in a pasture-dominated watershed. J. soil water conservation 65 (6), 424–437. doi:10.2489/jswc.65.6.424
Chen, H., Zhou, X., Wang, Y., Wu, W., Cao, L., and Zhang, X. (2023). Study on the planning and influential factors of the safe width of riparian buffer zones in the upper and middle reaches of the Ziwu River, China. Environ. Sci. Pollut. Res. 30, 103703–103717. doi:10.1007/s11356-023-29154-9
Choi, I.-C., Shin, H.-J., Nguyen, T. T., and Tenhunen, J. (2017). Water policy reforms in South Korea: a historical review and ongoing challenges for sustainable water governance and management. Water 9 (9), 717. doi:10.3390/w9090717
Chua, E. M., Wilson, S. P., Vink, S., and Flint, N. (2019). The influence of riparian vegetation on water quality in a mixed land use river basin. River Res. Appl. 35 (3), 259–267. doi:10.1002/rra.3410
Dai, C., Qin, X., Tan, Q., and Guo, H. (2018). Optimizing best management practices for nutrient pollution control in a lake watershed under uncertainty. Ecol. Indic. 92, 288–300. doi:10.1016/j.ecolind.2017.05.016
Hassen, S. M., Gebremariam, B., and Tenagashaw, D. Y. (2022). Sediment yield modeling and evaluation of best management practices using the SWAT model of the Daketa Watershed, Ethiopia. Water Conservation Sci. Eng. 7 (3), 283–292. doi:10.1007/s41101-022-00142-3
Hosseini, S. H., and Khaleghi, M. R. (2020). Application of SWAT model and SWAT-CUP software in simulation and analysis of sediment uncertainty in arid and semi-arid watersheds (case study: the Zoshk–Abardeh watershed). Model. Earth Syst. Environ. 6 (4), 2003–2013. doi:10.1007/s40808-020-00846-2
Kim, B.-J., Kripalani, R., Oh, J.-H., and Moon, S.-E. (2002). Summer monsoon rainfall patterns over South Korea and associated circulation features. Theor. Appl. Climatol. 72, 65–74. doi:10.1007/s007040200013
Kim, H.-R., Yu, S., Oh, J., Kim, K.-H., Lee, J.-H., Moniruzzaman, M., et al. (2019). Nitrate contamination and subsequent hydrogeochemical processes of shallow groundwater in agro-livestock farming districts in South Korea. Agric. Ecosyst. Environ. 273, 50–61. doi:10.1016/j.agee.2018.12.010
Kim, N. W., and Lee, J. (2008). Temporally weighted average curve number method for daily runoff simulation. Hydrological Process. Int. J. 22 (25), 4936–4948. doi:10.1002/hyp.7116
Kim, Y., Yu, J., Lee, K., Chung, H. I., Sung, H. C., and Jeon, S. (2021). Impact assessment of climate change on the near and the far future streamflow in the Bocheongcheon Basin of Geumgang river, South Korea. Water 13 (18), 2516. doi:10.3390/w13182516
Lee, S., McCarty, G. W., Moglen, G. E., Li, X., and Wallace, C. W. (2020). Assessing the effectiveness of riparian buffers for reducing organic nitrogen loads in the Coastal Plain of the Chesapeake Bay watershed using a watershed model. J. Hydrology 585, 124779. doi:10.1016/j.jhydrol.2020.124779
Leh, M. D., Sharpley, A. N., Singh, G., and Matlock, M. D. (2018). Assessing the impact of the MRBI program in a data limited Arkansas watershed using the SWAT model. Agric. Water Manag. 202, 202–219. doi:10.1016/j.agwat.2018.02.012
Li, Y., Wang, H., Deng, Y., Liang, D., Li, Y., and Shen, Z. (2022). How climate change and land-use evolution relates to the non-point source pollution in a typical watershed of China. Sci. Total Environ. 839, 156375. doi:10.1016/j.scitotenv.2022.156375
Liu, X., Zhang, Y., Li, Z., Li, P., Xu, G., Cheng, Y., et al. (2021). Response of water quality to land use in hydrologic response unit and riparian buffer along the Dan River, China. Environ. Sci. Pollut. Res. 28, 28251–28262. doi:10.1007/s11356-021-12636-z
Liu, Y., Li, H., Cui, G., and Cao, Y. (2020). Water quality attribution and simulation of non-point source pollution load flux in the Hulan River basin. Sci. Rep. 10 (1), 3012. doi:10.1038/s41598-020-59980-7
Liu, Y., Xu, Y., Zhao, Y., and Long, Y. (2022). Using SWAT model to assess the impacts of land use and climate changes on flood in the upper Weihe river, China. Water 14 (13), 2098. doi:10.3390/w14132098
Malik, M. A., Dar, A. Q., and Jain, M. K. (2022). Modelling streamflow using the SWAT model and multi-site calibration utilizing SUFI-2 of SWAT-CUP model for high altitude catchments, NW Himalaya's. Model. Earth Syst. Environ. 8, 1203–1213. doi:10.1007/s40808-021-01145-0
Moriasi, D. N., Gitau, M. W., Pai, N., and Daggupati, P. (2015). Hydrologic and water quality models: performance measures and evaluation criteria. Trans. ASABE 58 (6), 1763–1785. doi:10.13031/trans.58.10715
Neitsch, S. L., Arnold, J. G., Kiniry, J. R., and Williams, J. R. (2011). Soil and water assessment tool theoretical documentation version 2009. College Station, TX: Texas Water Resources Institute.
Nie, J., Feng, H., Witherell, B. B., Alebus, M., Mahajan, M. D., Zhang, W., et al. (2018). Causes, assessment, and treatment of nutrient (N and P) pollution in rivers, estuaries, and coastal waters. Curr. Pollut. Rep. 4, 154–161. doi:10.1007/s40726-018-0083-y
O’Neill, B. C., Kriegler, E., Riahi, K., Ebi, K. L., Hallegatte, S., Carter, T. R., et al. (2014). A new scenario framework for climate change research: the concept of shared socioeconomic pathways. Clim. change 122, 387–400. doi:10.1007/s10584-013-0905-2
Park, H. S., Yoon, S. W., Chung, S. W., and Hwang, H. S. (2016). Effect of pollutants control measures in So-oak watershed on the control of algae growth in Daecheong Reservoir. J. Environ. Impact Assess. 25 (4), 248–260. doi:10.14249/eia.2016.25.4.248
Qi, J., Zhang, X., Lee, S., Moglen, G. E., Sadeghi, A. M., and McCarty, G. W. (2019). A coupled surface water storage and subsurface water dynamics model in SWAT for characterizing hydroperiod of geographically isolated wetlands. Adv. Water Resour. 131, 103380. doi:10.1016/j.advwatres.2019.103380
Qiu, J., Shen, Z., Chen, L., and Hou, X. (2019). Quantifying effects of conservation practices on non-point source pollution in the Miyun Reservoir Watershed, China. Environ. Monit. Assess. 191, 582–621. doi:10.1007/s10661-019-7747-y
Qiu, Z., and Wang, L. (2014). Hydrological and water quality assessment in a suburban watershed with mixed land uses using the SWAT model. J. Hydrologic Eng. 19 (4), 816–827. doi:10.1061/(asce)he.1943-5584.0000858
Ramesh, R., Kalin, L., Hantush, M., and Chaudhary, A. (2021). A secondary assessment of sediment trapping effectiveness by vegetated buffers. Ecol. Eng. 159, 106094. doi:10.1016/j.ecoleng.2020.106094
Uniyal, B., Jha, M. K., Verma, A. K., and Anebagilu, P. K. (2020). Identification of critical areas and evaluation of best management practices using SWAT for sustainable watershed management. Sci. Total Environ. 744, 140737. doi:10.1016/j.scitotenv.2020.140737
Wan, L., Wang, X. H., and Peirson, W. (2022). Impacts of climate change and non-point-source pollution on water quality and algal blooms in the Shoalhaven River estuary, NSW, Australia. Water 14 (12), 1914. doi:10.3390/w14121914
Yang, J., Reichert, P., Abbaspour, K. C., Xia, J., and Yang, H. (2008). Comparing uncertainty analysis techniques for a SWAT application to the Chaohe Basin in China. J. Hydrology 358 (1-2), 1–23. doi:10.1016/j.jhydrol.2008.05.012
Yeo, I.-Y., Lang, M. W., Lee, S., McCarty, G. W., Sadeghi, A. M., Yetemen, O., et al. (2019). Mapping landscape-level hydrological connectivity of headwater wetlands to downstream waters: a geospatial modeling approach-Part 1. Sci. Total Environ. 653, 1546–1556. doi:10.1016/j.scitotenv.2018.11.238
Keywords: best management practices, nature-based solutions, reduction efficiency, climate change, NPS control
Citation: Kim Y, Yu J, Lee S and Jeon S (2024) Efficiency analysis of best management practices under climate change conditions in the So-okcheon watershed, South Korea. Front. Environ. Sci. 12:1297289. doi: 10.3389/fenvs.2024.1297289
Received: 19 September 2023; Accepted: 17 January 2024;
Published: 21 February 2024.
Edited by:
Zhihao Xu, Guangdong University of Technology, ChinaReviewed by:
Saeid Janizadeh, University of Hawaii, United StatesXiaoxin Zhang, Huaiyin Normal University, China
Copyright © 2024 Kim, Yu, Lee and Jeon. This is an open-access article distributed under the terms of the Creative Commons Attribution License (CC BY). The use, distribution or reproduction in other forums is permitted, provided the original author(s) and the copyright owner(s) are credited and that the original publication in this journal is cited, in accordance with accepted academic practice. No use, distribution or reproduction is permitted which does not comply with these terms.
*Correspondence: Sangchul Lee, c2xlZTIwMjBAdW9zLmFjLmty; Seongwoo Jeon, ZWVwcHNfa29yZWFAa29yZWEuYWMua3I=