 Mingxing Zhong
94% of researchers rate our articles as excellent or good
Learn more about the work of our research integrity team to safeguard the quality of each article we publish.
Find out more
ORIGINAL RESEARCH article
Front. Environ. Sci., 11 January 2024
Sec. Environmental Informatics and Remote Sensing
Volume 12 - 2024 | https://doi.org/10.3389/fenvs.2024.1285679
This article is part of the Research TopicNew Insights and Advancement of Land Use Analytics in Modern City DevelopmentView all 4 articles
Urban agglomeration is the highest stage of urban development, which reasonable planning will be conducive to the rapid and healthy development of the regional economy. However, in recent years, unreasonable urban agglomeration planning has changed landscape patterns and brought huge challenges to ecosystem services. Moreover, there is currently a lack of understanding of the relationship between landscape patterns and ecosystem services, especially in the process of urban agglomeration construction. In this study, we attempt to reveal the impact of landscape patterns on ecosystem services value (ESV) based on many years of remote sensing data in the Central Plains Urban Agglomeration (CPUA). The results show that landscape patterns have significant spatiotemporal evolution characteristics, and there are significant differences between different landscape patterns in the CPUA. Moreover, most of landscape patterns show significant east-west differences. Total ESV has decreased from USD 838.53 million in 2000 to USD 792.32 million in 2018. From a spatial perspective, the areas with high ESV are mostly distributed in the western mountainous and southern hilly areas, but low ESV area are mainly concentrated in the central and northern plains. In addition, the results of model analysis reveal that there is a remarkable positive correlation between ESV and patch density, interspersion juxtaposition index, cohesion index, and splitting index, but a remarkable negative correlation between ESV and total edge. These results provide critical guidance and suggestions for the improvement of future urban agglomeration construction.
Terrestrial ecosystem provides essential food, water, and materials for human production and life, and is crucial for maintaining the normal operation of all life systems on Earth (Xue et al., 2023). Terrestrial ecosystem not only provides the necessary material foundation for human production and life, but also serves as the fundamental unit of material circulation and energy flow in nature (Costanza et al., 1997; Daily, 1997). However, the intensifying human activities have brought many negative impacts on ecosystem, such as soil erosion, water pollution, and decreased biodiversity. Especially in densely populated areas, the impact of human activities (such as urbanization) on ecosystems is more complex. Therefore, quantitative analysis of ecosystem services and assessment of human activity intensity, as well as determination of regional ecosystem security, are of great significance for sustainable development.
Ecosystem services relate to the benefits that human beings derive from various processes and functions of an ecosystem, which has attracted the attention of many ecologists and economists (Costanza et al., 1997; Chen et al., 2021; Wei et al., 2023). Ecosystem services not only have important environmental value, but are closely related to human health (Costanza et al., 1997; Xie et al., 2015). As a bridge between human beings and nature, assessing ecosystem services is critical to understanding the relationship between human wellbeing and ecosystems and then implementing in a mutually beneficial manner. Therefore, ecosystem services are important because they not only provide benefits for individual utility and economic development but also serve as a link between human beings and nature.
Urbanization, in which natural and seminatural land-use types will be significantly transformed into urban land use types (such as, commercial lands, industrial production, and residential) is an inexorable trend in the 21st century, especially in China (Chen et al., 2023a). In the past 40 years, there has been undergoing an astonishing development process of cities in China, during which the level of national urbanization rose from 17.9% to 65.22% from 1978 to 2022. The increase in urbanization will inevitably lead to the expansion of urban, thereby largely driving changes in land use/cover type and landscape, and affecting ecosystem services and the ecological environment (Wang et al., 2019; Chen et al., 2023a). Another result of urban expansion is the increasingly close cooperation between neighboring urban, especially those that were originally closer together. In order to further enhance coordinate regional development, the country has carried out urban agglomeration construction (Fang et al., 2005). Many studies have concentrated on the temporal and spatial distribution, and trade-off relationships of ecosystem services of urban agglomerations (Zhang et al., 2021a; Zhou et al., 2023). For example, most studies indicate that ESV is in a declining trend with the development of urban agglomerations and showed a strong spatial correlation (Chen et al., 2022b; Zhou et al., 2023). Moreover, this decreasing trend is influenced by various factors, such as land use/cover, population, social and political factors (Luo et al., 2020). Generally, land use/cover are the most important factors affecting ESV in urban agglomeration (Ouyang et al., 2021; Yang et al., 2021). However, how to refine the effect of land use/cover type on ecosystem services in urban agglomerations will be helpful to propose proactive ecological protection strategies and further improve ESV.
Although human geographers discussed the concept of landscape as early as the 1990s, there are still many explanations of the term “landscape” (Keisteri et al., 1990; Bastian et al., 2014; Zhou et al., 2019). The impression of landscape pattern defined by European Landscape Convention is more commonly used, which is “Landscape means an area, as perceived by people, whose character is the result of the action and interaction of natural and/or human factors”. Landscapes contain complex temporal and spatial distribution dynamic characteristics in resource allocation. Landscape is a mosaic, consisting of various land use type or heterogeneous regions composed of multifarious ecosystems (Turner, 1989; Liu et al., 2020). Therefore, many ecological economists use the number, proportion, area, shape, and spatial distribution that make up ecosystems or land use/cover types to estimate landscape pattern (Liu et al., 2020; Abdollahi et al., 2023). In the process of rapid urban expansion, land use/cover types are constantly undergoing significant changes, which in turn affect the landscape pattern (Dadashpoor et al., 2019; Guo et al., 2021). The landscape pattern can better indicate the effect of urban agglomeration construction on land use/cover type. For example, many studies have shown that urban agglomeration construction increases the complexity and aggregation of landscape, while also leading to fragmentation and reduced connectivity of landscape (Wu et al., 2023).
The change in landscape pattern not only represents the process of material circulation and energy flow between human systems and natural ecosystems, but also has a remarkable impact on the structure, composition, and function of natural ecosystems, resulting in changes in ecosystem services (Kertész et al., 2019; Liu et al., 2020; Zhao et al., 2023). Previous extensive studies have examined that the close correlation between landscape pattern changes and ecosystem, economic, social, and ecological values from the perspectives of countries, watersheds, provinces, cities (Liu et al., 2022; Bian et al., 2023; Chen et al., 2023c; Zhao et al., 2023). With the development of urbanization, more and more urban agglomeration construction has entered national planning (Ouyang and Li, 2023). For example, the Beijing Tianjin Hebei, Yangtze River Delta, and Pearl River Delta are the earliest urban agglomerations and have become the main spatial carriers of urbanization in China (Fang and Yu, 2017). Especially in the early stages of urban agglomeration construction, the rapid improvement of urbanization brought significant ecological challenges (Tian et al., 2020; Chen et al., 2023b), which destroyed ecosystems through the expansion of construction land, commercial land, residential land, and occupation of ecological land (Liu et al., 2019; Wu et al., 2022a; Wu et al., 2022b). Considering that a large number of new urban agglomerations are in the stage of formation and development in China, quantifying and analyzing the correlation between the spatiotemporal characteristics of regional ecosystem service and landscape patterns in developing urban agglomerations would provide sufficient information to guide and manage sustainable development strategies, especially in the process of urbanization development.
The rapid urbanization process has significantly changed the landscape pattern, especially in the rapidly developing regions of China. Since the implementation of the “Central Plains Urban Agglomeration Development Plan” in 2016, it has become an important engine for implementing the strategy of improving the rise of the Central Region, promoting the scientific development of the CPUA and creating a new economic growth engine for China. As a developing urban agglomeration, the CPUA should inherit the development advantages of mature urban agglomerations and avoid the drawbacks of traditional urban agglomerations. Therefore, a large amount of research is needed to enhance the advantages of urban agglomeration construction and guide the development of future urban agglomerations. Therefore, this study attempts to reveal the main process that landscape patterns affect the ESV in the CPUA. This study aims to address the following three questions: 1) What are the spatiotemporal characteristics of landscape patterns from 2000 to 2018 in the CPUA? 2) What are the spatiotemporal characteristics of ESV from 2000 to 2018 in the CPUA? 3) How did the changes in landscape pattern affect ESV in the CPUA?
The CPUA (110˚15′ to 118˚10′E, 31˚13′ to 37˚47′N) is located in the central and eastern part of China and acts as a link between the east and the west, thus representing is a critical junction connecting the east and the west. According to “Central Plains Economic Zone Planning (2012–2020)", the CPUA covers five provinces, including Henan, Hebei, Anhui, Shanxi, and Shandong provinces, and a total of 30 cities. The “Opinions of the Central Committee of the Communist Party of China and the State Council on Establishing a New Mechanism for a More Effective Regional Coordinated Development” issued in 2018 by the Central Committee of the Communist Party of China and the State Council, clearly states that Zhengzhou will be the center to lead the development of the CPUA. The total area of the CPUA is 28.66 million km2. At the end of 2017, the total population was CNY 163,531,700, and the gross production value was CNY 67,778.12 billion. The gross production value is second only to the Yangtze River Delta, the Pearl River Delta, and Beijing-Tianjin-Hebei (Fu et al., 2020). The CPUA takes the plain as the main landform, and also includes the western part of the mountain and hilly landform (Figure 1). Rapid connections can be realized to major hub airports in China—Zhengzhou Airport, Luoyang Airport, Nanyang Airport, Xinyang Airport, etc. —and abroad. The development of network-shaped high-speed railway and the modern integrated transportation hub patterns is accelerating, and the three-dimensional integrated transportation network is constantly being improved.
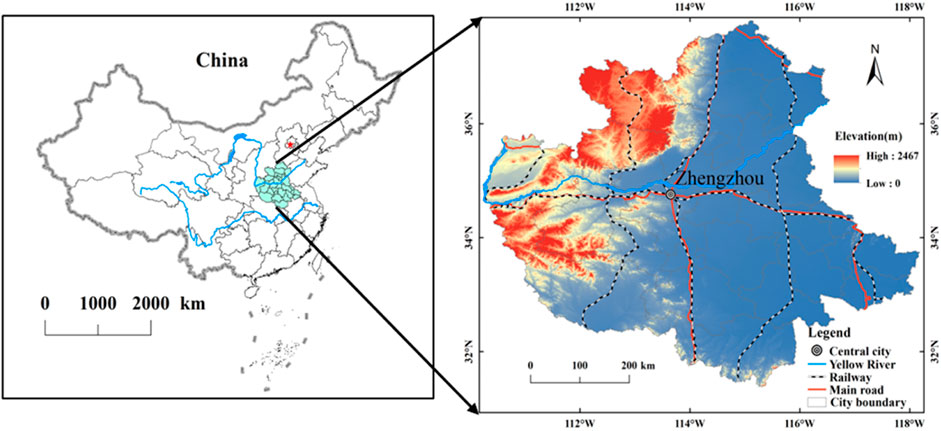
FIGURE 1. Location of the CPUA in China.
The land use database used in this study was acquired from the Data Center for Resources and Environmental Sciences, Chinese Academy of Sciences (http://www.resdc.cn) (Ning et al., 2018). The spatial resolution is 30 m × 30 m. The original land use type of the data including seven primary land-use types and eighteen secondly land-use types. The land-use data in 2000, 2005, 2010, 2015, and 2018 for the area are presented in our study.
Landscape pattern metrics contain rich landscape information, which can not only be used to quantify the structural and composition of the landscape, but also to characterize spatial configuration. To fully understand the spatial pattern of landscape in the CPUA, twenty-one landscape pattern metrics are selected to represent the intricate and complex spatial patterns of landscape. In order to eliminate the redundancy caused by using too many landscape patterns, correlation analysis was conducted in Stata 15.0. Ultimately, eleven landscape pattern were reserved for analysis of ecosystem services drivers, including total edge (TE), patch density (PD), edge density (ED), area-weighted mean patch size (AREA_AM), contagion index (CONTAG), mean in Euclidean nearest neighbor distance (ENN_MN), interspersion juxtaposition index (IJI), splitting index (SPLIT), Shannon’s diversity index (SHDI), cohesion index (COHESION), and Shannon evenness index (SHEI). All the selected metrics are calculated in Fragstats software (version 4.2). The explanations and definitions of the eleven landscape pattern metrics are presented in (McGarigal, 2012).
Costanza et al. (1997) first scientifically defined ESV and methods for its estimation based on 17 ecosystem services of 16 ecosystems in the world. Benefit transfer methods are often used to assess ESV in different land-use types, and varying degrees of research have been conducted by numerous scholars (Xie et al., 2008; Tolessa et al., 2017). Moreover, the methods can objectively show the structures, functions, and ecological benefits of different ecosystems (Costanza et al., 1997; Xie et al., 2008). Although the classifications and equivalent coefficients of ecosystem services proposed by Costanza et al. (1997) are widely used in ecosystem research conducted both in China and abroad, they may not be suitable for the estimation of ESV in China. Xie et al. (2008) revised ecosystem services classifications and equivalent coefficients into four categories and nine subcategories according to the characteristics of ecosystem types in China. The formula (Eq. (1)) for calculation of the overall ESV is:
where ESV indicates the ecosystem services value, Ai indicates the area of ecosystem type i, and VCij indicates the j-th category of the ESV coefficient for the i-th land-use type.
In recent decades, with the acceleration of China’s economy, population, and urbanization, the landscape pattern has also undergone vital changes. Especially in some national urban agglomeration areas, due to the pursuit of faster economic growth and urbanization, the ecological benefits are often ignored, leading to unreasonable urban planning. Unreasonable urban planning can cause serious loss of ecosystem services while destroying the landscape pattern. Therefore, it is important to detect the impact of landscape patterns on the ESV in urban agglomeration. In our earlier study, the effect of landscape pattern on the ESV was measured by fixed- and random-effects models (Chen et al., 2021). The fixed-effects model is suitable for studies with little or no difference between independent studies. The random-effects model is an extension of the classical linear model; The original regression coefficient is considered as a random variable and is typically assumed to originate from a normal distribution (Ibrahim et al., 2011; Chen et al., 2021).
The specific form of the fixed- and random-effects model (Eq. 2) is as follows:
where AESVit represents the average ESV of the i-th unit at time t; α represents the intercept term; β represents the regression coefficient; εit represents the random disturbance terms; δi represents the individual effect; and ηi represents the time effect. In the models, the Hausman test is typically adopted to select either the fixed- or random-effects model.
These landscape pattern have significant spatial distribution patterns in the CPUA (Figure 2). Considering 2018, for example, we found that FD, ED, SPLIT, and SHEI showed larger values in the mountains of the northwest than in the central and southeastern plains. Moreover, the ENN_MN, IJI, and SHDI showed larger values in the south than in the north. However, AREA_AM, CONTAG, and COHESION show the opposite trend, with lower values in the mountains of the northwest than in the central and southeastern plains. Moreover, the TE shows lower values in the central and northeastern areas than in other areas.
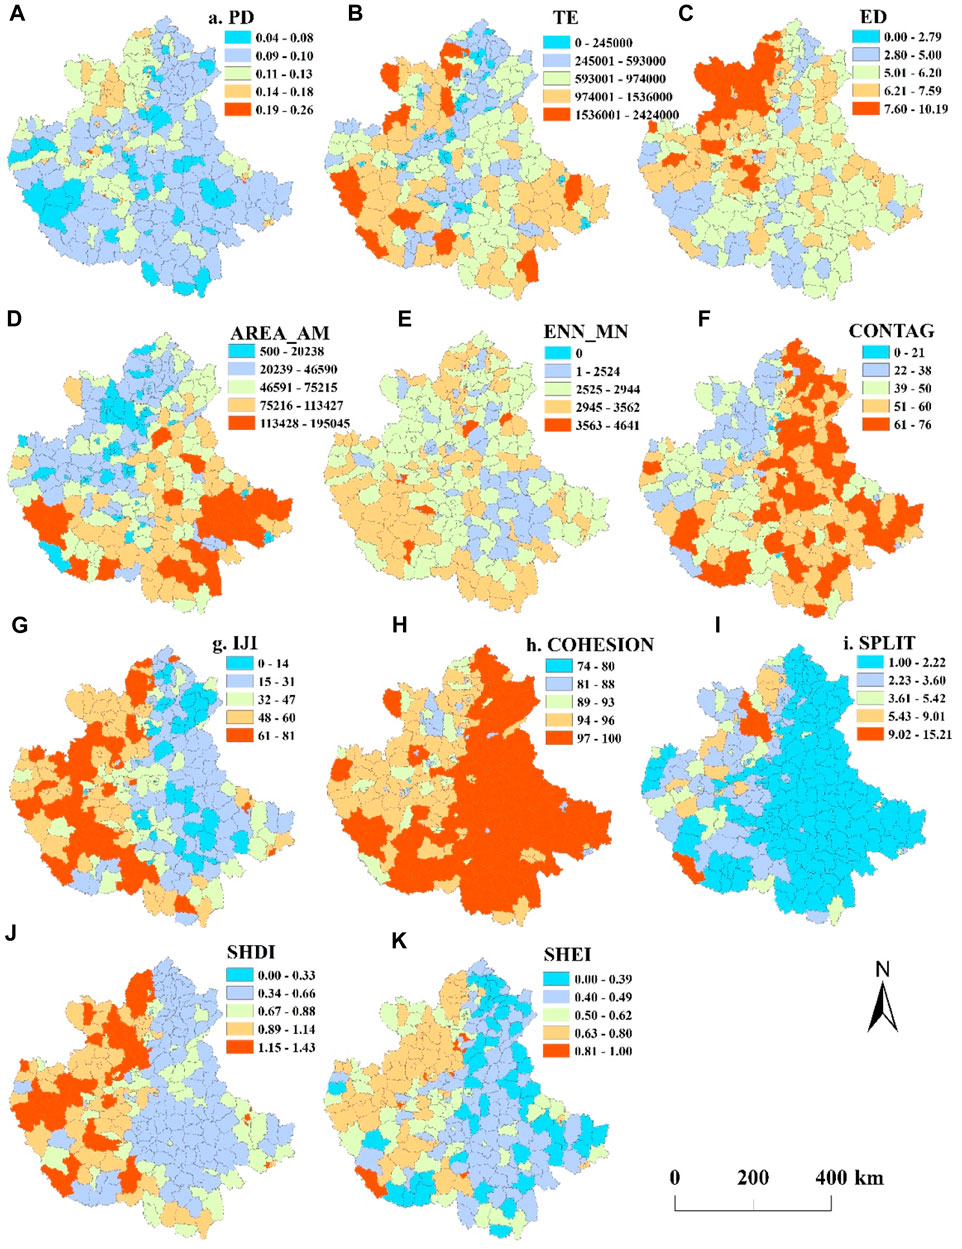
FIGURE 2. Lables (A–K) represent patch density (PD), total edge (TE), edge density (ED), area-weighted mean patch size (AREA_AM), mean in euclidean nearest neighbor distance (ENN_MN), contagion index (CONTAG), interspersion juxtaposition index (IJI), cohesion index (COHESION), splitting index (SPLIT), Shannon’s diversity index (SHDI), and Shannon evenness index (SHEI), respectively.
With the rapid development of urbanization in CPUA, the landscape pattern also undergoes significant changes (Figure 3). The TE, ED, IJI, SPLIT, SHDI, and SHEI are increasing from 2000 to 2018 (Figure 3). Moreover, the increase rate for 2015–2018 is significantly higher than that of the previous period. However, AREA_AM, CONTAG, and COHE-SION decrease from 2000 to 2018; in addition, the decrease rate for 2015–2018 is significantly more pronounced than for the previous period. The PD show a decreasing trend from 2000 to 2015, but a trend of quickly increasing from 2015 to 2018. The ENN_MN shows an increasing trend from 2000 to 2005 and a decreasing trend from 2005 to 2018; moreover, the biggest change occurs between 2015 and 2018. Nine of the eleven landscape patterns showed the greatest change between 2015 and 2018, except CONTAG and COHESION. The changes in these landscape pattern metrics are closely related to the construction and development of the CPUA, especially from 2015 to 2018.
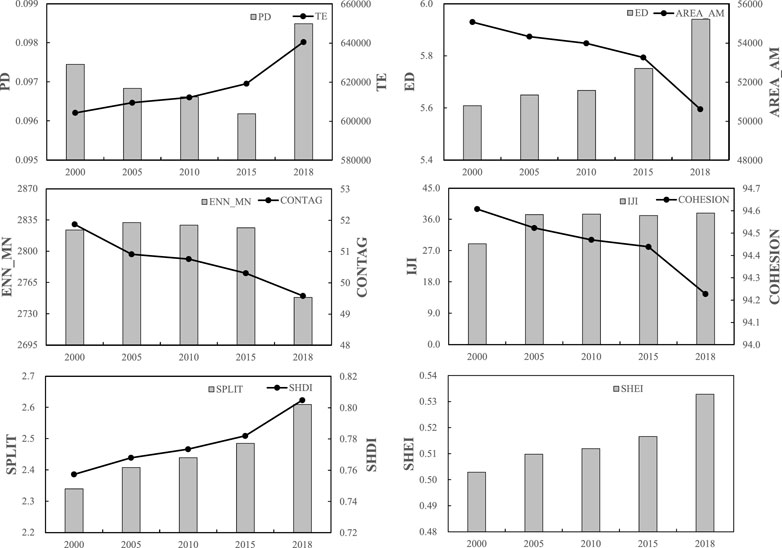
FIGURE 3. Temporal variation of landscape patterns in the CPUA from 2000 to 2018.
The total ESV of the CPUA in 2000, 2005, 2010, 2015, and 2018 was USD 838.53 million, USD 836.56 million, USD 834.08 million, USD 826.91 million, and USD 792.32 million, respectively. Moreover, the reduction in ESV was USD 1.97 million, USD 2.48 million, USD 7.17 million, and USD 34.59 million in 2000–2005, 2005–2010, 2010–2015, and 2015–2018, respectively. These results present strong evidence of the downward trend of ESV during the study period. Moreover, the rate of ESV degradation has been increasing, especially from 2015 to 2018. The ESV of cultivated land contributed the most to the total ESV, exceeding 50%. Construction land provides negative ESV. In addition, the change trends of the ESV of cultivated land and construction land were the same as the change trend of total ESV. The overall spatial distribution of ESV in the CPUA was remained basically stable from 2000 to 2015 (Figure 4). The areas with high ESV are mainly distributed in the western mountainous and southern hilly areas. The areas with low ESV are mainly distributed in the central and northern plains. The units with ESV greater than USD 14.0 million account for over 2.9% of the total units in each year from 2000 to 2018, and there was no significant interannual variation. However, the units with ESV less than USD 1.0 million account for 29.6%, 29.6%, 30.3%, 30.3%, and 32.5% in 2000, 2005, 2010, 2015, and 2018, respectively. These results suggest that the decrease in mean ESV is mainly due to the increase in low value areas of ESV in the central and northern plains.
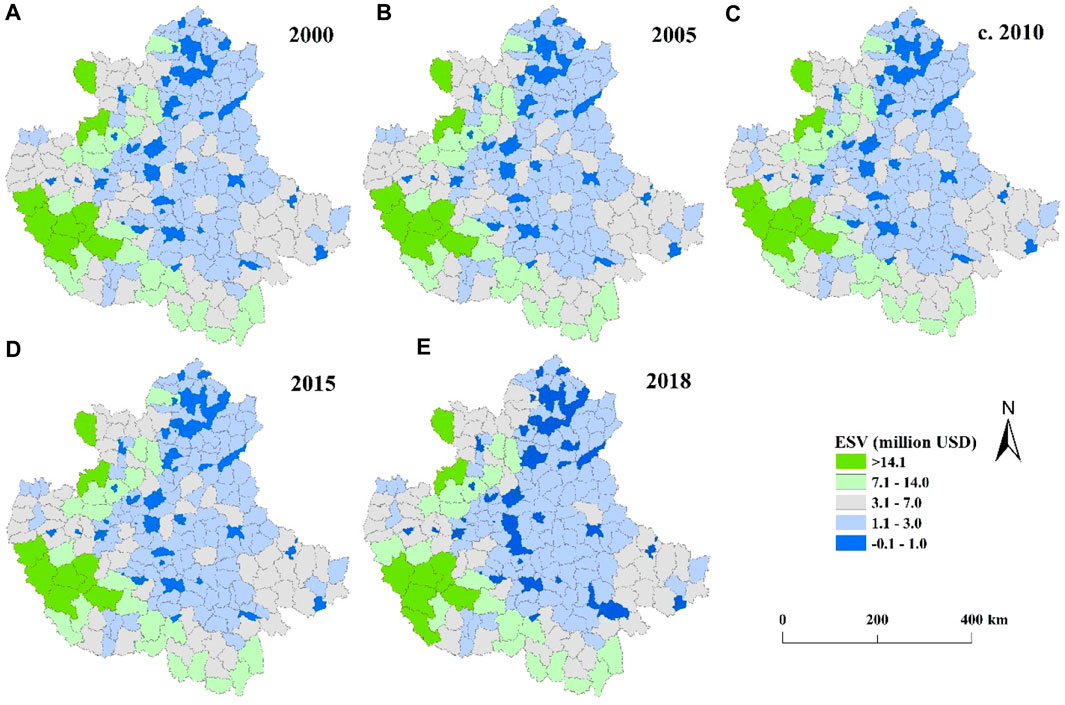
FIGURE 4. Lables (A–E) represent ESV of 2000, 2005, 2010, 2015, and 2018, respectively.
Table 1 shows the results of regression between ESV and landscape patterns in the CPUA. The spatiotemporal regressive coefficient ρ is statistically significant at 0.1%, suggesting the existence of dependence of the ESV. In terms of the spatial association between landscape patterns and ESV, the regression coefficients of PD, IJI, COHESION, SPLIT, and SHDI are significantly positive except in the case of only SHDI. However, regression coefficients of other landscape patterns (TE, ED, AREA_AM, ENN_MN, CONTAG, and SHEI) were negative, but only significantly so in the case of TE. Our results based on the time-period fixed-effects model indicate that ESV is significantly correlated with many landscape patterns. TE and ESV showed the highest correlation (−0.12), followed by SPLIT and ESV (0.05). Based on Time-Period Random-effects model, our results showed a similar relationship between ecosystem services and landscape patterns. Therefore, Therefore, landscape patterns have a significant impact on ESV in the CPUA.
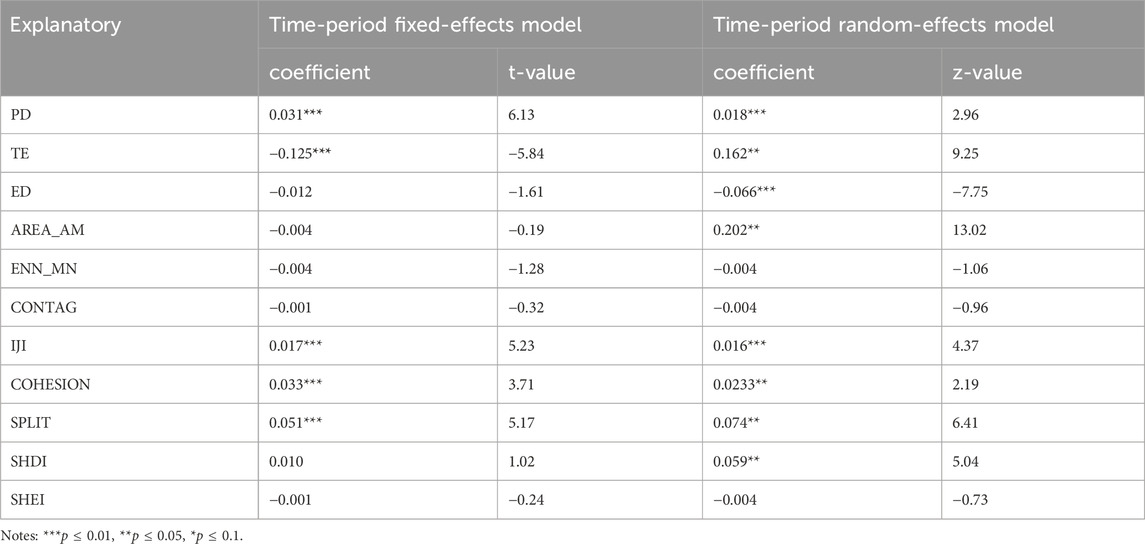
TABLE 1. Regression results for ecosystem services in the CPUA.
Our results indicate that the ESV tends to decreased from 2000 to 2018, consistent with many other previous studies (Su et al., 2020; Sun et al., 2020). In our study, the ESV of total and cultivated land exhibit the fastest decline from 2015 to 2018, faster than in the previous three stages (from 2000 to 2005, 2005 to 2010, 2010–2015). This may be due to the approval of the Central Plains Urban Agglomeration Development Plan in 2016, which accelerated the expansion of urbanization. A large amount of cultivated land is used to plan the construction of new urban areas, rapidly reducing the services functions of the cultivated land ecosystem. With the development of urban, agriculture, forestry, ecological, and wetland landscapes are decreasing and gradually being replaced by urban landscapes, especially in cities undergoing rapid development, such as Beijing (Li et al., 2017), Xining (Wei et al., 2023), and Shanghai (Chen et al., 2022a). Our results showed that ESV decreased more rapidly in the central location of the urban agglomeration (around Zhengzhou). Urban expansion is a critical manifestation of the urbanization, in which the allocation of urban land and multiple other land-use types will also change (Chen et al., 2023a). Coupled with ecological land protection policy and the needs of urban development, construction land is replacing agricultural land. Deng et al. (2015) suggested that rapid urbanization led to an increase in cultivated land loss by 29.2% during the period 2000–2008. Song and Deng (2015) found that urbanization led to agricultural land loss, which, in turn, led to a significant decrease in ecosystem provision services in the North China Plain from 1998 to 2008. With the reduction of agricultural land, the continuous increase in construction land not only affects the stability of the ecosystem but also reduces the ESV (Peng et al., 2017). However, other studies suggest that the trend of ESV is to increase with social development (Jiang et al., 2020). It is worth noting that the obtained results may vary greatly due to the different methods used for ESV estimation. Estimation of ESV as units of currency is affected by different factors, such as market price, value coefficient, ability to pay, inflation rate, and land-use data (Li et al., 2018; Su et al., 2020).
In terms of the spatial structure of ESV, the Xingtai, Handan, Anyang, and Liaocheng areas in the northern cities continued to maintain low values during the research period. On the one hand, the main landforms of these cities are plains and rich in mineral resources, but the forest coverage rate is low. Mainly agriculture and industry were developed, so the total ecosystem services values were low. On the other hand, rapid urbanization has negative impacts on ecosystem services in these cities (Song and Deng, 2015). In the central region with Zhengzhou as the core, ESV is relatively low, and there is a continuous downward trend from 2000 to 2018. The main reason may be that the expansion of urbanization in Zhengzhou leads to changes in surrounding land-use patterns, which in turn lead to a reduction in the ESV. Due to the large area of mountains and rich forest resources, the western and southern regions are less affected by urbanization and ESV capacity remains high.
From the perspective of landscape patterns, six landscape patterns (TE, ED, IJI, SPLIT, SHDI, and SHEI) were increasing, but three landscape patterns (AREA-AM CONTAG, COHESION) were decreasing from 2000 to 2018 (Figure 3). There is volatility in the other two landscape patterns (PD, ENN_MN). These results are similar to previous studies; however, there are differences. For example, Tang et al. (2020) found that the enhance in the SHDI, occurred together with the decrease in the AREA_MN and CONTAG during the study of a coastal watershed of southeastern China. In the Loess Plateau in China, Zhang et al. (2020) found that the PD increased significantly, but the changes in COHESION, CONTAG, and SHDI were not obvious. Chen et al. (2021) found that in Wuhan, the PD and SHDI increased during the research period, whereas CONTAG and AREA_AM decreased. Hu et al. (2021) found that the PD and ED indices were volatile during the study period, and SHDI showed an upward trend in Xishuangbanna. Therefore, due to the differences in physical geography, socio-economic, and urbanization stages of the various areas, the landscape pattern tends to exhibit different changes. It is therefore necessary to reinforce the research on landscape patterns in different regions.
Landscape patterns are judgment tools to understand whether human activities have an impact on landscapes, and the changes of landscape patterns can be detected as the disturbance or degradation of ecosystem services (Chen et al., 2021; Li et al., 2022; Chen et al., 2023b). To better understand the effect of regional landscape patterns on ecosystem services, it is necessary to investigate the relationship between landscape patterns and ESV. Our results suggested that the majority of the landscape patterns (PD, IJI, SPLIT, COHESION, and SHDI) and the ESV are significantly positively correlated, indicating that a decrease in these landscape patterns inhibits ESV improvement. The enhance in PD reveals that the fragmentation of the landscape pattern in Wuhan improve during 2000–2015, leading to the decrease in the ESV. These results are consistent with many of previous studies (Yushanjiang et al., 2018; Zhang et al., 2021b). However, Chen et al. (2021) and Liu et al. (2020) found that an enhance in PD conduces to a reduce in ESV. Natural landscapes usually show higher concentration due to less disturbed by human activities, while artificial landscapes are more affected by human activities, tending to show higher dispersion. Therefore, an improvement of IJI demonstrate the enhancement of ecosystem services. This result is consistent with those of Yushanjiang et al. (2018) and Zhang et al. (2020), whereas Zhao et al. (2020) and Liu et al. (2020) detected that IJI to be negatively correlated with ESV. The COHESION index measures the physical connectivity of a certain type of plaque. High landscape cohesion can cause an enhance in ecosystem services (Liu et al., 2020). However, other studies have shown that patch cohesion index has a negative effect on ESV (Zhang et al., 2021b; Guo et al., 2021). The enhance in SPLIT also lead to a improve in ecosystem services (Yushanjiang et al., 2018; Liu et al., 2020). The enhance in SHDI declares that an increase in ecosystem services may be due to the increased in landscape diversity richness. Yushanjiang et al. (2018) and Chen et al. (2021) declared the same result, however, Liu et al. (2020) found that the SHDI is negatively correlated with supply and support services, but positively correlated with regulatory and cultural services. In our study, the TE, ED, AREA_AM, ENN_MN, CONTAG, and SHEI regression coefficients were all found to be negatively correlated with ESV, but this was significant only for TE.
Since the reform and opening up China’s urbanization has entered a rapid development stage and played a critical role in promoting political, economic, cultural, and social development (Hu et al., 2021; Zeng et al., 2023), especially in areas of urban agglomeration. however, the rapid development of the urbanization transforms landscapes and profoundly affects ecosystems (Ouyang and Li, 2023). According to China’s 13th plan of 5-year national development, there are currently 19 urban agglomerations under planning and construction. However, how to avoid unreasonable planning is the top priority in urbanization construction. Based on our research, we make some suggestions to address this question.
First, in large-scale urban agglomeration construction, there should be more focus on quality rather than speed (Bai et al., 2018). In terms of urban agglomeration planning, the main task is to achieve high-quality population urbanization rather than blind expansion of the region. Slowing urban expansion and controlling the scale of construction land can to some extent alleviate the deficit of the ecosystem. In addition, this is also a feasible means to protect high-quality ecological resources such as forests, grasslands, and wetlands in urban development. It can not only play a crucial role in protecting the value of the ecosystem, but also meet the needs of residents for leisure and entertainment in the ecosystem, thereby providing guarantees for sustainable development (Zeng et al., 2023). Second, we consider rational distribution of existing land use. In this study, there is a significant negative associated with ESV and TE. The increase in total edge means additional marginal benefits, which in turn generates more no-utilization buffer zones. In particular, some irregular landscape patterns tend to produce more unusable land areas. In land use planning, it is necessary to ensure strict protection of ecological land, avoid inefficient and scattered expansion of construction land, and minimize the impact of development on the ecosystem (Wang et al., 2014).
Therefore, Sustainable provision of ecosystem services is closely related to human activities. When human society achieves sustainable development, ESV can receive better support (Zhang et al., 2019a). Only by fully coordinating the relationship between landscape pattern and ecosystem services can high-quality and efficient development be achieved. Therefore, studying the interactive stress relationship between landscape pattern and ecosystem services can provide scientific references for healthy development.
Estimation of ecosystem service is an important aspect of modern ecosystem ecology research. However, there is no uniform approach to assessing ESV. Most scholars use the value-equivalent factor method per unit area Xie et al. (2008) to evaluate ESV in China. In recent years, increasingly studies are attempting to further modify the value equivalent scale in order to eliminate the impact of time and inflation on the evaluation of ecosystem services (Zhang et al., 2019b; Li and Gao, 2019). Therefore, in future research, the comparison of different evaluation methods should be strengthened in order to obtain more accurate evaluation methods of ecosystem services.
In order to provide high-level insights into land use management and urban planning in different regions, many previous studies have concentrated on the latent relationship between landscape and ecological process (Lee et al., 2015; Urzedo et al., 2020; Bian et al., 2023). However, little research has been conducted on the scale of urban agglomerations. Urban agglomerations contain richer and more diverse land-use types, which also represent a higher-stage form of urban development. Therefore, this will also result in increased planning requirements for urban agglomeration planners. In future urban agglomeration planning, landscape pattern is an important aspect that not only reflects the rationality and beauty of urban planning but also affects the sustainable development of ecosystem services.
The construction of urban agglomerations not only involves the ESV, but also involves the happy life of people in the city (Sheikh and Van Amerijde, 2022; Ye et al., 2022). Liveability is an indispensable component in future urban agglomeration planning. A liveable urban attempt to provide individuals of communities with strong sense of satisfaction and happiness, enhance the aesthetics and accessibility of the surrounding environment through infrastructure planning, ensure the provision of basic necessities and services, and implement feasible land use allocation in the urban planning process (Chi and Mak, 2021). The changes in landscape patterns not only affect ecosystem services, but also have a significant impact on people’s sense of satisfaction and happiness (Ahmed, 2011). Therefore, in future research, to serve the construction of better urban agglomerations, we should incorporate urban livability into urban ecosystem services.
In this study, we determined the spatiotemporal pattern of ESV and the landscape pattern in the CPUA from 2000 to 2018 using a revised benefit transfer method. In addition, the spatiotemporal correlation analysis method is used to further analyze the impact of landscape patterns on the ESV in the CPUA. Our study results demonstrate that the ESV is in a state of continuous decline in in the CPUA during the study periods. Moreover, the reduction in ESV between 2015 and 2018 exceeds that of the sum of the previous three stages (from 2000 to 2005, 2005 to 2010, and 2010–2015). The land-scape patterns of ENN_MN, IJI, and SHDI showed larger values in the south than in the north, but AREA_AM, CONTAG, and COHESION showed the opposite trend of lower values in the mountains of the northwest than that in the central and southeastern plains in the CPUA. The spatiotemporal regressive analysis revealed that there is a significant positive correlation between ESV and PD, IJI, DIVISION, and SPLIT but a significant negative correlation between ESV and TE. Therefore, the changes in the landscape pattern caused by the construction of urban agglomerations have an important impact on ecosystem services. In the future, in the construction of urban agglomerations, focus on reasonable planning of landscape patterns should be strengthened in order to obtain more efficient and sustainable ecosystem services.
The original contributions presented in the study are included in the article/Supplementary material, further inquiries can be directed to the corresponding author.
MZ: Writing–original draft, Writing–review and editing.
The author(s) declare financial support was received for the research, authorship, and/or publication of this article. This work has been supported by the National Social Science Foundation of China (Grant No. 21CGL024) and Scientific and Technological Innovation Talents in colleges and universities of Henan Province (Humanities and Social Sciences) (No. 2023-CXRC-04).
I wish to thank Wanxu Chen for providing assistance in article writing and data analysis.
The author declares that the research was conducted in the absence of any commercial or financial relationships that could be construed as a potential conflict of interest.
All claims expressed in this article are solely those of the authors and do not necessarily represent those of their affiliated organizations, or those of the publisher, the editors and the reviewers. Any product that may be evaluated in this article, or claim that may be made by its manufacturer, is not guaranteed or endorsed by the publisher.
Abdollahi, S., Ildoromi, A., Salmanmahini, A., Fakheran, S., and Kulczyk, S. (2023). Quantifying the relationship between landscape patterns and ecosystem services along the Urban-rural gradient. Landsc. Ecol. Eng. 19, 531–547. doi:10.1007/s11355-023-00561-x
Ahmed, T. (2011). Landscape infrastructure and liveable communities: a case study of new-cairo, Egypt. Available at: http://theses.ncl.ac.uk/jspui/handle/10443/1131.
Bai, Y., Deng, X., Jiang, S., Zhang, Q., and Wang, Z. (2018). Exploring the relationship between urbanization and urban ecoefficiency: evidence from prefecture level cities in China. J. Clean. Prod. 195, 1487–1496. doi:10.1016/j.jclepro.2017.11.115
Bastian, O., Grunewald, K., Syrbe, R. U., Walz, U., and Wende, W. (2014). Landscape services: the concept and its practical relevance. Landsc. Ecol. 29, 1463–1479. doi:10.1007/s10980-014-0064-5
Bian, J., Chen, W., and Zeng, J. (2023). Ecosystem services, landscape pattern, and landscape ecological risk zoning in China. Environ. Sci. Pollut. Res. Int. 30, 17709–17722. doi:10.1007/s11356-022-23435-5
Chen, H., Yan, W., Li, Z., Wende, W., Xiao, S., Wan, S., et al. (2022a). Spatial patterns of associations among ecosystem services across different spatial scales in metropolitan areas: a case study of Shanghai, China. Ecol. Indic. 136, 108682. doi:10.1016/j.ecolind.2022.108682
Chen, J., Qi, Q., Wang, B., He, S., Li, Z., Wang, L., et al. (2023c). Response of ecosystem services to landscape patterns under socio-economic-natural factor zoning: a case study of Hubei Province, China. Ecol. Indic. 153, 110417. doi:10.1016/j.ecolind.2023.110417
Chen, W., Bian, J., Liang, J., Pan, S., and Zeng, Y. (2022b). Traffic accessibility and the coupling degree of ecosystem services supply and demand in the middle reaches of the Yangtze River urban agglomeration, China. J. Geogr. Sci. 32, 1471–1492. doi:10.1007/s11442-022-2006-5
Chen, W., Wang, G., and Zeng, J. (2023b). Impact of urbanization on ecosystem health in Chinese urban agglomerations. Environ. Impact. Asses. 98, 106964. doi:10.1016/j.eiar.2022.106964
Chen, W., Zeng, J., Chu, Y., and Liang, J. (2021). Impacts of landscape patterns on ecosystem services value: a multiscale buffer gradient analysis approach. Remote Sens. 13, 2551. doi:10.3390/rs13132551
Chen, W., Zhou, T., and Liang, J. (2023a). Urbanization, ecosystem services, and their interactive coercive relationship in Hunan Province, China. Environ. Sci. Pollut. Res. Int. 30, 3416–3431. doi:10.1007/s11356-022-22370-9
Chi, Y., and Mak, H. (2021). From comparative and statistical assessments of liveability and health conditions of districts in Hong Kong towards future city development. Sustainability 13, 8781. doi:10.3390/su13168781
Costanza, R., Darge, R. C., De Groot, R., Farber, S., Grasso, M., Hannon, B., et al. (1997). The value of the world’s ecosystem services and natural capital. Nature 387, 253–260. doi:10.1038/387253a0
Dadashpoor, H., Azizi, P., and Moghadasi, M. (2019). Land use change, urbanization, and change in landscape pattern in a metropolitan area. Sci. Total Environ. 655, 707–719. doi:10.1016/j.scitotenv.2018.11.267
Daily, G. (1997). Nature ’s services: societal dependence on natural ecosystems. Washington, D. C: Island Press. Available at: https://portals.iucn.org/library/node/28995.
Deng, X., Huang, J., Rozelle, S., Zhang, J., and Li, Z. (2015). Impact of urbanization on cultivated land changes in China. Land Use Policy 45, 1–7. doi:10.1016/j.landusepol.2015.01.007
Fang, C., Song, J., Zhang, Q., and Li, M. (2005). The formation, development and spatial heterogeneity patterns for the structures system of urban agglomerations in China. Acta Geogr. Sin. 60, 827–840. doi:10.11821/xb200505014
Fang, C., and Yu, D. (2017). Urban agglomeration: an evolving concept of an emerging phenomenon. Landsc. Urban Plan. 162, 126–136. doi:10.1016/j.landurbplan.2017.02.014
Fu, H., Wang, Y., Zhang, Y., and Wang, Z. (2020). Research on accessibility evolution and optimization of traffic network in Central Plains Urban Agglomeration. Resour. Environ. Yangtze Basin 29, 557–567. doi:10.11870/cjlyzyyhj202003003
Guo, M., Shu, S., Ma, S., and Wang, L. J. (2021). Using high-resolution remote sensing images to explore the spatial relationship between landscape patterns and ecosystem service values in regions of urbanization. Environ. Sci. Pollut. Res. Int. 28, 56139–56151. doi:10.1007/s11356-021-14596-w
Hu, Z., Yang, X., Yang, J., Yuan, J., and Zhang, Z. (2021). Linking landscape pattern, ecosystem service value, and human well-being in Xishuangbanna, southwest China: insights from a coupling coordination model. Glob. Ecol. Conserv. 27, e01583. doi:10.1016/j.gecco.2021.e01583
Jiang, W., Lü, Y., Liu, Y., and Gao, W. (2020). Ecosystem service value of the Qinghai-Tibet Plateau significantly increased during 25 years. Ecosyst. Serv. 44, 101146. doi:10.1016/j.ecoser.2020.101146
Keisteri, T. (1990). The study of changes in cultural landscapes. Finland: Helsingin Yliopisto (Finland). https://webofscience.clarivate.cn/wos/alldb/full-record/PQDT:65084487.
Kertész, Á., Nagy, L. A., and Balázs, B. (2019). Effect of land use change on ecosystem services in Lake Balaton Catchment. Land Use Policy 80, 430–438. doi:10.1016/j.landusepol.2018.04.005
Lee, Y. C., Ahern, J., and Yeh, C. T. (2015). Ecosystem services in periurban landscapes: the effects of agricultural landscape change on ecosystem services in Taiwan’s western coastal plain. Landsc. Urban Plan. 139, 137–148. doi:10.1016/j.landurbplan.2015.02.023
Li, F., Zhang, S., Yang, J., Chang, L., Yang, H., and Bu, K. (2018). Effects of land use change on ecosystem services value in West Jilin since the reform and opening of China. Ecosyst. Serv. 31, 12–20. doi:10.1016/j.ecoser.2018.03.009
Li, H., Peng, J., Liu, Y., and Hu, Y. (2017). Urbanization impact on landscape patterns in Beijing City, China: a spatial heterogeneity perspective. Ecol. Indic. 82, 50–60. doi:10.1016/j.ecolind.2017.06.032
Li, J., and Gao, M. (2019). Spatiotemporal evolution and correlation analysis of ecosystem service values and ecological risk in Binzhou. Acta Ecol. Sin. 39, 7815–7828. doi:10.5846/stxb201809061899
Li, Y., Zeng, C., Liu, Z., Cai, B., and Zhang, Y. (2022). Integrating landscape pattern into Characterising and Optimising ecosystem services for regional sustainable development. Land 11, 140. doi:10.3390/land11010140
Liu, L., Chen, X., Chen, W., and Ye, X. (2020). Identifying the impact of landscape pattern on ecosystem services in the middle reaches of the Yangtze River urban agglomerations, China. Int. J. Environ. Res. Public. Health. 17, 5063. doi:10.3390/ijerph17145063
Liu, S., Wang, Z., Wu, W., and Yu, L. (2022). Effects of landscape pattern change on ecosystem services and its interactions in karst cities: a case study of Guiyang City in China. Ecol. Indi. 145, 109646. doi:10.1016/j.ecolind.2022.109646
Liu, Y., Song, W., and Deng, X. (2019). Understanding the spatiotemporal variation of urban land expansion in oasis cities by integrating remote sensing and multi-dimensional DPSIR-based indicators. Ecol. Indic. 96, 23–37. doi:10.1016/j.ecolind.2018.01.029
Luo, Q., Zhou, J., Li, Z., and Yu, B. (2020). Spatial differences of ecosystem services and their driving factors: a comparation analysis among three urban agglomerations in China’s Yangtze River Economic Belt. Sci. Total Environ. 725, 138452. doi:10.1016/j.scitotenv.2020.138452
McGarigal, K. (2012). FRAGSTATS: spatial pattern analysis program for categorical maps. Amherst, MA: University of Massachusetts.
Ning, J., Liu, J., Kuang, W., Xu, X., Zhang, S., Yan, C., et al. (2018). Spatio-temporal patterns and characteristics of land-use change in China during 2010–2015. J. Geogr. Sci. 28, 547–562. doi:10.1007/s11442-018-1490-0
Ouyang, H., and Li, Z. (2023). Research on the effectiveness, challenges and countermeasures of urban cluster construction in China. J. Lanzhou Univ. Soc. Sci. 51, 28–38. doi:10.13885/j.issn.1000-2804.2023.03.003
Ouyang, X., Tang, L., Wei, X., and Li, Y. (2021). Spatial interaction between urbanization and ecosystem services in Chinese urban agglomerations. Land Use Policy 109, 105587. doi:10.1016/j.landusepol.2021.105587
Peng, J., Tian, L., Liu, Y., Zhao, M., Hu, Y. N., and Wu, J. (2017). Ecosystem services response to urbanization in metropolitan areas: thresholds identification. Sci. Total Environ. 607, 706–714. doi:10.1016/j.scitotenv.2017.06.218
Sheikh, W., and van Ameijde, J. (2022). Promoting livability through urban planning: a comprehensive framework based on the “theory of human needs”. Cities 131, 103972. doi:10.1016/j.cities.2022.103972
Song, W., and Deng, X. (2015). Effects of urbanization-induced cultivated land loss on ecosystem services in the North China Plain. Energies 8, 5678–5693. doi:10.3390/en8065678
Su, K., Wei, D., and Lin, W. (2020). Evaluation of ecosystem services value and its implications for policy making in China – a case study of Fujian province. Ecol. Indic. 108, 105752. doi:10.1016/j.ecolind.2019.105752
Sun, X., Tang, H., Yang, P., Hu, G., Liu, Z., and Wu, J. (2020). Spatiotemporal patterns and drivers of ecosystem service supply and demand across the conterminous United States: a multiscale analysis. Sci. Total Environ. 703, 135005. doi:10.1016/j.scitotenv.2019.135005
Tang, J., Li, Y., Cui, S., Xu, L., Ding, S., and Nie, W. (2020). Linking land-use change, landscape patterns, and ecosystem services in a coastal watershed of southeastern China. Glob. Ecol. Conserv. 23, e01177. doi:10.1016/j.gecco.2020.e01177
Tian, Y., Zhou, D., and Jiang, G. (2020). Conflict or Coordination? Multiscale assessment of the spatio-temporal coupling relationship between urbanization and ecosystem services: the case of the Jingjinji Region, China. Ecol. Indic. 117, 106543. doi:10.1016/j.ecolind.2020.106543
Tolessa, T., Senbeta, F., and Kidane, M. (2017). The impact of land use/land cover change on ecosystem services in the central highlands of Ethiopia. Ecosyst. Serv. 23, 47–54. doi:10.1016/j.ecoser.2016.11.010
Turner, M. G. (1989). Landscape ecology: the effect of pattern on process. Annu. Rev. Ecol. Syst. 20, 171–197. doi:10.1146/annurev.es.20.110189.001131
Urzedo, D. I., Neilson, J., Fisher, R., and Junqueira, R. G. P. (2020). A global production network for ecosystem services: the emergent governance of landscape restoration in the Brazilian Amazon. Glob. Environ. Chang. 61, 102059. doi:10.1016/j.gloenvcha.2020.102059
Wang, J., Zhou, W., Pickett, S. T. A., Yu, W., and Li, W. (2019). A multiscale analysis of urbanization effects on ecosystem services supply in an urban megaregion. Sci. Total Environ. 662, 824–833. doi:10.1016/j.scitotenv.2019.01.260
Wang, W., Guo, H., Chuai, X., Dai, C., Lai, L., and Zhang, M. (2014). The impact of land use change on the temporospatial variations of ecosystems services value in China and an optimized land use solution. Environ. Sci. Pol. 44, 62–72. doi:10.1016/j.envsci.2014.07.004
Wei, J., Tian, M., and Wang, X. (2023). Spatiotemporal variation in land use and ecosystem services during the urbanization of Xining city. Land 12, 1118. doi:10.3390/land12061118
Wu, J., Wu, C., Zhang, Q., Zhuang, M., Xiao, H., Wu, H., et al. (2023). Spatiotemporal evolution of urban agglomeration and its impact on landscape patterns in the Pearl River Delta, China. Remote Sens. 15, 2520. doi:10.3390/rs15102520
Wu, K., You, K. R., Ren, H., and Gan, L. (2022a). The impact of industrial agglomeration on ecological efficiency: an empirical analysis based on 244 Chinese cities. Environ. Impact Asses. 96, 106841. doi:10.1016/j.eiar.2022.106841
Wu, Y. Z., Li, C. L., Shi, K. F., Liu, S. R., and Chang, Z. J. (2022b). Exploring the effect of urban sprawl on carbon dioxide emissions: an urban sprawl model analysis from remotely sensed nighttime light data. Environ. Impact Asses. 93, 106731. doi:10.1016/j.eiar.2021.106731
Xie, G., Zhang, C., Zhang, C., Xiao, Y., and Lu, C. (2015). The value of ecosystem services in China. Res. Sci. 37, 1740–1746. doi:10.18402/resci.2015.09.07
Xie, G., Zhen, L., Lu, C., Xiao, Y., and Chen, C. (2008). Expert knowledge-based valuation method of ecosystem services in China. J. Nat. Resour. 23, 911–919. doi:10.11849/zrzyxb.2008.05.019
Xue, J., Li, Z., Feng, Q., Gui, J., and Zhang, B. (2023). Construction of ecological conservation pattern based on ecosystem services of Three River Headwaters, Western China. Glob. Ecol. Conserv. 44, e02491. doi:10.1016/j.gecco.2023.e02491
Yang, Y., Zhang, H., Zhao, X., Chen, Z., Wang, A., Zhao, E., et al. (2021). Effects of urbanization on ecosystem services in the Shandong Peninsula urban agglomeration, in China: the case of Weifang city. Urban Sci. 5, 54. doi:10.3390/urbansci5030054
Ye, C., Schröder, P., Yang, D., Chen, M., Cui, C., and Zhuang, L. (2022). Toward healthy and liveable cities: a new framework linking public health to urbanization. Environ. Res. Let. 17, 064035. doi:10.1088/1748-9326/ac70eb
Yushanjiang, A., Zhang, F., Yu, H., and Kung, H. t. (2018). Quantifying the spatial correlations between landscape pattern and ecosystem service value: a case study in Ebinur Lake Basin, Xinjiang, China. Ecol. Eng. 113, 94–104. doi:10.1016/j.ecoleng.2018.02.005
Zeng, J., Cui, X., Chen, W., and Yao, X. (2023). Impact of urban expansion on the supply-demand balance of ecosystem services: an analysis of prefecture-level cities in China. Environ. Impact Asses. 99, 107003. doi:10.1016/j.eiar.2022.107003
Zhang, J., Qu, M., Wang, C., Zhao, J., and Cao, Y. (2020). Quantifying landscape pattern and ecosystem service value changes: a case study at the county level in the Chinese Loess Plateau. Glob. Ecol. Conserv. 23, e01110. doi:10.1016/j.gecco.2020.e01110
Zhang, P., Pan, J., Xie, L., Zhou, T., Bai, H., and Zhu, Y. (2019a). Spatial-temporal evolution and regional differentiation features of urbanization in China from 2003 to 2013. ISPRS Int. J. Geo-Inf. 8, 31. doi:10.3390/ijgi8010031
Zhang, Q., Sun, X., Zhang, K., Liao, Z., and Xu, S. (2021a). Trade-offs and synergies of ecosystem services in the Pearl River Delta urban agglomeration. Sustainability 13, 9155. doi:10.3390/su13169155
Zhang, X., Li, H., Xia, H., Tian, G., Yin, Y., Lei, Y., et al. (2021b). The ecosystem services value change and its driving forces responding to spatio-temporal process of landscape pattern in the Co-Urbanized Area. Land 10, 1043. doi:10.3390/land10101043
Zhang, Y., Zhao, X., Zuo, L., Zhang, Z., and Xu, J. (2019b). The impact of land use change on ecosystem services value in Loess Plateau. Remote Sens. Land Resour. 31, 132–139. doi:10.3390/land10101043
Zhao, J., Liu, S., Wang, Z., Gao, H., Feng, S., Wei, B., et al. (2023). The impact of land use and landscape pattern on ecosystem services in the Dongting Lake Region, China. Remote Sens. 15, 2228. doi:10.3390/rs15092228
Zhao, Q., Wen, Z., Chen, S., Ding, S., and Zhang, M. (2020). Quantifying land use/land cover and landscape pattern changes and impacts on ecosystem services. Int. J. Environ. Res. Public. Health. 17, 126. doi:10.3390/ijerph17010126
Zhou, B. B., Wu, J., and Anderies, J. M. (2019). Sustainable landscapes and landscape sustainability: a tale of two concepts. Landsc. Urban Plan. 189, 274–284. doi:10.1016/j.landurbplan.2019.05.005
Keywords: ecosystem services value, landscape pattern, econometric model, central plains urban agglomeration, China
Citation: Zhong M (2024) Impact of landscape patterns on ecosystem services in China: a case study of the central plains urban agglomeration. Front. Environ. Sci. 12:1285679. doi: 10.3389/fenvs.2024.1285679
Received: 30 August 2023; Accepted: 02 January 2024;
Published: 11 January 2024.
Edited by:
Hugo Wai Leung Mak, Hong Kong University of Science and Technology, Hong Kong SAR, ChinaCopyright © 2024 Zhong. This is an open-access article distributed under the terms of the Creative Commons Attribution License (CC BY). The use, distribution or reproduction in other forums is permitted, provided the original author(s) and the copyright owner(s) are credited and that the original publication in this journal is cited, in accordance with accepted academic practice. No use, distribution or reproduction is permitted which does not comply with these terms.
*Correspondence: Mingxing Zhong, emhvbmdteEB4eW51LmVkdS5jbg==
Disclaimer: All claims expressed in this article are solely those of the authors and do not necessarily represent those of their affiliated organizations, or those of the publisher, the editors and the reviewers. Any product that may be evaluated in this article or claim that may be made by its manufacturer is not guaranteed or endorsed by the publisher.
Research integrity at Frontiers
Learn more about the work of our research integrity team to safeguard the quality of each article we publish.