 Yuhuan Zhang1
94% of researchers rate our articles as excellent or good
Learn more about the work of our research integrity team to safeguard the quality of each article we publish.
Find out more
ORIGINAL RESEARCH article
Front. Environ. Sci., 22 February 2024
Sec. Atmosphere and Climate
Volume 12 - 2024 | https://doi.org/10.3389/fenvs.2024.1267627
This article is part of the Research TopicCrucial Air Quality, Atmospheric Environment, and Climate Change in Low- and Middle-Income CountriesView all 8 articles
The variation of tropospheric nitrogen dioxide (NO2) vertical column densities (VCDs) indirectly reflects the difference in pollution emissions from industrial production and transportation. Accurately analyzing its pollution sources and driving factors plays an important role in energy conservation, emission reduction, and air pollution reduction. NO2 concentration products of Sentinel-5P (Sentinel-5 Precursor) TROPOMI (TROPOspheric Monitoring Instrument) from 2019 to 2021 and Aura OMI (Ozone Monitoring Instrument) from 2009 to 2021, combined with China’s main energy consumption, the growth value of the industry, Gross Domestic Product (GDP), and other data were used to analyze the influencing factors of NO2 variations. Firstly, NO2 tropospheric vertical column densities (NO2 TVCDs) of China increased by 14.72% and 3.26% in 2021 and 2020 compared with the 2019. The secondary and tertiary industry and the national energy consumption increased synchronously, which was highly related to the increase in NO2 TVCDs. Secondly, the impact of COVID-19 (coronavirus disease 2019) on China’s industrial production and residents was mainly concentrated in the first quarter of 2020, which leading to a decline in the annual average NO2 concentration in densely populated areas in 2020 compared to the same period in 2019. The industrial production scale and production capacity has gradually recovered since April 2020, and the NO2 concentration has gradually reached or exceeded the level of the same period of 2019. Finally, atmospheric pollution prevention and control measures played a positive role in the decline of NO2 of China.
NO2 is a trace gas in the atmosphere, it playing an important role in tropospheric and stratospheric chemical reactions (Velders et al., 2001). And it is also a primary pollutant that forms acid rain, acid fog, and other air pollution phenomena (Zhou et al., 2016a). NO2 have much to do with the formation and extinction of ozone in atmosphere and is also an essential precursor of PM2.5 (Particulate Matter) (Qin and Zhao, 2003; Zhou et al., 2016b). NO2 has both natural and anthropogenic sources (Tang et al., 2005). Anthropogenic sources include the combustion of fossil fuels, such as in transportation, the petrochemical industry, and coal power plants (Lee et al., 1997; Bradshaw et al., 2000), which account for about 2/3 of the total emissions (Solomon et al., 2007). Other sources include soil emissions and lightning generation (Lin, 2011). NO2 is one of the indicators of the air pollution level, and can reflect anthropogenic activities to some extent (Tao et al., 2020). Therefore, it is necessary to monitor and analyze the changes of NO2 in the atmosphere accurately.
Atmospheric NO2 concentration monitoring data sources can be categorized into ground-based monitoring, airborne observation, and satellite observation. Satellite remote sensing monitoring can quickly obtain information at a large spatial scale, and is increasingly used for atmospheric monitoring (Fishman et al., 2008; Martin, 2008). The observation of NO2 TVCDs by satellite began in the mid-1990s. The satellite ERS-2 (European Remote Sensing ERS) launched by the ESA (European Space Agency) on 21 April 1995, had the instrument of GOME (Global Ozone Monitoring Experiment), it can monitor the global distribution of some trace gases, such as NO2, SO2 (sulfur dioxide), and HCHO (formaldehyde). The instrument of GOME enabled the monitoring of the distribution of NO2 on a global scale for the first time (Martin et al., 2002; Richter and Burrows, 2002; Zhang et al., 2012). The ENVISAT-1 (Environmental Satellite-1) launched by ESA on 1 March 2002, had the instrument of SCIAMACHY (The Scanning Imaging Absorption Spectrometer for Atmospheric Cartography), it was used to monitor trace gases such as NO2 in the troposphere and stratosphere (Yao et al., 2012). OMI (Ozone Monitoring Instrument) carried on the EOS (Earth Observing System) Aura satellite launched by NASA (National Aeronautics and Space Administration) on 15 July 2004, it can obtain daily monitoring results for NO2 in the global atmospheric troposphere (Boersma et al., 2007). Aura-OMI is widely used due to its high spatial resolution (13 × 24 km2 in sub-satellite pixels) and stable on-orbit time (Liu et al., 2015; Zhou et al., 2016c). S5P (the Sentinel 5 precursor) with a sun-synchronous orbit satellite was launched on 13 October 2017 (Veefkind et al., 2012), it is designed for monitoring global air quality and acquiring the atmospheric composition information daily, includingNO2, SO2, O3, CO (carbon monoxide), CH4, HCHO (formaldehyde), and aerosol (Veefkind et al., 2012; Wang and Su, 2020). The instrument of TROPOMI was loaded on S5P, it has eight spectral bands covering from UV (ultraviolet) to SWIR (shortwave infrared) wavelengths. TROPOMI data can be used to analyze the distribution characteristics quantitatively and the trends of NO2 in China to evaluate the impact of anthropogenic pollution on the environment and climate. TROPOMI’s higher spatial resolution (7 × 3.5 km2) can identify small pollution sources and their accurate location (Fioletov et al., 2013; Liu et al., 2020).
China is a large developing country. In the past few decades, the rapid economic development has been accompanied by great changes in the atmosphere situation (Fan et al., 2020). The Chinese government attaches great importance to environmental problems and has taken a series of measures to reduce air pollution (Ronald et al., 2017; Sogacheva et al., 2018). In addition to this, the COVID-19 (Coronavirus Disease 2019) broke out in late 2019 and spread widely in 2020, a number of measures have been taken to reduce the spread of the virus, such as social distancing measures, suspension of public transport and industry, and widespread cordon sanitaires (“lockdowns”), these measures affect industrial production and transportation, which in turn affect the emission of air pollutants (Silver et al., 2020). The effect of these measures can be seen through satellite monitoring of air pollutants (Fan et al., 2020; Tao et al., 2020).
The single NO2 space-time variation analysis was generally conducted (Bradshaw et al., 2000; Wang et al., 2020), or add some simple influencing factors, such as number of motor vehicles (Zhou et al., 2016a; Fan et al., 2021) generally. Some researchers also analyze changes of atmospheric pollutants, including NO2, over a particular period of time (Fan et al., 2020; Liu et al., 2020; Tao et al., 2020). Few people have combined NO2 with actual GDP and energy consumption, and environmental management policy for comprehensive analysis and evaluation, however these are all related to NO2 emissions.
In this paper, OMI provided long time series data for annual trend monitoring over 10 years, while TROPOMI has a higher spatial resolution and was used for regional statistical analysis and monthly trend monitoring from 2019 to 2021. This paper monitored the distribution and variation of NO2 TVCDs from 2009 to 2021 in China using NO2 production of TROPOMI and OMI, then analyzed the causes of variation combined with China’s main energy consumption, Gross Domestic Product (GDP), industrial growth value, and other data. The NO2 TVCDs of 2019 was used as the baseline value, and the reason for NO2 variation was comprehensively analyzed based on the values from 2020 to 2021. The measures related to COVID-19 also had impact on NO2 emissions (Vîrghileanu et al., 2020; Wang et al., 2020; Ali et al., 2021; Zhou et al., 2021), so we also analyzed the impact of COVID-19 in this paper.
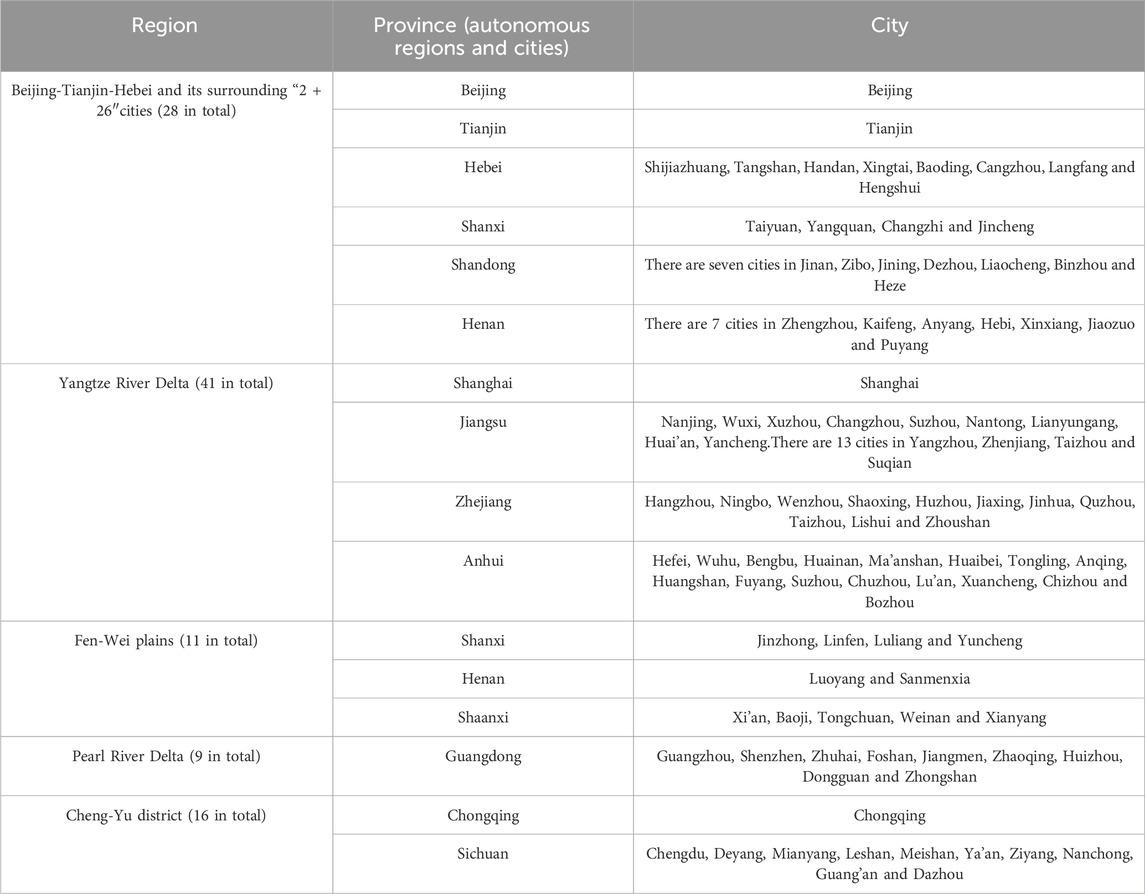
The study area is China as Figure 1 shows with the NO2 TVCDs of 2019. The NO2 TVCDs of Central and eastern China was higher such as “2 + 26”cities in Beijing-Tianjin-Hebei and surrounding areas, Yangtze River Delta region, Fen-Wei Plains, Pearl River Delta Region, Chengdu-Chongqing Region. Most of China’s megacities and much industry are situated in these areas, resulting in a high density of motorized traffic. These intensive human activities result in emissions, leading to the deterioration of air quality (Fan et al., 2020). Air pollution in China is high in the east and low in the west as described in detail by Zheng (Zheng et al., 2019) for NO2, and 94% of the Chinese population lives in east China. We also separately analyzed the NO2 TVCDs in these five typical regions. The details of these five typical regions are show in Appendix A.
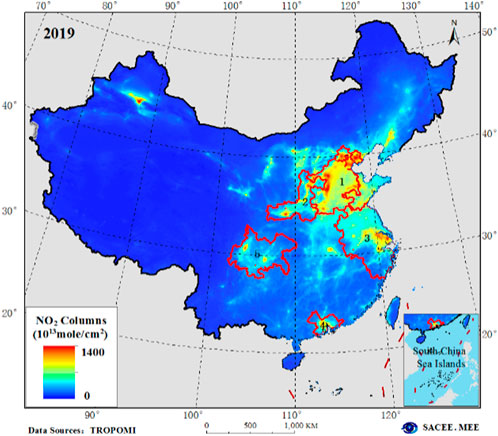
FIGURE 1. The study area with NO2 TVCDs of 2019. The red polygons show the five typical areas which are used in this study (1: Beijing-Tianjin-Hebei and its surrounding “2 + 26”cities, 2: Fen-Wei plains, 3: Yangtze River Delta, 4: Pearl River Delta, 5: Cheng-Yu district).
The NO2 data used in this paper were monitored by both TROPOMI sensors loaded on S5P and OMI sensors loaded on Aura. The OMI NO2 data were used widely before the launch of TROPOMI, and had obtained more than 15 years of data, it can be used to study the global NO2 distribution (Liu et al., 2015; Zhou et al., 2016c; Wang et al., 2020). These data are available from the NASA website (https://giovanni.gsfc.nasa.gov/giovanni/) (Wang et al., 2014). OMI level 3 products were used in this paper. The products contain annual mean NO2 TVCDs with a spatial resolution of 0.25° × 0.25°, these data were used for annual change analysis of NO2 TVCDs in this paper.
As a new generation of atmospheric composition monitor, TROPOMI inherited the advantages of GOME, SCIAMACHY, OMI, and Ozone Mapping and Profiler Suite (OMPS), but has a higher spatial resolution and a more comprehensive wavelength range (Zhang et al., 2020). TROPOMI monitors vital atmospheric components (Kleipool et al., 2018), which can be used to quantitatively analyze the distribution, characteristics and trends of NO2 in China. TROPOMI products used in this study are L3 offline (OFFL) version products. These products contain daily NO2 TVCDs with a spatial resolution of 7 km × 3.5 km, which were used in this paper. These data are available on the ESA website (https://s5phub.copernicus.eu/) or NASA’s website (https://search.earthdata.nasa.gov/search) (van Geffen et al., 2020; Zhang et al., 2020).
OMI products were used to detect annual changes of NO2 from 2009 to 2021, while TROPOMI products from 2019 to 2021 mainly used for NO2 regional statistical analysis. The NO2 TVCDs from TROPOMI has the higher spatial resolution, so the data were mainly used to analyze monthly averaged spatial variations and calculate time series over certain regions. OMI and TROPOMI products thus provided complementary information for different time periods and were used for different uses.
Total energy consumption, Coal consumption, Crude oil consumption, primary industry value added, secondary industry value added, tertiary industry value added, and GDP data of China comes from the National Bureau of Statistics of China. These data are publicly available on the National Bureau of Statistics website (https://www.stats.gov.cn/).
The mainstream method using satellite remote sensing to monitor the NO2 TVCD is the DOAS (Differential Optical Absorption Spectroscopy) algorithm (Platt et al., 1979; Burrows et al., 1999; Zara et al., 2018). The NO2 data product was developed based on the DOAS retrieval method in the UV spectral range. NO2 has strong absorption characteristics in the UV bands (Burrows et al., 1999; Zhang et al., 2020). Retrieval consisted of a three-step procedure: firstly, it removes the surface reflection and the scattering effect of aerosols, fills the ring effect caused by Raman scattering from atmospheric molecules, and removes the absorption effect of all other gases in these bands (Burrows et al., 1999; Zara et al., 2018; Zhang et al., 2020). The retrieval of a total NO2 slant column density from satellite data (OMI or TROPOMI) was achieved using a DOAS method. Secondly, the AMF (Air Mass Factor) was calculated based on radiative transfer model, and the NO2 vertical column density was calculated (Kleipool et al., 2018). Finally, the stratospheric NO2 column density was obtained through the atmospheric model or other methods, and the tropospheric NO2 column density was obtained by removing it from the whole column density (Tao et al., 2009; Lorente et al., 2017)-.
China’s daily NO2 products were downloaded from the NASA and ESA website in the Network Common Data Form (NC) format. The tropospheric NO2 concentration results were extracted, then synthetic product of monthly and annual were produced from daily results. The monthly monitoring results were obtained based by averaging daily NO2 monitoring results (mean effective value), the annual monitoring results were obtained by averaging the monthly monitoring results (mean effective value) (Table 1). Region NO2 is calculated by averaging effective pixels within the region.
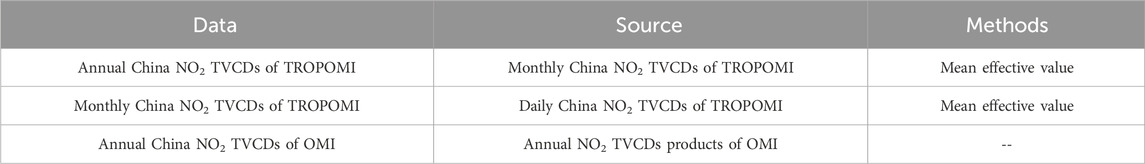
TABLE 1. Data acquisition methods.
The NO2 TVCD of China in 2019, 2020, and 2021 are shown in Figure 2. The relative differences between 2021 and 2020, and 2021 and 2019, are shown in Figure 3. The annual mean value, variation, and change rate of NO2 TVCD in China and five typical regions from 2019 to 2021 are shown in Table 2.
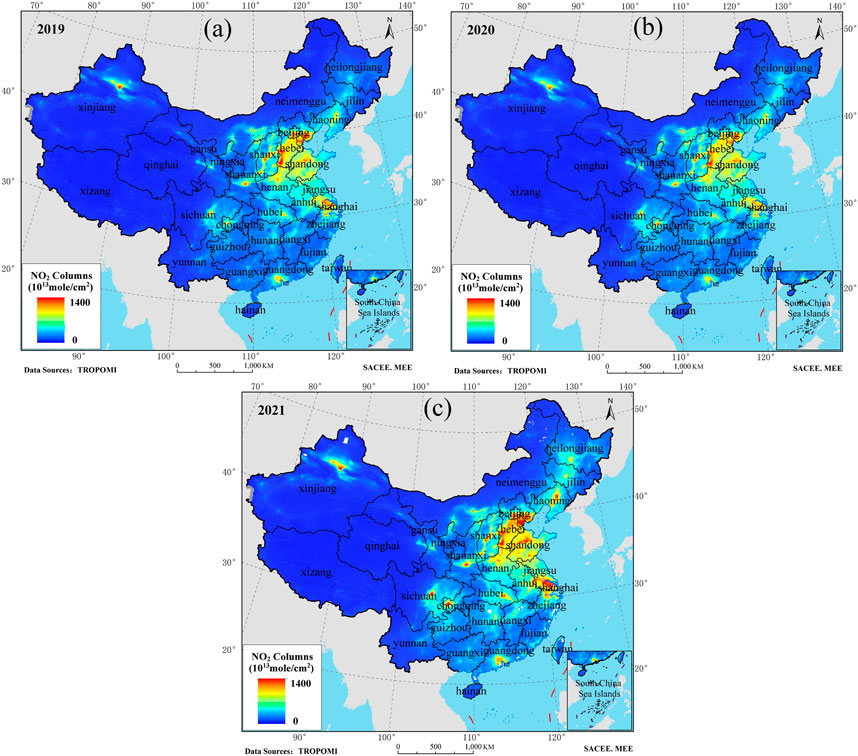
FIGURE 2. The annual average of NO2 TVCD of China. (A): 2019; (B): 2020; (C): 2021.
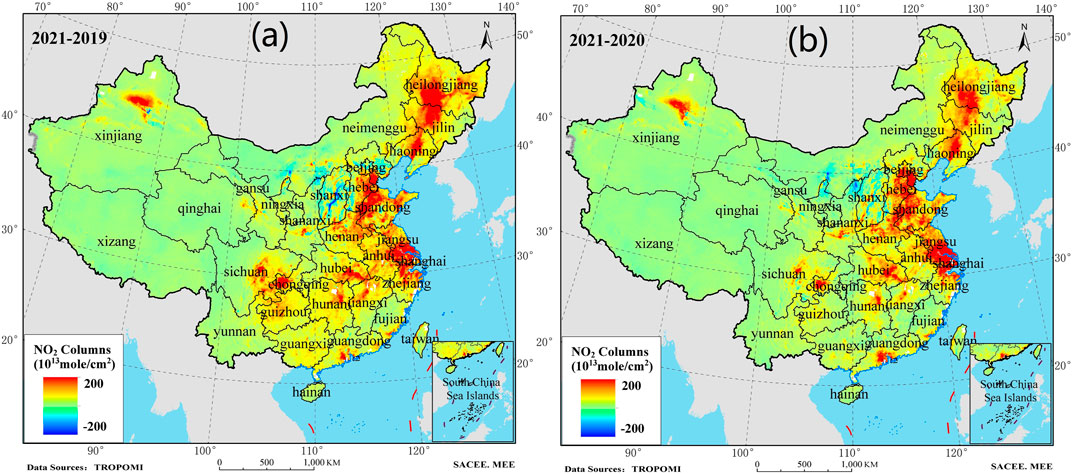
FIGURE 3. Variation of NO2 TVCD. (A): 2021 compared to 2020; (B): 2021 compared to 2019.
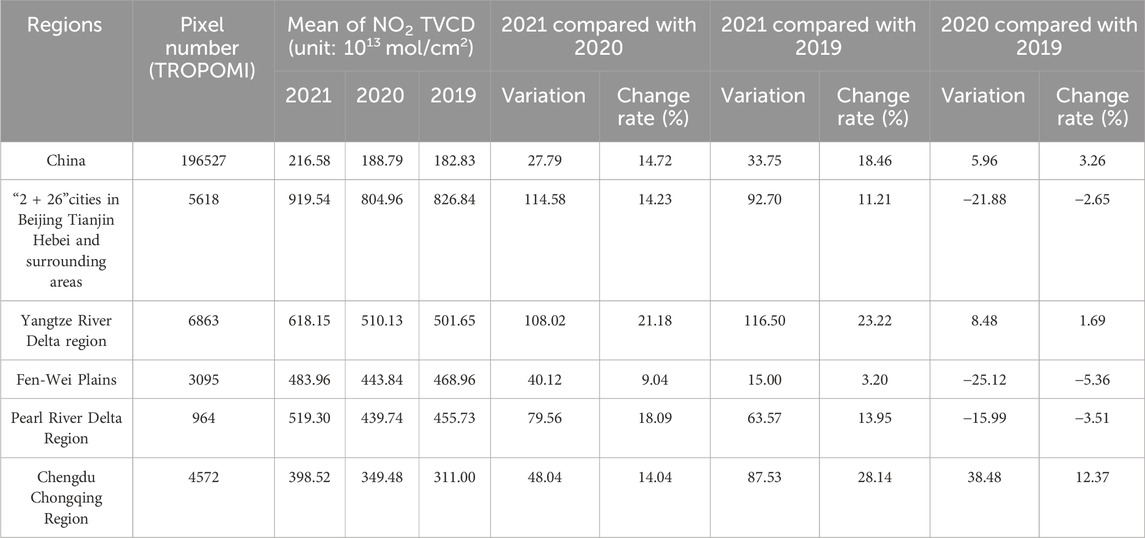
TABLE 2. Annual mean value, variation, and change rate of NO2 TVCD in China and five typical regions from 2019 to 2021.
It can be concluded that from 2019 to 2021 (Table 2), the country average NO2 TVCD was 182.83, 188.79, and 216.58 × 10¹³ mol/cm2, respectively. NO2 has been increasing year after year, with a growth rate of 3.26% and 14.72% in 2020 and 2021 compared to the previous year (Figure 3; Table 2). The spatial distribution of NO2 was consistent over the 3 years (Figure 2): the densely populated areas such as central and eastern regions, the Pearl River Delta region, Cheng-Yu district, and some regions of Xinjiang, has a higher NO2 TVCD, while sparsely populated areas such as the western and northern regions, has a lower NO2 TVCD.
Table 2 shows that in 2021, the average NO2 TVCDs of China increased by 14.72% compared with 2020 and by 18.46% compared with 2019. Tropospheric NO2 in some areas of Shanxi, Shaanxi, Inner Mongolia, Beijing, Tianjin, Hebei, and other provinces (autonomous regions and cities) was decreased in 2021 compared with 2019, while most of the other regions had an upward trend.
The differences of NO2 TVCD between 2020 and 2019 are shown in Figure 4. Table 2 and Figure 4 show that the national wide NO2 TVCD increased 3.26% in 2020 compared with 2019. The tropospheric NO2 of Beijing, Tianjin, Hebei, Shanxi, Hubei, Shanghai, and some other regions decreased, while in Jilin, Heilongjiang, Sichuan, Guizhou, Yunnan, and other regions it increased.
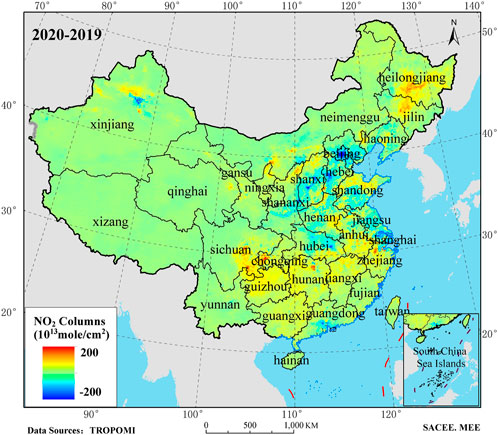
FIGURE 4. Variation of NO2 TVCD in 2020 compared to 2019.
The statistics of the annual average value, variation, and change rate of NO2 TVCD in five regions from 2009 to 2021 are shown in Figure 5 and Table 2. In 2021, the mean of NO2 TVCD in Beijing-Tianjin-Hebei Region and surrounding “2 + 26″cities were the highest, at up to 919.54 × 10¹³ mol/cm2, with an increase of 11.21% and 14.23% compared to 2019 and 2020, respectively. In 2021, the average NO2 TVCD in the Yangtze River Delta was 618.15 × 10¹³ mol/cm2, with an increase of 23.22% and 21.18% compared to 2019 and 2020, respectively. In 2021, the mean NO2 TVCDs in Fen-Wei plains, the Pearl River Delta, and the Chengdu-Chongqing Region were 483.96, 519.30, and 398.52 × 10¹³ mol/cm2, increased by 3.2%, 13.95%, and 28.14% compared with 2019, respectively.
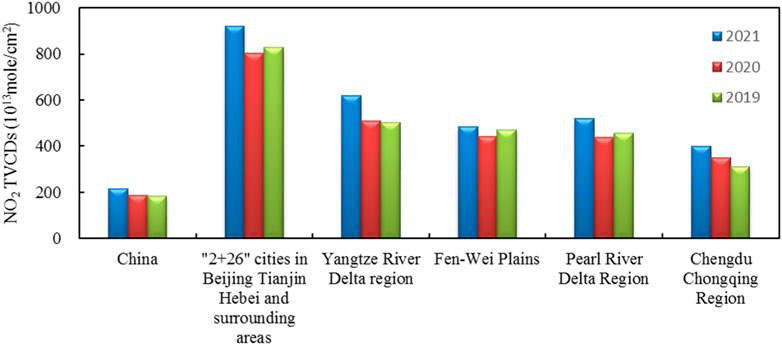
FIGURE 5. Annual mean NO2 TVCD in China and five typical regions from 2019 to 2021.
The monthly average value, variation, and year-on-year change rate of NO2 TVCDs in China from 2019 to 2021 were statistically analyzed, as shown in Figure 6 and Table 3. In 2021, China’s highest monthly mean of NO2 TVCD was 344.61 × 10¹³ mol/cm2 in January, while the lowest value was 139.77 × 10¹³ mol/cm2 in August. Compared with the same period in 2019, the monthly mean value of 2021 increased, with the largest increase rate of 35.03% in January. December took second place with an increase rate of 24%, and the smallest increase rate was 4.13% in September. Compared with the same period in 2020, the monthly mean value of 2021 increased except for December. The largest increase rate of 68.83% appeared in January, February took second place with an increase rate of 53.57%, while a decrease rate of 10% was observed in December. In 2020, China’s highest monthly mean of NO2 TVCD was 370.11 × 10¹³ mol/cm2 in December, and the lowest value was 126.89 × 10¹³ mol/cm2 in February. A decrease rate of 20% was observed in January and February compared with the same period in 2019.
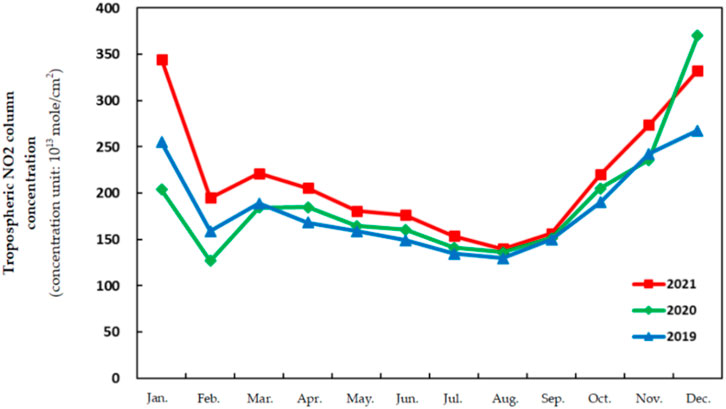
FIGURE 6. Monthly variations of NO2 TVCD from 2019 to 2021.
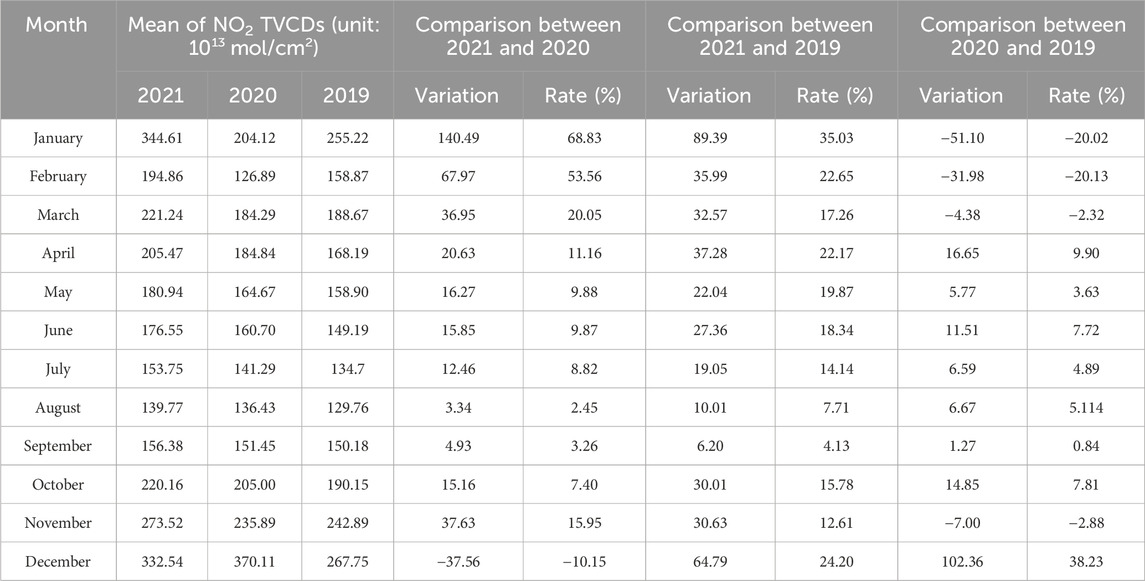
TABLE 3. NO2 TVCDs and year-on-year change rate.
The monthly variation trend of NO2 TVCDs in 2019–2021 is similar, showing a relatively high concentration in winter and spring, and a relatively low concentration in summer. The NO2 TVCDs increases in autumn and winter mainly because of more energy consumption. Starting October 1, heating will begin in northern China as temperatures drop, which will increase coal consumption and lead to higher emissions. Meanwhile, the Chinese traditional festival Spring Festival usually falls at the end of January or the beginning of February, people have a long holiday from the Spring Festival, during which some enterprises will stop production or reduce production, and pollutant emission will decrease, resulting in a decrease in the concentration of NO2 TVCDs in February. This phenomenon is also been interpreted as “Spring Festival effect”.
COVID-19, which began at the end of 2019, had lasted for 2 years by the end of 2021. COVID-19 has affected China’s industrial production and people’s travel and lives. The impact of COVID-19 in China can be indirectly reflected through the temporal–spatial distribution and variation of tropospheric NO2. Meanwhile, the industrial structure changes and environmental policies have also had an impact on NO2 emissions. The prevention and control of atmospheric pollution work carried out by the Ministry of Ecology and Environment from June to September 2020 has contributed to atmospheric environmental governance. The specific impact analysis is explained in the following subsections.
The GDP data from the National Bureau of Statistics of China showed that China is in a “three-two-one” industrial pattern at present. The tertiary industry is gradually moving into a dominant position and the proportion is steadily increasing, while the proportion of the secondary industry is decreasing as the added value is gradually increasing. China’s structure of energy consumption is characterized by rich coal, poor oil, and less gas. The secondary industry has a strong energy consumption capacity, so it has a significant impact on environmental pollution.
During the “11th Five-Year plan period of China” (2006–2010), Control Total of air pollutants were carried on, there was no definite bounded target for nitrogen oxides (NOx) emission, the China NO2 TVCDs from OMI increased year by year (Zhou et al., 2016b). During the “12th Five-Year Plan period of China” (2011–2015), NOx emission reduction targets were specified, and the importance of atmospheric environment protection reached an unprecedented stage (Zhu, 2018).
With the growth of economy, NO2 TVCDs showed an obvious downward trend from 2012 to 2020. During this period, crude oil consumption continued to grow, and coal consumption was higher than in 2011 (Table 4; Figure 7; Appendix B). A boom in desulphurization, denitrification and dust removal in key industries was opened, and the standard of waste gas discharge fees was greatly increased from 2012. China’s economic growth is no longer positively correlated with NO2 TVCDs from 2012. Desulphurization, denitrification and other end of pipe control measures in key industries may play an important role in it.
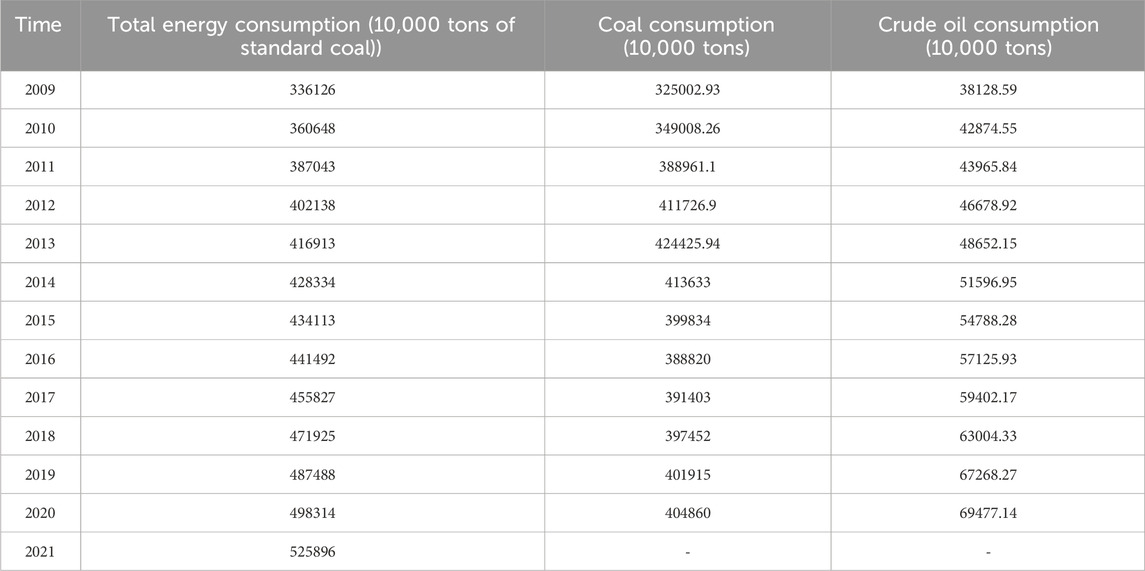
TABLE 4. China energy consumption from 2009 to 2021.
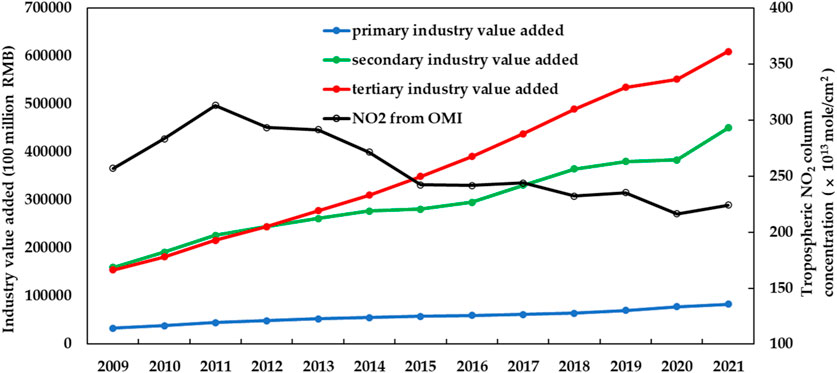
FIGURE 7. Annual trends of NO2 TVCDs and the primary, secondary, and tertiary industry value added of China from 2009 to 2021.
In December 2019, COVID-19 broke out in Wuhan, and spread quickly across the country. The government of China carried out lockdown measurements on January 2020 in Wuhan to prevent the further spread of the COVID-19, and these measurements extending rapidly to other provinces (Tian et al., 2020; Zhou et al., 2021). The public transport in Wuhan was shut down from January 23 to 8 April 2020. These measurements had great impact on transportation and economic activities (Ali et al., 2021).
The monthly average NO2 TVCDs of China from January to March 2020 decreased compared to 2019, NO2 TVCDs in February decreased to an extremely low level in February (Table 3). The NO2 TVCDs gradually reached or exceeded the level of the same period of 2019 from April 2020. At the same time, the growth rate of GDP in the first quarter of 2020 showed a negative growth for the only time from 2009 to 2021 (Figure 8), and the increment of GDP_current in the second quarter of 2020 decreased compared to other years. These are consistent with lockdowns for COVID-19.
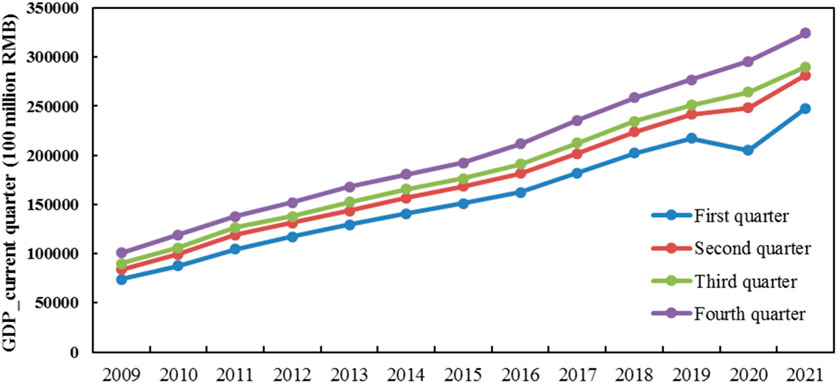
FIGURE 8. GDP_current quarter of China from 2009 to 2021.
COVID-19 affected the tropospheric NO2 mainly by impacting industrial production and transportation trip, while it has little impact on domestic combustion. It might even boost domestic combustion as people spend more time at home. Therefore, the COVID-19 pandemic has a greater impact on developed cities with high industrial activity and high population density than cities with smaller populations and less industrial activity.
The impact of COVID-19 was mainly concentrated in the first quarter of 2020. During this period, The NO2 TVCDs of 2020 decreased in Beijing-Tianjin-Hebei and the surrounding “2 + 26”cities, Fen-Wei plains, and the Pearl River Delta areas, especially in Beijing, Shanghai and Wuhan (More developed city) compared to 2019 (Table 2; Figure 4). The traffic, transportation, and industrial production of densely populated cities were busy before COVID-19, and declined when affected by COVID-19, while other areas were less affected. After the initial outbreak, with the implementation of normalized prevention and control, COVID-19 mainly affected people’s transportation to a certain extent, while industrial production and people’s lives were almost unaffected. When China completely lifts the lockdowns and resumes large-scale industrial production, NO2 will catch up with or even surpass the level before the COVID-19.
NO2 mainly comes from the high-temperature combustion of fuels such as petroleum or coal. The sources of NO2 in cities are mainly from transportation and industrial production emissions. Table 5 shows that the passenger turnover in 2020 and 2021 decreased by 44.11% and 45.54% compared with 2019. In 2020, the freight turnover decreased by 5.99% compared with 2019, while it increased by 4.30% in 2021 compared with 2019. The normalized prevention and control of the COVID-19 reduced passenger travel, but it had less impact on freight turnover because of the need to ensure the daily needs of residents and industrial production were met. At the same time, China’s gasoline apparent consumption decreased by 1.88% and 7.17% in 2021 and 2020 compared with 2019, respectively. The decline of transportation played a positive role on the decline of NO2 TVCDs.
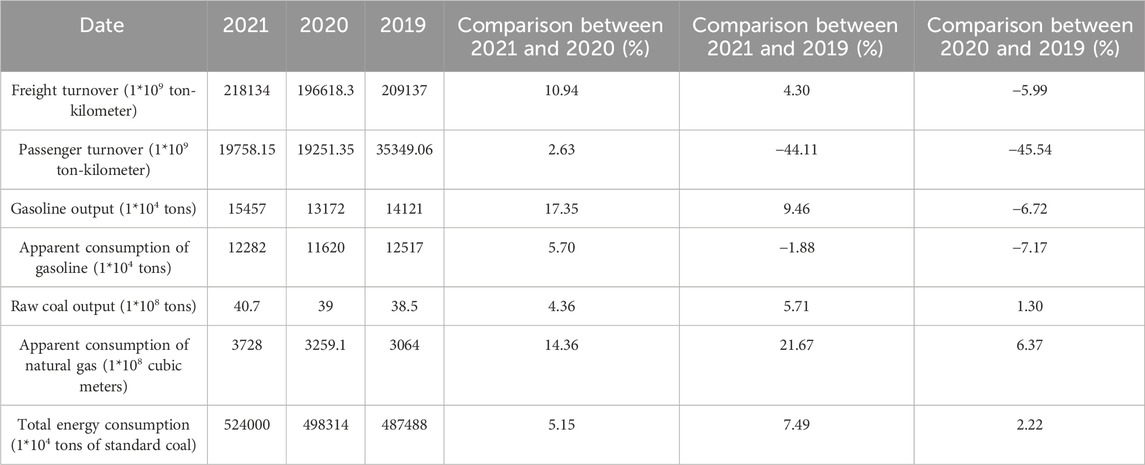
TABLE 5. In 2019–2021, China’s freight turnover, passenger turnover, gasoline production, gasoline apparent consumption, raw coal production, gas apparent consumption, and total energy consumption statistics.
Air pollution prevention and control has always been an important part of China’s environmental protection, and keep improving with the evolution of the main air environment problem appeared in the process of economic development. Over the past decades, China has done a lot of work in air pollution prevention and control, and achieved remarkable results (Chai, 2020).
The new “Ambient air quality standards” was issued in 2012, and “Action Plan for Prevention and Control of Air Pollution” was issued in 2013. “Environmental Protection Supervision Program (Trial)” and “Law of the People’s Republic of China on the Prevention and Control of Atmospheric Pollution (2015)” in 2015, all these have contributed to the improvement of air quality (Chai, 2020).
China has done a lot of work in air pollution control and air quality management, especially in some typical industrial regions (“2 + 26”cities in Beijing-Tianjin-Hebei and surrounding areas, Yangtze River Delta region, Fen-Wei Plains and other regions) (Chai, 2020). These policies include fuel desulfurization and denitrification measures, the elimination and upgrading of waste industrial facilities, the improvement of environmental protection related technologies, the use of clean energy, etc. (Table 6), and these measures have played an important role in the NO2 treatment process, especially in industrial cities.
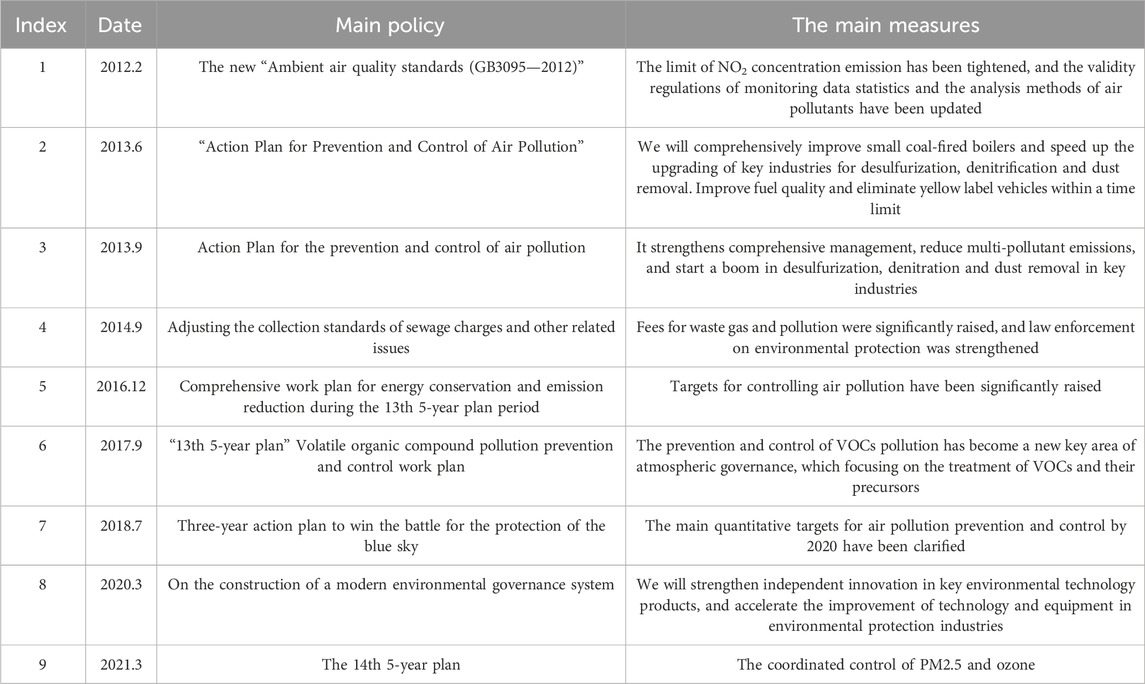
TABLE 6. List of major policies for air pollution prevention and control in China.
The NO2 TVCDs of “2 + 26”cities and Fen-Wei plains (95 cities) decreased by 2.57% and 5.36% in 2020 compared to 2019 respectively, which exceeded the China average decrease (Table2).
Figure 7 shows that the secondary industry value added of China grew steadily from 2009 to 2021, while the NO2 TVCDs of China decreased from 2011 to 2019. The tertiary industry value added exceeded the secondary industry value added from 2012. This indicates that the effects of national atmospheric environmental management policy began to show in 2012, the secondary industry value added continued to grow with NO2 TVCDs showed a downward trend from 2012 to 2019, especially in 2014, 2015, and 2018.
The meteorological influences may be twofold (Fan et al., 2021). Meteorological conditions can contribute to the pollution formation, especially in winter in northern China (Li et al., 2018; Wang et al., 2019). Meanwhile, the transport of clean air provided by meteorological conditions can reduce the concentration of atmospheric pollutants (Li et al., 2018; Wang et al., 2019). Precipitation and wind speed have the greatest impact on air pollutants, among other meteorological factors. Many studies have shown that there is a negative correlation between NO2 concentration and precipitation or wind speed in China (Zhou et al., 2016a; Li et al., 2018; Wang et al., 2019).
According to the Meteorological center data of China Meteorological Administration (http://data.cma.cn/), China has entered an extreme warm and humid pattern in recent 10 years. The last 10 years (2012–2021) were the warmest and wettest on record in China. As it gets hotter, so does the precipitation. Meteorological conditions are generally conducive to the diffusion of air pollutants. Meteorological conditions played a positive role in NO2 decline during 2012–2021.
Soil is also an important emission source of atmospheric NOx. Some studies have shown that the nitrogen oxide emissions of soil in North China Plain in summer can reach 20% of the man-made nitrogen oxide emissions (Lu et al., 2021). According to the emission inventory, the soil NOx emissions contributed to 17.3% of the total emissions during 2017 (Shen et al., 2022). This paper did not conduct an in-depth study on the emission of NOx from agricultural activities during 2009–2021. The change of NO2 TVCDs in this paper also included the influence of soil emission.
This study monitored the tropospheric NO2 column concentration of China from 2009 to 2021 based on OMI and TROPOMI product, and analyzed the factors related to the change of NO2, including COVID-19, transportation, the secondary/tertiary industry value added, apparent consumption of raw coal and gasoline, and GDP.
The following conclusions can be drawn:
(1) The effects of national atmospheric environmental management policy began to show in 2012, the secondary industry value added continued to grow with NO2 TVCDs showed a downward trend from 2012 to 2020, especially in 2014, 2015and 2018. China’s economic growth is no longer positively correlated with NO2 TVCDs from 2012. Desulphurization, denitrification and other end of pipe control measures in key industries may play an important role in it.
(2) A series of measures were carried out especially in some typical industrial regions (“2 + 26”cities in Beijing-Tianjin -Hebei and surrounding areas, Yangtze River Delta region, Fen-Wei Plains and other regions), which may reduce NO2 emissions in these areas. The national air pollution prevention and control work is more obvious in industrial cities.
(3) COVID-19 mainly affected the first quarter of 2020, leading to significantly reduced transportation and industrial production. The NO2 TVCDs reached a very low value, and the sequential growth rate of GDP had a rare negative growth period.
This paper only analyzes the overall changes of NO2 TVCDs and the influences of national policies, industrial production and transportation, without removing the influences of meteorological and soil emission factors. Future work can combine meteorological and soil emission factors to quantitatively analyze industrial production emissions and transportation emissions.
The raw data supporting the conclusion of this article will be made available by the authors, without undue reservation.
YZ: Software, Validation, Writing–review and editing. LC: Validation, Investigation, Writing–original draft. WG: Investigation, Writing–original draft, Resources. CZ: Methodology, Writing–original draft. ZL: Supervision, Writing–review and editing.
The author(s) declare that no financial support was received for the research, authorship, and/or publication of this article. This research was funded by the Major Projects of High Resolution Earth Observation Systems of National Science and Technology (05-Y30B01-9001-19/20-3).
The GDP, turnover of freight and passenger, energy consumption data used in this study are all from the National Bureau of Statistics of the People’s Republic of China. TROPOMI tropospheric NO2 column concentration products are provided by TEMIs (tropospheric emission monitoring Internet service).
The authors declare that the research was conducted in the absence of any commercial or financial relationships that could be construed as a potential conflict of interest.
All claims expressed in this article are solely those of the authors and do not necessarily represent those of their affiliated organizations, or those of the publisher, the editors and the reviewers. Any product that may be evaluated in this article, or claim that may be made by its manufacturer, is not guaranteed or endorsed by the publisher.
Ali, G., Abbas, S., Qamer, F. M., Wong, M. S., Rasul, G., Irteza, S. M., et al. (2021). Environmental impacts of shifts in energy,emissions, and urban heat island during the COVID-19 lockdown across Pakistan. J. Clean. Prod. 291, 125806. doi:10.1016/j.jclepro.2021.125806
Boersma, K. F., Eskes, H. J., Veefkind, J. P., Brinksma, E. J., vander, A., Sneep, M., et al. (2007). Near-real time retrieval of tropospheric NO2 from OMI. Atmos. Chem. Phys. 7 (8), 2103–2118. doi:10.5194/acp-7-2103-2007
Bradshaw, J., Davis, D., Grodzinsky, G., Smyth, S., Newell, R., Sandholm, S., et al. (2000). Observed distributions of nitrogen oxides in the remote free troposphere from the NASA global tropospheric experiment programs. Rev. Geophys 38, 61–116. doi:10.1029/1999rg900015
Burrows, J. P., Weber, M., Buchwitz, W., Rozanov, V., Ladstätter-Weißenmayer, A., Richter, A., et al. (1999). The global ozone monitoring experiment (GOME): mission concept and first scientific results. Atmos. Sci. 56, 151–175. doi:10.1175/1520-0469(1999)056<0151:tgomeg>2.0.co;2
Chai, F. H. (2020). Review and prospect on the atmospheric pollution control in China. Environ. Sustain. Dev. (3), 5–15. doi:10.19758/j.cnki.issn1673-288x.202003005
Fan, C., Li, Y., Guang, J., Li, Z., Elnashar, A., Allam, M., et al. (2020). The impact of the control measures during the COVID-19 outbreak on air pollution in China. Remote Sens. 12, 1613. doi:10.3390/rs12101613
Fan, C., Li, Z., Li, Y., et al. (2021). Variability of NO2 concentrations over China and effect on air quality derived from satellite and ground-based observations. Atmos. Chem. Phys. 2021 (10), 7723–7748. doi:10.5194/acp-21-7723-2021
Fioletov, V. E., McLinden, C. A., Krotkov, N., Yang, K., Loyola, D. G., Valks, P., et al. (2013). Application of OMI, SCIAMACHY, and GOME-2 satellite SO2 retrievals for detection of large emission sources. J. Geophys Res. Atmos. 118, 11399–11418. doi:10.1002/jgrd.50826
Fishman, J., Bowman, K. W., Burrows, J. P., Richter, A., Chance, K. V., Edwards, D. P., et al. (2008). Remote sensing of tropospheric pollution from space. Bull. Am. Meteorol. Soc. 89 (6), 805–822. doi:10.1175/2008bams2526.1
Kleipool, Q., Ludewig, A., Babić, L., Bartstra, R., Braak, R., Dierssen, W., et al. (2018). Pre-launch calibration results of the TROPOMI payload on-board the Sentinel-5 Precursor satellite. Atmos. Emas Tech. 11 (12), 6439–6479. doi:10.5194/amt-11-6439-2018
Lee, D. S., Kőhler, I., Grobler, E., Rohrer, F., Sausen, R., Gallardo-Klenner, L., et al. (1997). Estimations of global no, emissions and their uncertainties. Atmos. Environ. 31, 1735–1749. doi:10.1016/s1352-2310(96)00327-5
Li, K., Liao, H., Cai, W., and Yang, Y. (2018). Attribution of anthropogenic influence on atmospheric patterns conducive to recent most severe haze over eastern China. Res. Lett. 45 (45), 2072–2081. doi:10.1002/2017gl076570
Lin, J. T. (2011). Satellite constraint for emissions of nitrogen oxides from anthropogenic, lightning and soil sources over East China on a high-resolution grid. Atmos. Chem. Phys. 11 (6), 29807–29843.
Liu, F., Page, A., Strode, S. A., Yoshida, Y., Choi, S., Zheng, B., et al. (2020). Abrupt decline in tropospheric nitrogen dioxide over China after the outbreak of COVID-19. Sci. Adv. 6, eabc2992–6. doi:10.1126/sciadv.abc2992
Liu, X. T., Zheng, T. F., Wan, Q. L., et al. (2015). Spatio-temporal characteristics of NO2 in concentrated prd urban districts and analysis of anthropogenic in fluences based on OMI remote sensing data. China Environ. Sci. 31 (2), 193–201.
Lorente, A., Folkert Boersma, K., Yu, H., Dörner, S., Hilboll, A., Richter, A., et al. (2017). Structural uncertainty in air mass factor calculation for NO&lt;sub&gt;2&lt;/sub&gt; and HCHO satellite retrievals. Atmos. Meas. Tech. 10 (3), 759–782. doi:10.5194/amt-10-759-2017
Lu, X., Ye, X., Zhou, M., Zhao, Y., Weng, H., Kong, H., et al. (2021). The underappreciated role of agricultural soil nitrogen oxide emissions in ozone pollution regulation in North China. Nat. Commun. 12, 5021. doi:10.1038/s41467-021-25147-9
Martin, R. V. (2008). Satellite remote sensing of surface air quality. Atmos. Environ. 42 (34), 7823–7843. doi:10.1016/j.atmosenv.2008.07.018
Martin, R. V., Chance, K., Jacob, D. J., Kurosu, T. P., Spurr, R. J. D., Bucsela, E., et al. (2002). An improved retrieval of tropospheric nitrogen dioxide from GOME. J. Geophy Res. 107, D20. doi:10.1029/2001jd001027
Platt, U., Perner, D., and Paetz, H. (1979). Simultaneous measurement of atmospheric CH2O, O3 and NO2 by differential optical absorption. J. Geophys. Res. 84 (10), 6329–6335. doi:10.1029/jc084ic10p06329
Qin, Y., and Zhao, C. S. (2003). Fundamentals of atmospheric chemistry. Beijing: China: China Meteorological Press, 73–76.
Richter, A., and Burrows, J. P. (2002). Tropospheric NO2 from GOME measurements. Remote Sens. Trace Const. Low. Stratos. Troposphere Earth’s Surf. Glob. Observations, Air Pollut. Atmos. Correct. 29 (11), 1673–1683. doi:10.1016/s0273-1177(02)00100-x
RonaldMijling, J., Ding, J., Koukouli, M. E., Liu, F., Li, Q., Mao, H., et al. (2017). Cleaning up the air: effectiveness of air quality policy for SO2 and NOx emissions in China. Atmos. Chem. Phys. 17, 1775–1789. doi:10.5194/acp-17-1775-2017
Shen, Y., Xiao, Z., Wang, Y., Yao, L., and Xiao, W. (2022). Multisource remote sensing based estimation of soil NOx emissions from fertilized cropland at high-resolution: spatio-temporal patterns and impacts. J. Geophys. Res. Atmos. 127. doi:10.1029/2022JD036741
Silver, B., He, X. Y., R Arnold, S., and V Spracklen, D. (2020). The impact of COVID-19 control measures on air quality in China. Environ. Res. Lett. 15, 084021. doi:10.1088/17489326/aba3a2
Sogacheva, L., Rodriguez, E., Kolmonen, P., Virtanen, T., Saponaro, G., de Leeuw, G., et al. (2018). Spatial and seasonal variations of aerosols over China from two decades of multi-satellite observations—Part 2: AOD time series for 1995–2017 combined from ATSR ADV and MODIS C6.1 and AOD tendency estimations. Atmos. Chem. Phys. 18, 16631–16652. doi:10.5194/acp-18-16631-2018
Solomon, S., Qin, D., Manninget, M., et al. (2007). Climate change 2007: the physical science basis. Contribution of working group I to the fourth assessment report of the intergovernmental panel on climate change. Cambridge: Cambridge University Press.
Tang, X. Y., Zhang, Y. H., and Shao, M. (2005). Atmospheric environmental chemistry. Second Edition. Beijing: China: Higher Education Press.
Tao, J. H., Fan, M., Gu, J. B., and Chen, L. F. (2020). Satellite observations of the return-to-work over China during the period of COVID-19. J. Remote Sens. Chin. 24 (7), 824–836. doi:10.11834/jrs.20200098
Tao, J. H., Wang, Z. F., Han, D., Li, S. S., Su, L., and Chen, L. F. Analysis of crop residue burning and tropospheric NO2 vertical column density retrieved from satellite remote sensing in North China [J]. China Environ. Sci., 2009, 29(10):1016–1020.
Tian, H., Liu, Y., Li, Y., Wu, C. H., Chen, B., Kraemer, M. U. G., et al. (2020). An investigation of transmission control measures during the first 50 days of the COVID-19 epidemic in China. Science 368, 638–642. doi:10.1126/science.abb6105
van Geffen, J. H. G. M., Eskes, H. J., Boersma, K. F., Maasakkers, J. D., and Veefkind, J. P. (2020). TROPOMI ATBD of the total and tropospheric NO2 data products. Available at: http://www.tropomi.eu/documents/atbd/ (Accessed on April 10, 2020).
Veefkind, J. P., Aben, I., McMullan, K., Förster, H., de Vries, J., Otter, G., et al. (2012). TROPOMI on the ESA Sentinel-5 Precursor: a GMES mission for global observations of the atmospheric composition for climate, air quality and ozone layer applications. Remote Sens. Environ. 120, 70–83. doi:10.1016/j.rse.2011.09.027
Velders, G. J. M., Granier, C., Portmann, R. W., Pfeilsticker, K., Wenig, M., Wagner, T., et al. (2001). Global tropospheric NO2 column distributions: comparing 3-D model calculations with GOME measurements. J. Geophy Res. 106, 12643–12660. doi:10.1029/2000jd900762
Vîrghileanu, M., Săvulescu, I., Mihai, B.-A., Nistor, C., and Dobre, R. (2020). Nitrogen dioxide (NO2) pollution monitoring with sentinel-5P satellite imagery over europe during the coronavirus pandemic outbreak. Remote Sens. 12, 3575. doi:10.3390/rs12213575
Wang, C., Wang, T., Wang, P., and Rakitin, V. (2020). Comparison and validation of TROPOMI and OMI NO2 observations over China. Atmosphere 11 (6), 636. doi:10.3390/atmos11060636
Wang, H., Li, J., Peng, Y., Zhang, M., Che, H., and Zhang, X. (2019). The impacts of the meteorology features on PM2.5 levels during a severe haze episode in central-east China. Atmos. Environ. 197 (197), 177–189. doi:10.1016/j.atmosenv.2018.10.001
Wang, Q., and Su, M. (2020). A preliminary assessment of the impact of COVID-19 on environment – a case study of China. Sci. Total Environ. 728, 138915. ISSN 0048-9697. doi:10.1016/j.scitotenv.2020.138915
Wang, T., Wang, P., Yu, H., and Sun, L. (2014). Analysis of the characteristics of tropospheric NO2 in Xianghe based on MAX-DOAS measurement. Clim. Environ. Res. 19, 51–60.
Yao, L., Lv, N., and Shi, D. H. (2012). Study on spatial-temporal variations in total NO2 column amounts over China using SCIAMACHY data. Huanjing Kexue Yanjiu 25 (4), 419–424.
Zara, M., Boersma, K. F., De Smedt, I., Richter, A., Peters, E., van Geffen, J. H. G. M., et al. (2018). Improved slant column density retrieval of nitrogen dioxide and formaldehyde for OMI and GOME-2A from QA4ECV: intercomparison, uncertainty characterisation, and trends. Atmos. Meas. Tech. 11 (7), 4033–4058. doi:10.5194/amt-11-4033-2018
Zhang, Q., Geng, G. N., Wang, S. W., Richter, A., and He, K. B. (2012). Satellite remote sensing of changes in NOx emissions over China: 1996–2010. Chin. Sci. Bull. 57 (16), 1446–1453. doi:10.1360/csb2012-57-16-1446
Zhang, W., Liu, C., Hao, N., Garcia, G., Xing, C., Zhang, C., et al. (2020). O2-O2 cloud retrieval algorithm and application to TROPOMI. J. Remote Sens. Chin. 24 (11), 1363–1378.
Zheng, Z., Yang, Z., Wu, Z., and Marinello, F. (2019). Spatial variation of NO2 and its impact factors in China: an application of sentinel-5P products. Remote Sens. 11, 1939. doi:10.3390/rs11161939
Zhou, C., Li, Q., Wang, Z., Gao, Y., Zhang, L., Chen, H., et al. (2016a). Spatio–temporal trend and changing factors of tropospheric NO2 column density in Beijing-Tianjin-Hebei region from 2005 to 2014. J. remote Sens. 20 (3), 468–480. doi:10.11834/jrs.20165087
Zhou, C. Y., Li, Q., Zhang, L. J., Ma, P. F., Chen, H., and Wang, Z. T. (2016b). Spatial-temporal change and influencing factors of tropospheric NO2 column density of China during 2005-2015. Remote Sens. Technol. Appl. 31 (6), 1190–1200.
Zhou, C. Y., Wang, Q., Li, Q., et al. (2016c). Spatio-temporal change and influencing factors of tropospheric NO2 column density of Yangtze River Delta in the decade. China Environ. Sci. 36 (7), 1921–1930.
Zhou, M., Jiang, J., Langerock, B., Dils, B., Sha, M. K., and De Mazière, M. (2021). Change of CO concentration due to the COVID-19 lockdown in China observed by surface and satellite observations. Remote Sens. 13, 1129. doi:10.3390/rs13061129
Zhu, Y. S. (2018). The process, characteristic, problem and suggestion of institutional change in air pollution treatment of our country. Sci. Technol. Innovation (11), 177–178.
There are 105 cities in the five regions, including 28 cities in Beijing-Tianjin-Hebei and surrounding “2 + 26”cities, 41 cities in the Yangtze River Delta, 11 cities in the Fen-Wei plains, 9 cities in the Pearl River Delta, and 16 cities in Cheng-Yu district.
China NO2 TVCD of OMI from 2009 to 2021.
Keywords: tropospheric NO2 column density, COVID-19, TROPOMI, OMI, industry value added
Citation: Zhang Y, Chen L, Guo W, Zhou C and Li Z (2024) The variability of NO2 concentrations over China based on satellite and influencing factors analysis during 2019–2021. Front. Environ. Sci. 12:1267627. doi: 10.3389/fenvs.2024.1267627
Received: 26 July 2023; Accepted: 05 February 2024;
Published: 22 February 2024.
Edited by:
Alireza Sharifi, Shahid Rajaee Teacher Training University, IranReviewed by:
Luis Gerardo Ruiz Suárez, National Autonomous University of Mexico, MexicoCopyright © 2024 Zhang, Chen, Guo, Zhou and Li. This is an open-access article distributed under the terms of the Creative Commons Attribution License (CC BY). The use, distribution or reproduction in other forums is permitted, provided the original author(s) and the copyright owner(s) are credited and that the original publication in this journal is cited, in accordance with accepted academic practice. No use, distribution or reproduction is permitted which does not comply with these terms.
*Correspondence: Wei Guo, weiguo@cumtb.edu.cn, Chunyan Zhou, zhoucy@secmep.cn
Disclaimer: All claims expressed in this article are solely those of the authors and do not necessarily represent those of their affiliated organizations, or those of the publisher, the editors and the reviewers. Any product that may be evaluated in this article or claim that may be made by its manufacturer is not guaranteed or endorsed by the publisher.
Research integrity at Frontiers
Learn more about the work of our research integrity team to safeguard the quality of each article we publish.