 Meghan Halabisky1*
 Fang Yuan2
 Ghislain Adimou3
 Eloise Birchall2Edward Boamah3Chad Burton2Ee-Faye Chong2Lisa Hall2Cedric Jorand2Alex Leith2
 Adam Lewis1Bako Mamane4Fatou Mar5
 Negin Moghaddam2David Ongo6Lisa-Maria Rebelo7
- 1Group on Earth Observations, Geneva, Switzerland
- 2Geoscience Australia, Canberra, Australia
- 3African Regional Institute for Geospatial Information Science and Technology (AFRIGIST), Ile-Ife, Nigeria
- 4AGRHYMET, Niamey, Niger
- 5L’Observatoire Du Sahara et Du Sahel, Tunis, Tunisia
- 6Regional Centre for Mapping of Resources for Development (RCMRD), Nairobi, Kenya
- 7Digital Earth Africa, Pretoria, South Africa
Spatially explicit, near real time information on surface water dynamics is critical for understanding changes in water resources, and for long-term water security planning. The distribution of surface water across the African continent since 1984 and updated as every new Landsat scene becomes available is presented here, and validated for the continent for the first time. We applied the Water Observations from Space (WOfS) algorithm, developed and well-tested in Australia, to every Landsat scene acquired over Africa since the mid 1980s to provide spatial information on surface water dynamics over the past 30+ years. We assessed the accuracy of WOfS using aerial and satellite imagery. Four regional geospatial organisations, coordinated through the Digital Earth Africa Product Development Task Team, conducted the validation campaign and provided both the regional expertise and experience required for a continental-scale validation effort. We assessed whether the point was wet, dry, or cloud covered, for each of the 12 months in 2018, resulting in 34,800 labelled observations. As waterbodies larger than 100
1 Introduction
In the coming century, Africa is projected to see an increase in precipitation variability with both wetter and drier extremes (Gan et al., 2016; Nicholson, 2017; Barry et al., 2018), resulting in an increase in the length and severity of agricultural and ecological droughts as well as the frequency and intensity of floods (Milly et al., 2005; de Wit and Stankiewicz, 2006; Gan et al., 2016). High water stress is currently estimated to affect around 250 million people in Africa (World Metereological Organization, 2021); further changes to the hydro-climate will exacerbate water security issues (Boko et al., 2007; Leal Filho et al., 2021).
The 2030 Agenda for Sustainable Development adopted in 2015 called on governments and stakeholders to ensure the availability and sustainable management of water and sanitation for all (United Nations, 2015). Within the 17 Sustainable Development Goals (SDGs), Goal six includes, but importantly also goes beyond, drinking water, sanitation, and hygiene, to address the quality and sustainable use of water resources, as well as the protection and restoration of water-related ecosystems. The African Ministers’ Council on Water (AMCOW) whose mission is to provide political leadership, policy direction and advocacy in the provision, use and management of water resources for sustainable social and economic development and maintenance of African ecosystems, works towards a vision of an Africa where there is equitable and sustainable use and management of water resources for poverty alleviation, socio-economic development, regional co-operation and the environment (AMCOW Initiative, 2023). But a recent assessment found that four out of five African countries are unlikely to have sustainably managed water resources by 2030 (World Metereological Organization, 2021). Strategies to support water resources management decisions require up-to-date information as well as long-term archival data on surface water dynamics.
Digital Earth Africa (DE Africa) addresses these data needs by processing openly accessible and freely available satellite data to produce demand driven, decision-ready products and services. Guided by a Governing Board co-chaired and represented by African ministers, advised by a Technical Advisory Committee (TAC) with the majority of its members based in Africa, and working closely with the AfriGEO community enables the program to respond to the information needs, challenges, and priorities, of partners across the African continent. In 2022, DE Africa transitioned out of an establishment phase into a distributed network of implementing partners across Africa with a program management office in South Africa (SANSA).
Development of operational data and services prioritised by the DE Africa governing bodies in response to end user demand, are created using cloud-native data processing tools from the archive of satellite data captured over Africa since 1984. Powered by Open Data Cube (ODC) technology, (Dhu et al., 2017; Lewis et al., 2017; Killough, 2018)], the platform, which runs on Amazon Web Services (AWS), currently archives over 3.5 petabytes of data including satellite imagery from the Landsat Collection 2 Level-2 in Cape Town, South Africa. The architecture implements AWS Elastic Kubernetes Service to enable the use of thousands of parallel processes on hundreds of servers enabling transferability and scalability of workflows exploiting decades of satellite images across the continent.
The DE Africa Water Observations from Space (WOfS) service, presented here, exploits this infrastructure. Based on an algorithm developed to provide a nationally consistent service for understanding surface water dynamics in Australia (Mueller et al., 2016), WOfS uses the entire Landsat satellite archive over Africa to obtain multiple surface water observations each month across decades of data. WOfS was developed on the Digital Earth Australia ODC and is used in Australia to support a wide variety of applications such as water allocation management by governments (Krause et al., 2021), identification of waterbodies for wildfire management, flood inundation modelling (Huang et al., 2019), floodplain monitoring (Hou et al., 2019), wetland monitoring (Dunn et al., 2023), wildlife management (Perry et al., 2021), and groundwater exploration (Hoare et al., 2016).
Development of complex algorithms for dynamic mapping over large areas requires the use of training data that captures the variability of features across space and time (Halabisky et al., 2018). Transferring and extending algorithms trained in one location to a new location with a different range of temporal and spatial variability across target features can result in poor results (Orynbaikyzy et al., 2022). However, given the similarity in the spectral response of water in different landscapes, and the use of consistent analysis-ready Landsat satellite data, it is possible to extend the WOfS algorithm to the African context without needing to re-train it from the beginning. Applying WOfS to the continent of Africa would allow for an initial deployment of a surface water map service without the need for a lengthy research and development phase. However, while the two continents have some similar climate and geographies, there are many differences and a rigorous accuracy assessment requires local and regional knowledge and expertise. As DE Africa is guided by the principle of fostering national and regional co-production to develop ownership of both the DE Africa program and all products and services, the WOfS validation process was undertaken by the DE Africa Product Development Task Team (PDTT). By leveraging the expertise of the PDTT we are able to test the transferability of the WOfS algorithm to map the distribution of surface water across the African continent to develop a new continental service starting from 1984 and updated as every new Landsat scene becomes available.
2 Materials and methods
2.1 Product development task team
The Product Development Task Team (PDTT) is a working group of Digital Earth Africa composed of program partner members representing several African regional and national geospatial organisations. The PDTT works together to identify shared needs and data gaps for African countries and selects, designs, plans, develops, and validates DE Africa’s continental-scale services and products. The PDTT also provides support in the use and application of DE Africa data products by stakeholders and end users across their broader institutional networks. At the time this project was carried out, the PDTT consisted of the following organisations: L’Observatoire du Sahara et du Sahel (OSS, Tunisia), Regional Centre for Mapping of Resources for Development (RCMRD, Kenya), African Regional Institute for Geospatial Science and Technology (AFRIGIST, Nigeria), and AGRHYMET (Niger), which collectively represented the interests of 43 African countries.
2.2 Study area
The geographical coverage of the data is the African continent, including surrounding islands. Africa exhibits a remarkable range of climate zones, each characterized by distinct weather patterns and ecological conditions (FAO, 2021). The Food and Agriculture Organization of the United Nations (FAO) and the International Institute for Applied Systems Analysis (IIASA) developed a geospatial framework known as agro-ecological zones (AEZ) that enhance understanding and management of the diverse agricultural potential and limitations within a given region (FAO, 2021). These zones are specific geographic areas delineated based on a combination of climate, soil conditions, and other environmental factors that influence agricultural productivity and suitability. Similar to Xiong et al. (2017) in the production of the Global Food Security Support Analysis Data (GFSAD) crop mask we used simplified AEZ to assess regional accuracy by combining smaller AEZs and snapping boundaries to country borders resulting in seven different zones (Table 1).
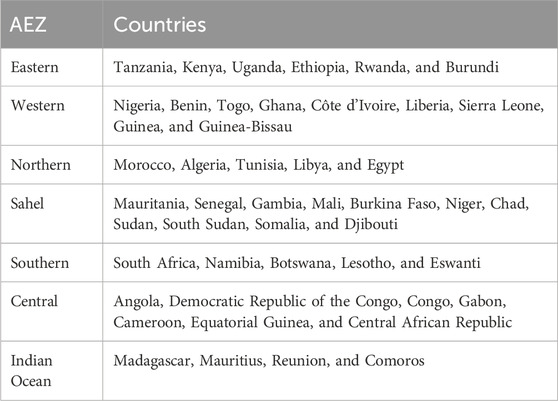
Table 1. List of Agro-Ecological Zones (AEZ) used for this project and the countries covered for each zone.
2.3 Water observations from space (WOfS)
The Water Observations from Space (WOfS) service for Africa was created using an algorithm that has been developed and well-tested in Australia (Mueller et al., 2016). The WOfS algorithm maps surface water for every pixel in an image using a decision tree algorithm that considers surface reflectance measurements in selected spectral bands and a number of normalised difference indices, such as the Modified Normalised Difference Water Index (MNDWI) (Xu 2006). This algorithm is applied to the Landsat Collection two surface reflectance product hosted by DE Africa (DE Africa, 2022). Cloud and cloud shadow classifications are inherited from the Landsat Collection two quality assessment band. Ancillary information derived from observation metadata and the SRTM digital elevation model is used to flag areas where the classification is less reliable. Such areas include steep slopes (greater than 12°), observations with a low solar incidence angle (less than 10°), and regions shadowed by terrain. The WOfS product suite includes daily water observations and statistical summaries. Daily water observations, referred to as Water Observation Feature Layers (WOFLs), identify water in each satellite scene and are generated for new Landsat observations as soon as they become available on the DE Africa platform following satellite acquisition (a typical latency of 2°days). The frequency of inundation of every pixel is calculated in two ways: as a single all-time summary, and as annual summaries, which allow for greater understanding of the dynamic nature of waterbodies and flooding (Figure 1). Through the DE Africa cloud based platform on AWS, around one million Landsat scenes across the entire time series were processed in under 10 hours.
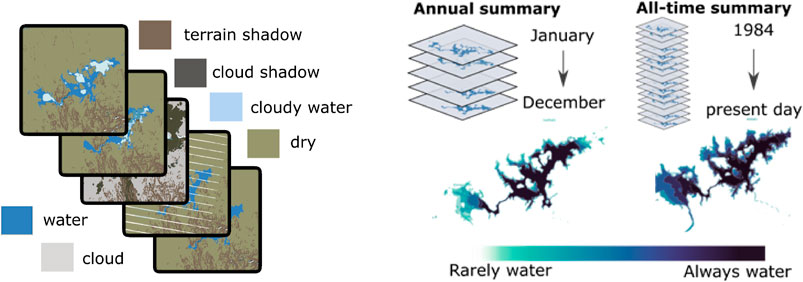
Figure 1. Example WOfS products for Lake Barrage El Mansour Eddahbi near Ouarzazate, Morocco. For every observation, pixels are classified as water or dry, as well as if they are covered by cloud, cloud shadow, or terrain shadow (left). An all-time summary and annual summaries are created from the time series of WOfS calculating the percentage of time a pixel is classified as water, identifying ephemeral and permanent surface water and how it changes over time.
2.4 Validation methods
2.4.1 Validation sampling design
Given the extensive time period of analysis, as well as the continental extent, a validation approach needs to provide insights on both the spatial and temporal accuracy of WOfS. A stratified random sampling scheme was therefore selected, with points assessed as “truth” through interpretation of imagery. Because of the large effort required to create a continental-scale, multi-temporal reference dataset, we selected a sampling design that is independent of the WOfS classification so that it can be used to compare future versions of WOfS (which may use new algorithms or other types of satellite images, i.e., Sentinel-2) as well as other existing maps of surface water.
A key aspect of validation is the creation of a reference dataset, which in this case would be sensitive to differences between water classifiers and source imagery (Landsat v. Sentinel-2). Water classifiers typically produce accurate results when applied to large open waterbodies, which was not the focus of this map service. Therefore, we masked out large water features with an area of more than 100
We generated sample points covering the continent including the main islands using a stratified random sample to select locations with different water occurrences and waterbody types. First, samples were stratified by the simplified AEZs. We generated 2,900 sample points with a minimum of 300 sample points per AEZ. We increased the number of points to 500 for 4 AEZs that had a higher number of waterbodies. The number of points per AEZ is as follows; Central = 500, Eastern = 500, Western = 500, Southern = 500, Sahel = 300, Indian Ocean = 300, Northern = 300.
Second, within each AEZ, we stratified points using the median Normalised Difference Water Index (NDWI) (McFeeters, 1996) calculated using provisional Collection 2 Landsat-8 data from 2013 to 2019 with clouds and cloud shadows masked out. This is based on the assumption that the median NDWI correlates with water occurrence frequency. We selected NDWI as opposed to MNDWI because NDWI was not included in the WOfS algorithm and we felt it provided a more dependent measure of water. Even though NDWI is not always reliable, we expect water to generally have a high NDWI value and dry land to have a low NDWI value; therefore permanent water will have a high median NDWI calculated over time. Sometimes flooded area will have a median NDWI value between median NDWI measured for permanently wet and permanently dry areas. Cumulative distributions for median NDWI values and WOfS all-time summary detection frequency were compared for each AEZ. In order to ensure a distribution of points across the gradient from permanently flooded to ephemerally flooded, the sample points were stratified into three classes based on the NDWI median: Permanently flooded (median NDWI greater than 0.03, corresponding to approximately >90% detection frequency), Sometimes flooded: (median NDWI between −0.03 and 0.03, or between 60%–90% detection frequency), Rarely flooded (median NDWI less than −0.03, or
For example, for the Central AEZ the sample point breakdown of 500 points was as follows.
We imposed 30 km as a minimum distance between points to avoid clustering in the same waterbody. A further 100 samples stratified in the same way were added to the dataset that all analysts were asked to classify for cross-validation purposes. Points were assessed monthly for 2018. This provided us with 36,000 potential observations (3,000 * 12°months), with the expectation that roughly 50% or less would be cloud-free and that the number of cloud-free observations would vary in the wet and dry seasons.
2.4.2 Validation assessment (response)
We used Collect Earth Online (CEO) an open source, free online tool initially developed by NASA SERVIR, to label our sample points (CEO, 2023). For every sample point, analysts used Sentinel-2 images taken within the first 5°days of each month to assess whether a point was inundated or not. We selected this approach, rather than using monthly composites, to avoid potentially ambiguous interpretation of mean monthly values, and to enable identification of the exact date of the labelled inundation observation. Analysts were able to view the Sentinel-2 imagery as true color or false color composites as well as several different spectral indices including NDVI and NDWI. Analysts marked down all the months where water was detected. They also marked months where there was no water, the image quality was low (i.e., cloudy) or the image could not be assessed because it was hard to determine (e.g., mixed pixel, muddy, sediment). Mapbox high resolution base maps were available to assist in image interpretation, but did not have a date associated and so could not be used for assessment of inundation patterns. In addition, analysts noted the basic land cover type using the classes modified from the NASA Globe Observer land cover classification (NASA Globe Observer, 2023).
To assist image interpretation and to ensure consistency in labelling across analysts, analysts underwent a group training, assessed a common training dataset, and followed up with a one-on-one meeting with the DE Africa Science Team. The original CEO tool was tested out and improved based on input from the PDTT. Each analyst assessed a common set of 80 sample points in order to develop a cross-validation dataset, allowing for an estimation of the consistency of labelling between analysts. Leveraging the rich temporal reference dataset, separate accuracy assessments were performed for all cloud-free observations, and for both the wet and dry seasons.
For all of these accuracy assessments, we removed any points where there were not clear observations due to cloud cover. Because Sentinel-2 images from the first 5°days of a month are used to increase temporal alignment, matching WOfS data are chosen from a window that’s extended by 5°days on each side. If water is detected in any images within this window, the WOfS classification is “water.” We created confusion matrices for the data to allow us to assess the accuracy and calculated overall accuracy, user and producer’s accuracy and F1 (Maxwell et al., 2021). We then examined this information for each AEZ for the wet and dry seasons. We assigned wet and dry seasons for each AEZ based on monthly rainfall information and selected clear observations within 1 month close to the middle of each season, wet and dry. This ensures the data points chosen represent typical conditions for the relevant season.
2.4.3 Qualitative assessment
In addition to the quantitative assessment, the PDTT also conducted a qualitative assessment of the WOfS algorithm performance across the continent by engaging with their network of stakeholders in a myriad of different ways. PDTT members engaged with stakeholders through workshops, phone calls, emails and WhatsApp messages, explaining the purpose of and expectations from the exercise. Stakeholders were asked to examine the WOfS map service on the DE Africa platform and to provide feedback on areas that they were familiar, assessing whether WOfS mapped these areas accurately. The PDTT team also asked potential end users for feedback on the usefulness and potential uses of the WOfS as a continental, near-real time service. The qualitative assessment served two purposes, the first was to assess the visual accuracy and useability of the product, and second was to identify demand for map service derivatives (e.g., summary products), training, and analytical tools that could support uptake and use. In total 44 stakeholders, regional experts, and potential end users were surveyed.
2.5 Co-production of use cases at national and local scales
As part of our co-development process we built open-source workflows (i.e., Jupyter notebooks) for applications at the local and continental scale and applied them to two use cases. The purpose of these use cases was to highlight how WOfS can be summarised at national and continental scales for large-scale assessment and analysis, as well as finer local scales, including hydrologic basins or even individual waterbodies.
Using WOfS, we can calculate water detection frequencies over any defined time period, then estimate the typical water extent above a detection threshold. Summarising WOfS at an annual interval and within each country supports reporting on SDG 6.6.1 (UN water, 2023) change in the extent of water-related ecosystems over time. The annual water extent timeseries further supports detection of anomalies. For example, by comparing the water extent measured in 2020 to the all-time mean for each country, we can identify countries that had an increase or decrease in permanent water availability.
3 Results
For each of the 12°months, 3,000 points were assessed. Not all observations could be labelled as water or not water due to cloud cover, lack of image acquisitions, or uncertainty due to spatial resolution and mixed pixels. After removing data points that could not be labelled, a total number of 11,363 observations in 2,377 locations remained, and were used for the accuracy assessment. 72.8% of these observations were labelled as water (8,293) and 27.2% as not water (3,090). It was expected that cloud cover would limit the number of observations, and that this would vary between wet and dry seasons as well as between AEZ regions. The number of valid points generally correlates with monthly rainfall, a proxy for cloud cover. The PDTT had 93.0% agreement between analysts for the common training dataset.
3.1 All cloud-free observations
The overall accuracy of WOfS at the continental-scale was 82.1%, with a producer’s accuracy of 79.8% and user’s accuracy 94.7% for the water class (Table 2). To reiterate, this accuracy assessment is based on the constrained sample design where large waterbodies were masked out and sampling was focused in more challenging areas (e.g., edges of waterbodies and small waterbodies).
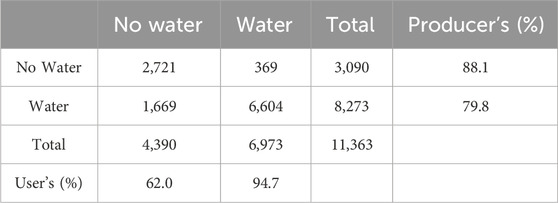
Table 2. Accuracy assessment for all labelled observations across the continent. Overall accuracy (OA) was 82.1% and F1 score for water classification is 0.87.
WOfS accuracy varies across each AEZ with the highest overall accuracy in the Eastern AEZ and lowest in the Indian Ocean AEZ (Figure 2). WOfS performs well in the Eastern and Northern AEZs with an overall accuracy of more than 85%. For all AEZs, except the Western and Indian Ocean AEZs, WOfS achieved overall accuracies of more than 80%. Relatively low producer’s accuracies, or high omission errors, were measured in the Western, Southern and Indian Ocean AEZs. F1 scores for the water classification range from 0.83 to 0.91 in the AEZs.
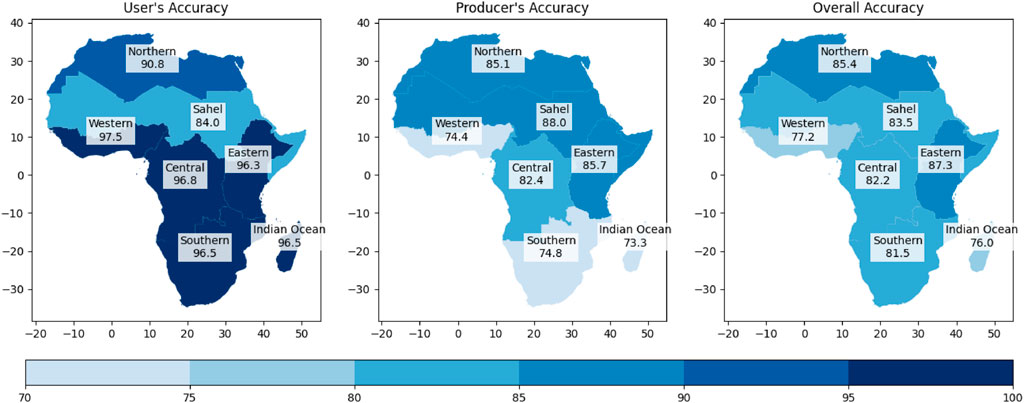
Figure 2. Accuracy assessment results for each AEZ showing user’s accuracy (left), producer’s accuracy (middle), overall accuracy (right).
3.2 Seasonal accuracy
The accuracy of the WOfS varied across wet and dry months for each AEZ. For most AEZs the accuracy improved in the dry season (Table 3). A different trend was measured for the Northern AEZ, where the rainfall variation is small across the year. The lowest accuracy was measured in the wet month in the Western AEZ, coinciding with the lowest number of clear observations. It is in general challenging to map water accurately during high rainfall months in the Western, Central and Indian Ocean AEZs.
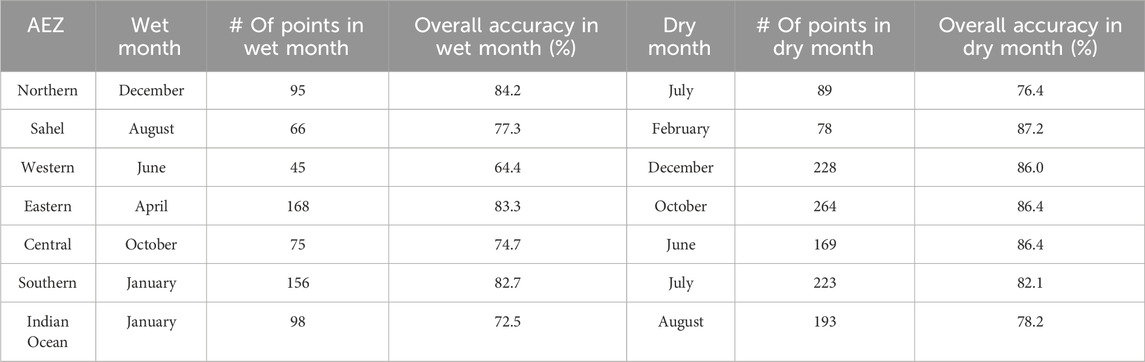
Table 3. Accuracy assessment for the wet and dry seasons of each AEZ (DE Africa, 2022).
Feedback from the qualitative assessment was very positive across all surveyed participants. One stakeholder felt that the service would be a very useful resource not only for researchers in water resources management, but also for practitioners and decision makers in the formulation of water resources management policies. The most common criticism is that the spatial resolution of WOfS was not adequate for small waterbodies and for applications and areas where change was below the spatial resolution on Landsat (30
3.3 Applying WOfS at continental scale
WOfS measures surface water extent and water detection frequencies that can be used to classify permanent and seasonal water bodies. Our continental scale application demonstrated how WOfS can be used to monitor water availability and understand drought and flooding relative to historical data (Figure 3). We found that the anomaly pattern measured by WOfS roughly correlates with the rainfall anomaly estimated for the same period using the monthly CHIRPS rainfall (Funk et al., 2014). Such analysis can be applied at different scales to help users understand changes in surface water extent at a finer detail across the continent.
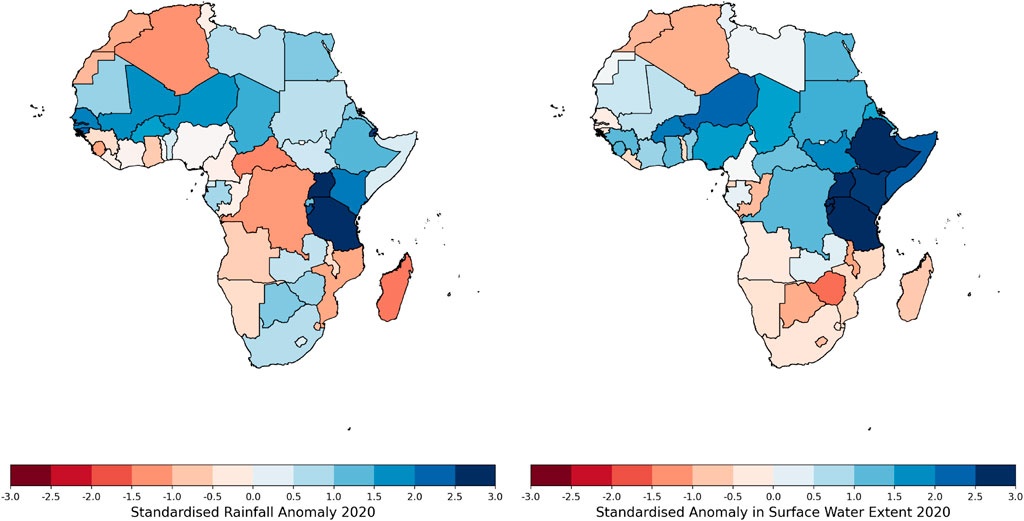
Figure 3. Rainfall (left) and surface water extent (right) anomaly measured for 2020. Surface water extent for a given year includes areas where water is detected in more than 30% of the observations. This threshold was selected to reduce noise. A reference period of 2000–2020 (inclusive) has been used to estimate the mean and standard deviation of total rainfall and total surface water extent within each country. Standardised Anomaly is calculated as the difference between the estimate for 2020 and the mean for the reference period, divided by the standard deviation.
3.4 Applying WOfS at local scale
The results from the use case with AGRYHMET, demonstrated how WOfS can be used to map and monitor changes in Lake Chad to help decision-makers understand year-to-year and long-term changes in surface water area (Figure 4). Floods are recurrent around the Lake and along the rivers that flow into it in the countries of the Lake Chad Basin Commission (LCBC).
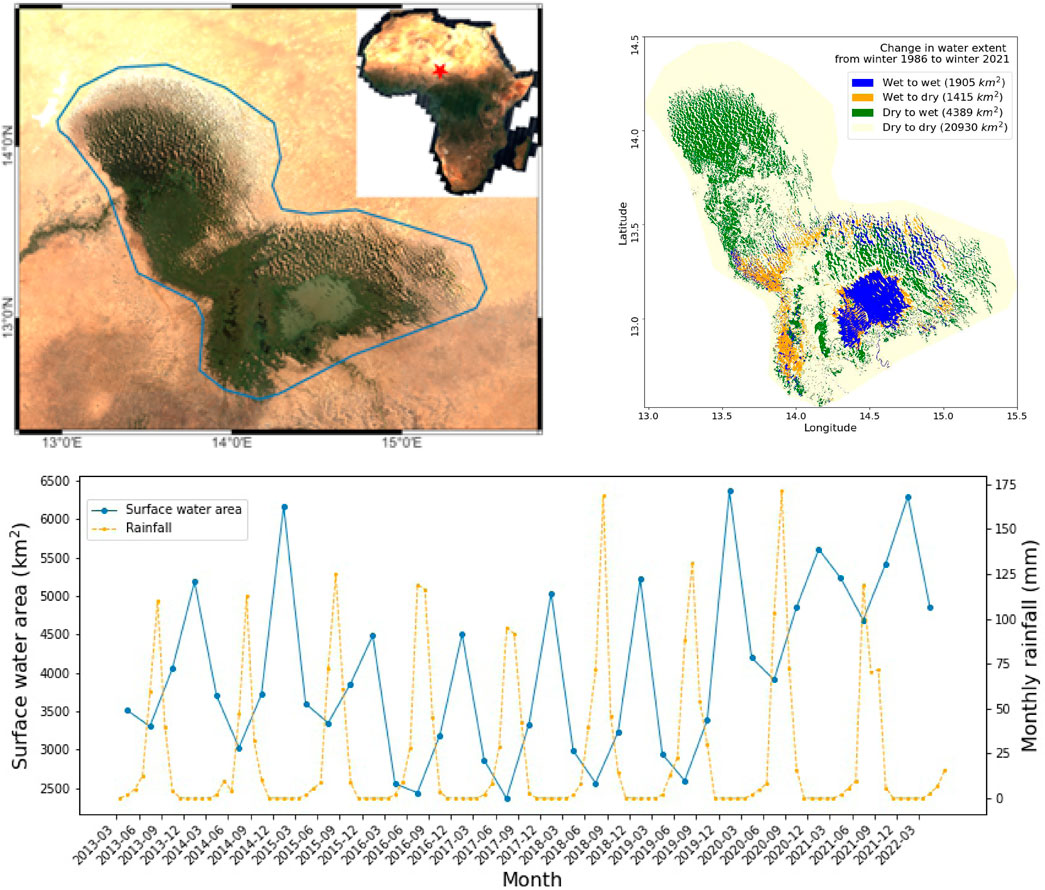
Figure 4. Location (left inset) and spatial extent of the Lake Chad area of interest (upper left); Change in water extent from winter 1986 to winter 2021 (upper right). For each winter season, water observations from December to February next year are summarised. Pixels with more than 20% of water detection frequency within a season are labelled as wet, otherwise as dry. Seasonal change of surface water extent from Spring (March to May) 2013 to Spring 2022, compared to monthly CHIRPS rainfall (bottom). Within each season, surface water extent is calculated including pixels with more than 20% water detection frequency. While this threshold is somewhat arbitrary we selected it to include more dynamic extent (from fewer observations). Lake Chad has increased in surface water area with a shift in the spatial distribution of surface water area. Overall, 24% of the areas has shifted from wet to dry while 76% are from dry to wet.
AGRYHMET found the surface water area was three times greater in 2021 compared to 1986. Not only was there a significant gain in surface water area, there was a shift in the spatial distribution of water. AGRYHMET was able to identify and map areas that have remained wet (1905
4 Discussion
The WOfS algorithm was able to accurately measure surface water across the African continent and through time, with only small variations in accuracy between rainy and dry months and different AEZs. The results from both the quantitative and qualitative accuracy assessment efforts provided the necessary confidence for the DE Africa team to publish the WOfS service as an operational product, updated on a monthly basis, for continent-wide use.
4.1 Considerations and limitations
Our validation effort is limited to what can be detected visually in the Sentinel two imagery. It should be noted that water features obscured by vegetation canopy, terrain shadows, or are too small to detect in Sentinel two imagery may have been missed in the validation labelling process. In addition, the identification of the presence of water is tied to the timing of the satellite overpass. Sentinel two imagery was used here for validation, where it matched a Landsat image acquisition within ± 5°days. There may be instances where waterbodies have dried or shifted within that time period, although we expect the impact on accuracy assessment to be very small.
The WOfS algorithm has several limitations that should be considered when using the WOfS dataset for a specific application. The errors associated with WOfS across the African continent were found to be similar to those noted in Australia, and are largely driven by issues of spatial resolution (i.e., a 30
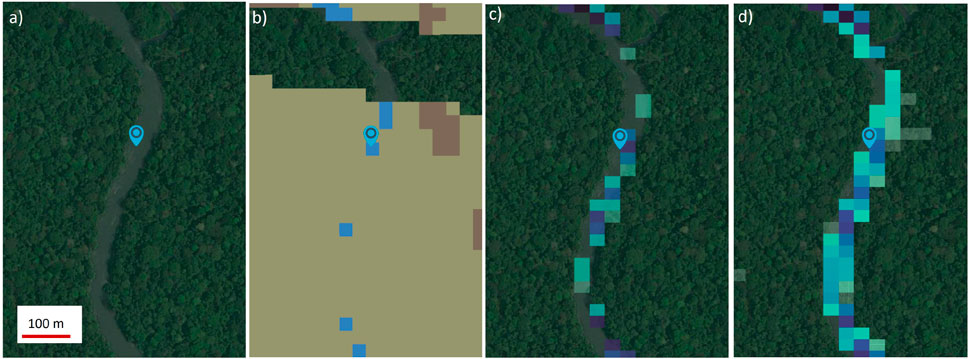
Figure 5. Narrow or small waterbodies (A) may be omitted from individual WOfS observations (WOfLs) (B) if they are close to scales near or below a 30 m pixel resolution. These waterbodies are more likely to be detected in the annual (C) or all-time summary (D), but may have inaccurate estimates of flood frequency. Water is colored light blue in Figure 5B. For a detailed description of the WOfLs classification please reference Figure 1.
Users who want to map and monitor changes to waterbodies smaller than a Landsat pixel should consider applying sub-pixel methods like NDWI (McFeeters, 1996), tasselled cap indices (Fickas et al., 2016), or spectral mixture analysis (Halabisky et al., 2016) and/or use satellite images with a finer spatial resolution such as Sentinel-2, or other very high resolution satellite imagery (Mishra et al., 2020).
The WOfS product is also limited by the 16-day acquisition frequency of Landsat and poor historical coverage by Landsat five over the African continent prior to the year 2000. In some cloudy regions there may be insufficient cloud-free pixels to adequately track changes in surface water dynamics. Specific applications such as flood monitoring may also be limited by the temporal resolution in the rainy season when there is a higher frequency of cloud cover.
The WOfS algorithm was developed for application to analysis ready surface reflectance data with physical reflectance values between 0 and 1. The algorithm is sensitive to inaccuracy in input data and breaks down when negative reflectance values are used. A significant increase in false negative classifications, i.e., where water was detected as dry was observed in the results in situations where aerosol values are estimated to be high in the Landsat Collection two data. This is likely caused by over-correction for atmospheric effects, which has a larger impact on low reflectance values and typically occurs over oceans and large lakes. To avoid masking out potentially useable data over areas with poor coverage, we decided to keep these classifications and to flag pixels with negative reflectance values. Despite this limitation, the validation results demonstrate that WOfS offers a balanced performance over all types of water bodies present within the African landscape.
There are other water classifiers available or are being developed. In principle, we can adopt or develop new open source methods to improve WOfS in the future and the validation dataset created will help to benchmark these new methods. We welcome the use of this dataset by other teams to assess their method. Although we emphasize that matrices created against this validation dataset should be used in combination with other validation methods relevant for specific applications. WOfS is continually being updated as each Landsat scene becomes available. Annual summaries for the previous year and the all-time summary are updated at the start of each year.
4.2 Accessing the methods and dataset
Technical documentation for the WOfS algorithm, product specifications, and guidance for accessing the data through different interfaces is provided in the Digital Earth Africa Data Catalogue (DE Africa, 2022).
WOfS can be explored interactively through the Digital Earth Africa Maps user interface (Figure 6). For further analysis the data are freely accessible through the DE Africa Sandbox; this includes the full WOfS archive with annual and all-time summaries from 1984 to 2022, as well as additional DE Africa analytical workflows to query, analyse and view the data, which can be customized for different user locations of interest.
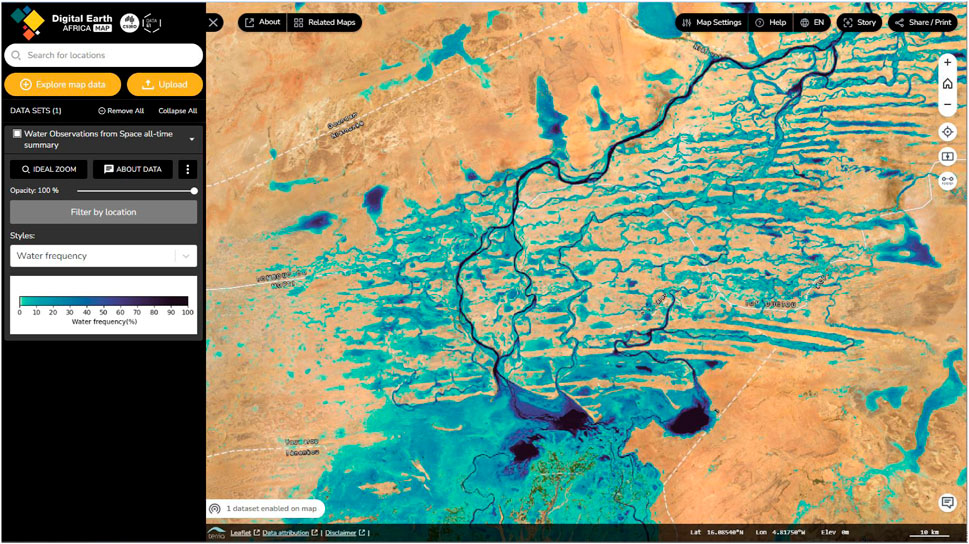
Figure 6. WOfS can be viewed and accessed through the Digital Earth Africa maps platform https://maps.digitalearth.africa.
5 Conclusion
The Water Observations from Space (WOfS) is a Digital Earth Africa operational service that translates decades of satellite imagery into easy-to-consume information on the presence, location and recurrence of surface water across Africa.
The WOfS algorithm, originally developed for Australia, has been successfully applied to the full Landsat satellite archive (since the mid 1980s) for the entire African continent, and has been validated for different time periods and types of waterbodies. WOfS enables users to understand the location and movement of inland (and coastal) water over time. It shows where water is usually present; where it is seldom observed; and where inundation of the surface has been observed by satellite. This allows users across Africa to map, assess, visualise, and manage surface water resources and understand trends over time.
Easily accessible and frequently updated information which is produced consistently across space and time, such as WOfS, is critical for understanding the past as well as present distribution of surface water, and in understanding surface water dynamics and changes to these which are occurring as a result of climate change. This information is important for many critical water security issues such as identifying accessible water sources during dry seasons, planning for and preventing the impacts from flooding and drought, and managing the sustainable use of water resources across scales (site, national, regional).
Data availability statement
The original contributions presented in the study are included in the article/Supplementary Materials, further inquiries can be directed to the corresponding author.
Author contributions
Conceptualization, MH, FY, AL, and LH; methodology, MH, FY, and CB; validation, GA, EB, BM, FM, DO, and NM; formal analysis, MH, FY, CB, EB, and AL; data curation, CB, FY, EB, and NM; writing—original draft preparation, MH and FY; writing—review and editing, CB, L-MR, MH, and FY; visualization, E-FC; project administration, MH; funding acquisition, LH. All authors listed have made a substantial, direct, and intellectual contribution to the work and approved it for publication.
Funding
Digital Earth Africa is funded by the Leona M. and Harry B. Helmsley Charitable Trust and the Australian Government–Department of Foreign Affairs and Trade.
Acknowledgments
We want to acknowledge the United States Geological Survey (USGS) for providing us with provisional Landsat collection two data for the initial development. We want to acknowledge the contributions of our late colleague Ebenezer Victor O. Addabor, a member of the Digital Earth Africa Product Development Task Team, for his passion for the Digital Earth Africa program and feedback on the development of the Wofs service.
Conflict of interest
The authors declare that the research was conducted in the absence of any commercial or financial relationships that could be construed as a potential conflict of interest.
Publisher’s note
All claims expressed in this article are solely those of the authors and do not necessarily represent those of their affiliated organizations, or those of the publisher, the editors and the reviewers. Any product that may be evaluated in this article, or claim that may be made by its manufacturer, is not guaranteed or endorsed by the publisher.
References
Barry, A. A., Caesar, J., Klein Tank, A. M. G., Aguilar, E., McSweeney, C., Cyrille, A. M., et al. (2018). West Africa climate extremes and climate change indices. Int. J. Climatol. 38, e921–e938. doi:10.1002/joc.5420
Boko, M., Niang, I., Nyong, A., Vogel, A., Githeko, A., Medany, M., et al. (2007). Africa climate change 2007: impacts, adaptation and vulnerability: contribution of working group II to the fourth assessment report of the intergovernmental panel on climate change. Cambridge, UK: Cambridge University Press.
[Dataset] AMCOW Initiative (2023). African ministries Council on water. Available at: https://amcow-online.org/(Accessed 06/12/2023.
[Dataset] CEO (2023). Collect Earth online. Available at: https://www.collect.earth/.
[Dataset] DE Africa (2022). Digital Earth Africa water observations from space documentation. Available at: https://docs.digitalearthafrica.org/en/latest/data_specs/Landsat_WOfS_specs.html.
[Dataset] NASA Globe Observer (2023). NASA Globe observer land cover classification. Available at: https://observer.globe.gov/land-cover-classification.
[Dataset] UN water (2023). Integrated-monitoring-initiative-sdg-6. Available at: www.unwater.org/our-work/integrated-monitoring-initiative-sdg-6/indicator-661-change-extent-water-related (Accessed 06/12/2023.
de Wit, M., and Stankiewicz, J. (2006). Changes in surface water supply across Africa with predicted climate change. Science 311, 1917–1921. doi:10.1126/science.1119929
Dhu, T., Dunn, B., Lewis, B., Lymburner, L., Mueller, N., Telfer, E., et al. (2017). Digital earth Australia – unlocking new value from earth observation data. Big Earth Data 1, 64–74. doi:10.1080/20964471.2017.1402490
Dunn, B., Ai, E., Alger, M. J., Fanson, B., Fickas, K. C., Krause, C. E., et al. (2023). Wetlands insight tool: characterising the surface water and vegetation cover dynamics of individual wetlands using multidecadal Landsat satellite data. Wetlands 43, 37. doi:10.1007/s13157-023-01682-7
Fickas, K. C., Cohen, W. B., and Yang, Z. (2016). Landsat-based monitoring of annual wetland change in the Willamette Valley of Oregon, USA from 1972 to 2012. Wetl. Ecol. Manag. 24, 73–92. doi:10.1007/s11273-015-9452-0
Gan, T., Ito, M., Hülsmann, S., Qin, X., Lu, X., Liong, S., et al. (2016). Possible climate change/variability and human impacts, vulnerability of drought-prone regions, water resources and capacity building for Africa. Hydrological Sci. J. 61 (7), 1–18. doi:10.1080/02626667.2015.1057143
Halabisky, M., Babcock, C., and Moskal, L. (2018). Harnessing the temporal dimension to improve object-based image analysis classification of wetlands. Remote Sens. 10, 1467. doi:10.3390/rs10091467
Halabisky, M., Moskal, L. M., Gillespie, A., and Hannam, M. (2016). Reconstructing semi-arid wetland surface water dynamics through spectral mixture analysis of a time series of Landsat satellite images (1984–2011). Remote Sens. Environ. 177, 171–183. doi:10.1016/j.rse.2016.02.040
Hoare, A., Tan, K. P., Stocker, C., Lawrie, K., Halas, L., Mueller, N., et al. (2016). Frontier groundwater investigations in the west Kimberley (Fitzroy) Region: preliminary assessment of groundwater resource potential and the salinity hazard to proposed irrigation developments. ASEG Ext. Abstr. 2016, 1–7. doi:10.1071/ASEG2016ab287
Hou, J., Van Dijk, A. I. J. M., Renzullo, L. J., Vertessy, R. A., and Mueller, N. (2019). Hydromorphological attributes for all Australian river reaches derived from Landsat dynamic inundation remote sensing. Earth Syst. Sci. Data 11, 1003–1015. doi:10.5194/essd-11-1003-2019
Huang, C., Chen, Y., Zhang, S., Li, L., Shui, J., and Liu, Q. (2019). Integrating water observation from space product and time-series flow data for modeling spatio-temporal flood inundation dynamics. Remote Sens. 11, 2535. doi:10.3390/rs11212535
Killough, B. (2018) “Overview of the open data Cube initiative,” in Igarss 2018 - 2018 IEEE international geoscience and remote sensing symposium. Valencia: IEEE, 8629–8632. doi:10.1109/IGARSS.2018.8517694
Krause, C. E., Newey, V., Alger, M. J., and Lymburner, L. (2021). Mapping and monitoring the multi-decadal dynamics of Australia’s open waterbodies using Landsat. Remote Sens. 13, 1437. doi:10.3390/rs13081437
Leal Filho, W., Matandirotya, N. R., Lütz, J. M., Alemu, E. A., Brearley, F. Q., Baidoo, A. A., et al. (2021). Impacts of climate change to African indigenous communities and examples of adaptation responses. Nat. Commun. 12, 6224. doi:10.1038/s41467-021-26540-0
Lewis, A., Oliver, S., Lymburner, L., Evans, B., Wyborn, L., Mueller, N., et al. (2017). The Australian geoscience data Cube — foundations and lessons learned. Remote Sens. Environ. 202, 276–292. doi:10.1016/j.rse.2017.03.015
Maxwell, A. E., Warner, T. A., and Guillén, L. A. (2021). Accuracy assessment in convolutional neural network-based deep learning remote sensing studies—part 1: literature review. Remote Sens. 13, 2450. doi:10.3390/rs13132450
McFeeters, S. K. (1996). The use of the Normalized Difference Water Index (NDWI) in the delineation of open water features. Int. J. Remote Sens. 17, 1425–1432. doi:10.1080/01431169608948714
Milly, P. C. D., Dunne, K. A., and Vecchia, A. V. (2005). Global pattern of trends in streamflow and water availability in a changing climate. Nature 438, 347–350. doi:10.1038/nature04312
Mishra, V., Limaye, A. S., Muench, R. E., Cherrington, E. A., and Markert, K. N. (2020). Evaluating the performance of high-resolution satellite imagery in detecting ephemeral water bodies over West Africa. Int. J. Appl. Earth Observation Geoinformation 93, 102218. doi:10.1016/j.jag.2020.102218
Mueller, N., Lewis, A., Roberts, D., Ring, S., Melrose, R., Sixsmith, J., et al. (2016). Water observations from space: mapping surface water from 25 years of Landsat imagery across Australia. Remote Sens. Environ. 174, 341–352. doi:10.1016/j.rse.2015.11.003
Nicholson, S. E. (2017). Climate and climatic variability of rainfall over eastern Africa. Rev. Geophys. 55, 590–635. doi:10.1002/2016RG000544
Orynbaikyzy, A., Gessner, U., and Conrad, C. (2022). Spatial transferability of random forest models for crop type classification using sentinel-1 and sentinel-2. Remote Sens. 14, 1493. doi:10.3390/rs14061493
Perry, J., Waltham, N., Marshall, J., Negus, P., Steward, A., Blessing, J., et al. (2021). Defining metrics of success for feral animal management in northern Australia. Australia: Tech. rep., CSIRO.
United Nations (2015). Transforming our world: the 2030 Agenda for sustainable development. New York, NY, USA: Tech. rep.
World Metereological Organization (2021). State of the global climate 2021. Geneva, Switzerland: Tech. rep.
Xiong, J., Thenkabail, P. S., Tilton, J. C., Gumma, M. K., Teluguntla, P., Oliphant, A., et al. (2017). Nominal 30-m cropland extent map of continental Africa by integrating pixel-based and object-based algorithms using sentinel-2 and landsat-8 data on google earth engine. Google Earth Engine 9, 1065. doi:10.3390/rs9101065
Keywords: surface water, waterbodies, water security, co-production, Landsat, wetlands
Citation: Halabisky M, Yuan F, Adimou G, Birchall E, Boamah E, Burton C, Chong E-F, Hall L, Jorand C, Leith A, Lewis A, Mamane B, Mar F, Moghaddam N, Ongo D and Rebelo L-M (2024) A dynamic surface water extent service for Africa developed through continental-scale collaboration. Front. Environ. Sci. 12:1251315. doi: 10.3389/fenvs.2024.1251315
Received: 01 July 2023; Accepted: 15 July 2024;
Published: 26 August 2024.
Edited by:
Maria Ilhéu, University of Evora, PortugalReviewed by:
Sushel Unninayar, Morgan State University, United StatesRonghai Hu, University of Chinese Academy of Sciences, China
Catherine Ticehurst, Commonwealth Scientific and Industrial Research Organisation (CSIRO), Australia
Copyright © 2024 Halabisky, Yuan, Adimou, Birchall, Boamah, Burton, Chong, Hall, Jorand, Leith, Lewis, Mamane, Mar, Moghaddam, Ongo and Rebelo. This is an open-access article distributed under the terms of the Creative Commons Attribution License (CC BY). The use, distribution or reproduction in other forums is permitted, provided the original author(s) and the copyright owner(s) are credited and that the original publication in this journal is cited, in accordance with accepted academic practice. No use, distribution or reproduction is permitted which does not comply with these terms.
*Correspondence: Meghan Halabisky, bWVnaGFuLmhhbGFiaXNreUBkaWdpdGFsZWFydGhhZnJpY2Eub3Jn