
94% of researchers rate our articles as excellent or good
Learn more about the work of our research integrity team to safeguard the quality of each article we publish.
Find out more
ORIGINAL RESEARCH article
Front. Environ. Sci. , 02 April 2024
Sec. Big Data, AI, and the Environment
Volume 12 - 2024 | https://doi.org/10.3389/fenvs.2024.1243962
This article is part of the Research Topic Artificial Intelligence in Environmental Engineering and Ecology: Towards Smart and Sustainable Cities View all 10 articles
 Bian Chao1,2*
 Huang Guang Qiu1
Background: Air pollution, characterized by complex spatiotemporal dynamics and inherent uncertainty, poses significant challenges in accurate air quality prediction, and current methodologies often fail to adequately address these complexities.
Objective: This study presents a novel fuzzy modeling approach for estimating air pollution concentrations.
Methods: This fuzzy evaluation method integrates an improved evidence theory with comprehensive weighting and the K-nearest neighbor (KNN) interval distance within the framework of the matter-element extension model. This involves generating the basic probability assignment (BPA) based on interval similarity, performing sequential fusion using the Dempster–Shafer evidence theory, enhancing the fusion results via comprehensive weighting, and conducting fuzzy evaluation of air pollution concentrations using the matter-element extension KNN interval distance.
Results: Our method achieved significant improvements in monitoring air pollution concentrations, incorporating spatiotemporal factors and pollutant concentrations more effectively than existing methods. Implementing sequential fusion and subjective–objective weighting reduced the error rate by 38% relative to alternative methods.
Discussion: Fusion of multi-source air pollution data via this method effectively mitigates inherent uncertainty and enhances the accuracy of the KNN method. It produces more comprehensive air pollution concentration fusion results, improving accuracy by considering spatiotemporal correlation, toxicity, and pollution levels. Compared to traditional air-quality indices, our approach achieves greater accuracy and better interpretability, making it possible to develop more effective air quality management strategies. Future research should focus on expanding the dataset to include more diverse geographical and meteorological conditions, further refining the model to integrate external factors like meteorological data and regional industrial activity, and improving computational efficiency for real-time applications.
Atmospheric pollution is an urgent issue globally, especially in regions undergoing rapid industrialization and urbanization. The detrimental effects of pollution on ecological and climatic stability and human health are increasingly evident (Murena, 2004; Chen and Zhu, 2014; Chen et al., 2022). With the increasing global focus on environmental protection and low-carbon development, research is focusing on how technological innovation, green finance, and policy design can reduce environmental pollution and foster sustainable development. For example, Li et al. (2023) explored how digital finance could facilitate green technological innovations in polluting industries by easing funding constraints and augmenting research and development investments. Meanwhile, Feng et al. (2023) focused on reducing NOx emissions via advanced catalytic technologies, thus improving air quality. The intensification of global climate change has amplified the importance of research into urban heat-island effects (Shang et al., 2023), biodiversity loss (Wang et al., 2022), and the global carbon cycle (Zhang et al., 2021; Xiong et al., 2022).
Within this context, Wu et al. (2023) investigated the impact of clustered institutional investors on low-carbon innovation in family businesses, discussing how green finance and family governance can promote sustainable development in a changing economic environment. Kong et al. (2023) proposed a lifecycle-oriented low-carbon product design method to meet the challenges of climate change. Using cloud computing technology, Shang et al. (2021) explored factors influencing urban carbon footprints in China, and proposed key strategies for optimizing carbon emission predictions and low-carbon economic development (Luo et al., 2024). These studies provide technological and financial solutions while highlighting the significance of policy design in advancing environmental protection and sustainable development, which require accurate assessment of atmospheric pollution.
The air quality index (AQI) is a widely accepted assessment tool for air pollution; however, it presents several limitations. For instance, by aggregating the concentration levels of multiple pollutants into a single metric, the AQI may obscure the risks of high concentrations of specific pollutants (Pope et al., 2022). Further complications arise from the fact that not all pollutants are considered in AQI computations (Priti and Kumar, 2022), and the AQI calculations and standards differ between countries, leading to interpretative challenges (Karavas et al., 2021). Moreover, the AQI is inadequate for capturing and processing the complexities of atmospheric pollutants and their interactions (Cui et al., 2022). For instance, Zhang and Cao (2015) examined the heterogeneity and complexity of PM2.5 levels, highlighting the shortcomings of current assessment strategies. Further, accurate data and measurement techniques are indispensable for controlling air pollution (Pope III and Dockery, 2006).
Vaidya and Kumar (2006) expressed concerns about the accuracy and consistency of other traditional assessment methods, such as the analytic hierarchy process, under complex, dynamic, and variable environmental conditions. While the analytic hierarchy process, a multi-criteria decision-making tool, is used to determine the significance of various pollutants (Saaty, 2008), its reliance on subjective expert judgments may introduce bias (Dyer and Forman, 1992). Grey relational analysis may be suited to specific scenarios, but it presents challenges in model selection and membership function when dealing with complex, non-linear environmental factors (Wang and Klir, 2009; Li et al., 2010). Quantification of uncertain information was proposed by Zadeh (1965), and the fuzzy comprehensive evaluation method (Mo et al., 2020) offered a new approach to handle ambiguous and uncertain data. However, challenges persist regarding the scientific rigor and reproducibility of data generated using the analytic hierarchy process.
Considering these issues, attention has shifted towards more advanced and innovative assessment techniques. The potential of evidence theory and K-nearest neighbor (KNN) algorithms to handle complex and dynamic air quality data has been widely explored (Cover and Hart, 1967; Dempster, 1967; Shafer, 1976; Xiao et al., 2013; Dai et al., 2018; Wang et al., 2021; Sun et al., 2022a; Franklin et al., 2023). However, their efficacy under various geographical and meteorological conditions remains questionable. The research of Carslaw and Rhys-Tyler (2013), and the application of deep learning in predicting the concentrations of pollutants such as NO2 and PM10 (Kukkonen et al., 2003), signal a shift towards more accurate and flexible assessment techniques. As a significant improvement, Sun et al. (2022b) presented an ambient air quality evaluation model based on an advanced evidence theory. Important research developments in this field are presented in Table 1. While advanced air quality assessment techniques provide significant insights, they are often unable to distinguish between sources of pollution and may not account for the latest scientific understanding of pollutant interactions. Moreover, the evolving nature of industrial emissions and urban development requires more adaptable and sophisticated analytical methods. Thus, recognizing these shortcomings, the development and deployment of more precise and efficient air quality assessment techniques have become paramount for both scientific research and policy formulation.

Table 1. Literature review of related studies.
In this study, we present a fuzzy evaluation method that innovatively integrates evidence theory and the KNN algorithm, aiming to enhance atmospheric pollution concentration assessment precision and efficiency. This approach strives to overcome the limitations of conventional evaluation methods by synthesizing multifaceted, uncertain, and ambiguous environmental data, thus improving the precision and reliability. Via comparison with established evaluation techniques, our study reveals the proposed method’s advantages and contributions, which can be summarized as follows:
a) Holistic evaluation of atmospheric pollution concentrations: The approach introduces an assessment technique that overcomes the constraints of traditional AQI. It integrates multi-source data and physical property analyses, comprehensively evaluates atmospheric pollution patterns, and accurately quantifies key pollutant concentrations.
b) Innovative synthesis of evidence theory and KNN: This synthesis enhances the precision of data fusion and relevance of the results.
c) Focus on data quality and accuracy: This hybrid approach emphasizes data integrity by applying interval similarity and subjective–objective weighting and considering variability in pollutant concentrations and toxicological characteristics.
To validate the robustness of this approach and its applicability in diverse environmental contexts, the analysis includes data from representative days across three distinct urban settings: Xi’an, Beijing, and Tianjin, rather than focusing on a single urban area. These cities were chosen for their varied geographic and meteorological profiles, thus enhancing the robustness of the findings. The findings confirm the method’s efficacy across varied urban environments and address complex regional differences in air pollution. This multifaceted approach substantially enhances methodological rigor in air quality assessment.
The KNN method, a commonly used machine learning algorithm for classification and regression, stores all available cases and classifies new data or cases based on a similarity (distance) measure. It functions by finding the K-nearest neighbors to the unknown sample within the known samples (Altman, 1992; Huihui and Yanming, 2013; Wang et al., 2021). Next, the class of the unknown sample is determined based on the class of the nearest neighbors, typically via “majority rule.” The three elements of the KNN model are the choice of k, a distance measurement, and a classification-decision rule.
Regarding the choice of k, the blue triangle in Figure 1 represents the sample to be classified. When k = 7, of the seven samples nearest the sample to be classified, three belong to the red class and four to the green class. Therefore, the sample to be classified is predicted to belong to the green class. However, when k = 9, the sample to be classified belongs to the red class. Therefore, when the samples are unbalanced, the choice of k substantially impacts the results.
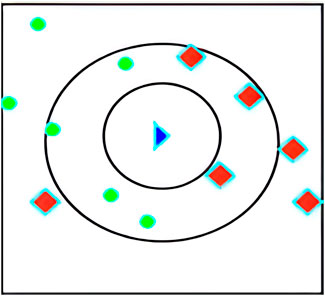
Figure 1. The K-nearest neighbor (KNN) model. Blue: sample to be classified; red: classified sample; green: classified sample.
Next, distance is measured as follows:
Let the feature space
When
when
and when
The evidence theory, proposed by Dempster (2008), has been further developed by Shafer (Ai et al., 2022; He et al., 2022; Liu et al., 2022; Ren et al., 2022). Evidence theory applies fuzzy logic to handle uncertainty, via the following steps.
a) Establishment of a discernment framework
The discernment framework is a set of all objects or entities under consideration. Subsets in the discernment framework are defined as follows:
If
b) Determination of the basic probability assignment (BPA)
Initially, the evidence-based confidence (support) in each combination is established by the evidence processor. The basic probability is assigned as follows:
Let
If the function
then m is referred to as the BPA, and m(A) is the basic probability assigned to proposition A (i.e., the confidence accurately assigned to A).
There are two ways to calculate the BPA: via expert opinion or by constructing the corresponding mathematical model. The approach of using expert experience requires values provided by different experts, and thus tends to be subjective. Therefore, this method calculates BPA by constructing the corresponding mathematical model.
c) Evidence-combination rule
Let mA and mB be sets of BPAs corresponding to focal elements
where K is the conflict coefficient, which reflects the degree of conflict between focal elements. A larger K indicates greater conflict; the combination rule cannot be used when K = 1.
We derived a data fusion method to assess air pollution based on comprehensive fuzzy evaluation, the Dempster–Shafer (DS) evidence theory, and the KNN algorithm. To comprehensively evaluate this method, we chose the SVM method as a benchmark for comparison. SVM, a widely used supervised learning method for classification and regression, is based on structural risk minimization. SVM can simultaneously process linear and non-linear data via kernel functions, making it suitable for analyzing our dataset.
The atmospheric environment is complex, and air quality is influenced by many factors, including uncertain and fuzzy factors (Seinfeld and Pandis, 2016). To address this environmental complexity, we propose an air pollution concentration evaluation method based on the DS evidence theory corrected by subjective and objective weighting and the extensible KNN. First, the set of air pollution evaluation indicators is determined (Figure 2). Figure 3 presents the air-pollution modeling methodology and workflow. The workflow encompasses each phase from the initial data segmentation to the final evaluation of pollution levels and elucidates the seamless transition between phases. This method thus provides a cohesive approach to quantifying air pollution.
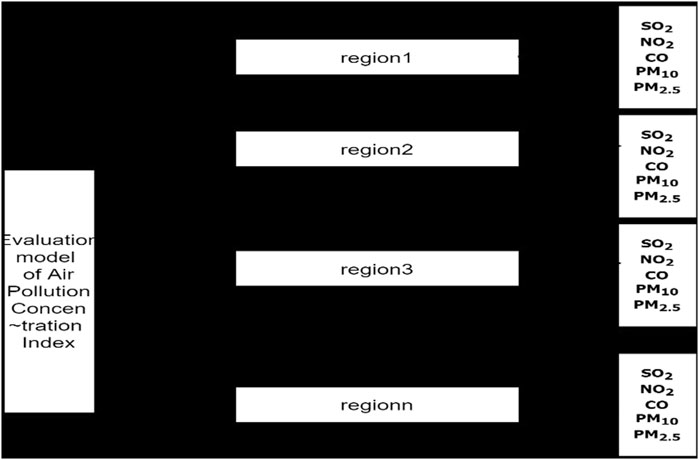
Figure 2. Pollution concentration evaluation factor set.
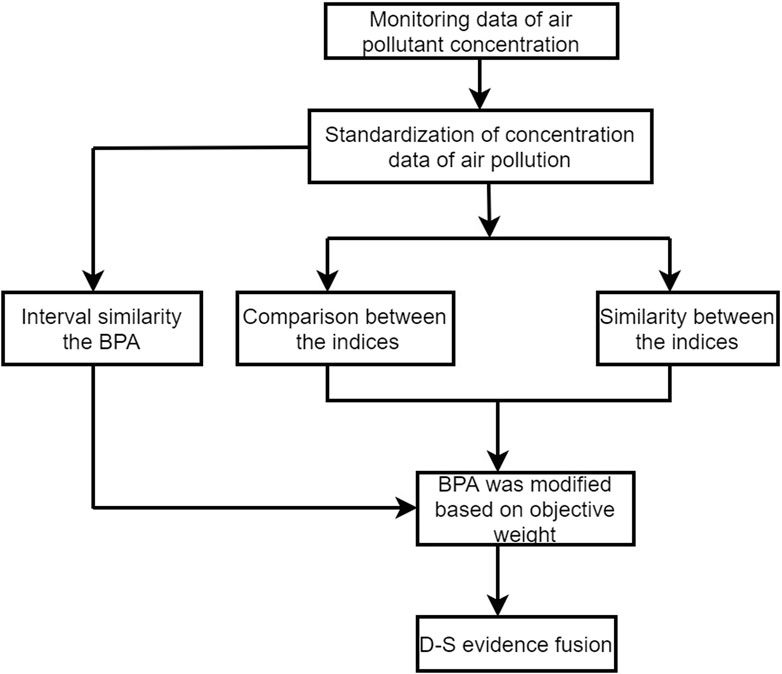
Figure 3. Air pollution concentration evaluation model.
Comprehensive examination and iterative testing have revealed that accurate quantification of air pollution requires consideration of both the pollution intensity for specific contaminants and the spatiotemporal dynamics of the atmosphere. We therefore designed and refined an optimized algorithm combining evidence theory-based data fusion and KNN-based fuzzy evaluation. This algorithm was not chosen arbitrarily; it emerged as the most effective after several experimental iterations and methodological trials. Its efficacy in addressing the complexity of pollution assessment underscores its robustness. This integrated algorithm is deployed by applying evidence theory, the KNN algorithm, and then their synthesis.
For data segmentation, the air pollution data are initially divided into different intervals, based on national air pollution concentration standards, to ensure consistency and accuracy in evaluation.
Basic Probability Assignment (BPA) values are constructed for each pollutant, based on interval similarity. This step underlies evidence theory fusion, with the key objective being the accurate representation of uncertainty in pollutant concentration.
For each pollutant, evidence theory is applied to sequentially fuse the concentration data from each region, thereby enhancing the model’s capacity to handle regional disparities.
Selecting the value of k: The optimal k value is determined based on cross-validation results to ensure the model’s accuracy and generalizability.
Distance Measurement: An improved method of distance measurement is applied to calculate the similarity between data points, aiding in more accurately identifying the nearest neighbors.
The evidence theory fusion results are further corrected using subjective and objective weights to optimize assessment accuracy.
The output of the evidence theory computations is used as input for the KNN algorithm, and the concentrations are estimated by applying the matter-element extension model. This step accounts for the spatiotemporal dynamics of air pollutants and their environmental and health impacts.
Our model thus enhances the accuracy of air pollution assessment based on multi-source data and effectively fuses the data to improve the comprehensiveness and reliability of the results.
The air pollutant concentrations were fused as follows:
a) For each urban area within the city, a distinct set (U) of pollutant concentrations was determined:
Each single factor was then decomposed into subsystem evaluation factors, with the corresponding factor set
where
b) Based on the degree of harm to human health caused by air pollution, the air pollution concentrations were categorized into seven levels, thus determining the evaluation set (Table 2), denoted as
where V1–V7 correspond to seven levels of air pollution concentration.
c) To determine the membership function, based on the air pollution concentration standards of the Chinese Environmental Protection Administration (EPA), the air pollutant concentrations were classified by interval. For each pollutant, the distance to each interval was calculated using Equation (14). A larger distance to the interval corresponds to a lower similarity and a greater impact of pollutants on air pollution concentrations.
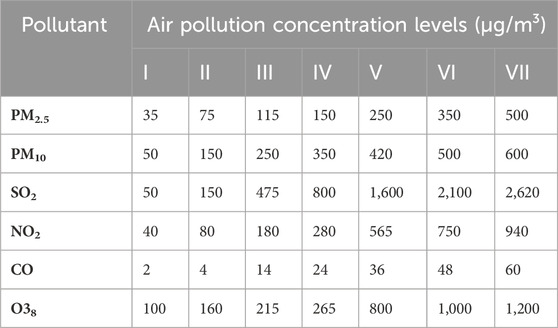
Table 2. Air pollution concentration standard.
Similarity was then calculated via Equation 15 and was normalized to yield the basic probability distribution function, as follows:
d) The DS evidence from different regions for each pollutant was then sequentially fused. Following the first law of geography, the law of spatial correlation, which states that “all things are related, but nearby things are more related than distant things” (Tobler, 1970; Li et al., 2016), it is necessary to consider the impact of pollutant concentrations and spatiotemporal influences. During data fusion, data transmission can be delayed. For greater efficiency, we applied sequential data fusion, fusing the output data items one-by-one, based on their to spatial sequence. Unlike other fusion techniques, sequential data fusion better balances data quality and processing speed, enabling real-time or near-real-time air quality assessments. Figure 4 illustrates BPA-value adjustment using interval similarity via DS evidence theory. This adjustment effectively addresses the inherent uncertainty associated with atmospheric pollution concentrations. Merging the modified BPA values produces the final atmospheric pollution concentrations:
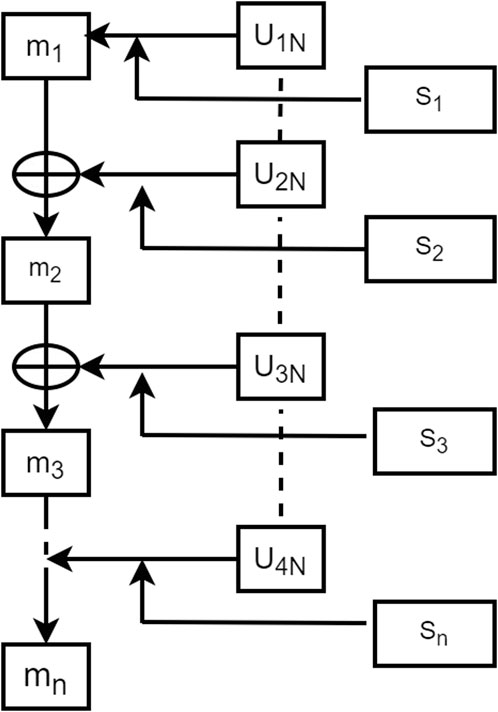
Figure 4. Sequential fusion via the Dempster–Shafer (DS) theory based on interval similarity.
To evaluate the air pollution concentrations, concentrations of air pollutants from multiple sources were fused. This analysis requires consideration of individual pollutant concentrations and of the mutual influences among the pollution levels in different regions for each pollutant. Therefore, each indicator has both subjective and objective weights. Subjective (or expert) weighting is derived from expert opinion or experience. Objective weighting is based on the relationships among indicators and relies on specific mathematical methods to calculate the weight of each indicator.
Each air pollutant has a specific toxicity level, with higher toxicity correlating with increased pollution and potential harm to humans. To ensure a well-rounded and credible representation of pollutant toxicity, we derived subjective weights (denoted by Wi) for each pollutant, by consulting a panel of experts and corroborating their input using the literature. This approach both leverages expert experience and ensures a balanced weighting strategy supported by established knowledge.
Objective weighting has the advantage of relying primarily on objective data without requiring human intervention. Therefore, objective judgments are not limited by human subjectivity and are considered true and reliable.
Air pollution levels depend both on differences between pollutants and regional pollutant concentrations. Therefore, to calculate the objective weights, we implemented the CRIteria Importance Through Intercriteria Correlation (CRITIC) method (Wang and Jiang, 2017; Ying and Yunyun, 2017), a sophisticated approach that effectively integrates both contrasting and conflicting indicators. In this context, associations between information are used to quantify the conflict between indicators. More closely associated indicators exhibit less conflict, and are therefore assigned less weight. The contrast between indicators was ascertained using the standard deviation of the information; a larger standard deviation implies a greater contrast. Here, we adopted the “Over-standard Multiple Method” to represent this contrast, using the standard deviation of information. Indicator similarity, conversely, was used to compute the conflict between indicators. Among the various weight-calculation methods, CRITIC was deemed the most suitable for our research objectives; the other methods, in contrast, exhibit greater computational complexity, specific data prerequisites, or inherent limitations. The objective weights were calculated as follows.
a) According to Chinese EPA monitoring data, the regions
where N is the number of air pollutants (SO2, NO2, CO, O3, PM2.5, and PM10) and i is the monitoring region.
b) To better demonstrate pollution levels, the pollutant concentration indicators for the different regions and pollutants in the matrix were nondimensionalized. The concentrations of the same pollutant in different regions mutually affect one another. Therefore, range normalization was used for nondimensionalization:
After nondimensionalization, the relative pollution levels for the same pollutant in different regions are obtained, as follows:
where N is the number of air pollutants (SO2, NO2, CO, O3, PM2.5, and PM10) and i is the monitoring region.
c) The concentrations of different pollutants in the same region can also mutually affect one another. When multiple different pollutants are present in greater concentrations, their impact on one another is greater. The contrast among indicators in the CRITIC method can be represented by over-standard multiples, as follows:
d) For the same pollutant, the levels are strongly positively correlated among regions. The extent of correlation can be determined from the similarity among indicators. Greater similarity corresponds to less conflict. Here, the indicator similarity matrix was constructed using Pearson correlation coefficients. The level of conflict (qij) of each indicator in the similarity matrix was calculated as follows:
e)
f)
The combined subjective and objective weights of the jth indicator were determined using the normalized combined weights, as follows:
Wi and Wj are, respectively, the subjective and objective weight elements of the nth indicator.
Subjective and objective correction of the concentrations of different pollutants in the same region was performed as follows:
The KNN algorithm determines the class of a sample by counting the number of nearest neighbors of the same class. However, if the distribution of classified samples is highly scattered and the data distribution is not considered, the results can easily be biased. Yang et al. (2010) proposed using the extensible distance to vote and select the target attribute of the dataset for classification. Tan et al. (2017) developed an air quality evaluation model based on fuzzy matter-element analysis. Xiao and Duan (2013) proposed improving the importance of classes using attribute values. Dai et al. (2018) introduced a method to calculate sample-attribute weights using the analytic hierarchy process and to classify samples based on their weighted distances. Lü et al. (2021) proposed correcting KNN classification using the probability that the test sample belongs to each fault type as the weight.
Pollutant concentration data is typically log-normally distributed, as substantiated by Ott (1990), who provided the physical explanation for this phenomenon. This log-normal distribution is further supported by the method-fusion approach for enhancing long-term air pollution estimates, as discussed by Chastko and Adams (2019). Air pollution concentration data follow a normal distribution (Figure 5). Each pollutant concentration has a standard interval, according to the Chinese EPA standards. Given these standard intervals, we can determine the air pollution concentrations via DS evidence theory fusion and corrected via subjective and objective weighting. Here, we propose a model algorithm based on KNN corrected using matter-element average extensible distances (Ott, 1990. A Physical Explanation of the Lognormality of Pollutant).
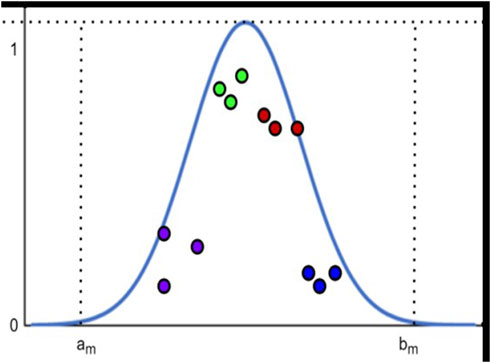
Figure 5. Matter-element extensible distance.
The matter-element extension theory (Xiang, 2008) considers the objective world as comprising matter elements; contradictions in the objective world are treated as contradictions among matter elements. Matter elements have many types of features, each with a value. Here, the matter elements (the evaluation subjects, denoted as U) and their features (the evaluation indicators, denoted as T) are combined with the values Y (which correspond to the features), forming R = (U, T, Y), the three matter-elements. The model calculations are as follows.
(1) If the described matter U has n features T1, T2, … , Tm with corresponding values Y1, Y2, … , Ym, then R is called an n-dimensional fuzzy matter-element (Zhang, 1997). Combining n-dimensional matter-elements of m matters forms n-dimensional composite fuzzy matter-elements Rnm of m matters:
(2) The described matter U has a value of Y for each feature. Let us assume that Y is within the range (a, b) belonging to a classified sample; for
(3) The average distance between the sample to be classified and the three nearest neighbor intervals of different classes is calculated using the interpoint distance:
(4) The average distance between the sample to be classified and the nearest neighbor points of each class is calculated as follow:
(5) The average distance between the sample to be classified and each classified sample point is then compared. A smaller distance indicates that the sample to be classified more likely belongs to the corresponding interval.
In evaluating air pollution, pollutant concentrations were calculated based on regional data for each city. It is assumed that each city has i monitoring regions, each with N indicators
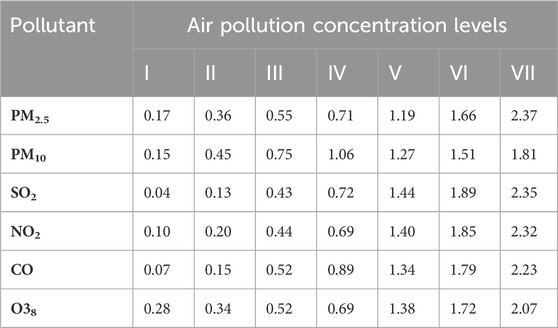
Table 3. Nondimensionalization of the air pollution concentration standards.
The air quality data used here—the daily air quality data for 2022 for Xi’an, Beijing, and Tianjin—were obtained primarily from the China National Environmental Monitoring Network. Owing to space constraints, only a subset of the data is presented (Tables 4–6).
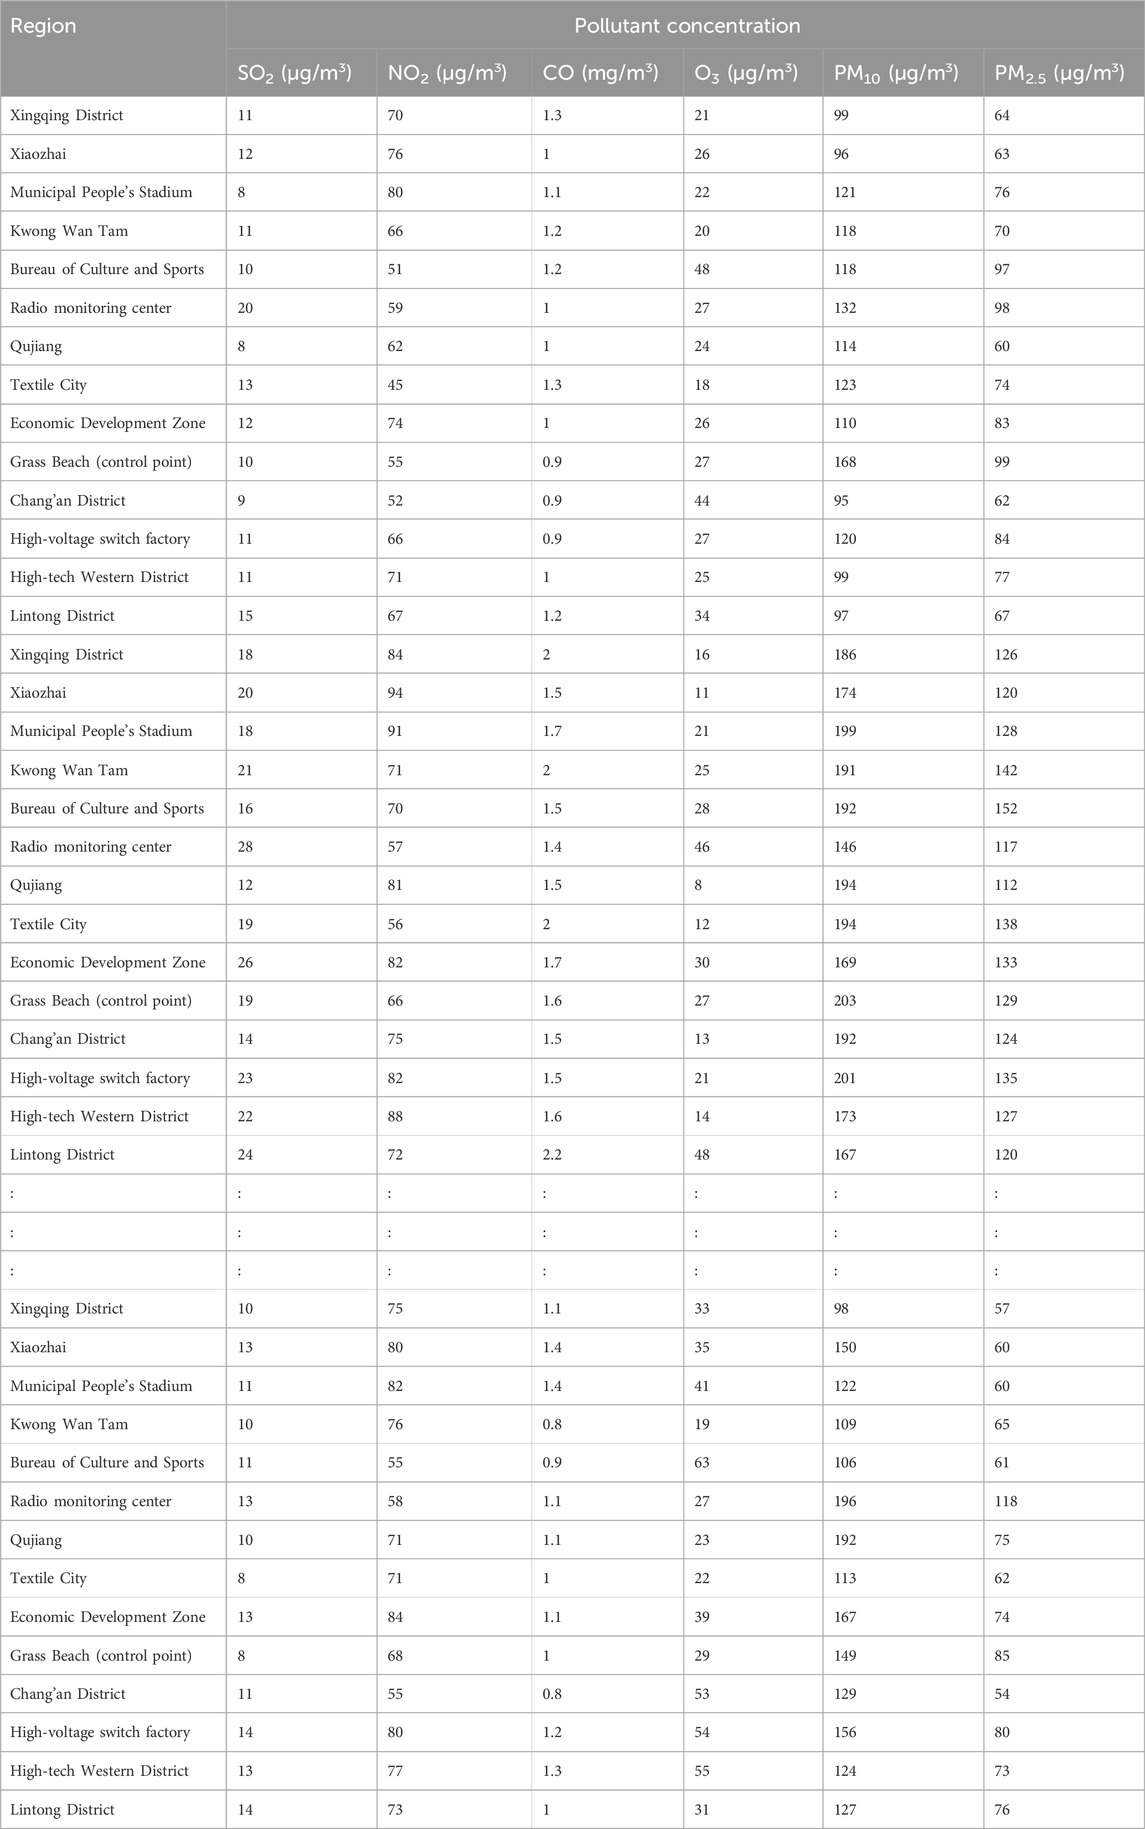
Table 4. Concentrations of different air pollutants in different regions.xi’an.
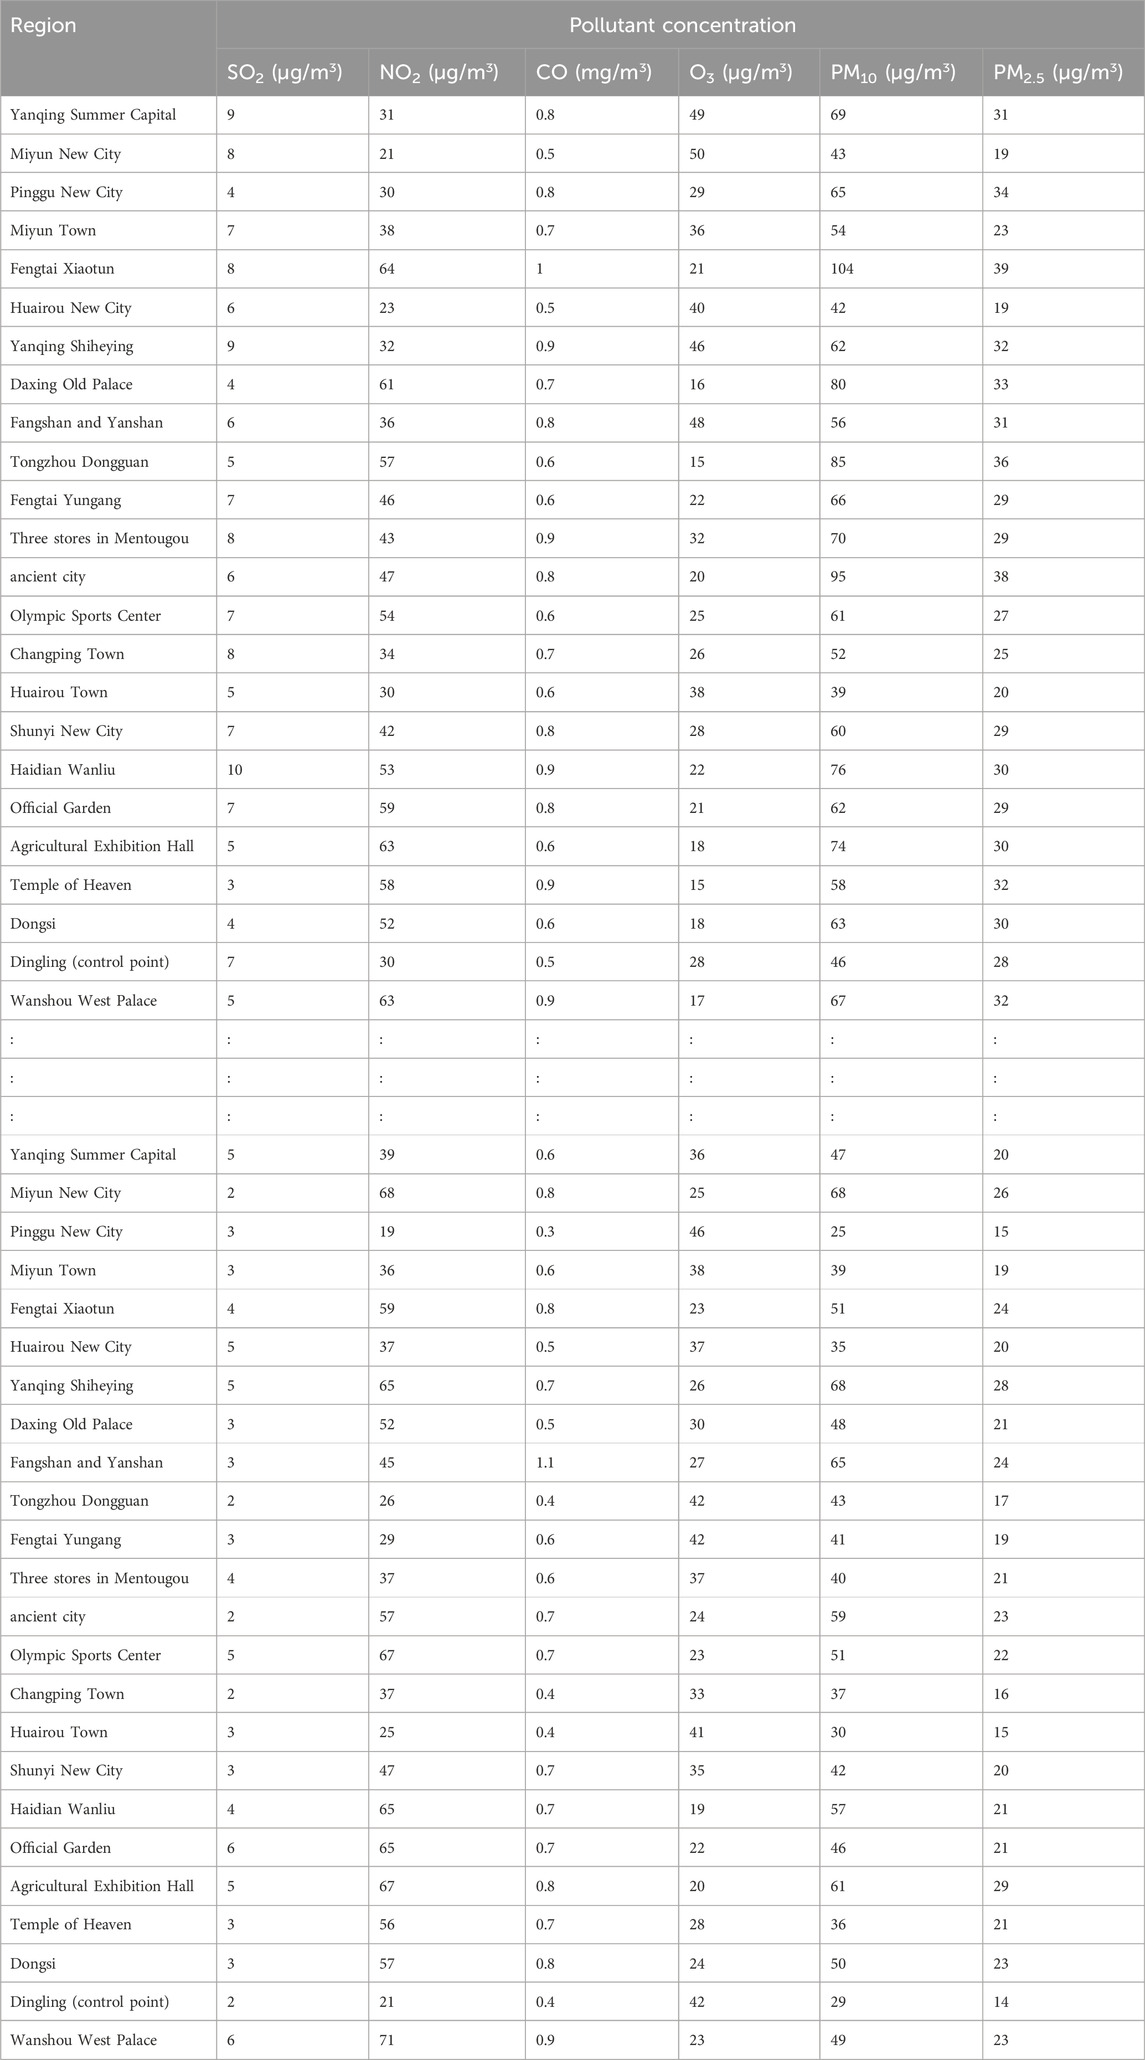
Table 5. Concentrations of different air pollutants in different regions.beijing.
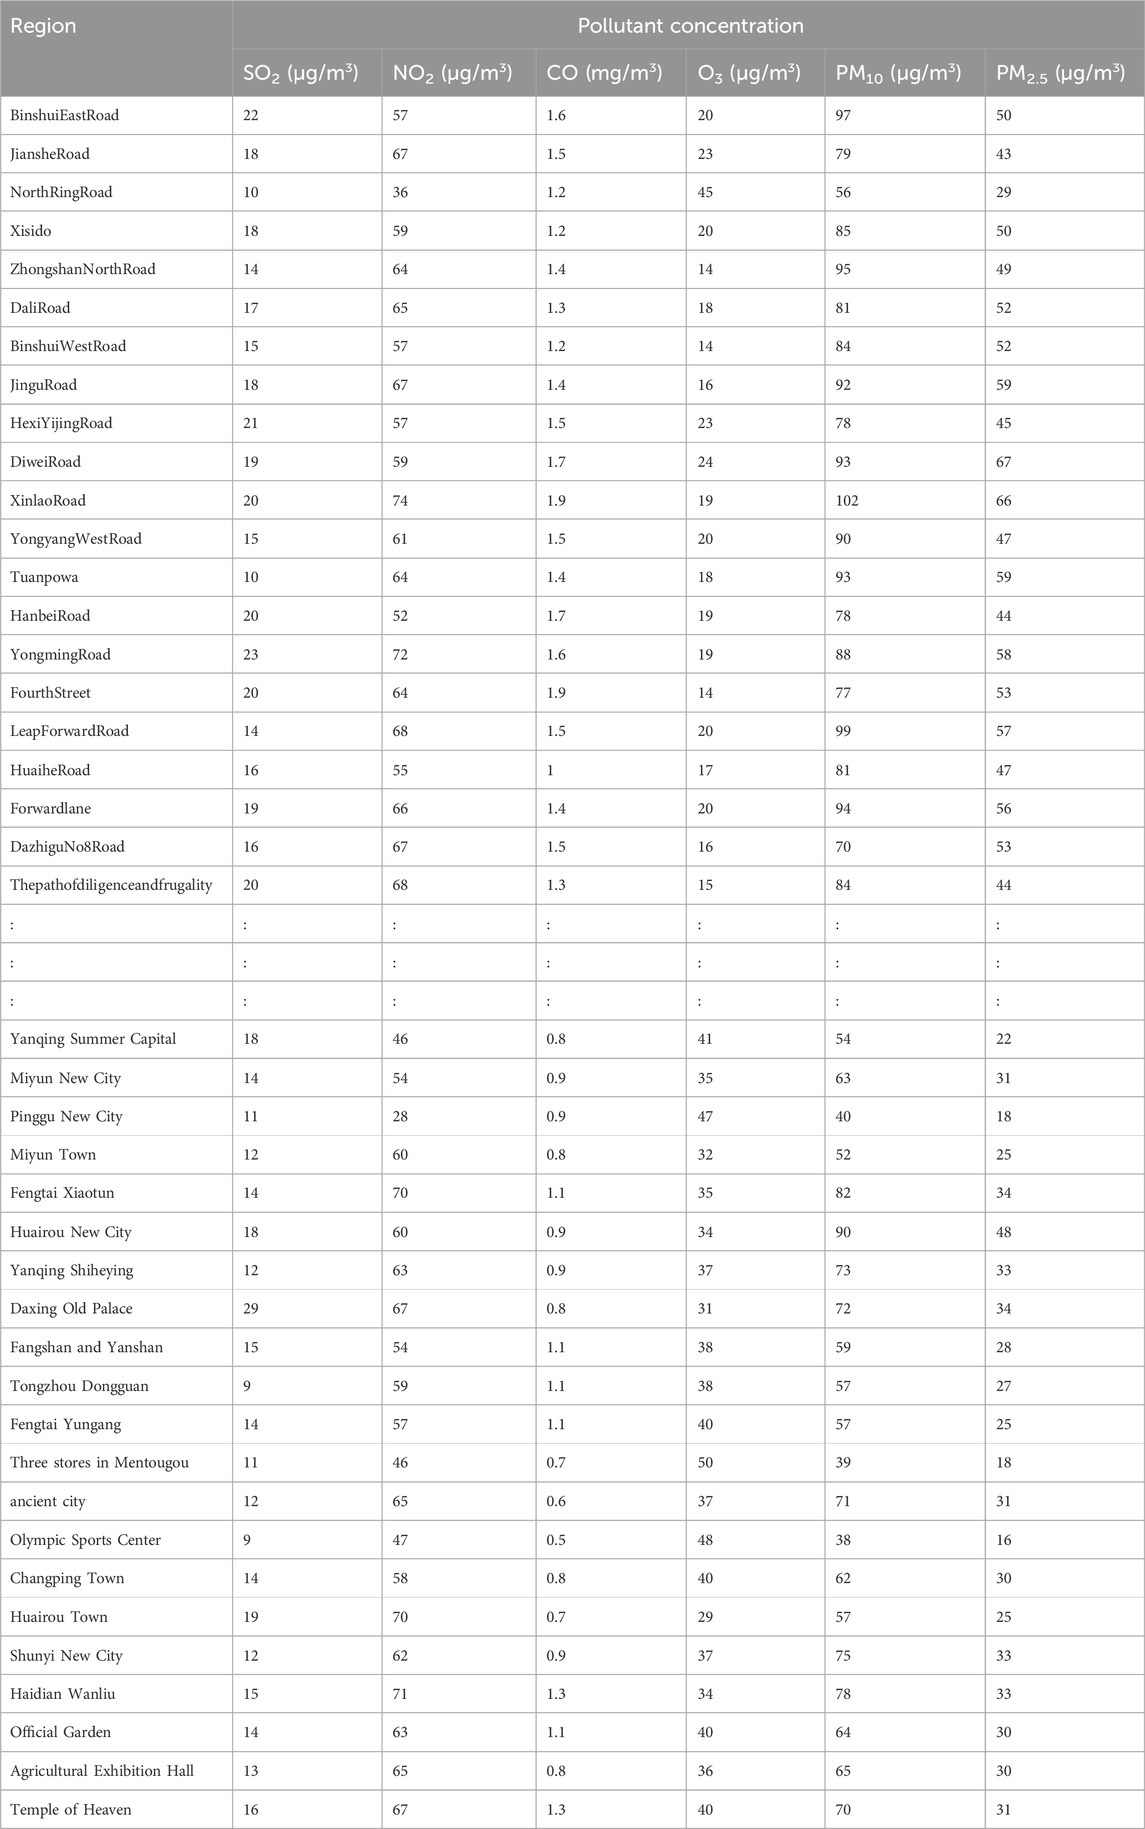
Table 6. Concentrations of different air pollutants in different regions.tianjin
Additionally, we based our in-depth statistical analyses on the processed and analyzed datasets of the Qingyue Open Environmental Data Center. We standardized the concentrations of the various air pollutants, obtaining dimensionless indices, facilitating robust comparisons among different pollutants across various regions (Tables 7–9). The daily pollutant concentrations, shown over the course of the year, varied notably between Xi’an, Beijing, and Tianjin (Figure 6).
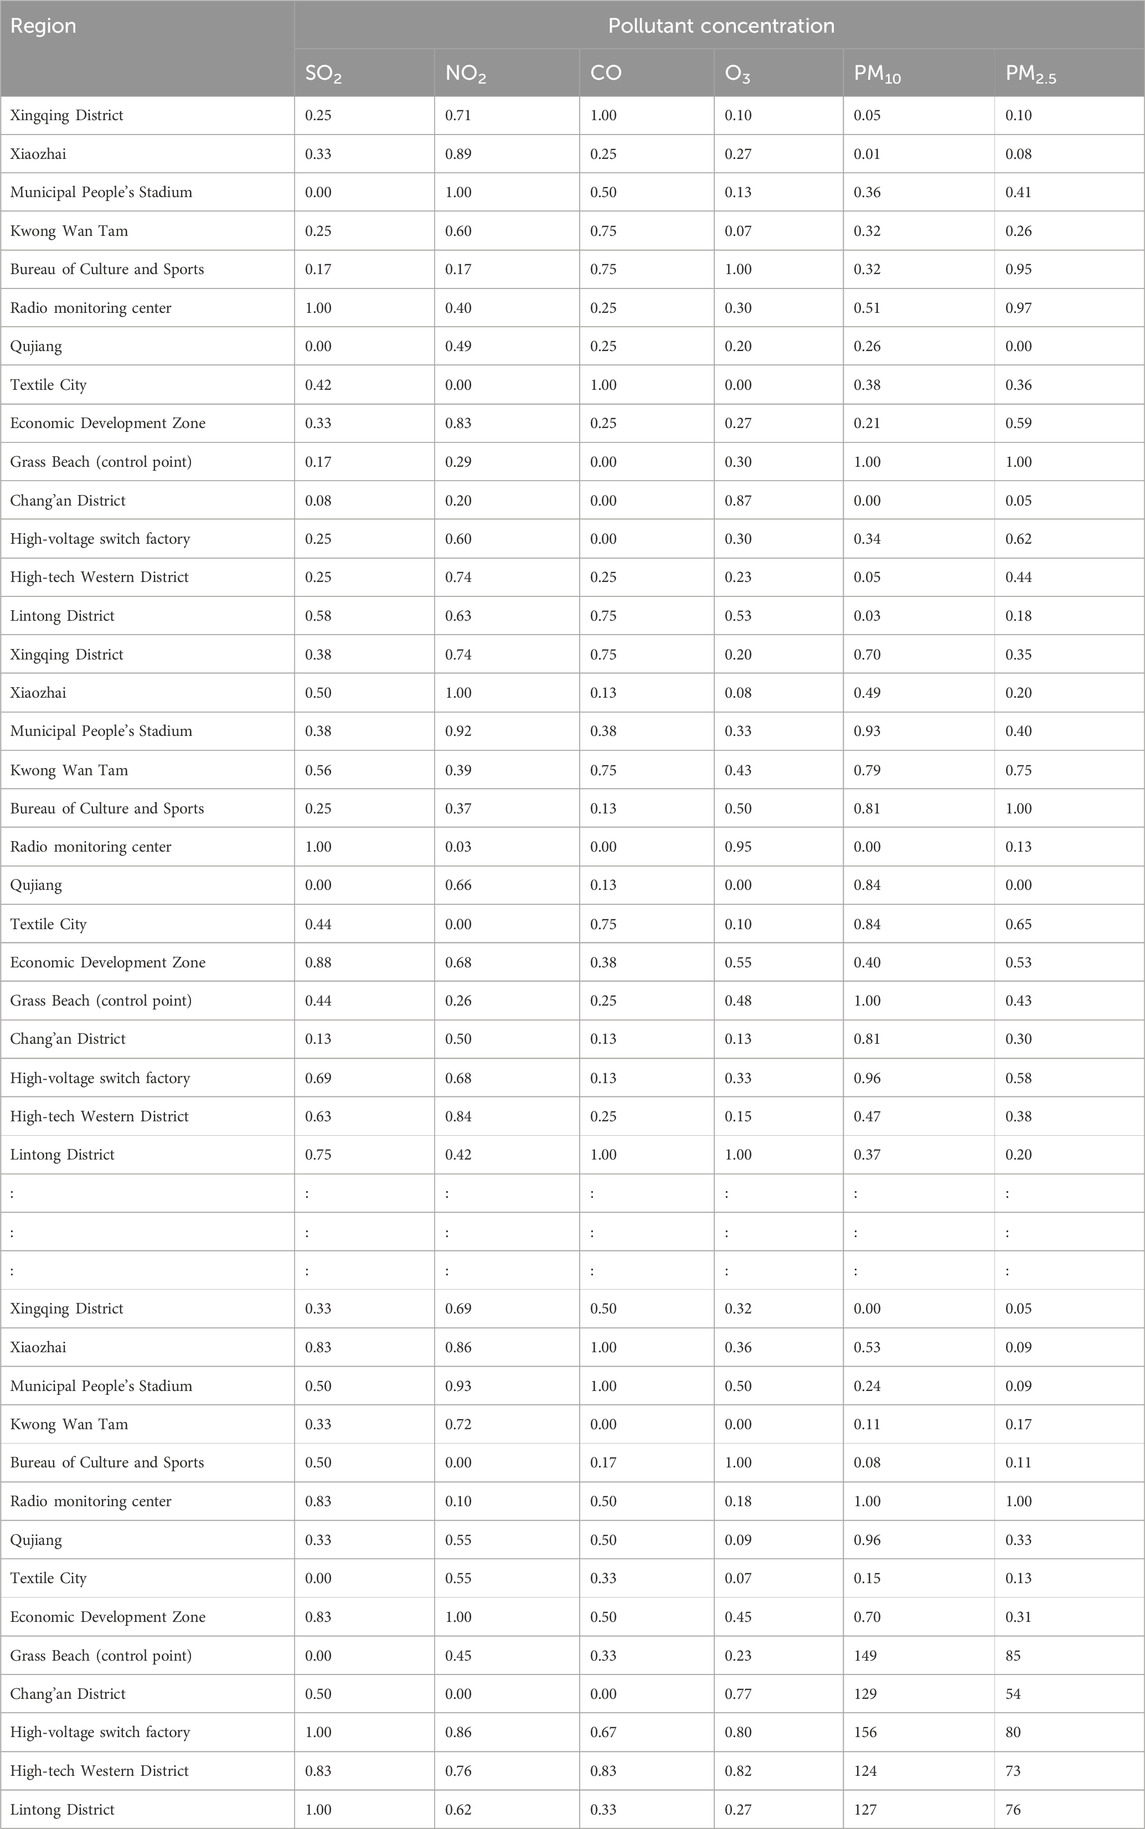
Table 7. Standardized air pollutant concentrations across different regions.xi’an.
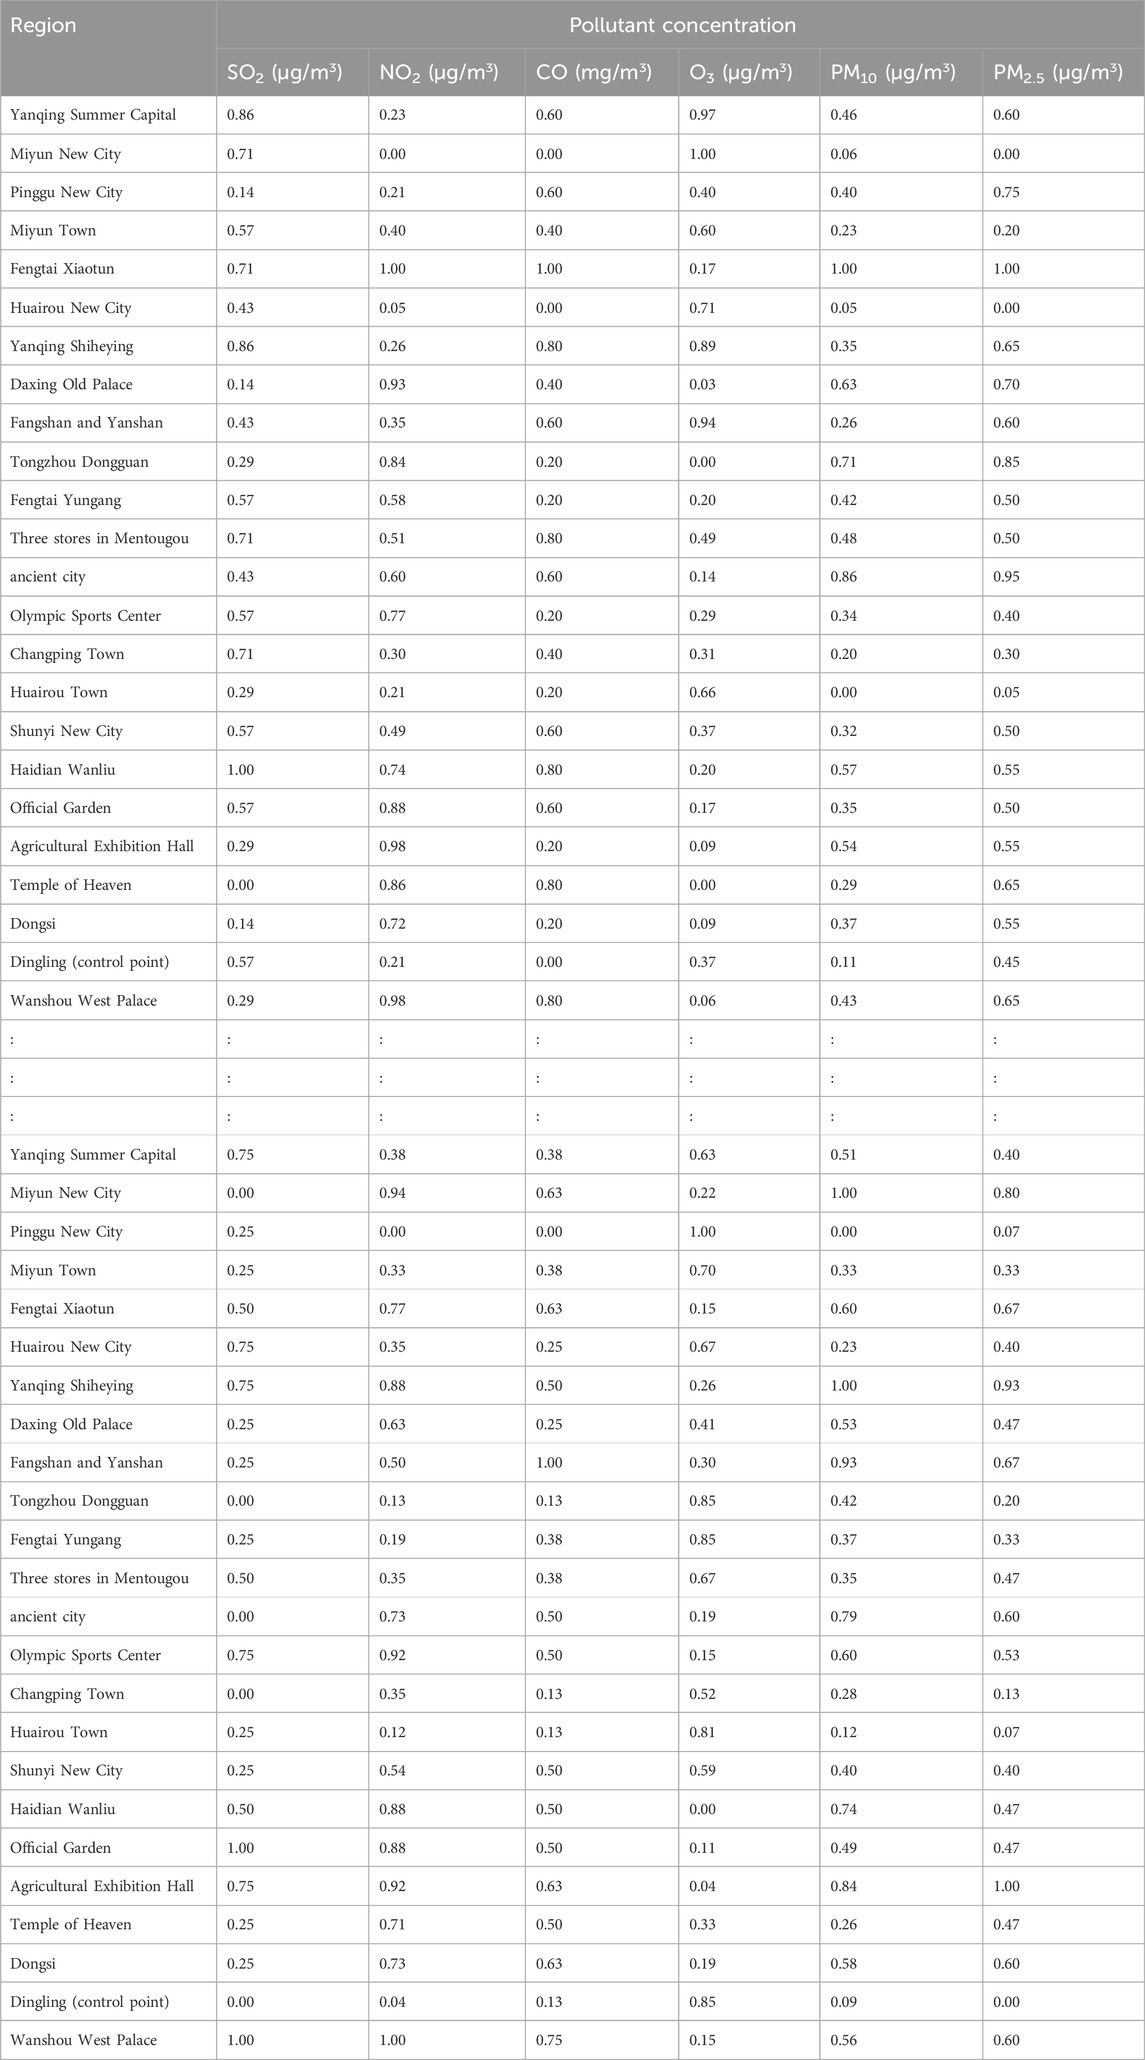
Table 8. Standardized air pollutant concentrations across different regions.beijing

Table 9. Standardized air pollutant concentrations across different regions.tianjing
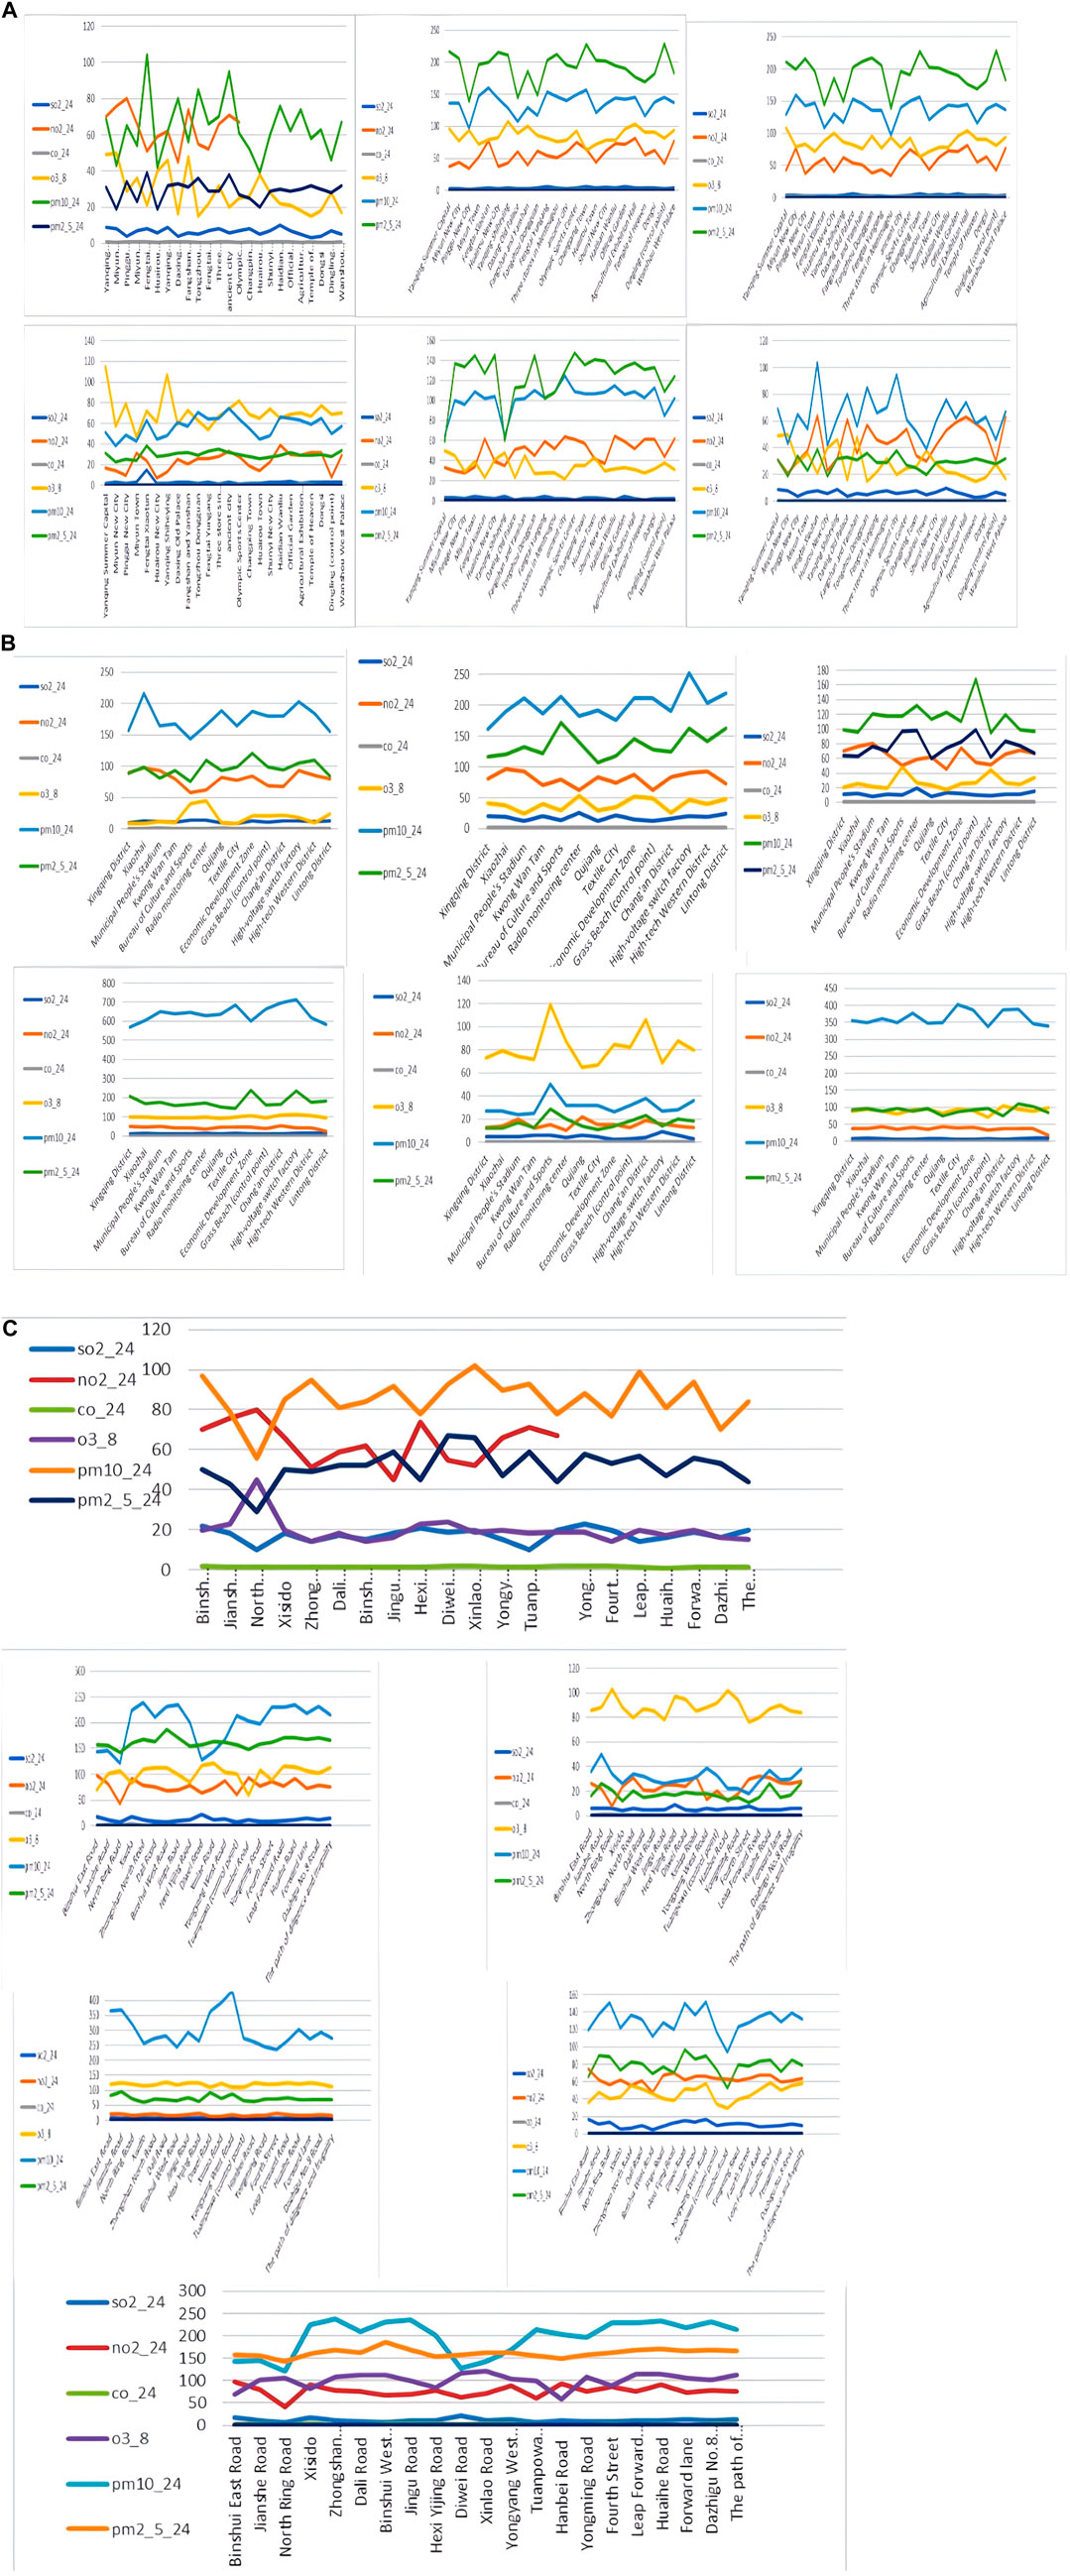
Figure 6. Comparison of the monitored concentrations of different pollutants in different regions. (A) Xi’an; (B) Beijing; (C) Tianjin.
Within a particular space, air pollution levels are influenced both by the concentration and toxicity of the pollutants and the interactions between different pollutants and regional environments. To test this hypothesis, we used SPSS matrix correlation analysis, which is widely recognized and utilized, simple to use, intuitive to interpret, and broadly applicable. Notably, this non-parametric method can robustly handle ordinal data, which is crucial in our research context.
We assessed the correlations using the correlation coefficient (Eq. (30)). This equation ensures reliable and statistically valid results, enabling us to gain deeper insights into the relationships and patterns within the data.
Figure 7 presents the correlations of the concentrations in each region. Figure 8 presents the correlations among different pollutant concentrations (Figure 8). There were complex interconnections and mutual influences among the diverse pollutants in terms of their concentrations in varying intervals. The dynamics of the air pollutants varied among the regions (Figure 7). This finding offers insight into how regional differences contribute to macro-scale air-pollution trends. Figure 8 illustrates the daily interactions among the pollutants. All of the correlation values exceed 4, indicating that they are statistically significant.
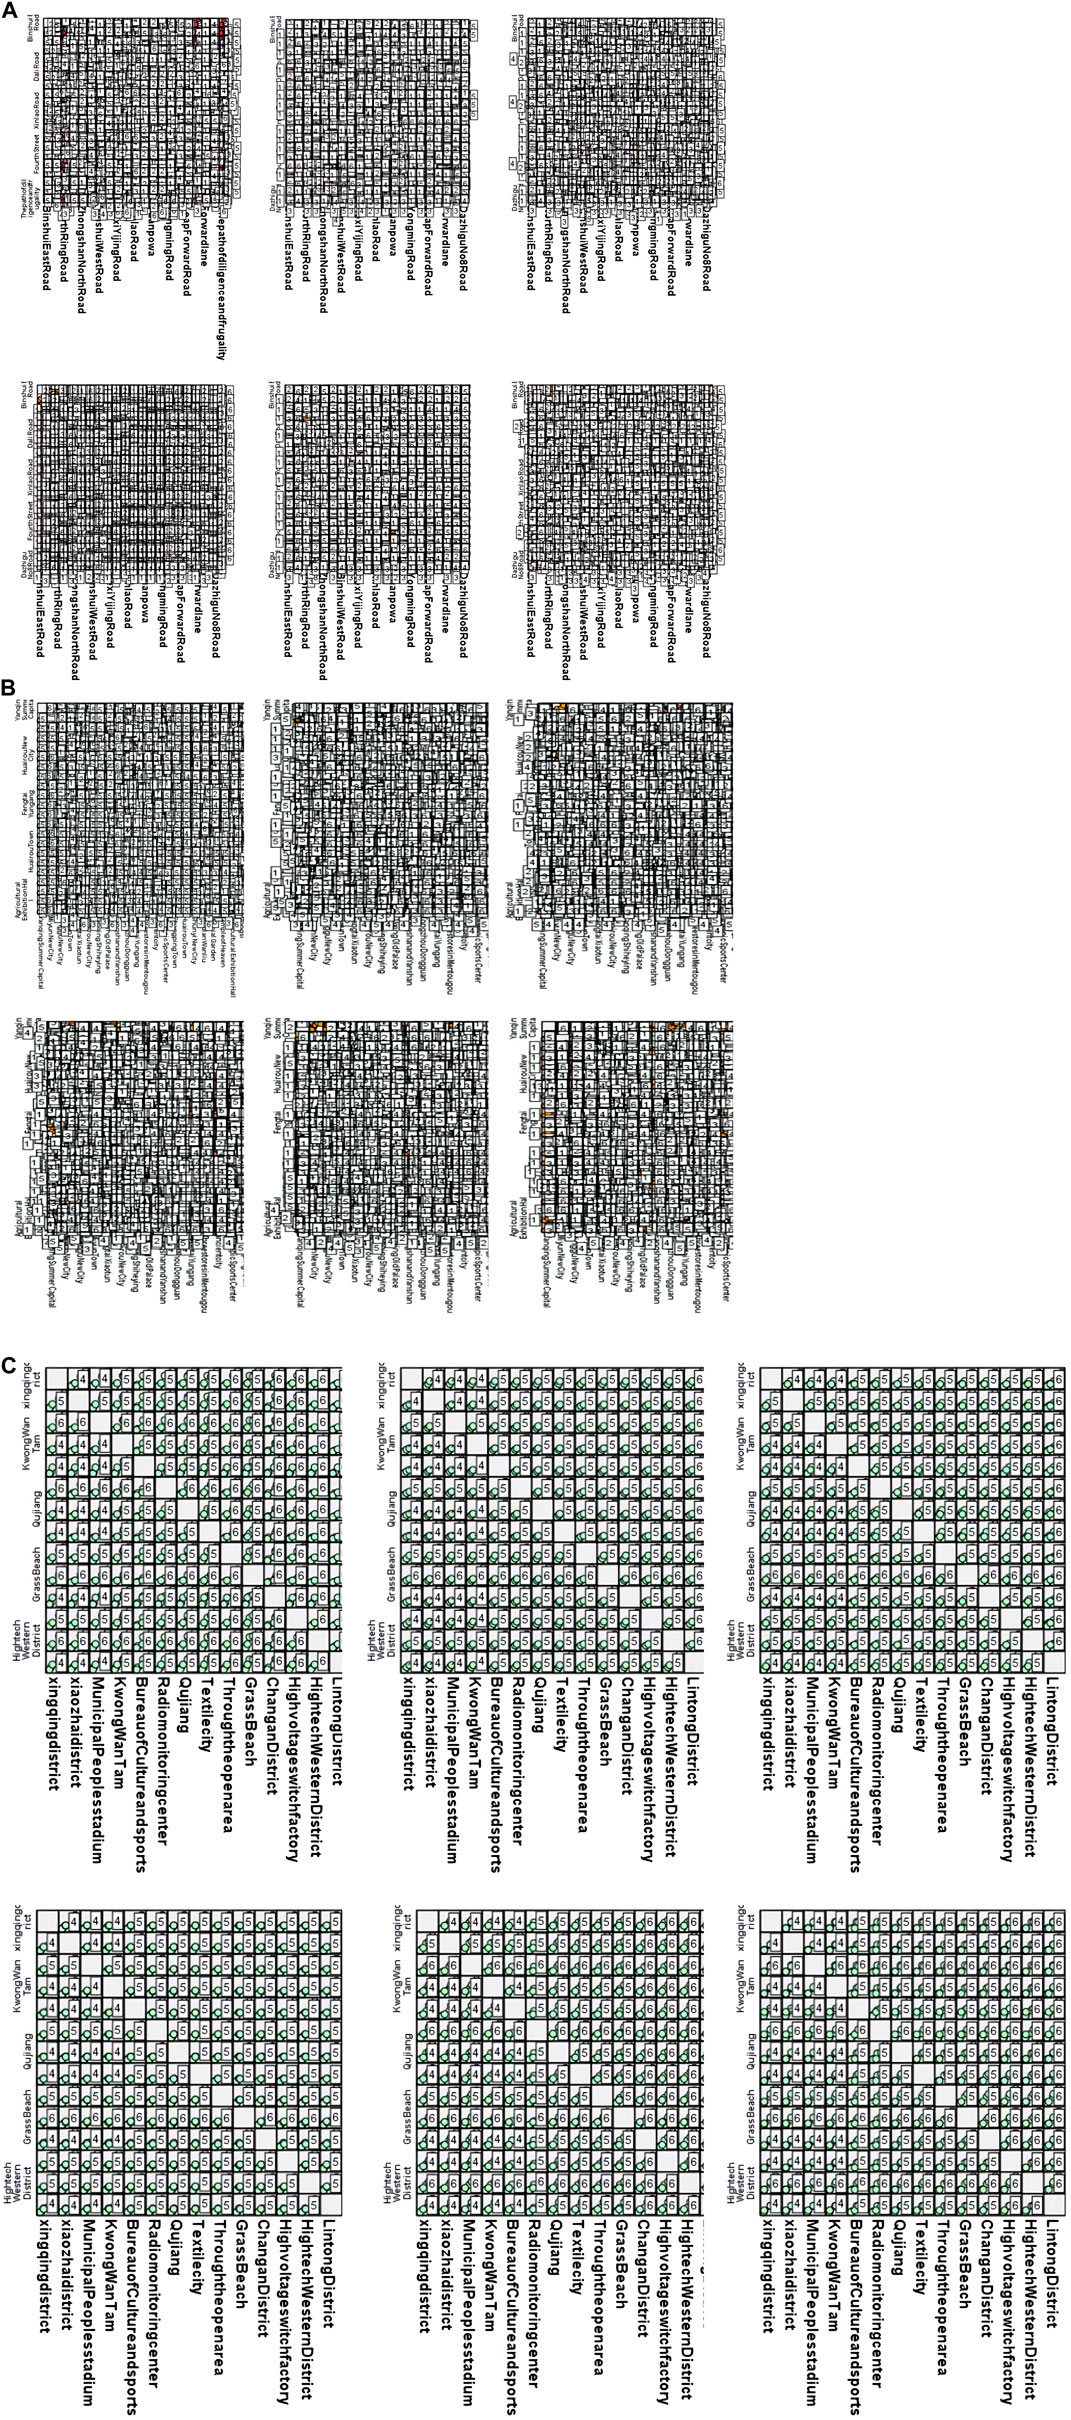
Figure 7. Correlations among pollutant concentrations in different regions. (A) Xi’an; (B) Beijing; (C) Tianjin.
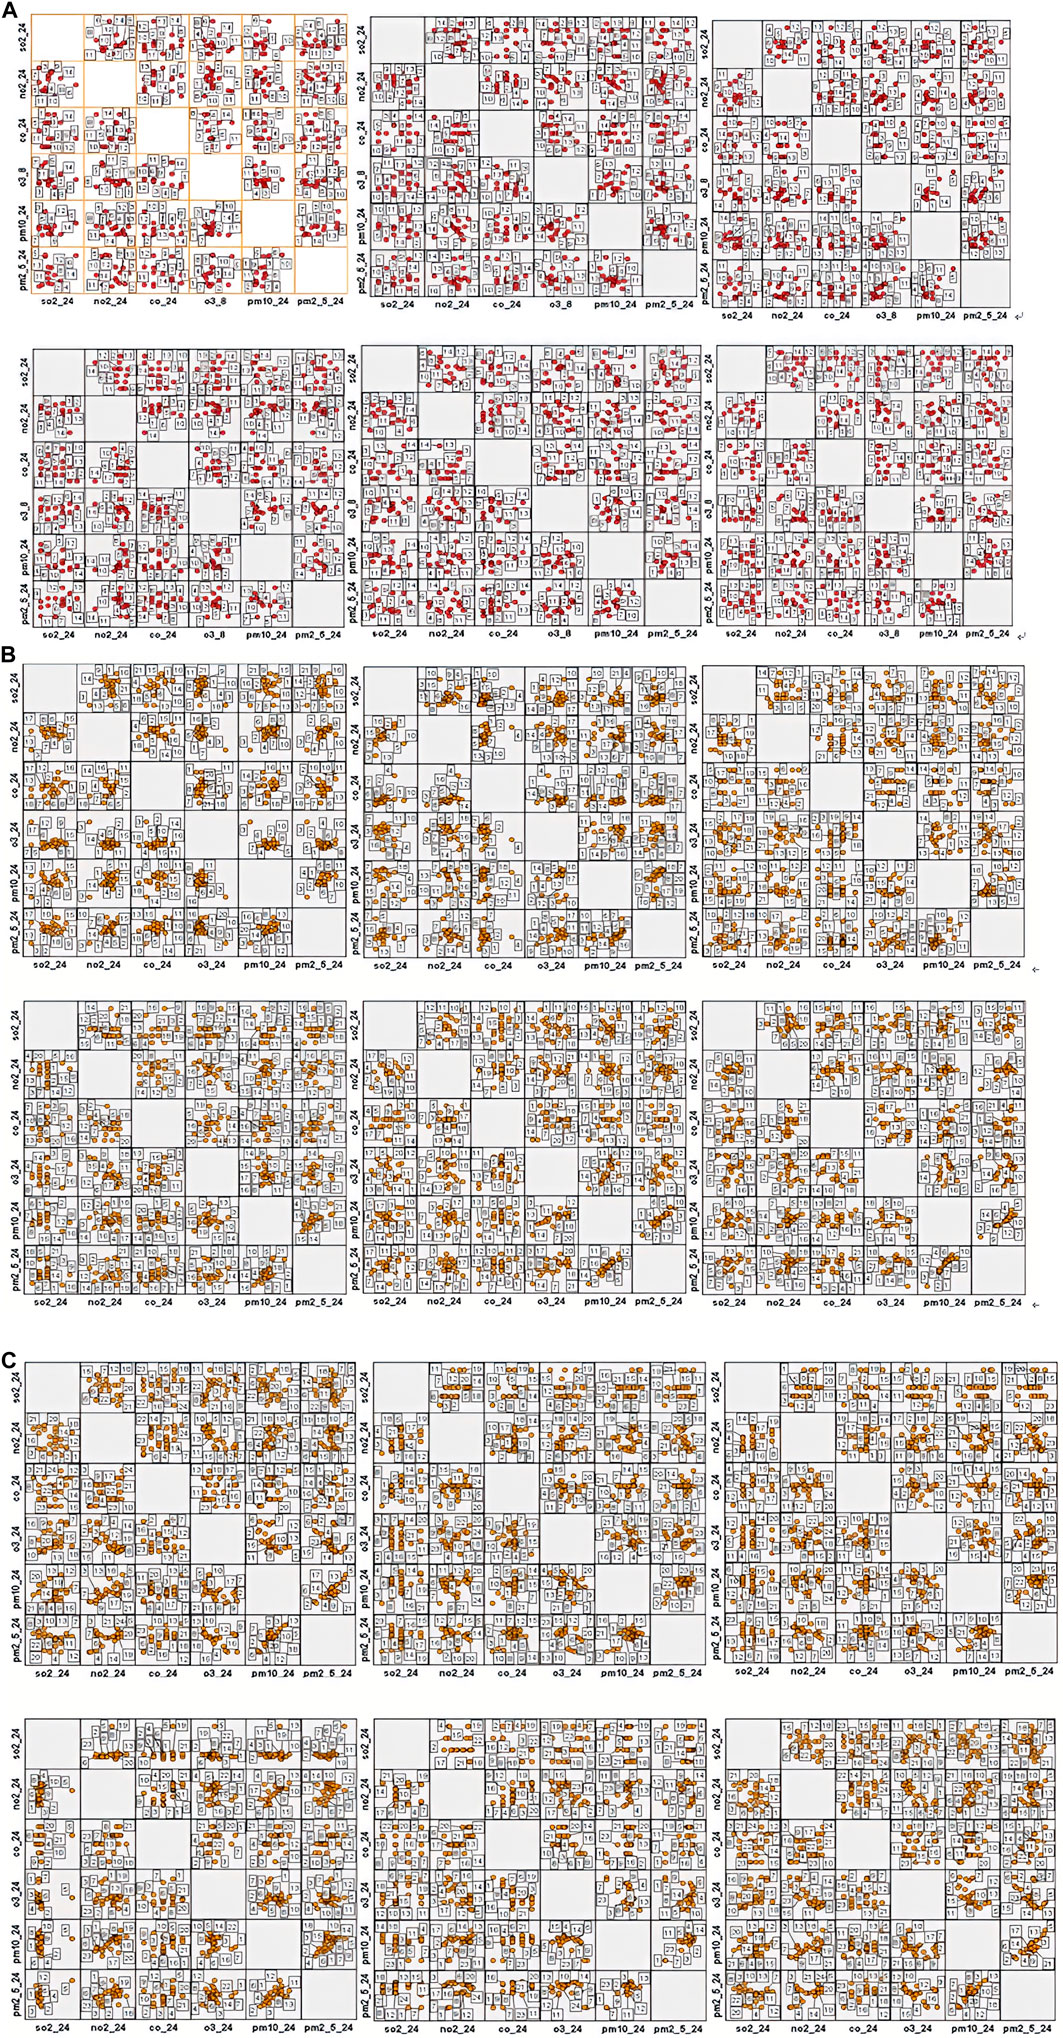
Figure 8. Correlations among pollutant concentrations. (A) Xi’an; (B) Beijing; (C) Tianjin.
To verify the rationality and effectiveness of the air pollution data fusion method based on fuzzy comprehensive evaluation and DS evidence theory, this study utilized the original dataset provided by the China National Environmental Monitoring Center (CNEMC) and the Qingyue Open Environment Data Center (Tables 4–6). Systematic analysis and quantification (Tables 7–9) were conducted to consolidate air pollution indices from different regions for the same time period.
Calculation of interval similarity is critical in assessing the similarity between two intervals of data, particularly in the context of the variability of pollution concentrations. Equations (14) and (15) (Wu and Mendel, 2009), which calculate the similarity between fluctuating concentration values, generate BPA values that encapsulate the relationships among interval data points for atmospheric pollutants (Graziani et al., 2019). This approach ensures the accuracy of these similarity measures and establishes the foundation for data fusion, fostering more robust analysis and a comprehensive understanding of pollution trends.
BPA values corresponding to the atmospheric pollutant concentrations on selected days are illustrated in Tables 10–12. These values, derived from the interval similarity calculations (equations (14) and (15), facilitate objective assessment of the regional pollution levels for each pollutant, following Qin and Xiao (2019). These BPA values quantify the pollution level and establish the basis for the advanced stages of data fusion. These empirical insights (Tables 10–12) are paramount, enabling a systematic comparison pollutant levels and thereby highlighting the broader importance and impact of each pollutant.
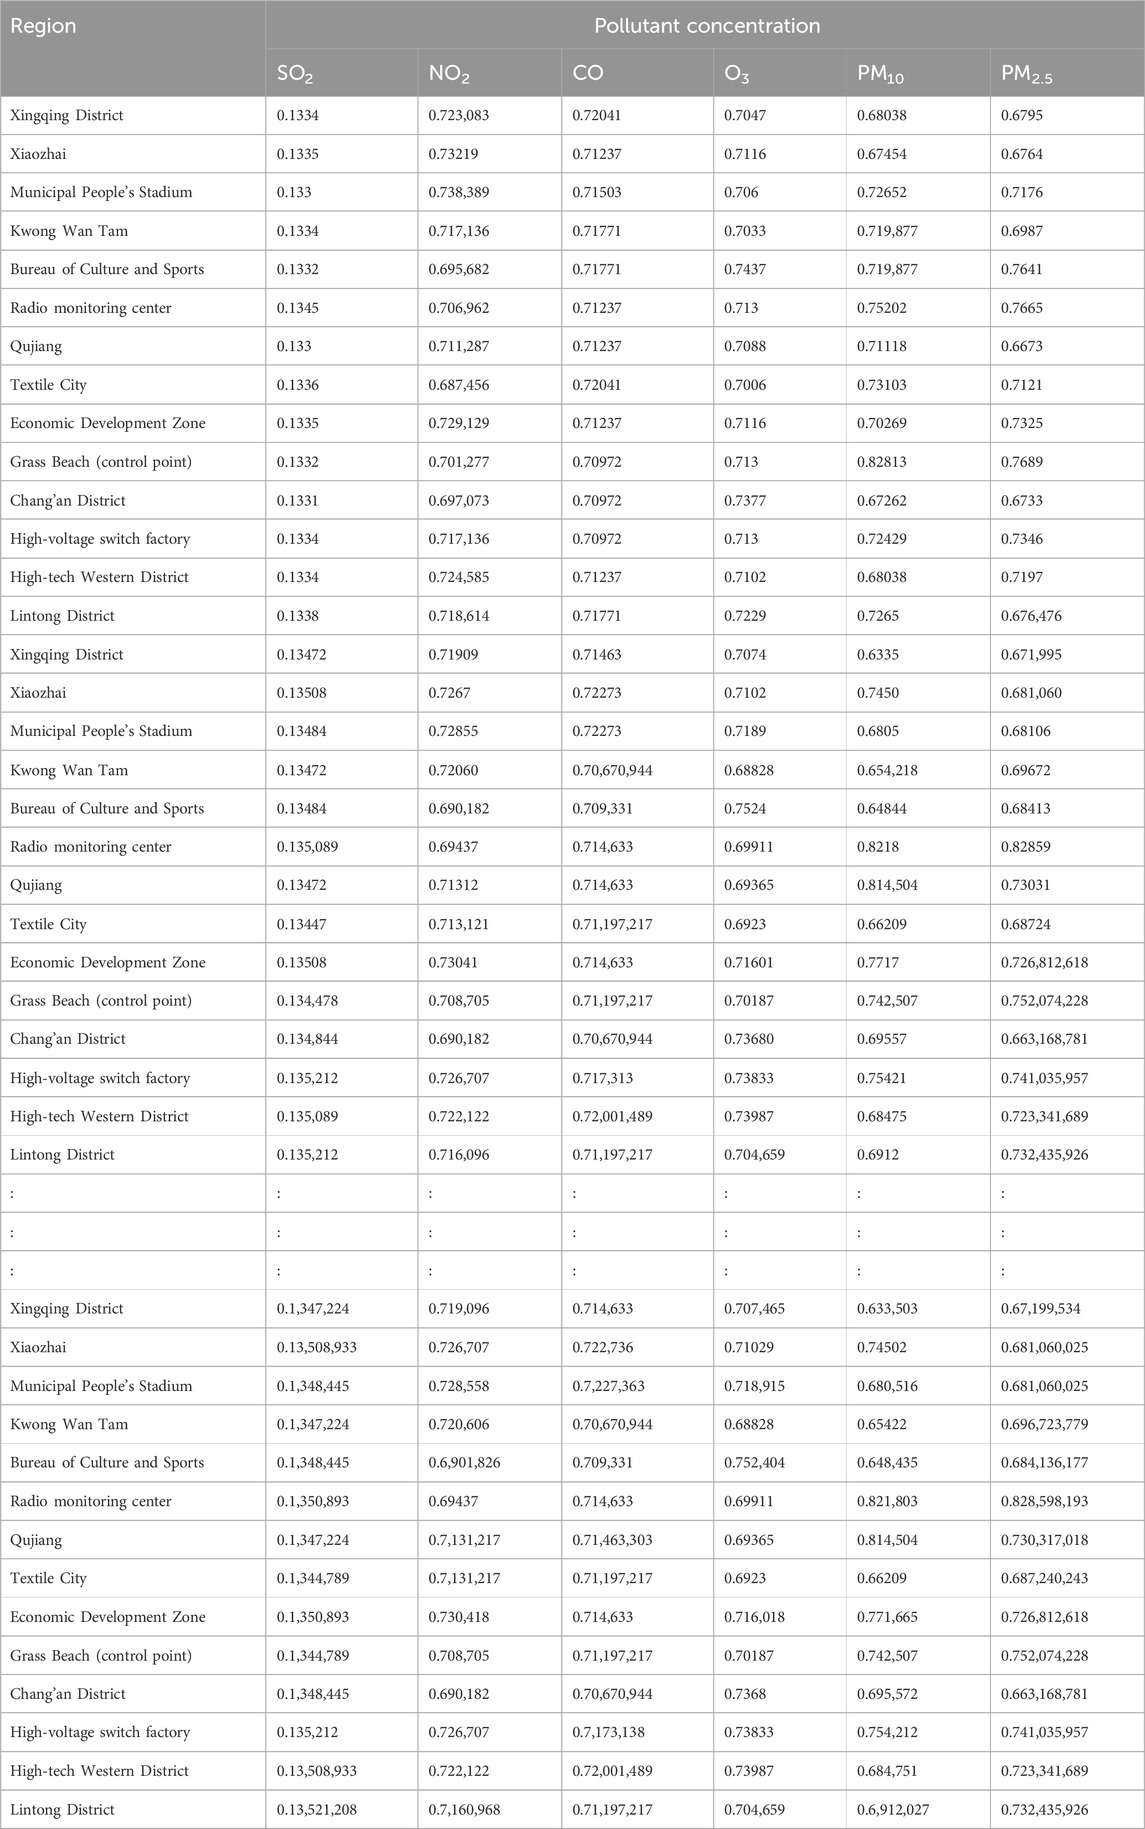
Table 10. BPA values across different regions.xi’an.

Table 11. BPA values across different regions.beijing
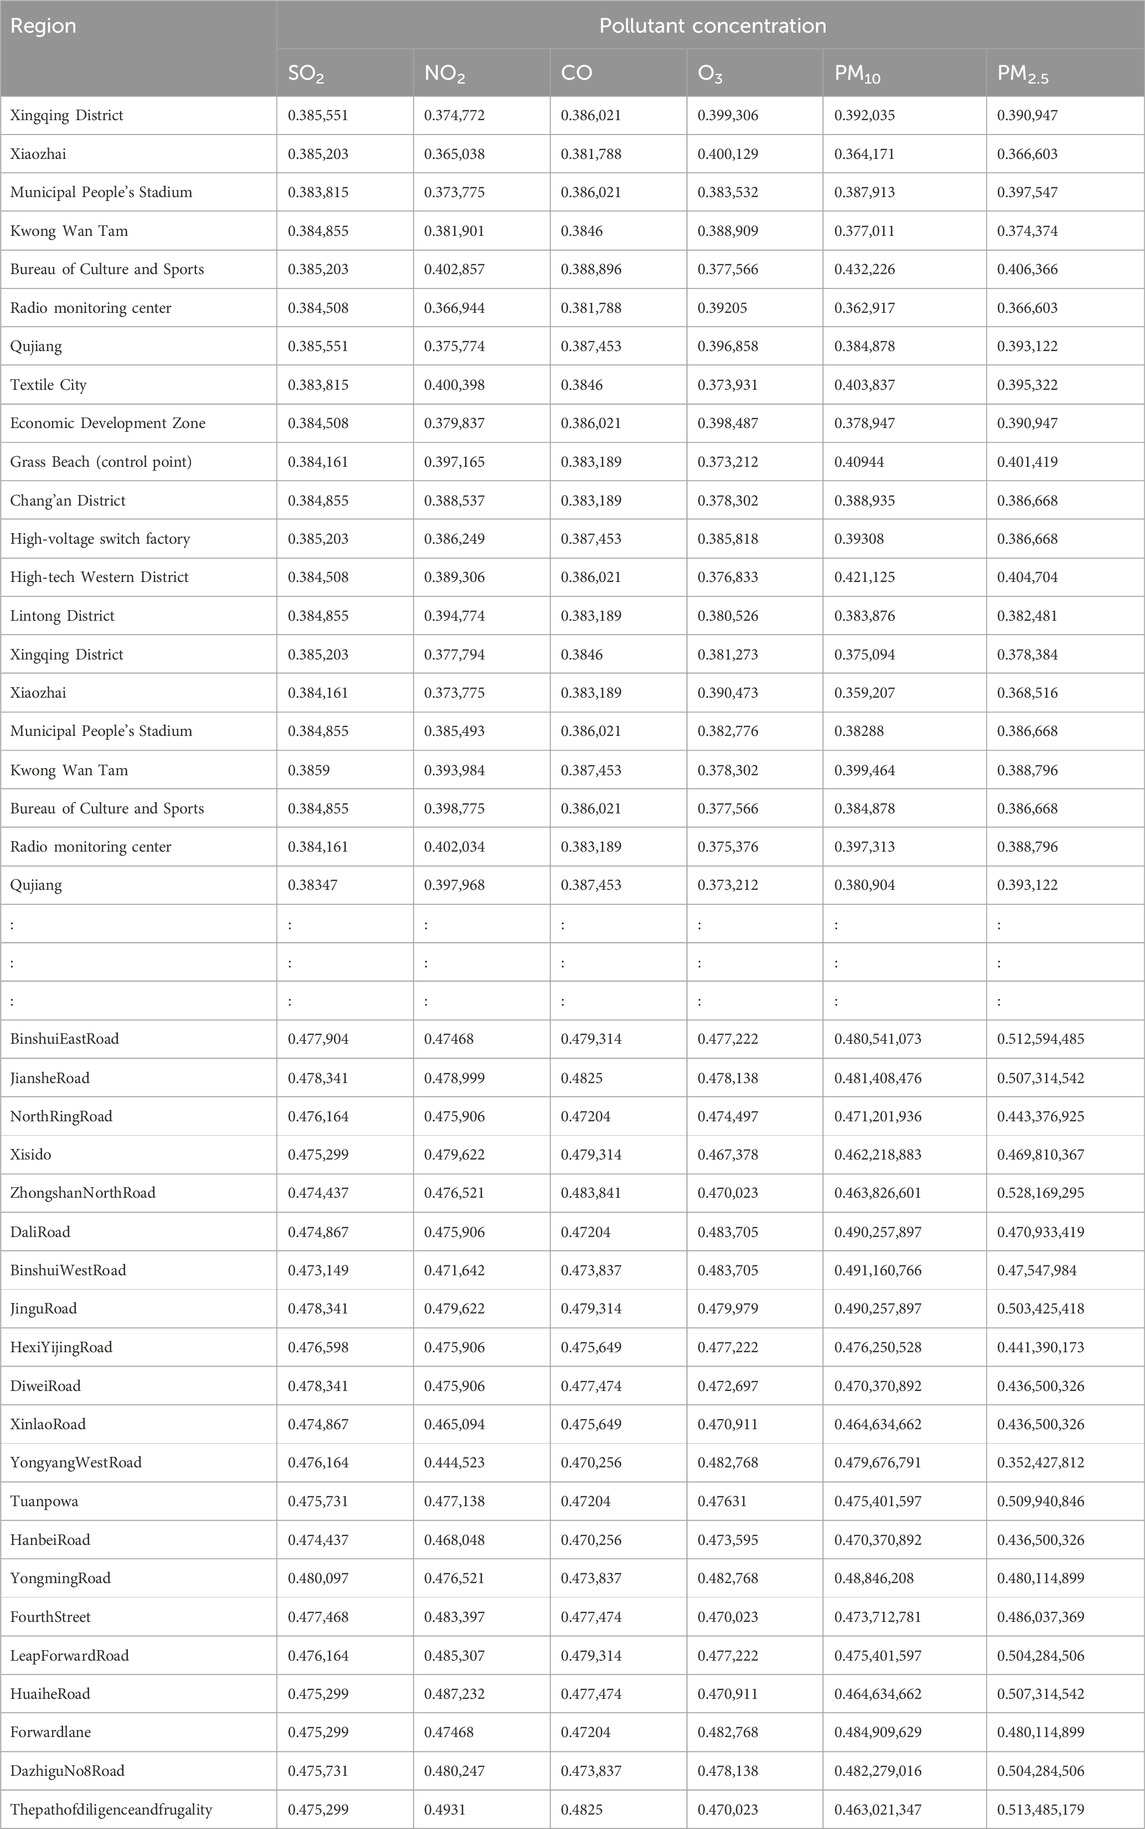
Table 12. BPA values across different regions.tianjin
Regional pollution levels were estimated via sequential fusion (Figure 4) using DS evidence theory (Tables 13–15). The uncorrected fusion results deviate significantly from the CNEMC AQI values, yielding an error rate of 50%.
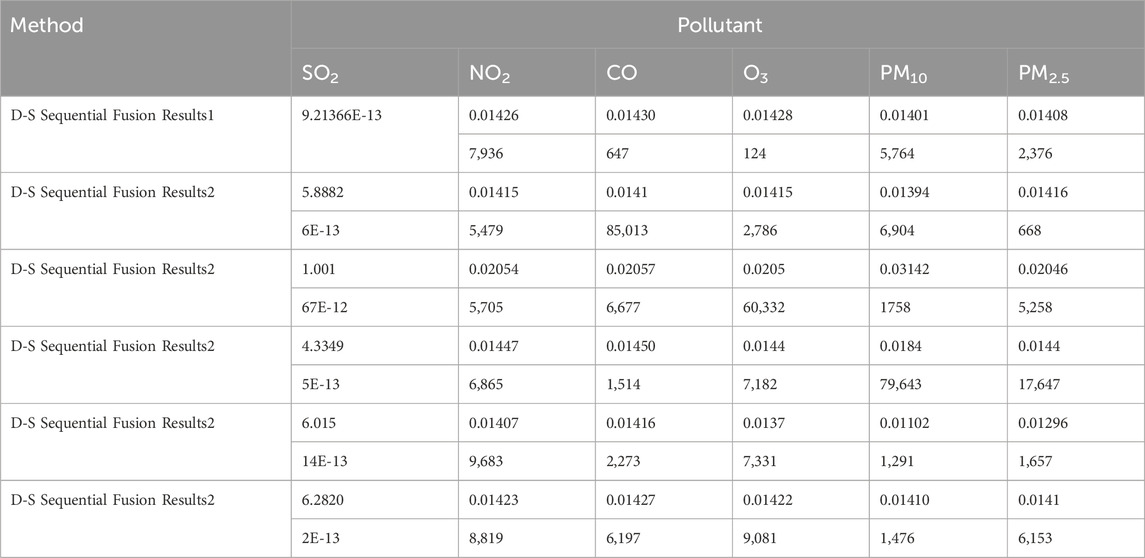
Table 13. Sequential fusion results.xi’an.
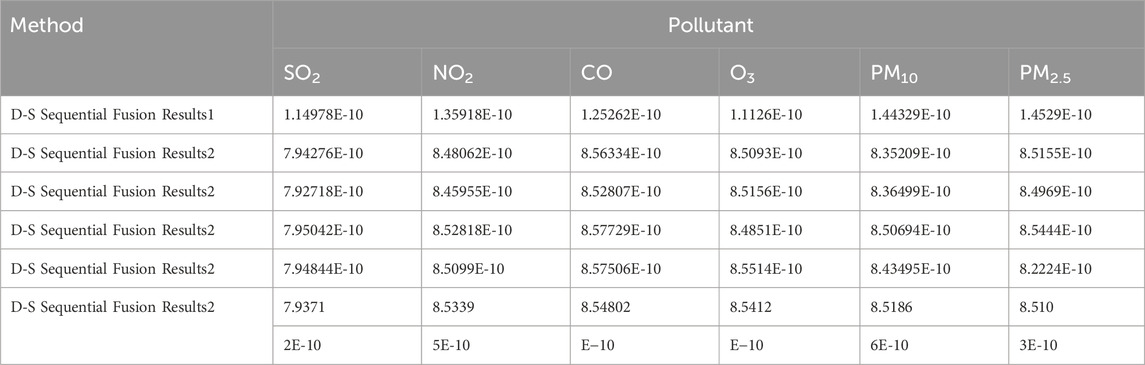
Table 14. Sequential fusion results.beijing
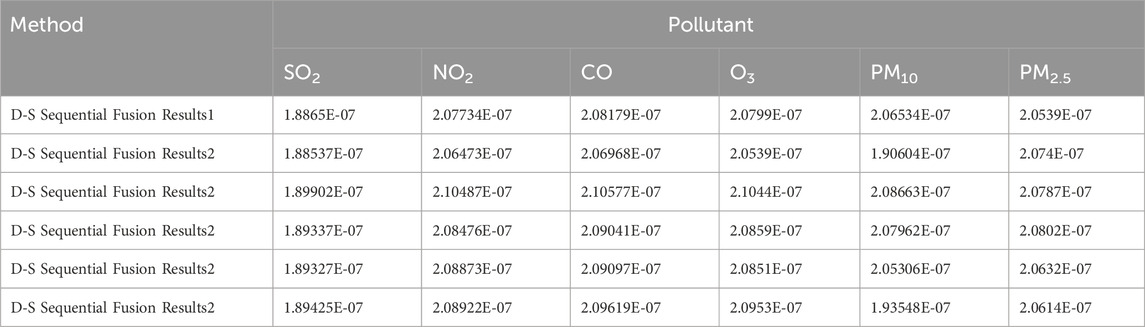
Table 15. Sequential fusion results.tianjin
Relying on uncorrected fusion data can lead to misleading conclusions. To improve estimation accuracy, the influence of toxicity and the interactions between pollutants must be considered. We therefore calculated the subjective and objective weights of the pollutants using the CRITIC weighting method (Tables 16–18).
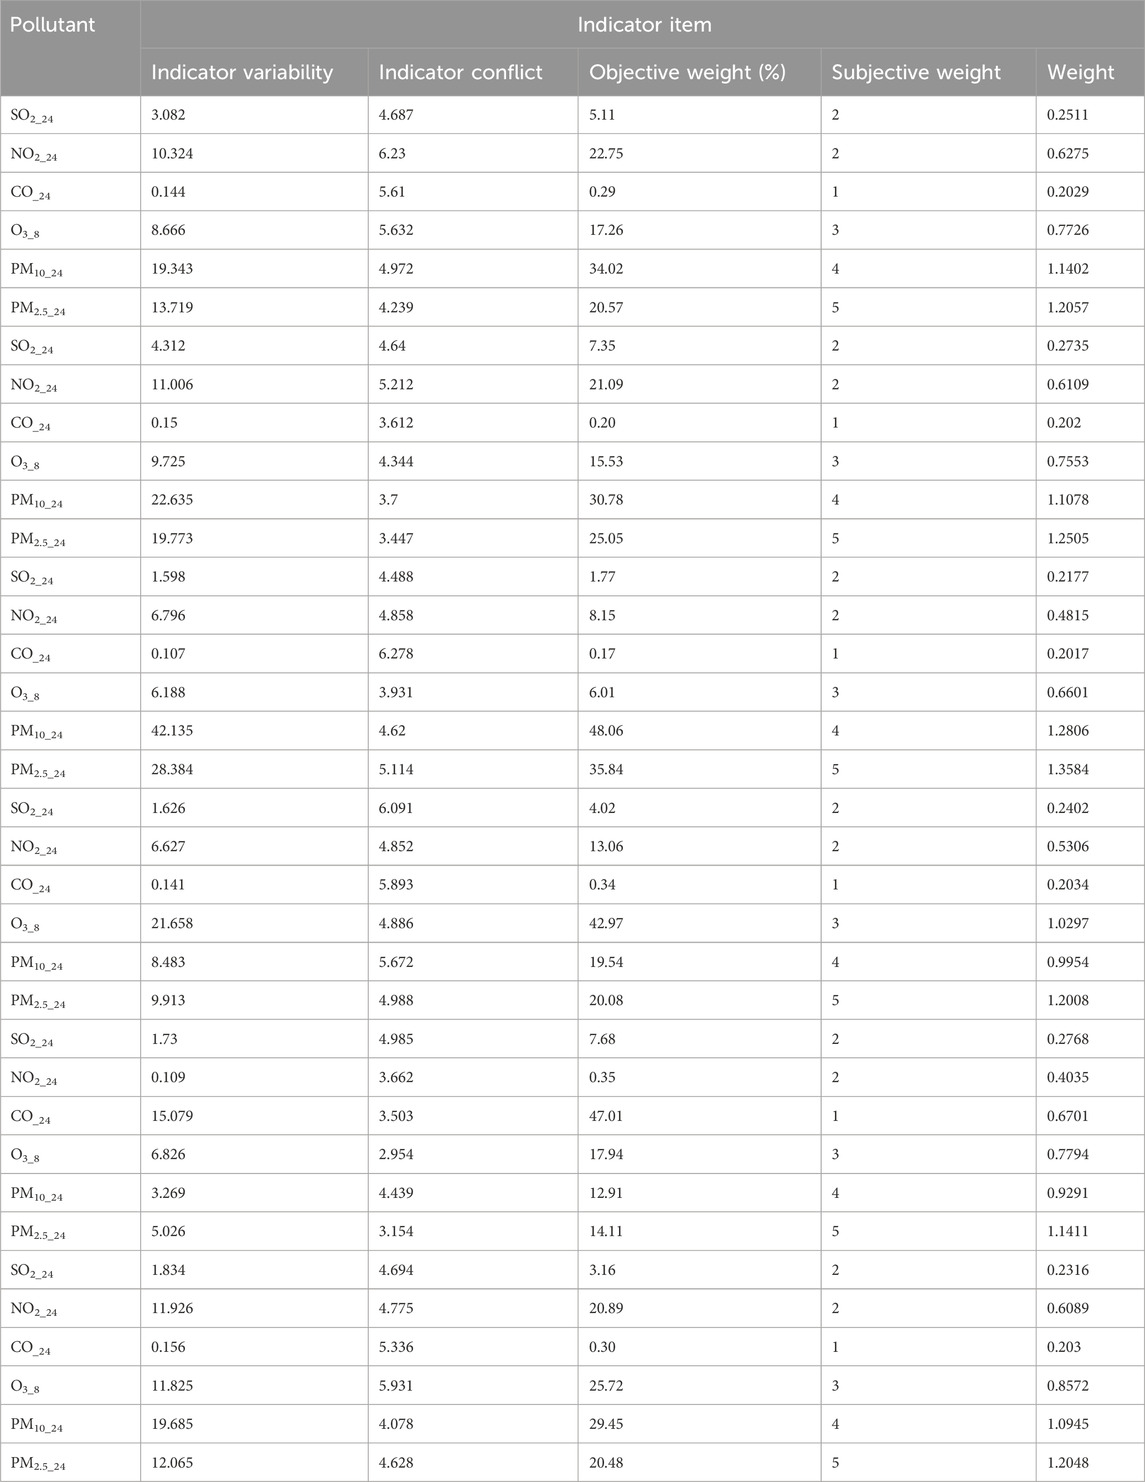
Table 16. Subjective and objective weights of the pollutants.xi’an.
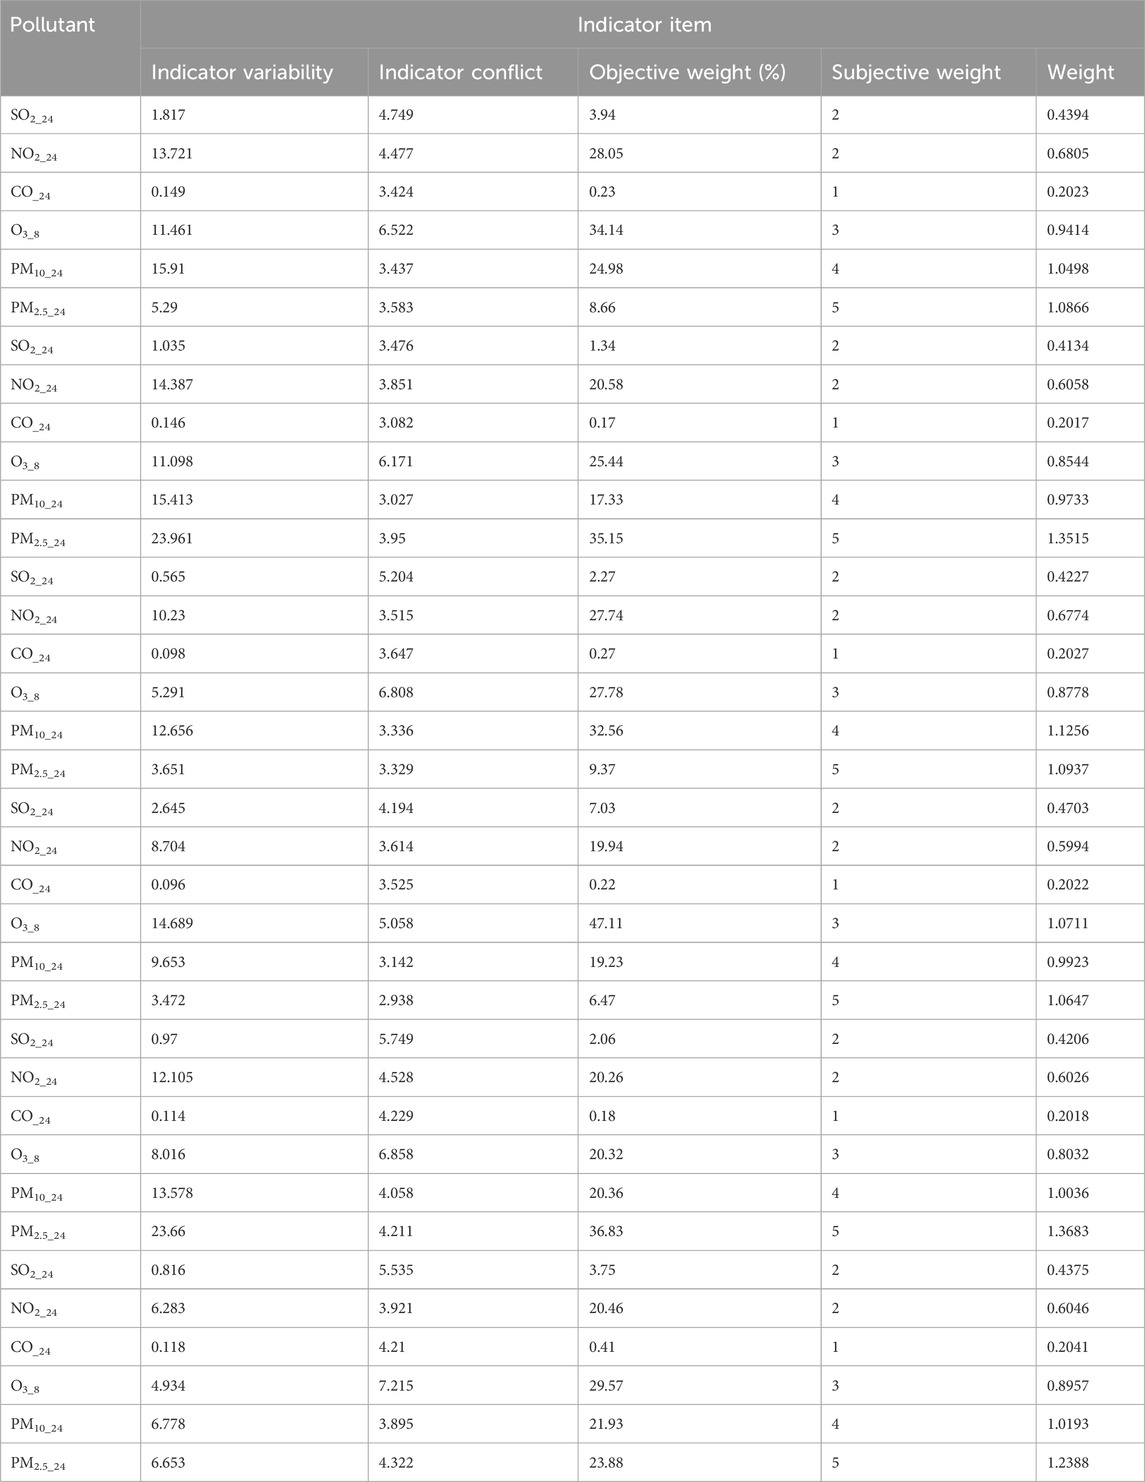
Table 17. Subjective and objective weights of the pollutants.beijing
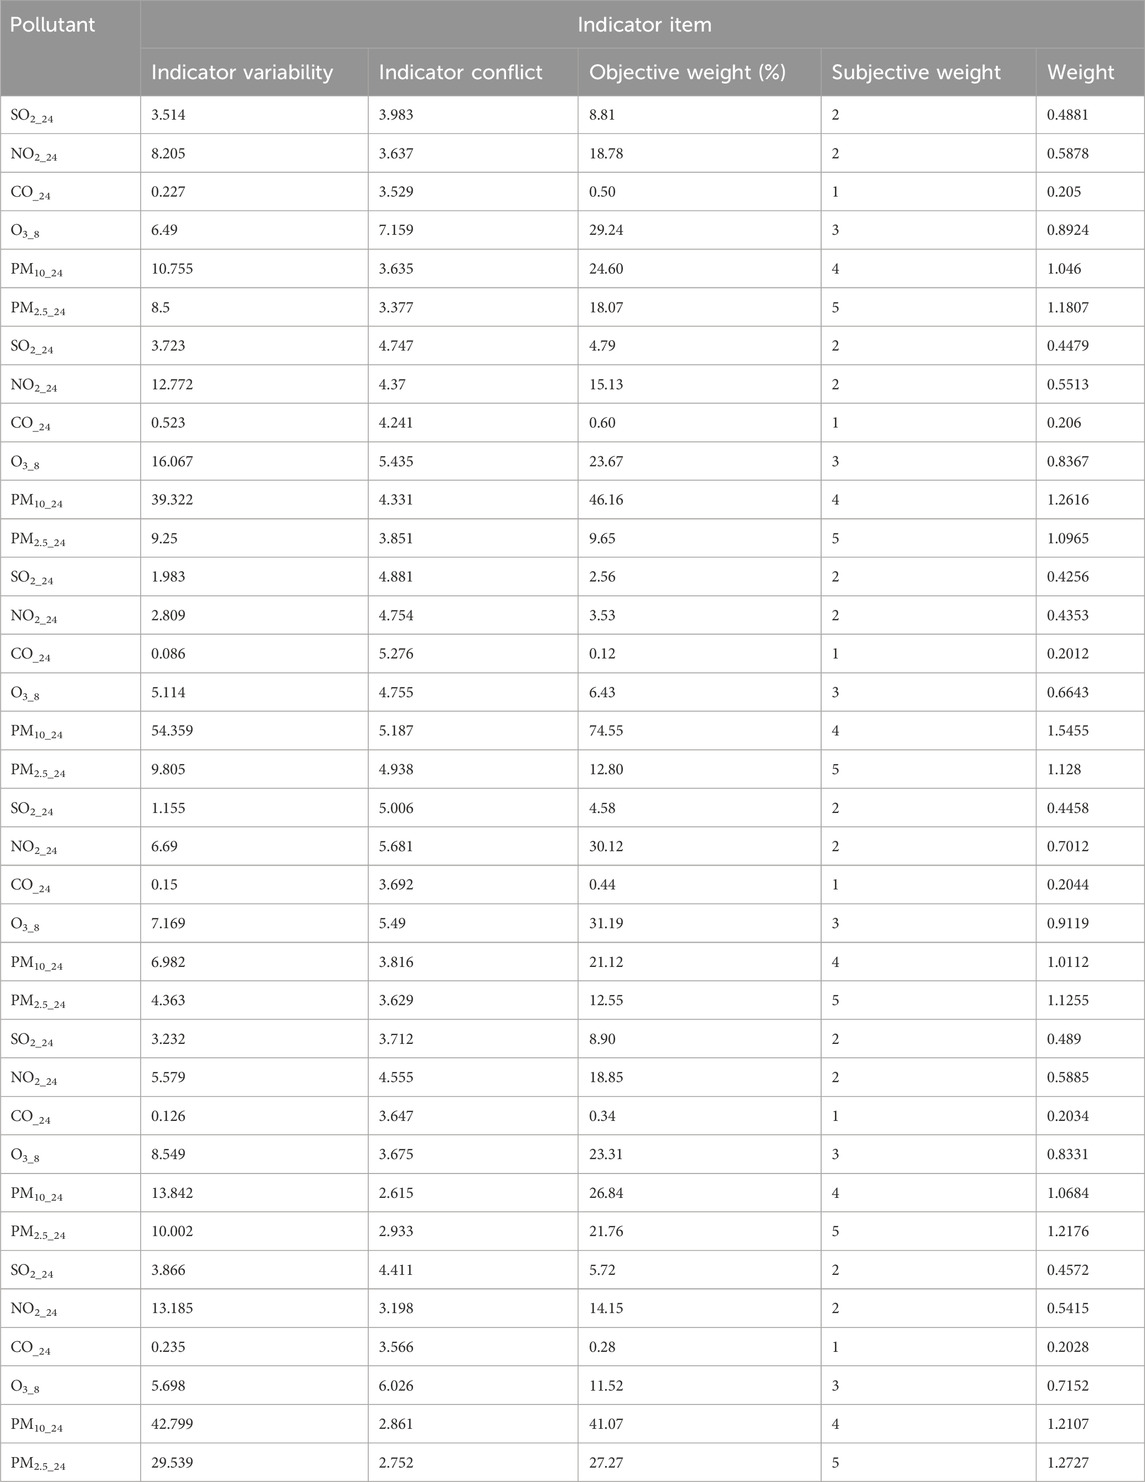
Table 18. Subjective and objective weights of the pollutants.tianjin
The DS fusion results were corrected using objective–subjective weights (Tables 19–21). The high error rate in the uncorrected data (Table 7) underscores the need for careful interpretation and potential correction. Fusion-based correction achieved a remarkable and significant reduction in error, from the initial 50%–11%, suggesting a close correlation between the corrected results and the AQI values, reflecting the efficacy of the correction approach. This highlights the importance of addressing potential biases and uncertainty in the fusion process, generating more precise and reliable outcomes.
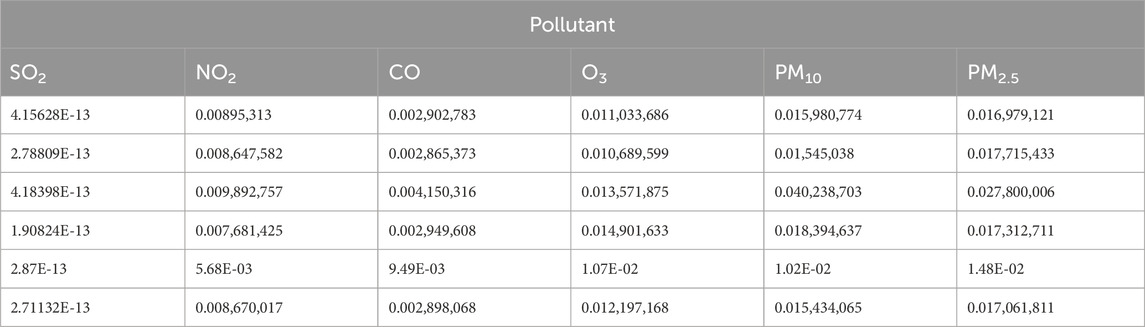
Table 19. Corrected D-S fusion results.xi’an.
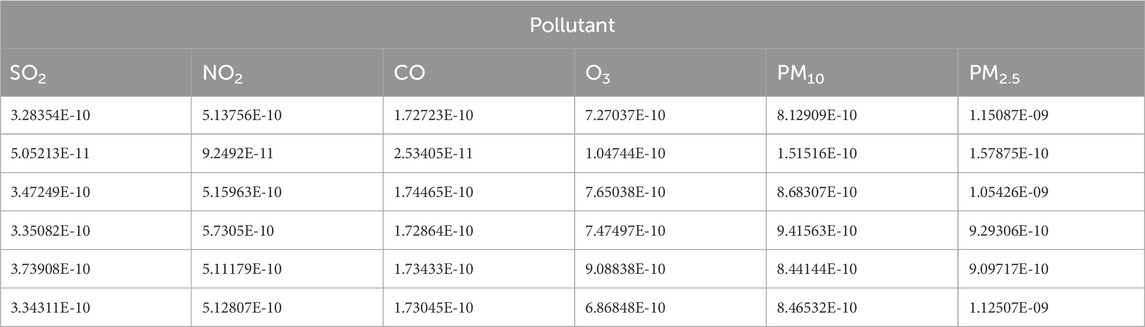
Table 20. Corrected D-S fusion results.beijing
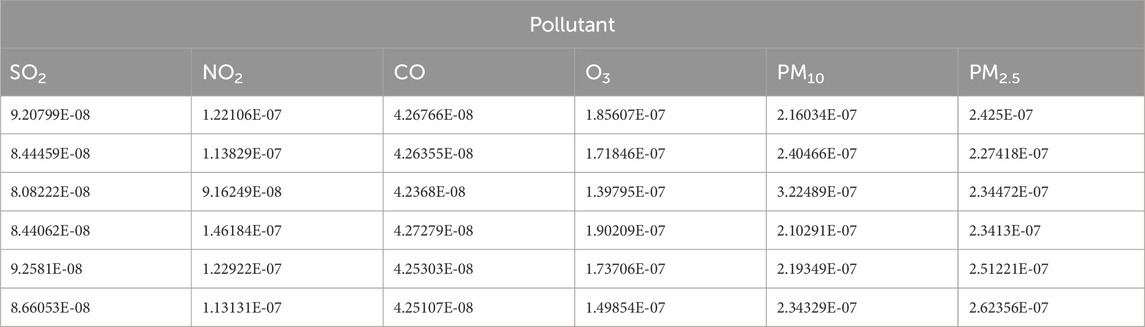
Table 21. Corrected D-S fusion results.tianjin
We used an extended KNN algorithm to estimate air pollutant levels, which were then correlated with air-quality levels. Tables 22–24 illustrates the variability in air quality (from good to severely polluted) during the study period. These results were consistent with the AQI values, facilitating the identification of major pollutants such as PM2.5 and PM10 (Figure 9) and validating the accuracy and efficacy of the proposed method.
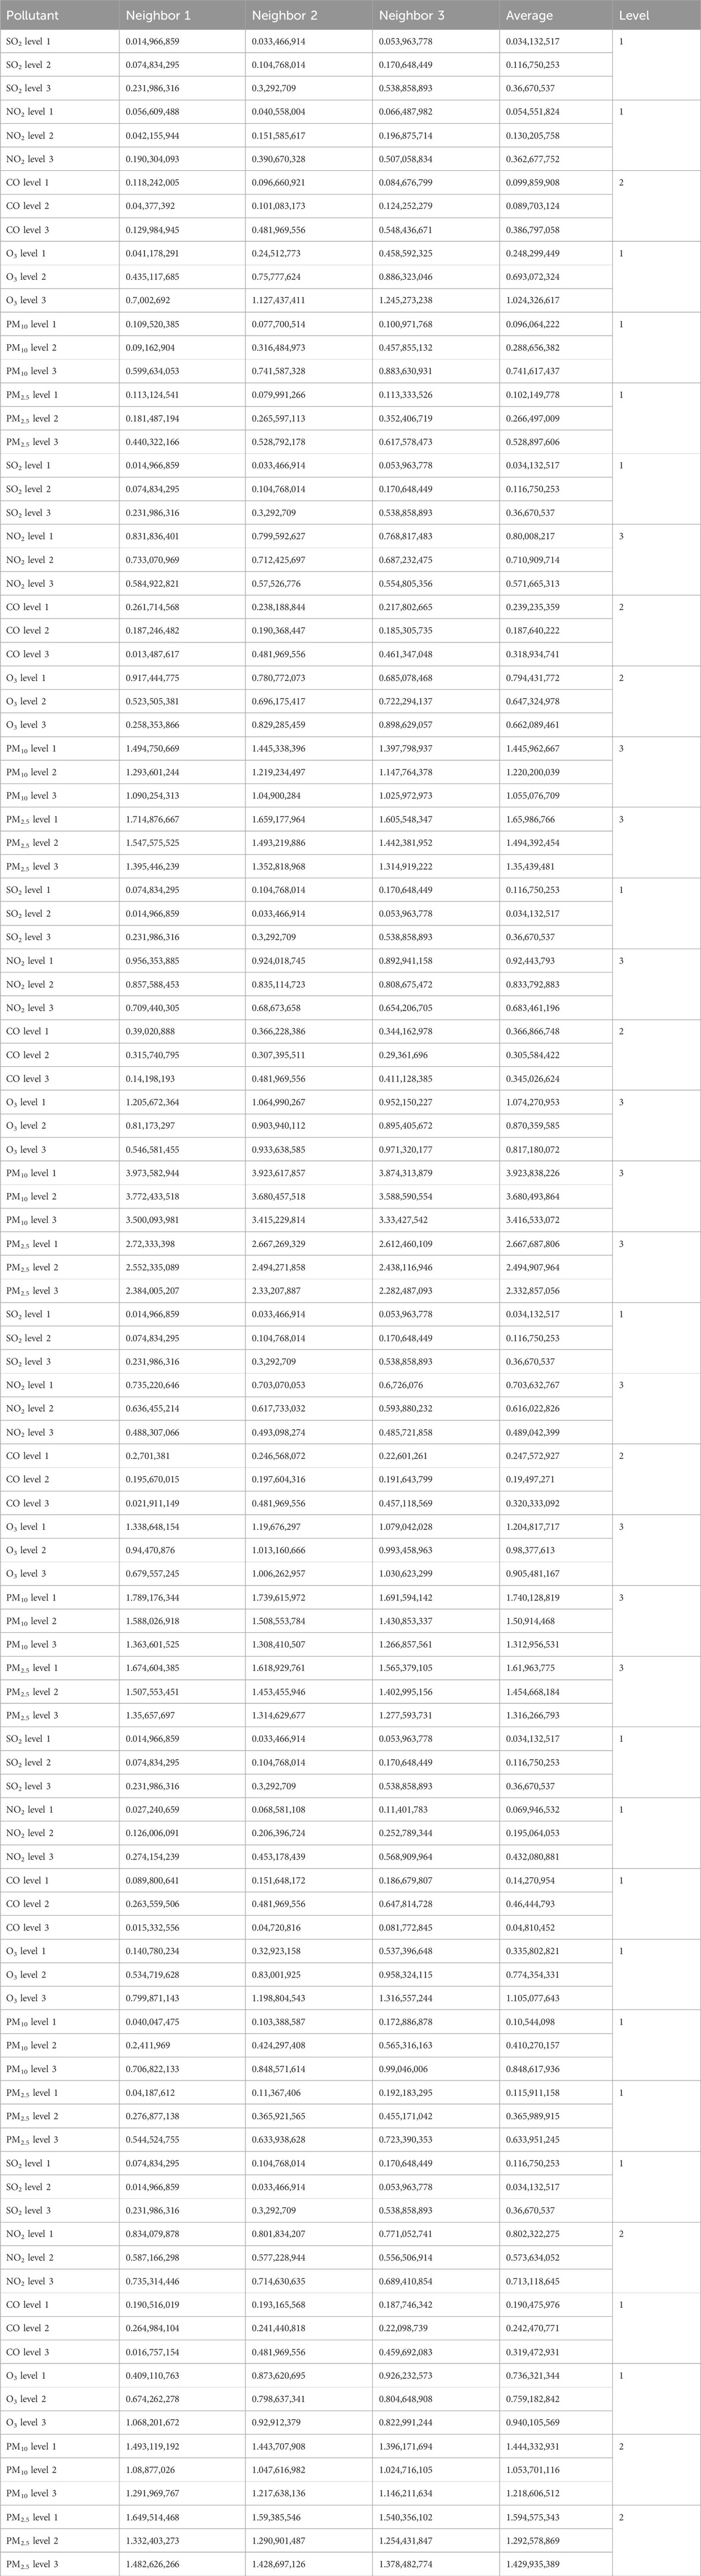
Table 22. Evaluation of the nearest neighbors in KNN.xi’an.
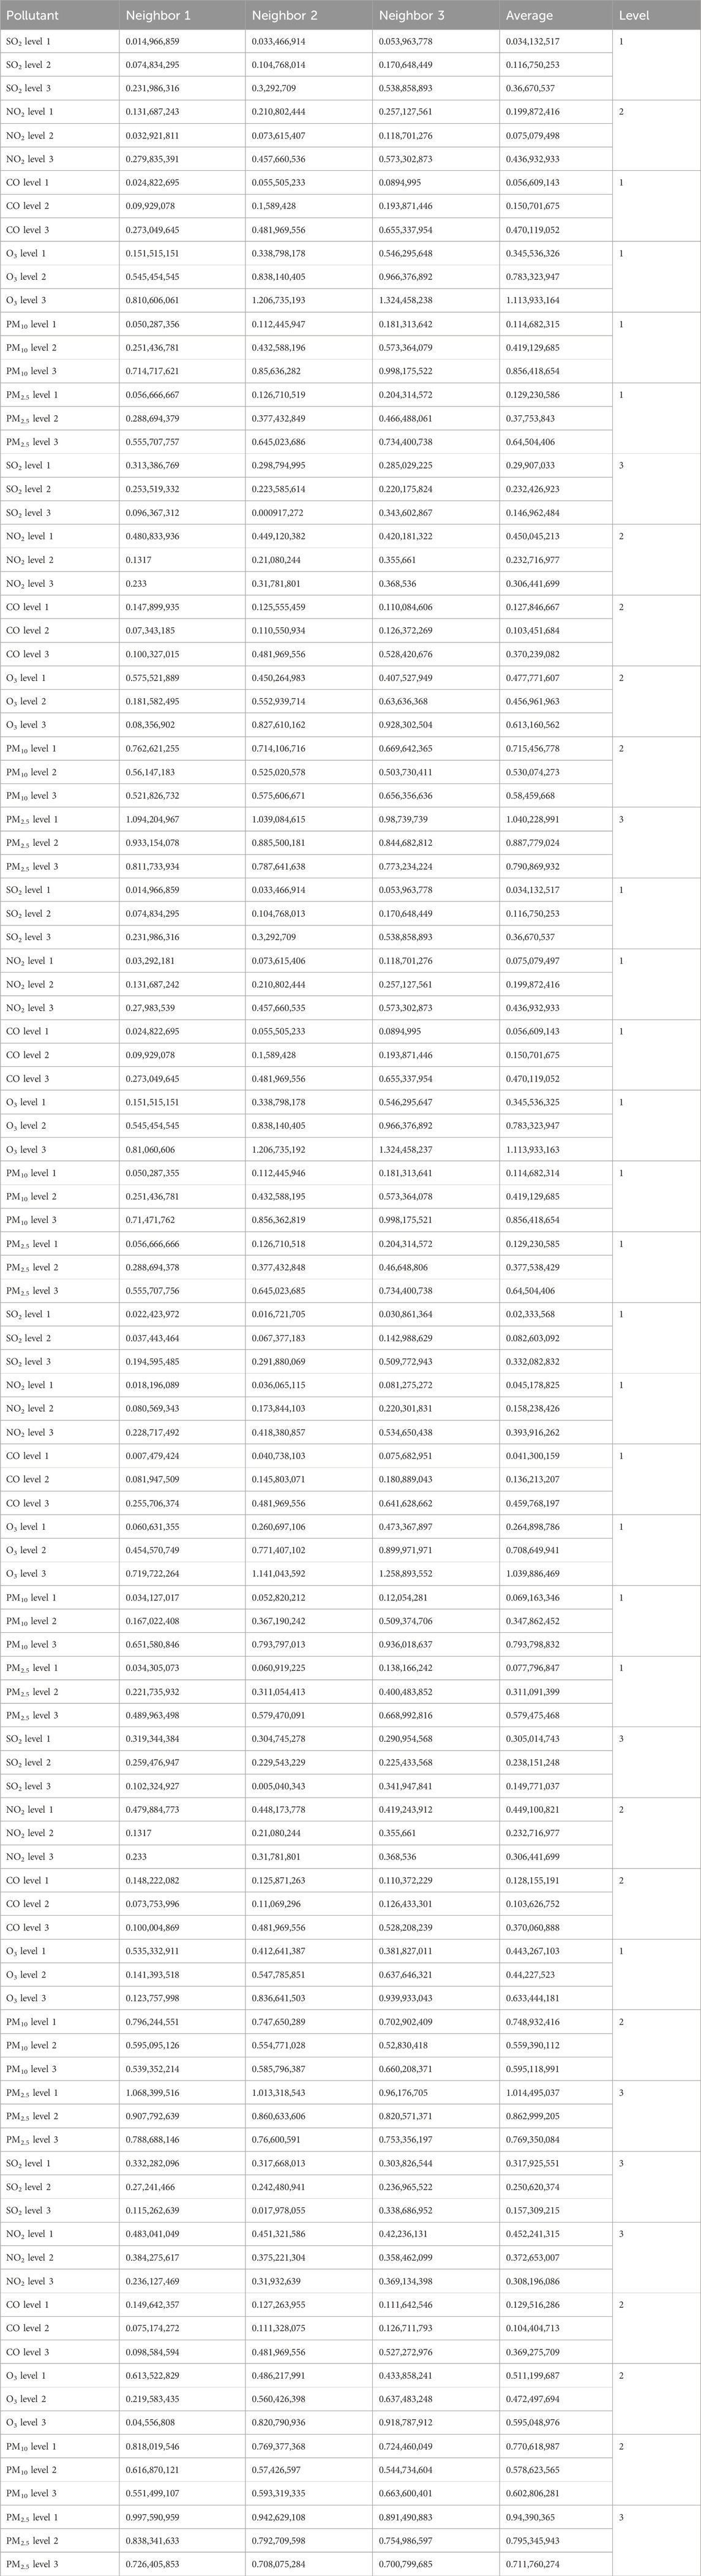
Table 23. Evaluation of the nearest neighbors in KNN.beijing
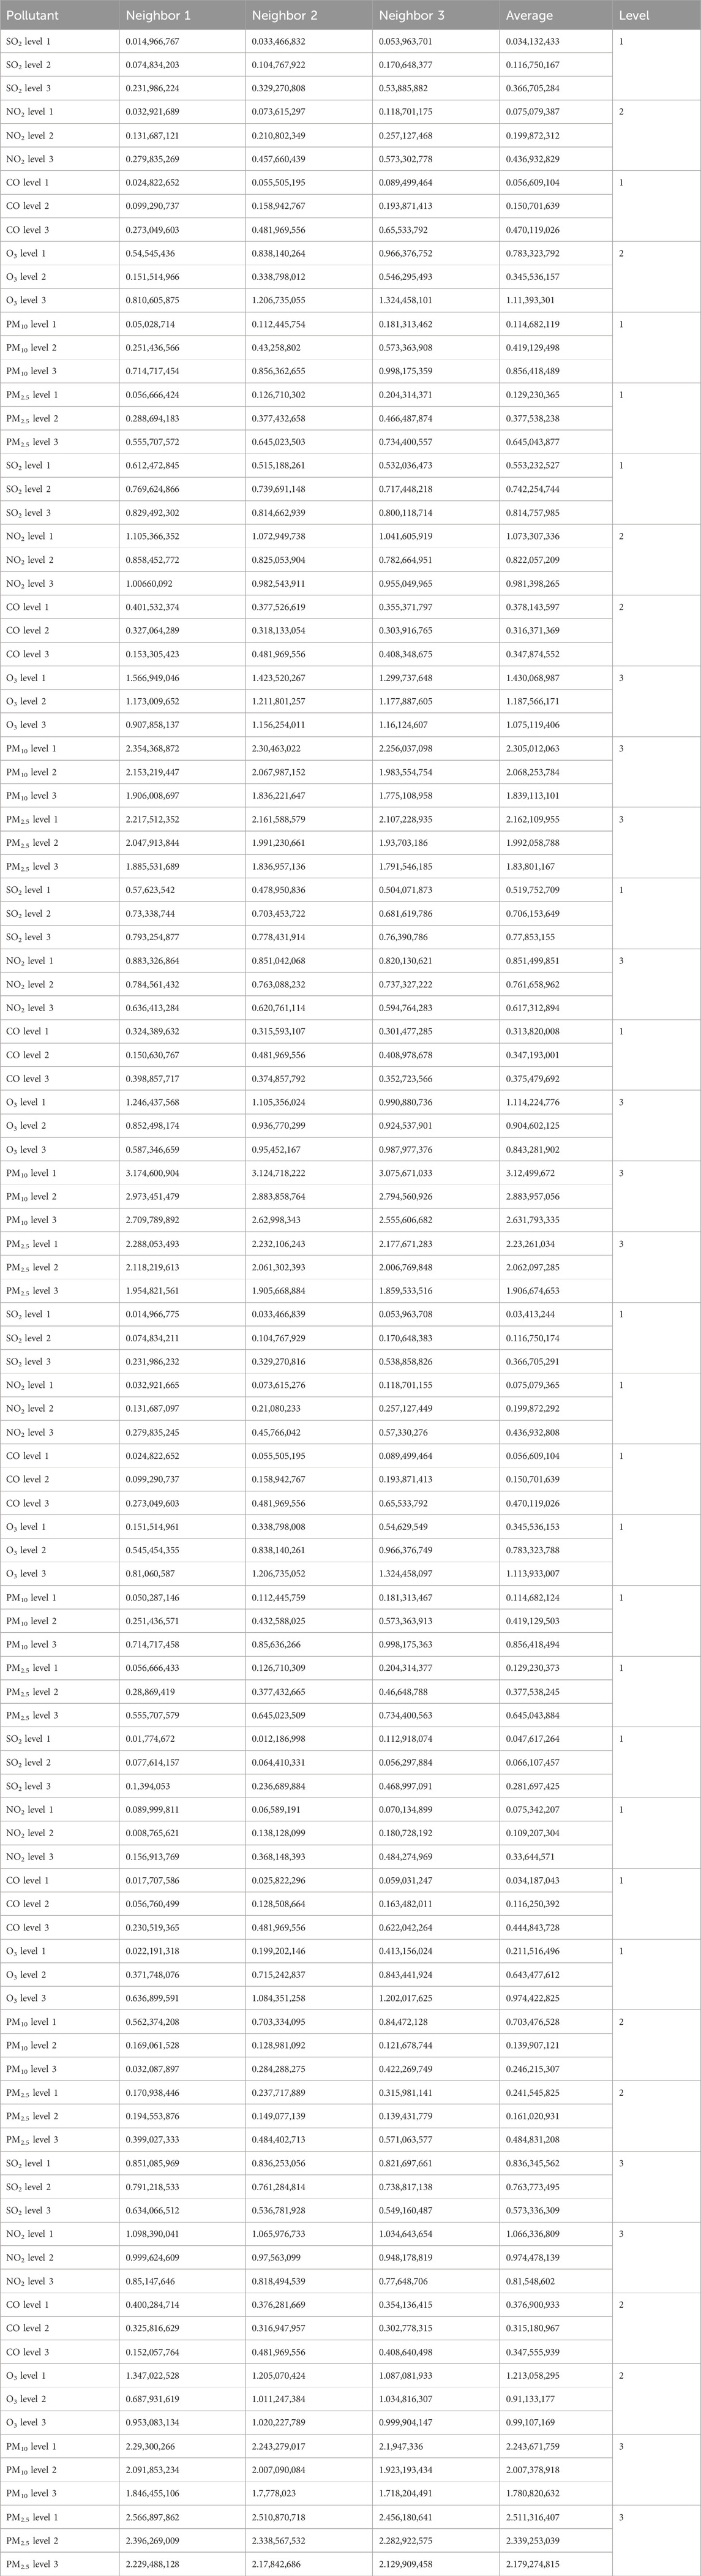
Table 24. Evaluation of the nearest neighbors in KNN.tianjing
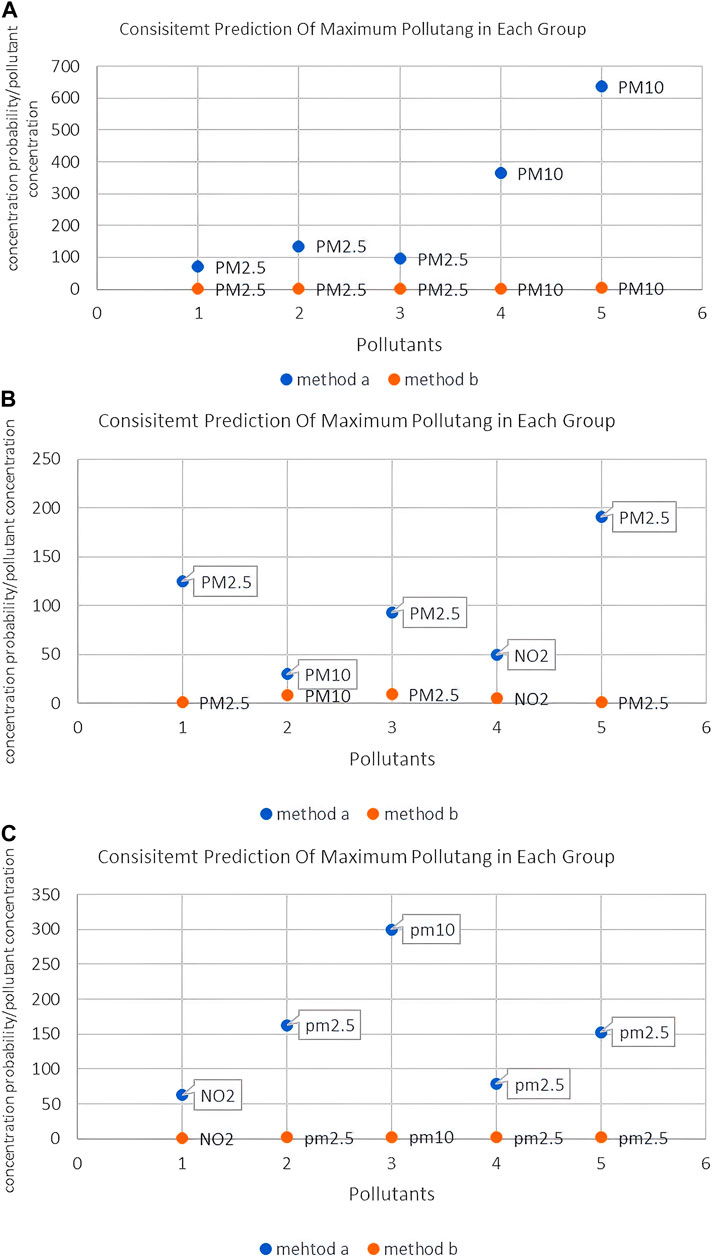
Figure 9. Comparison of predicted concentrations of major pollutants. (A) Xi’an; (B) Beijing; (C) Tianjin. (A) Xi’an; (B) Beijing; (C) Tianjin.
Given that air quality data are influenced by multiple factors, including meteorological conditions, vehicular traffic, and industrial activity, such data are inherently uncertain. Exclusive reliance on the raw DS fusion results might overlook pivotal environmental and socio-economic variables.
Refining DS fusion outcomes extends beyond merely enhancing accuracy, by more comprehensive and accurately portraying air quality and thereby equipping policymakers with evidence-based recommendations. For instance, a raw high pollution reading might trigger unwarranted alarm and panic, while a refined reading could suggest the necessity for additional monitoring sites or improved data fusion methodology. As air quality directly impacts public health, it is imperative to deliver precise data. Using raw values may cause the effects of pollutants to be under- or over-estimated, leading to misguided health advisories and policies. Here, via objective–subjective weighting, were able to integrate environmental and socio-economic aspects into the analysis, achieving more accurate and reliable outcomes. Such refinement is not limited to air quality assessment. As this method can handle uncertainty and complexity, it is applicable in other contexts, such as water and soil quality evaluations, highlighting the versatility and value of this novel approach.
The refinement of DS fusion outcomes were comprehensively validated using expanded datasets from urban environments in Xi’an, Beijing, and Tianjin, cities with distinct environmental and socioeconomic profiles. These findings highlight both the robustness of this refinement process and its applicability in diverse air quality scenarios. By integrating data from these cities, the method can provide substantially more refined and precise air quality assessments. This is critical for informed policy-making and effective public health management.
To establish the effectiveness of the proposed method, we compared it to SVM. For our dataset, SVM achieved 75% prediction accuracy (Figure 10), whereas our method performed significantly better, achieving 86% accuracy (Figure 11). Further, unlike traditional SVM approaches, our method exhibited remarkable robustness and stability in handling uncertainty and noise. These findings validate the efficacy of our method and highlight its potential for evaluating trends in air pollution.
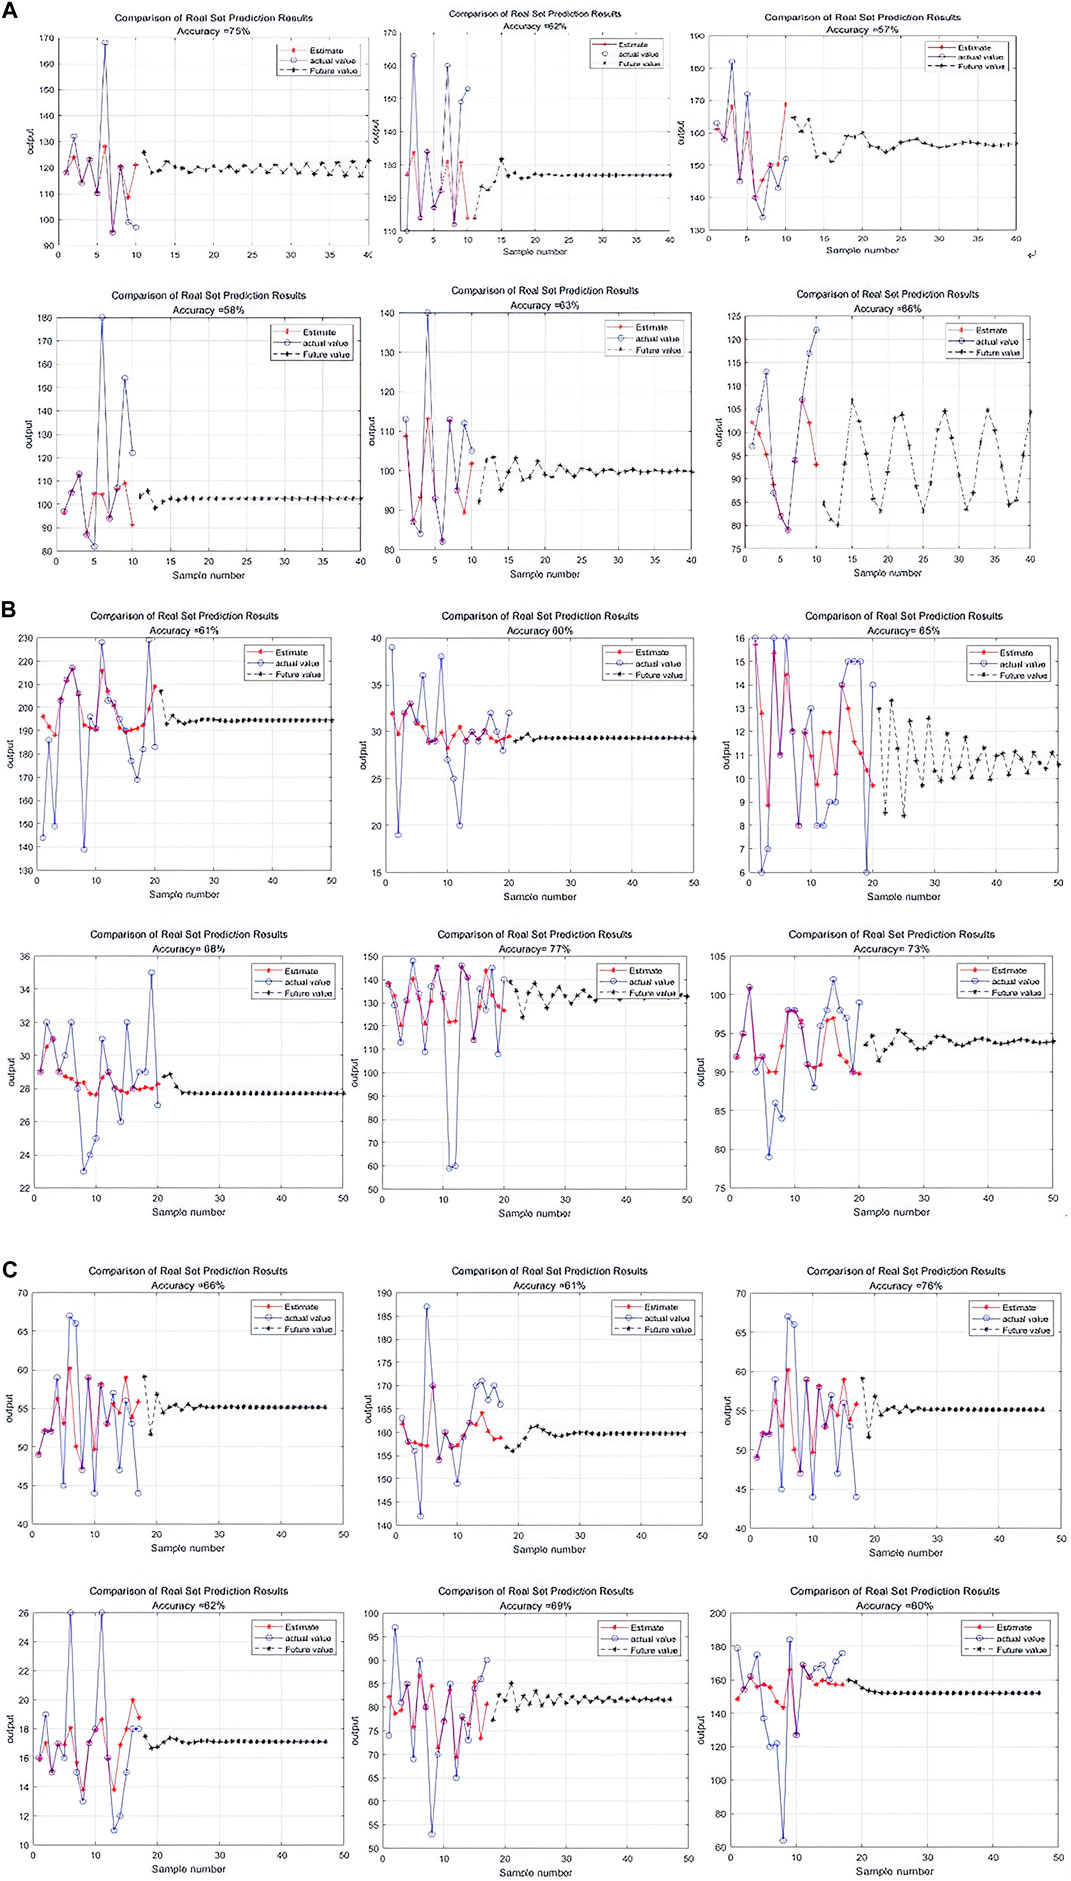
Figure 10. Comparison of support vector machine (SVM) training results. (A) Xi’an; (B) Beijing; (C) Tianjin.
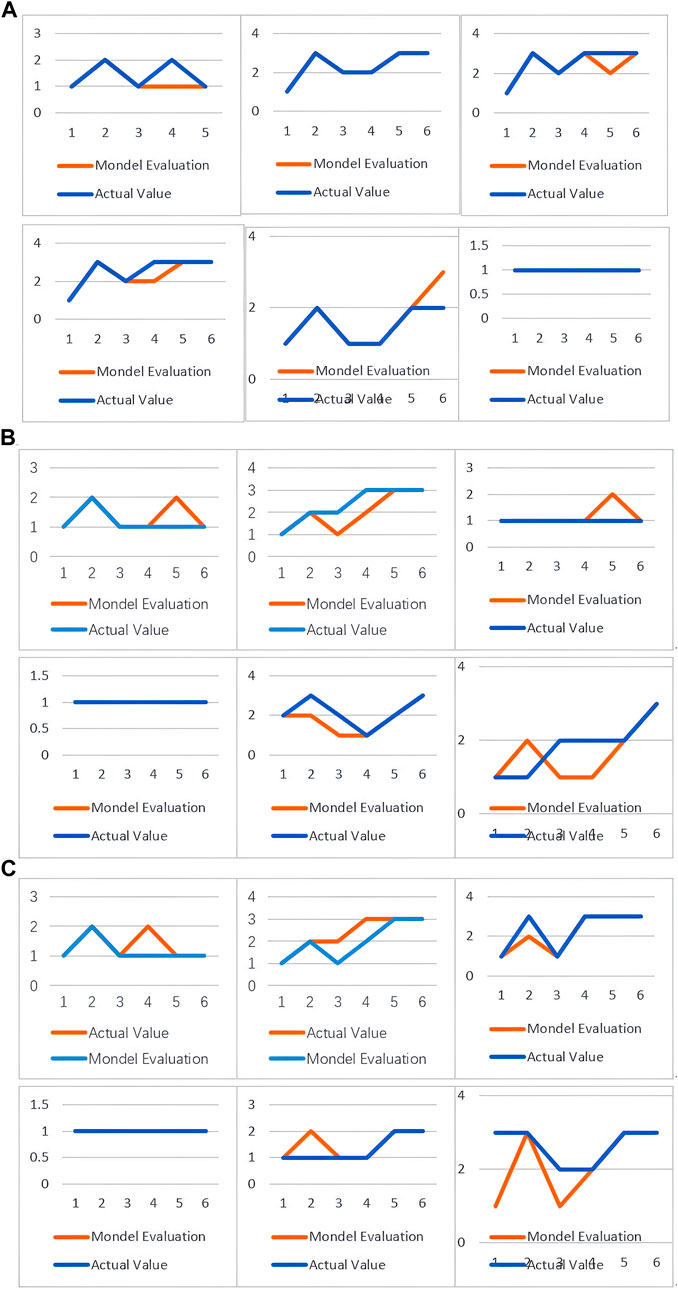
Figure 11. Comparison between values based on fuzzy evaluation of atmospheric pollution concentrations using evidence theory with KNN on the one hand and actual values on the other. (A) Xi’an; (B) Beijing; (C) Tianjin.
In the current context of environmental science, precise estimation is essential for effective policy development. Our novel method aims to characterize air pollution dynamics with greater accuracy by integrating the evidence theory and the KNN algorithm. BPA, a cornerstone of the DS theory of evidence, effectively addresses the uncertainty inherent in atmospheric pollution data; we therefore used it for decision-making under uncertainty. Consistent with the findings of Zhong and Liu (2019), integrating BPA into our data fusion strategy reduced the uncertainty, enhancing the precision and reliability of the results.
Given the complexity of atmospheric pollution, a single monitoring point cannot capture the full extent of pollutant diffusion and distribution. Sequential fusion of atmospheric pollution concentrations, however, integrates multi-source monitoring data, estimates pollution levels more accurately and reliably, enhances data accuracy and reliability, and comprehensively describes the spatiotemporal variation in air pollution. By considering spatial correlation, this method more precisely assesses pollutant concentrations. This method achieves several key innovations, in terms of its strategy for handing small datasets, interdisciplinary approach, improved pollution atmospheric monitoring and prediction, and ability to consider multiple environments.
Limited data availability poses a primary challenge in environmental science, and especially in atmospheric pollution. Therefore, the effective analysis of small samples is important in improving the universality and applicability of models. Here, we aimed to achieve efficient and accurate air quality assessment with limited data availability. Consequently, we did not use the commonly applied neural network approach, primarily because it typically requires large datasets for effective training, and may not achieve optimal performance for small samples. By integrating evidence theory and the KNN approach, our method can handle limited data. Compared to other methods, this approach is more adaptable and precise, extracting meaningful insights from small datasets.
By integrating evidence theory and the KNN algorithm, this model applies an interdisciplinary strategy. It represents a paradigm shift in atmospheric pollution data processing, with applicability in other environmental monitoring domains.
Compared to the traditional AQI approach, our model yields more comprehensive and precise assessments, by integrating multiple data sources and considering the characteristics of multiple pollutants. It thus comprehensively characterizes air pollution-related dynamics, especially for regions with limited data. This approach lays a robust foundation for effective policy development.
This hybrid method, integrating interval similarity and subjective–objective weighting, accurately accounts for the inherent variability in pollutant concentrations and toxicological characteristics. By emphasizing data integrity and credibility, this approach will facilitate accurate and reliable assessments.
Expanding our data to include Xi’an, Beijing, and Tianjin, which have varied urban settings, substantially strengthened the robustness and applicability of our findings, demonstrating the model’s adaptability and effectiveness across different geographical landscapes. Such broad applicability reveals its potential for accurate and comprehensive air quality assessment for diverse urban contexts. This will enable it to become an essential tool for policymakers and environmental scientists.
Although this method achieved significant results using a small sample data, this dataset was limited in its scope and diversity, focusing on specific urban environments and particular pollutants. This may restrict the model’s applicability under a broader range of geographical and environmental conditions. The model does not currently adequately incorporate key external factors such as meteorological conditions, regional industrial activity, and traffic flow, which significantly impact air quality. While the model performs well with historical data, its ability to process real-time data and predict future trends remains to be validated. The current model’s complexity may limit its direct application by non-professional users such as policymakers and environmental management agencies.
Data from a wider range of geographical areas and more complex environmental and meteorological factors should be included to enhance the model’s generalizability and accuracy. New and optimized algorithms should be used to enhance computational efficiency and accuracy. To validate its cross-field applicability, the method should be applied in environmental monitoring fields such as water quality assessment or forest health monitoring. Long-term research is required to better understand how pollutants change over time and under varying conditions. Finally, research findings should be translate into concrete policy recommendations and practical guidelines to promote environmental protection and sustainable development.
Our data-fusion evaluation method, which considers spatiotemporal variation, facilitates integration of multi-pollutant measurement data, provides a more granular view of air quality, and improves the evaluation of pollution levels and potential health impacts. It thus provides a tool for air quality evaluation during environmental assessments and in formulating public health policies.
Despite this significant progress, there remains broad scope for future development, particularly in terms of expanding the dataset, diversifying the model’s applications, and optimizing the user interface. These improvements are anticipated to enhance the model's role in air quality assessment and in formulating environmental management policies.
The original contributions presented in the study are included in the article/Supplementary Material, further inquiries can be directed to the corresponding authors.
All authors contributed to the study conception and design. CB analyzed the data and wrote the Introduction. GH reviewed and edited the manuscript. All authors contributed to the article and approved the submitted version.
The author(s) declare financial support was received for the research, authorship, and/or publication of this article. This work was supported by the National Natural Science Foundation of China (71874134) and Shaanxi Natural Science Basic Research Plan - Key Project (2019JZ-30).
We thank Qingyue Data (data.epmap.org) for providing the environmental data.
The authors declare that the research was conducted in the absence of any commercial or financial relationships that could be construed as a potential conflict of interest.
All claims expressed in this article are solely those of the authors and do not necessarily represent those of their affiliated organizations, or those of the publisher, the editors and the reviewers. Any product that may be evaluated in this article, or claim that may be made by its manufacturer, is not guaranteed or endorsed by the publisher.
AQI, air quality index; BPA, basic probability assignment.
Ai, J., Niu, H., Chen, Z., Li, X., Zeng, Y., Zhuang, X., et al. (2022). D-S multi-information fusion GIL partial discharge joint recognition method based on neural network. High. Volt. Eng., 481–488. doi:10.13336/j.1003-6520.hve.20211249
Altman, N. S. (1992). An introduction to kernel and nearest-neighbor nonparametric regression. Am. Stat. 46, 175–185. doi:10.1080/00031305.1992.10475879
Carslaw, D. C., and Rhys-Tyler, G. (2013). New insights from comprehensive on-road measurements of NOx, NO2 and NH3 from vehicle emission remote sensing in London, UK. Atmos. Environ. 81, 339–347. doi:10.1016/j.atmosenv.2013.09.026
Chen, G., and Zhu, Y. (2014). An overview on the control of urban air pollution. Sci. Technol. Rev. 32, 15–22.
Chen, M., Qin, Q., Liu, F., Wang, Y., Wu, C., Yan, Y., et al. (2022). How long-term air pollution and its metal constituents affect type 2 diabetes mellitus prevalence? Results from Wuhan Chronic Disease Cohort. Environ. Res. 212, 113158. doi:10.1016/j.envres.2022.113158
Cover, T., and Hart, P. (1967). Nearest neighbor pattern classification. IEEE Trans. Inf. Theory. 13, 21–27. doi:10.1109/TIT.1967.1053964
Cui, J., Sang, M., Bo, X., Wang, P., Xue, X. D., Guo, J., et al. (2022). Rapid assessment of optimization schemes for atmospheric emission sources based on integer programming algorithm. Environ. Eng. 40 (04), 202–208. doi:10.13205/j.hjgc.202204029
Dai, P., Yuming, W., and Feng, Z. (2018). An improved KNN algorithm based on analytic hierarchy process. J. Liaoning Univ. Petrol. Chem. Technol. 38, 87.
Dempster, A. P. (2008). “Upper and lower probabilities induced by a multivalued mapping,” in Classic works of the dempster-shafer theory of belief functions. Editors R. Yager, and L. Liu (Berlin, Heidelberg: Springer), 57–72. doi:10.1007/978-3-540-44792-4_3
Dyer, R. F., and Forman, E. H. (1992). Group decision support with the analytic hierarchy process. Decis. Support Syst. 8, 99–124. doi:10.1016/0167-9236(92)90003-8
Eren, B., Aksangür, İ., and Erden, C. (2023). Predicting next hour fine particulate matter (PM2.5) in the Istanbul metropolitan city using deep learning algorithms with time windowing strategy. Urban Clim. 48, 101418. doi:10.1016/j.uclim.2023.101418
Feng, X., Wang, B., Gao, G., Gao, S., Xie, C., and Shi, J. W. (2023). MnyCo3−yOx bimetallic oxide prepared by ultrasonic technology for significantly improved catalytic performance in the reduction of NOx with NH3. Fuel 352, 129159. doi:10.1016/j.fuel.2023.129159
Graziani, N. S., Carreras, H., and Wannaz, E. (2019). Atmospheric levels of BPA associated with particulate matter in an urban environment. Heliyon 5, e01419. doi:10.1016/j.heliyon.2019.e01419
He, K., Wang, T., Zhang, F., and Jin, X. (2022). Anomaly detection and early warning via a novel multiblock-based method with applications to thermal power plants. Measurement 193, 110979. doi:10.1016/j.measurement.2022.110979
Huihui, X., and Yanming, D. (2013). Improved the KNN algorithm based on related to the distance of attribute value. Comput. Sci. 40, 157–159.
Karavas, Z., Karayannis, V., and Moustakas, K. (2021). Comparative study of air quality indices in the European Union towards adopting a common air quality index. Energy Environ. 32 (6, 959–980. doi:10.1177/0958305X20921800
Kong, L., Wang, L., Li, F., Li, J., Wang, Y., Cai, Z., et al. (2023). Life cycle-oriented low-carbon product design based on the constraint satisfaction problem. Energy Convers. Manag. 286, 117069. doi:10.1016/j.enconman.2023.117069
Kukkonen, J., Partanen, L., Karppinen, A., Ruuskanen, J., Junninen, H., Kolehmainen, , et al. (2003). Extensive evaluation of neural network models for the prediction of NO2 and PM10 concentrations, compared with a deterministic modelling system and measurements in central Helsinki. Atmos. Environ. 37, 4539–4550. doi:10.1016/S1352-2310(03)00583-1
Li, G. D., Yamaguchi, D., and Nagai, M. (2007). A grey-based decision-making approach to the supplier selection problem. Math. Comput. Modell. 46, 573–581. doi:10.1016/j.mcm.2006.11.021
Li, J., Zhang, G., Ned, J. P., and Sui, L. (2023). How does digital finance affect green technology innovation in the polluting industry? Based on the serial two-mediator model of financing constraints and research and development (R&D) investments. Environ. Sci. Pollut. Res. Int. 30 (29), 74141–74152. doi:10.1007/s11356-023-27593-y
Li, L., Wang, J., Franklin, M., Yin, Q., Wu, J., Camps-Valls, G., et al. (2023). Improving air quality assessment using physics-inspired deep graph learning. npj Clim. Atmos. Sci. 6, 152. doi:10.1038/s41612-023-00475-3
Li, S., Dragicevic, S., Castro, F. A., Sester, M., Winter, S., Coltekin, A., et al. (2016). Geospatial big data handling theory and methods: a review and research challenges. ISPRS J. Photogramm. 115, 119–133. doi:10.1016/j.isprsjprs.2015.10.012
Lü, C., Chen, S., Hua, X., and Xiang, W. (2021). Turbine through-flow fault diagnosis method and application based on the improved KNN algorithm. Therm. Power Gener. 50, 7. doi:10.19666/j.rlfd.202012289
Luo, J., Zhuo, W., Liu, S., and Xu, B. (2024). The optimization of carbon emission prediction in low carbon energy economy under big data. IEEE Access 12, 14690–14702. doi:10.1109/ACCESS.2024.3351468
Mo, H., Zhang, L., and Wang, H. (2020). A fuzzy comprehensive evaluation method for air quality assessment. Environ. Monit. Assess. 192, 243. doi:10.1007/s10661-020-8211-4
Murena, F. (2004). Measuring air quality over large urban areas: development and application of an air pollution index at the urban area of Naples. Atmos. Environ. 38, 6195–6202. doi:10.1016/j.atmosenv.2004.07.023
Pope, C. A., and Dockery, D. W. (2006). Health effects of fine particulate air pollution: lines that connect. J. Air Waste Manag. Assoc. 56, 709–742. doi:10.1080/10473289.2006.10464485
Pope, R. J., Coleman, P., and Patterson, K. G. (2022). The limitations of the air quality index: a critical review. Environ. Sci. Policy. 134, 55–65. doi:10.1007/978-981-10-5792-2_8
Priti, K., and Kumar, P. (2022). A critical evaluation of air quality index models (1960–2021). Environ. Monit. Assess. 194 (4), 324. doi:10.1007/s10661-022-09896-8
Qin, B., and Xiao, F. (2019). An improved method to determine basic probability assignment with interval number and its application in classification. Int. J. Distrib. Sens. Netw. 15, 155014771882052. doi:10.1177/1550147718820524
Ren, C., Niu, H. X., Chen, G. W., Si, Y. B., and She, Y. M. (2022). Heterogeneous data fusion of high-speed railway signal system based on DS evidence theory. Transducer Microsyst. Technol. 41, 54–57. doi:10.13873/J.1000-9787(2022)03-0054-04
Saaty, T. L. (2008). Decision making with the analytic hierarchy process. Int. J. Serv. Sci. 1, 83–98. doi:10.1504/IJSSCI.2008.017590
Seinfeld, J. H., and Pandis, S. N. (2016). Atmospheric chemistry and physics: from air pollution to climate change. Hoboken, NJ, USA: John Wiley & Sons.
Shafer, G. (1976). A mathematical theory of evidence. Princeton, NJ, USA: Princeton University Press.
Shang, K., Xu, L., Liu, X., Yin, Z., Liu, Z., Li, X., et al. (2023). Study of urban heat island effect in Hangzhou metropolitan area based on SW-TES algorithm and image dichotomous model. SAGE Open 13 (4). 21582440231208851 doi:10.1177/21582440231208851
Shang, M., and Luo, J. (2021). The Tapio decoupling principle and key strategies for changing factors of Chinese urban carbon footprint based on cloud computing. Int. J. Environ. Res. Public Health 18 (4), 2101. doi:10.3390/ijerph18042101
Shukla, K., Dadheech, N., Kumar, P., and Khare, M. (2021). Regression-based flexible models for photochemical air pollutants in the National Capital Territory of megacity Delhi. Chemosphere 272, 129611. doi:10.1016/j.chemosphere.2021.129611
Sowlat, M. H., Gharibi, H., Yunesian, M., Tayefeh Mahmoudi, M. T., and Lotfi, S. (2011). A novel, fuzzy-based air quality index (FAQI) for air quality assessment. Atmos. Environ. 45, 2050–2059. doi:10.1016/j.atmosenv.2011.01.060
Sun, Q., Zhang, T., Wang, X., and Chen, Z. (2022). Air quality evaluation method based on progressive DS evidence theory. J. Beijing For. Univ. 44, 119–128.
Sun, Q., Zhang, T., Wang, X., Lin, W., Fong, S., Chen, Z., et al. (2022). An ambient air quality evaluation model based on improved evidence theory. Sci. Rep. 12, 5753. doi:10.1038/s41598-022-09344-0
Tan, Q., Zhuang, H., Tie, Z. X., Ding, C. F., and Wu, Q. (2017). An air quality evaluation model for the industrial park based on the fuzzy matter-element analysis. J. Saf. Environ. 17, 2019–2023. doi:10.13637/j.issn.1009-6094.2017.05.076
Tobler, W. R. (1970). A computer movie simulating urban growth in the Detroit region. Econ. Geogr. 46, 234–240. doi:10.2307/143141
Utku, A., Can, Ü., Kamal, M., Das, N., Cifuentes-Faura, J., and Barut, A. (2023). A long short-term memory-based hybrid model optimized using a genetic algorithm for particulate matter 2.5 prediction. Atmos. Pollut. Res. 14, 101836. doi:10.1016/j.apr.2023.101836
Vaidya, O. S., and Kumar, S. (2006). Analytic hierarchy process: an overview of applications. Eur. J. Oper. Res. 169, 1–29. doi:10.1016/j.ejor.2004.04.028
Wang, J., Luo, Q., and Hu, Y. (2021). Locomotive bearing fault diagnosis method based on KNN-EMD algorithm. Comput. Simul. 38, 129–132.
Wang, W., and Klir, G. J. (2009). Generalized measure theory. New York, NY, USA: Springer Science and Business Media.
Wang, X., Wang, T., Xu, J., Shen, Z., Yang, Y., Chen, A., et al. (2022). Enhanced habitat loss of the Himalayan endemic flora driven by warming-forced upslope tree expansion. Nat. Ecol. Evol. 6 (7), 890–899. doi:10.1038/s41559-022-01774-3
Wang, Y., and Jiang, Y. (2017). Air quality evaluation based on improved CRITIC weighting and fuzzy optimization. Stat. Decis. 17, 83–87. doi:10.13546/j.cnki.tjyjc.2017.17.019
Wu, B., Gu, Q., Liu, Z., and Liu, J. (2023). Clustered institutional investors, shared ESG preferences and low-carbon innovation in family firm. Technol. Forecast. Soc. Change 194, 122676. doi:10.1016/j.techfore.2023.122676
Wu, D., and Mendel, J. M. (2009). A comparative study of ranking methods, similarity measures and uncertainty measures for interval type-2 fuzzy sets. Inf. Sci. 179, 1169–1192. doi:10.1016/j.ins.2008.12.010
Xiao, H., and Duan, Y. (2013). An improved study on the KNN algorithm based on the attribute value-related distance. Comput. Sci. 40, 4.
Xiong, L., Bai, X., Zhao, C., Li, Y., Tan, Q., Luo, G., et al. (2022). High-resolution data sets for global carbonate and silicate rock weathering carbon sinks and their change trends. Earth’s Future 10 (8). e2022EF002746 doi:10.1029/2022EF002746
Yang, Y., Xiang, C. C., and Wei, D. J. (2010). Data cluster based on extension K nearest neighbor algorithm. Comput. Eng. Appl. 46, 156–159.
Zhang, S., Bai, X., Zhao, C., Tan, Q., Luo, G., Wang, J., et al. (2021). Global CO2 consumption by silicate rock chemical weathering: its past and future. Earth’s Future 9 (5), e1938E–e2020E. doi:10.1029/2020EF001938
Zhang, Y. L., and Cao, F. (2015). Fine particulate matter (PM2.5) in China at a city level. Sci. Rep. 5, 14884. doi:10.1038/srep14884
Keywords: evidence theory, K-nearest neighbor, air pollution concentration fusion, fuzzy evaluation method, basic probability assignment
Citation: Chao B and Guang Qiu H (2024) Air pollution concentration fuzzy evaluation based on evidence theory and the K-nearest neighbor algorithm. Front. Environ. Sci. 12:1243962. doi: 10.3389/fenvs.2024.1243962
Received: 21 June 2023; Accepted: 14 February 2024;
Published: 02 April 2024.
Edited by:
Sayali Sandbhor, Symbiosis International University, IndiaReviewed by:
Komal Shukla, Environment and Climate Change Canada (ECCC), CanadaCopyright © 2024 Chao and Guang Qiu. This is an open-access article distributed under the terms of the Creative Commons Attribution License (CC BY). The use, distribution or reproduction in other forums is permitted, provided the original author(s) and the copyright owner(s) are credited and that the original publication in this journal is cited, in accordance with accepted academic practice. No use, distribution or reproduction is permitted which does not comply with these terms.
*Correspondence: Bian Chao, MTU1MjYzODdAcXEuY29t
Disclaimer: All claims expressed in this article are solely those of the authors and do not necessarily represent those of their affiliated organizations, or those of the publisher, the editors and the reviewers. Any product that may be evaluated in this article or claim that may be made by its manufacturer is not guaranteed or endorsed by the publisher.
Research integrity at Frontiers
Learn more about the work of our research integrity team to safeguard the quality of each article we publish.