 Mefekir Woldegebriel Tessema
 Birhanu Girma Abebe1
94% of researchers rate our articles as excellent or good
Learn more about the work of our research integrity team to safeguard the quality of each article we publish.
Find out more
ORIGINAL RESEARCH article
Front. Environ. Sci. , 08 March 2024
Sec. Social-Ecological Urban Systems
Volume 12 - 2024 | https://doi.org/10.3389/fenvs.2024.1203529
Background and objectives: Hawassa served as the country’s southern region’s capital from 1990 to 2019 and is currently experiencing rapid urbanization. Urban planners use the physical and socioeconomic driving elements of Land Use Land Cover Change (LULCC) to identify the variables influencing the trend of urbanization and then make appropriate plans.
Methods: The study primarily employed advanced technologies like Geographic Information Systems and Remote Sensing to collect and analyze accurate and reliable information. The data were collected through questionnaires, interviews, and key interviews. Finally, the data were analyzed in different ways, using figures and tables, for example. Descriptive and econometric models were also used to analyze the data and probit regression models were used to investigate the impact of urban expansion on the livelihood of displaced farmers in the surrounding area.
Findings: Multivariate analysis of variance indicated that the effect of urban expansion on the combined dependent variables, namely, on land use, socioeconomic activities, culture, and environmental change, is statistically significant F(8, 616) =12.704, p = 0.000, Wilk’s Lambda (λ) = .737, partial eta squared(partial η2) = 0.142, observed power = 1.000. Comparatively, the area covered by farmland, built-up areas, and bushland increased from 19.46% to 26.51%, 11.97% to 18.71%, and 3.07% to 4.51%, respectively. The mean score for the level of social relationship and values after land expropriation was 1.7 moderate, with a standard deviation of 0.852 in comparison with the mean score for the level of social relationship and values before land expropriation, which was 3.21 high, with a standard deviation of 0.79. This shows that the land expropriation program negatively affected farmers’ social relationships and values; their social relations levels were high before displacement and between low and moderate after displacement.
Conclusion: Policy and strategy gaps in the urban expansion program and this policy issue have hindered the growth of the city and resulted in a serious issue regarding good governance in the area.
The term urbanization refers to growth in the proportion of a population living in urban areas and the further physical expansion of already existing urban centers (Koroso et al., 2021). The process of urban expansion is a worldwide phenomenon recorded in the history of all urban centers, and it started with the earliest human civilization, the Babylonians (Zewdu, 2021). Globally, big changes were observed in the last century. One of which was a significant increase in the urban population compared to the population in rural areas. In 1950, only 30% of the world’s population lived in urban areas, but in 2014, approximately 54% of the world’s population resided in urban areas. This means that more than half of the world’s population now lives in urban areas. By 2050, approximately 66% of the world’s population is projected to be urban (Karutz et al., 2023).
Land is a naturally created physical asset. It is also a place where people may freely engage in a variety of commercial activities on a global scale (Gebreamanuel et al., 2018). Acquiring urban land is a critical and sensitive issue for human beings in different ways. The land is indeed the basis on which developing societies sustain themselves and improve their standards. In addition to purifying and preserving water, it also serves to regulate the Earth’s temperature by absorbing heat from the Sun. These functions include biodiversity preservation, carbon storage, and water purification and preservation (Mikias, 2015). Land use/land cover change (LULCC) refers to the two interrelated ways of observing the Earth’s surface. The former represents how the human population manipulates the biophysical attributes of the land and the purpose for which land is used. Land Use/Land Cover (LULC) is perhaps the most prominent form of global environmental change, and it occurs on spatial and temporal scales (Barrett et al., 2002).
According to Banja and Chimdesa (2023), the impacts of horizontal urban expansion include not only the loss of agricultural land but also the displacement of farmers, forcing them to find a new livelihood. To this effect, 10 million people are displaced globally per year because of developmental activities. Among those displaced, 6 million are attributed to urban expansion (Zewdu, 2021). It has been described that urban expansion can result in the loss of agricultural land, natural beauties, range lands, parks, and sceneries. More specifically, Abebe (2020) stated that the major effects contributing to rapid urban expansion in Ethiopia are higher natural population growth, rural-to-urban migration, and spatial urban development. Similarly, Asghar Pilehvar (2021) expressed that urbanization and urban growth are considered a modern way of life, leading to economic growth and development. However, as explained by Dfid (1999), urbanization and urban development in Ethiopia have faced several socioeconomic problems.
As stated by Alemu and Tolossa (2022), compensation paid to the displaced people and those evicted from farmland ownership is usually inadequate and the process of determining and implementing compensation is illogical and lacking clarity, creating widespread social and political tensions and, more importantly, exposing rural migrants to the risk of increasing social vulnerability, unemployment, and food insecurity.
A livelihood study adopting the livelihoods developed by Dfid (1999) as its framework offers an opportunity to gain a comprehensive view of different components of peri-urban livelihoods and the interaction and interdependence of these components in the most simplified form possible. It helps to provide a clear view of the complexities of different livelihood components and makes clear the many factors that affect the livelihoods of the peri-urban community reclassified due to urban expansion. The impact of urbanization on the peri-urban environment and livelihoods can be seen in two ways: positive and negative. According to Alaci (2010), well-planned and managed urban growth and development can serve as a positive development factor. The benefits could be seen in terms of high demand for agricultural produce, access to developed extension services, and opportunities for nonfarm employment (Satterthwaite and Tacoli, 2003). However, unguided urbanization, like in most developing countries, negatively affects the natural environment and livelihoods in peri-urban areas (United Nations Human Settlements Programme, 2010). Given its high correlation with economic development, particularly in developed countries (Henderson, 2003), urbanization is still prescribed to the least urbanized countries, such as Ethiopia (Woldehanna, 2008). In addition to multiple other factors, government policies are considered key development interventions in promoting urbanization. In this regard, the impact of urbanization on the peri-urban environment and livelihoods can be evaluated as any development intervention effect. Impact evaluation is the systematic identification of these positive or negative effects on households and the environment, intended or not, caused by a given development activity (World Bank, 2003).
Rural landscapes around the world are undergoing dramatic changes, manifesting in agricultural decline and land abandonment, especially in mountainous regions (MacDonald et al., 2000; Soliva et al., 2008). Agricultural land abandonment (ALA) is a term commonly used to describe uncultivated land (land used for agricultural purposes until recently that is no longer cultivated, with a noticeable shrub cover), abandoned land (land that is not subject to grazing or farming practices, including conservation agriculture), and neglected land, posing a threat to neighboring owners (Leal Filho et al., 2017). According to the Joint Research Centre, ALA is defined as a significant reduction in land management, leading to undesirable changes in ecosystem services (Keenleyside et al., 2010). Another related term is farmland abandonment, which can be defined as the cessation of agricultural activities on a given surface of land rather than by other activities such as urbanization or afforestation (Pointereau et al., 2008).
Farmers’ perceptions of land use change and ALA have been discussed in a few studies (Hostert, 2011). According to Pröbstl-Haider et al. (2016), they evaluated the influence of climate change on landscape change and farmers’ choices for future agricultural land use in Austria. LUC was observed in the area as farmers increased forestation to mitigate the effects of climate change (Paulrud et al., 2010; Kuntz et al., 2018). Farmers’ perceptions of ALA in rural New York were investigated and it was determined that land abandonment affected the neglected rural residents and undermined their livelihoods, Kuntz et al. (2018). In Pakistan, for example, Qasim et al., 2016 studied farmers’ views on the causes, indicators, and local strategies for dealing with desertification in the Pishin basin in Baluchistan. The perceptions of locals and tourists regarding the spontaneous reforestation of abandoned farmland have been assessed and it was found that land abandonment caused the loss of traditional and farmland emotional value (Hunziker, 1995).
It is also important to understand the factors involved in land-use conversion, as these factors predict the extent of land-use change, conservation plans, and agricultural policies. It has been determined that farmers act as moderators of the land-use conversion phenomenon, so the actual land-use conversion may be different than expected, although the agricultural LUC factors are well recognized (van Vliet et al., 2016). In another study, Benjamin et al. (2007) inferred that long-term owners, in particular, had abandoned their least popular and least valuable land. The problems of ALA and LUC have been studied throughout the world at length (Hunziker, 1995; Benjamin et al., 2007; Peneze et al., 2009).
The LULC pattern of a region is an outcome of natural and socioeconomic factors and their utilization by man in time and space. Hence, information LULC is essential for the selection, planning, and implementation of land use and can be used by the population (Zubair, 2006). Both natural and human activities are responsible for LULCC (Burka, 2008). Human activities are responsible for the conversion and transformation of many of the world’s natural land covers (Hamza and Iyela, 2012). Since 1850, around 6 million sq. km and 4.7 million sq. km of forest/woodland and grassland areas have been converted to agricultural land worldwide to meet the demand for food and fiber (Lambin et al., 2003; Hamza and Iyela, 2012).
Urban expansion is a common phenomenon in both developed and developing countries. However, in developing countries, urban expansions are known to have negative effects. The process of urban expansion may involve both horizontal and vertical expansion of the physical structure of urban areas (Talema and Nigusie, 2023). Wang et al. (2012) state that urban growth, as a dynamic process of land use change, is a complex social/economic phenomenon. It may be associated with details such as geography, transportation, land use, social structure, and economic type, but it is mostly associated with a city’s population and economics.
However, many of these scholars gave little attention to the drivers of physical and socioeconomic driving forces of LULCC. On the other hand, scholars who attempted to conduct studies on LULCC focused only on quantifying trends of LULCC using remote sensing images and neglected to compare the observed LULCC with the perception of different stakeholders (Mohamed and Worku, 2019). Even though these studies were conducted in Ethiopia, they deal with quantifying LULCC using remote sensing tools, which give quantitative descriptions but fail to overcome the drivers and socioeconomic impacts of LULCC. Thus, the aim of this study is to assess the LULCC and its driving forces in Hawassa City. Therefore, this research can be expected to have an important role in filling the knowledge gap, which cannot be done by another researcher, about the factors and impacts of the socioeconomic driving forces of LULCC on this area and motivate future researchers. Furthermore, this research also intends to provide insights for urban planners regarding planning sustainable urban development that does not threaten marginal groups of people located on the periphery.
Several procedures have been developed and applied for monitoring the LULCC using remotely sensed data, for instance, image differentiating pixel and object-based classification in land cover change mapping (Dingle Robertson and King, 2011). Image fusion-based land cover change detection (Wang et al., 2012). In this study, our main objectives were to address the processes of land-use dynamics in Hawassa City and its integrated driving forces by combining satellite-based efforts at mapping LULC, based on information from satellites acquired in 1990, 2000, 2010, and 2020. Finally, we provide some possible management techniques that are critical for the future sustainable management and exploitation of its current urban land. These strategies include controlling urban growth, preventing farmer eviction from peri-urban areas, and assessing the agricultural and non-agricultural activities of the hinterland and land use patterns to evaluate their impact on the development of the city under study.
The city of Hawassa is situated in the southern region of Addis Ababa, Ethiopia. Geographically, the city stretches 275 km along the Addis Ababa-Moyal international highway and is embedded between Tikur-wuha River on the North, Alammura Mountain on the South, Chelelaka-Marshy on the East, and Lake Hawassa on the West (Weldesilassie et al., 2017). The city of Hawassa has an average elevation of approximately 1,690 m above sea level and extends on a partially flat plain in the rift valley (Hawassa City Municipality, 2020).
Hawassa borderland geographical coordinates extend approximately between latitude: 7°03′43.38″North and longitude: 38° 28′ 34.86″ East, covering a total area of 8,282.6 sq. km. The borderland contains eight Woredas within the Regional State of Oromia, namely, Shashemene, Arsi Negele, Kofele, and Siraro, and Southern Nations Nationalities and People’s Regional (SNNPR) Hawassa Zuria, Shebedino, Dale, and Boricha (Hawassa City Municipality, 2020).
In the context of Hawassa City, there have been no studies carried out on the physical and socioeconomic driving forces of land use and land cover change area investigating three decades of LULCC (1990–2020). The investigation of changes that occurred on Earth using images of the same scene at different times over the three decades was used to calculate the area of different land covers and observe the changes taking place over time. This analysis is very helpful in identifying various changes occurring in different classes of land use, like changes in urban built-up areas or changes in cultivated land and so on. Moreover, the pattern of geographical features varies from place to place and from time to time.
The main reason for the consideration of regional and peri-urban study in the development plan of the city and the linkage between rural-urban and urban-urban, which plays a vital role in attaining sustainable economic and social development and it requires a proper spatial, functional, technological, and organizational integration of the two spatial components of a region. Their relationship is normally symbiotic; the city serves as the center of provision of public and social services and processed and semi-processed industrial products and is used as an area with better employment opportunities. Rural areas, however, are sources of agricultural products for both food and input for industries, natural resources, and sources of labor forces (Figure 1).
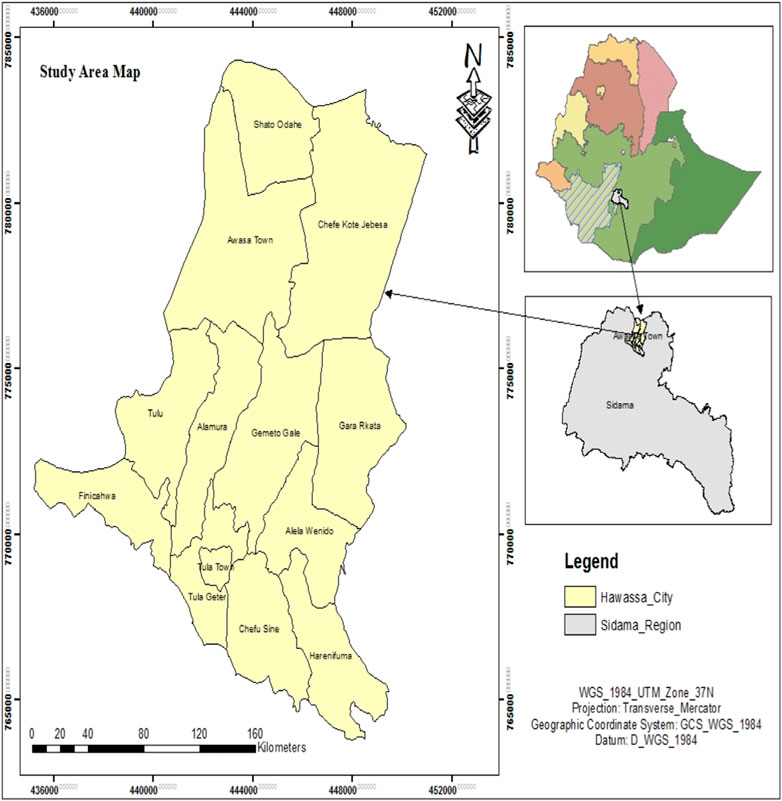
FIGURE 1. Location map of study area. Source: US Geological Survey (USGS) http://glovis.usgs.gov.
The qualitative method provides details of the data and a view of alternative explanations; using this approach, the data collection and analysis would be carried out on the condition of social reality, allowing for in-depth research. A quantitative approach was used because it is specific, well-structured, and can be defined explicitly (Hoepfl, 1997). A mixed approach was used by the researcher to present the primary and secondary data, which was relevant to the study and used to meet the stated specific goals.
In this study, primary and secondary sources were used to gather both quantitative and qualitative data. The primary sources were sample household heads from displaced farmers, key informants such as government officials of the city administration, and municipality officials. In addition, focus group discussion took place to verify data collected by questionnaire.
A structured questionnaire was given or provided to the respondents so they could answer the questions and provide information that was essential to the study. The responders were presented with an optional question from which they can choose, which facilitated a large sample size of people, increasing the important information they provided for the study.
All the satellite imagery acquired represents the season and Landsat 5 TM Landsat 8 and OLI sensing element information was taken into account. The LULC mapping for the realm was supported by Landsat 5 Thematic mapper (TM) images of December 1990, January 2000, and November 2010; Landsat 8 Operational Land Imager (OLI); and short wave Infrared (SWIR) 2020. Satellite information for 30 years, on the other hand, consisted of multi-spectral information acquired by the Landsat satellite for the desired years (Campbell and Wynne, 2011).
A field study was conducted to observe the Physical and socioeconomic driving forces of LULCC and the impacts of fast urban growth on urban livelihoods. Consequently, the researcher performed observations in the study region using checklists to support the data that was acquired by other means. Observations were made in the houses, peri-urban area farms, and surrounding habitats of the respondents.
A focus group discussion is a qualitative research technique consisting of a structured discussion and is used to obtain in-depth qualitative data from a group of people about a particular topic.
The study area was selected purposely due to the confidence of the researcher who had more information to collect data and information from different sources for the severity of the problem. In the city, there are eight sub-city administrations and 32 kebeles, of which, five kebeles were purposively selected from peri-urban areas, such as Alammura, Dato, Tulla-rural, Guwe-stadium, and Millennium-adeboye. Out of a total of 11,711 households, in those five kebeles, 317 sample households were selected using a sample size calculation developed by Kothari (2004). Data were collected using a simple random sampling technique and each was interviewed for the purpose. A semi-structured questionnaire was designed and pre-tested for its capacity to collect the data.
The researcher used a 95% level of confidence, the corresponding standard normal. In the study area, the population is characterized by similar economic activities, income levels, educational levels, and infrastructures, and a homogeneous population sample size depends on the type of research design to be used, the desired level of confidence, the level of accuracy, and the characteristics of the study population.
The study applied the formula provided by Kothari (2004); which is generally given as follows (mathematical Eq. 1):
Where: n = stands for estimated sample size.
e = the acceptable error (0.05).
N = size of population under study (11,711).
p = sample proportion of successes (0.5).
q = 1 – p = 0.5.
Z = standard confidence level (1.96) (95% confidence level).
As we have not been given the p-value as a proportion of defectives in the universe, let us assume it to be p = 0.5. If there is no prior information about P available to obtain a conservative estimate of the required sample size, we use p = q = 0.5. The researcher used a 95% confidence level and the corresponding standard normal. z = 1.96 and the desired level of significance was e = 0.05. Thus, p = 0.5 and q = 1-p = 1–0.5 = 0.5. We assumed a confidence level of 95%, N = 2,452, e = 0.05, z = 1.96; p = 0.5, and q = 1–0.5 = 0.5.
We obtained the following formula:
As stated above, the study involved 332 households, which were selected proportionally from each of the kebeles. Therefore, the sample was arrived at by first selecting a random starting point and then picking up every “K” in the population among households of the independent kebeles of the sampling frame. As shown in Table 1, out of the 332 intended questionnaire respondents, to whom questionnaires were distributed, 317 (95.5%) filled out the questionnaires properly and returned them.
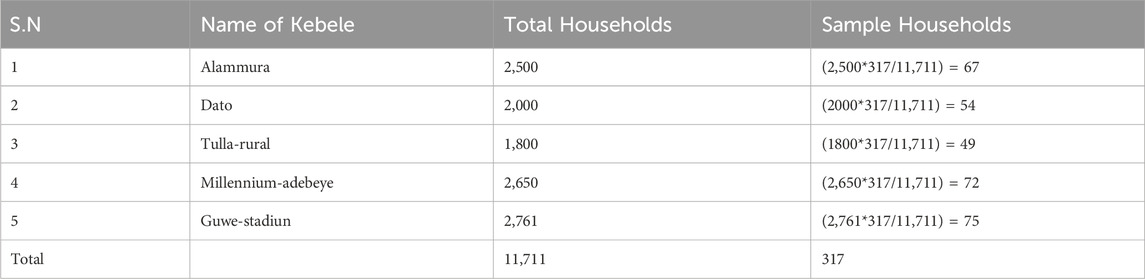
TABLE 1. Distribution of sample households among the selected kebeles.
Data processing, which includes editing, coding, data input, cleaning, and consistency checking, is a significant component of the research process. The study researcher was responsible for carrying out all tasks. LULC driving forces are reported using descriptive statistics such as mean, frequency, percentages, and the Landsat 5, 7, and 8 images that were acquired from USGS. In order to determine the main socioeconomic driving forces, LULCC, and the effectiveness of urban growth continuous variables, the statistical significance of the dummy/discrete variables was also examined using the Chi-square test.
Discrete regression models are models in which the dependent variable assumes discrete values. The simplest of these models is that in which the dependent variable Y is binary (it can assume only two values denoted by 0 and 1), as described by Amemiya (1981), Gujarati (2002), and Maddala (1998). According to these authors, the three most commonly used approaches to estimating such models are the linear probability models (LPM), the logit model, and the probit models. The linear probability model is the model that expresses the dichotomous dependent variable (Y) as a linear function of the explanatory variable (X). Because of its computational simplicity, LPM has been used in econometric applications, especially during and before the 1960s. However, as indicated by Amemiya (1981), Maddala (1998), and Gujarati (2002), the linear probability model has an obvious defect in that the estimated probability values can lie outside the normal 0–1 range. The fundamental problem with the LPM was that it is not logically a very attractive model because it assumes that the marginal or incremental effect of explanatory variables remains constant, that is Pi = E (Y = 1/X) increases linearly with X (Maddala, 1998; Gujarati, 2002). The defects of the linear probability model suggest that there was a need for an appropriate model in which the relationship between the probability that an event would occur and the explanatory variables was non-linear (Amemiya, 1981; Madalla, 1998; Gujarati, 2002). These same authors suggested that the sigmoid or S-shaped curve, which very much resembles the cumulative distribution functions (CDF) of random variables, be used to model regressions where the response variable is dichotomous, taking 0–1 values. To explain the behavior of dichotomous dependent variables, we would have to use a suitably chosen cumulative distribution function (CDF).
The dependent variable is the household livelihoods of surrounding displaced farmers due to urban expansion and the independent variables are age, gender, family size, farm size, education, income, TLU, occupation, compensation paid, land use dynamics, socioeconomic activities, culture, environmental change, and social status regarding the expropriation. Since the dependent variable of this objective is the household livelihood of surrounding displaced farmers due to urban expansion, which is dichotomous and takes the value of 0 if relating to a household before displacement due to urban expansion and 1 relating to after displacement, a binary probit model would be used (Gujarati, 2002).
The logit model (Gujarati, 2002) is used to analyze the impact of various socioeconomic factors on peri-urban farmers’ urban expansion. Of the 317 total respondents, the binary response variable is the probability that peri-urban development results in farmer displacement with a value of 1 (yes) or that there is no urban expansion before farmer displacement, with a value of 0 (No). This function is generally given as follows (mathematical Eq. 2):
The cumulative logistic distribution function is as follows:
Where Li is the logit, which is the natural log of the odds ratio,
Pi is the probability that a farmer will sell their land for non-agricultural use; 1 − Pi is the probability of farmer displacement with a value of 1 (Yes) or no urban expansion before farmer displacement, with a value of 0 (No). In general, the model can be βi is the ith parameter of the model to be estimated,
The specific model form for the econometric analysis is given by
Where
Y = dependent variable.
X1 …Xn = independent variables.
βo = Intercept.
ei = error term.
Because our data is at the individual level, we used the maximum likelihood (ML) method to estimate the parameters (mathematical Eq. (4)) (Aldrich et al., 1984; DeMaris, 1992). The independent variables used in the model include gender, age, family size, farmland size, education, compensation paid, total livestock unit, and occupation. These variables are discrete or binary and are defined in Table 2.
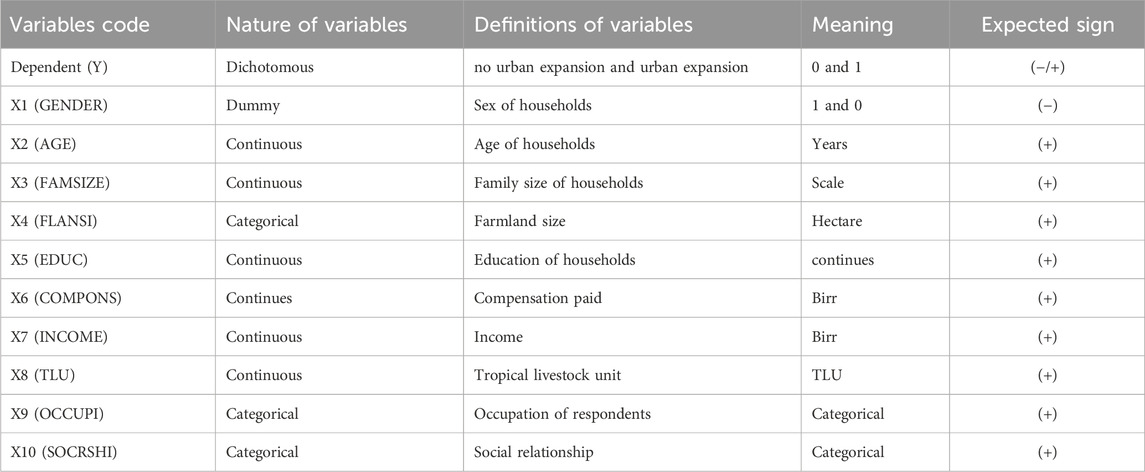
TABLE 2. List of factors (variables) included in the logistic regression model.
According to the literature, peri-urban areas are defined by PLUREL as “discontinuous built development containing settlements of less than 20,000 with an average density of 40 persons per sq. km” (Ravetz et al., 2012; Friedberger, 2000). In his paper on the “rural-urban fringe in the late 20th century America” defined the rural-urban fringe urban area as land extending from 10 to 15 miles outside the city center of the nation’s major city. Even though it is difficult to exactly know the extent of the urban zone, Simon et al. (2012) and colleagues indicated that 30–50 km beyond the urban edge is a reasonable generalization for larger cities.
The independent variables are the household characteristics including a vector of variables that control for the differences among individual households and observable attributes. Specific variables include the gender, age, marital status, education level, and family size of those in the household; sources of household income; and household income level. The dependent variable in this model of urban expansion is used in the logistic regression analysis. Where Y = 1, urban development results in farmer displacement, and where Y = 0, there is no urban expansion before farmer displacement (Osman et al., 2016).
The required field data about the existing LULC types, historical trends in dominant Land Use/Land Cover Change (LULCC), and possible drivers of LULCC in the study area were collected using time series Landsat images that were downloaded for different Landsat groups. Based on this Landsat 5 TM (for the period 1990), Landsat 7 ETM (for the period of 2000), Landsat 5 TM (for the period of 2010), and Landsat 8 OLI (for the period of 2020) were used. Landsat 5 to 8 were chosen and used based on the availability. To reduce the effect of cloud cover and seasonal variation on the classification result, the researcher tried to consider Land sat images of the same season (December to February). The 4 months from November to February are the dry season in Hawassa City and have relatively cloud-free skies. Therefore, images acquired during this season have relatively low cloud cover. Landsat image data were preferred in LULCC analysis over other multispectral data, for example, spot images (Campbell and Wynne, 2011). This is because of its free availability and inclusion of middle infrared bands, the legal sharing of data among government departments and donor agencies, and the longest record of global scale data for earth observation (see Table 3).
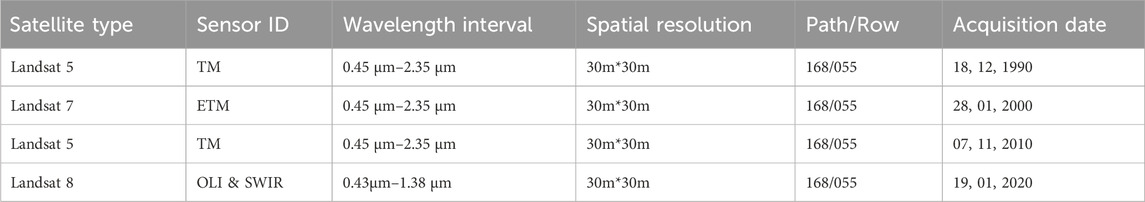
TABLE 3. Description of satellite data.
The satellite image data covers a very large area but the study area is small. The spatial resolutions of images were enhanced using a resolution merge technique that integrates images of different spatial resolutions or pixels. Generally, the image was processed to minimize the error during analysis due to atmosphere, sensor, cloud, bad lines, or other related errors. The preprocessing techniques employed include radiometric correction, geometric correction image enhancement, and that of a sub-setting area of interest before further analysis takes place. Therefore, the image was preprocessed to show a clear and easily interpretable image. Creating subsets that are areas of interest (AOI) is one of the preprocessing steps. The Area of Interest was delineated/a subset from the images of the whole period for the respective years and scenes. Finally, the satellite image that was delineated or masked using the boundary of Hawassa City was ready for further analysis.
The classification describes spectral attributes for each feature in the area of interest. The spectral qualities of pixels in the dataset are numerically compared to each category and labeled with the name of the land cover. Image classification was undertaken to extract thematic information from the images. This technique is reliant on the three thematic maps of different dates to detect changes; with assistance from the reference data and the personal knowledge about the study area. The reference data include the Global Positioning System (GPS) for currently existing LULC, Google Earth images, and aerial photos for other periods.
The LULC detection was based on quantitative analysis and the analysis of the driving forces of the change was conducted using qualitative analysis. Therefore, to see any changes that took place within these selected periods, the study year was selected based on factors such as what the LULC pattern looked like in 1990 and 2020 and what is happening in the study area nowadays. QGIS version 3.2 and ArcGIS 10.3 were used to perform image preprocessing and analysis which include the following processes: pre-processing, image classification, accuracy assessment, and production of a change map.
The images of different years were classified using the supervised classification method to identify LULC types within Hawassa City. The supervised classification with a maximum likelihood classifier was used for image classification and the preparation of base maps for change detection (Chipman et al., 2004). Supervised classification was chosen because it classifies land uses based on training sites that are assigned by Classifier. This is done for all of the images according to their arrangement with the help of reference data to have accurate classification.
Successful use of remote sensing for LULCC detection largely depends on an adequate understanding of the study area, the satellite imaging system, and the various information extraction methods for change detection to achieve the aim of the present study (Yang and Lo, 2002). In change detection analysis, remotely sensed data were used to monitor LULCC (Singh, 1989). After the image classification, the post-classification change detection was performed and evaluated with “from–to” change information (Macleod and Congalton, 1998).
Finally, the table matrix was generated, which holds overall information about the change matrix in the study periods from 1990 to 2020. Total area (TA), changed area (CA), change extent (CE), and annual rate of change (CR) variables were used to determine the magnitudes of change in terms of LULC. The variables were calculated as follows (Addis, 2010; Abate and Angassa, 2016).
The Maximum likelihood used to categorize the Landsat 5 TM 1990, 2000, and 2010; Landsat 8 OLI; and SWIR 2020 produced a map showing the distributions of seven prevalent LULC classifications. The ArcGIS software and spatial analyst tools demarcated the boundary of the study area. The linear relationships among the variables were described. The detailed methodology adopted is given in Figure 2.
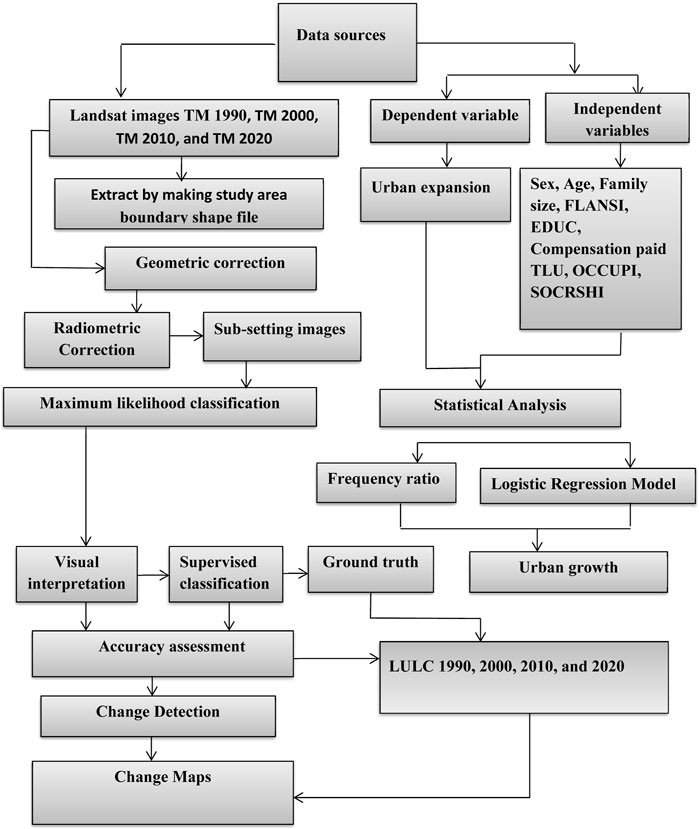
FIGURE 2. Flow chart showing methods of land use/land cover change detection.
This section presents the main findings of the study concerning the impact of urban expansion on the livelihoods of surrounding farmers. The results presented in this chapter seek to achieve the objective of the study, which is to identify the socioeconomic impact of urban expansion on the surrounding peri-urban farmers in the study area to compare and contrast the pre and post-displacement livelihood pattern of the peri-urban households and to identify the coping mechanism that the displaced community developed to secure new means of livelihood.
To determine the positive and negative consequences, as well as potential causes, of these expansions, peri-urban farmers were questioned about how urban growth has affected their family’s quality of life and that of the neighborhood. A three-level Likert scale (Low (0), Moderate (1), and High (2)) was used to obtain the descriptive statistics of mean and standard deviation values. A mean value of 0–1.5 is low, 1.5–2.5 is average, and above 2.5 is considered high.
The results in Table 4 show that the majority of respondents, 171 (55.7%), described the city expansion rate as high and a significant number, 143 (45.1%), expressed it as a moderate rate. However, only 3 (1.1%) respondents expressed the expansion rate as low. The mean score for this item was 2.55, with a standard deviation of 0.522. This implies that there is strong agreement among respondents about the rapid expansion of Hawassa City to the surrounding rural Kebele Administration.
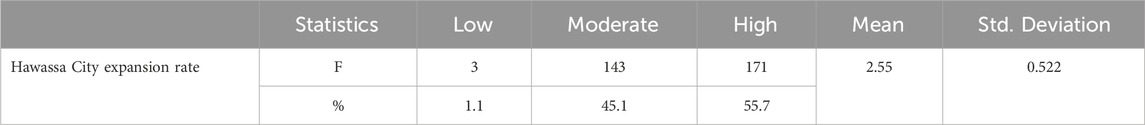
TABLE 4. Hawassa City expansion rate.
The Hawassa City urban expansion is not properly managed by the concerned people and the urban land is taken from the peripheral people, but the rule and the regulation of how to take the urban land must need respect ion and proper implementations of the urban land, and there is a need for a proper compensation system for those losing their land. Urban land is not properly utilized. For this situation, assigning sufficient budget and professional human resources is critical to identifying the societies exposed to losing their land and reinforcing the restoration policy of the urban land management program in Hawassa City. Proper land utilization for urban expansion requires the participation of all concerned stakeholders in the city administration. Therefore, conducting further research on modern utilization of land in urban centers and the need to respect the rules and regulations of urban land expansion programs is helpful. Urban land policies regarding how to apply urban expansion and providing sufficient compensation to the land loss societies in the urban areas should be followed. Following all the listed actions makes the urban land efficient, effective, and suited to society’s need for the proper utilization of the urban land, leading to a better economic, productive, and social situation for the city dwellers.
According to the current study, urban growth has a considerable influence on the socioeconomic activities of the neighborhood. This finding is related to that of Dociu and Dunarintu (2012), who claimed that urbanization has a significant impact on places due to several factors, including the degree of use of land or infrastructure, which manifests as contact with the labor market established in urban areas, the population’s adjustment to the labor market, specializing in the needs of the existing brand and, thus, framing and adaptation, and gaining money to cover expenses. As one of the socioeconomic elements of society, a change in fertility has also been observed following urban expansion in peripheral areas.
As part of the GTP II (Growth, 2016), the government of Ethiopia has been implementing industrial parks in Addis Ababa and other regional cities. The parks are specialized in textile and garment production, and their implementation has been coordinated by the Industrial Parks Development Corporation (IPDC); Hawassa Industrial Park (HIP) was the first to start its operations in 2016. Currently, 20,000 workers, plus 2,000 indirect workers are employed by the project. They plan to have 40,000 direct workers by the end of 2020, reaching their peak by 2025, with 84,000 workers.
According to the HIP Tenants Association, out of the 20,000 workers, approximately 16,000 are basic operators, 3,000 are mid-level technical and managerial Ethiopian staff, and approximately 1,000 are expat technical and managerial staff. This number should double over the next 2 years, with a shrinking share of expat staff; however, absolute numbers might not change so much. The operators are almost exclusively young women, mainly from rural areas, who moved to Hawassa City in search of employment. They are between the ages of 18–30 (although on average, at the lower end of this age range). Only a small number of the operators brought dependent family members with them (Mohr et al., 2016). The mid-level Ethiopian staff, mostly men, are recent university graduates. By 2025, the size of the workforce at the HIP is expected to reach 84,000, almost four times the current workforce of 20,000. This dramatic growth in the number of industrial workers is bound to put increasing pressure on the city of Hawassa and the manufacturers to find lasting solutions to the housing crisis (Figure 3).
FIGURE 3. Map showing the majority of Hawassa Industrial Park operators’ current living locations within the informal settlements. Source: Hawassa City Administration, 2020.
In Hawassa City, urban land is not more affordable to the residents due to its limited capacity. In Hawassa City, almost the price of urban lease law serves higher-income groups of people within society rather than middle- and lower-income groups. This shows the higher income groups’ advantages over other society members in gaining land leases. According to the interviewed respondents, middle- and lower-income groups buy illegal land in peri-urban areas because the price of land is cheaper than land leases (Ling et al., 2018). Additionally, the studies conducted by World Bank (2019) and Adamu (2014) reported that urban land is used for various purposes, but they found that it had several flaws, including corruption, a lack of openness, and other issues. The municipality made a public announcement and encouraged various society members to participate in an open lease competition. Therefore, people with higher incomes were competing more frequently for each parcel of land by taking advantage of these opportunities. The participation of wealthy individuals and other privileged groups raised the ceiling price over the initial amount allotted.
Entering the data obtained into STATA version 14, the probit model was analyzed. Before the analysis, the explanatory variables were checked for multicollinearity and heteroscedasticity. Before running the model, all the hypothesized explanatory variables were checked for the existence of a multicollinearity problem. Two measures are often suggested to test the existence of multicollinearity: VIF for association between the continuous explanatory variables and Contingency Coefficient for dummy variables. The multicollinearity indicator, VIF, ranged from 1.116 to 3.755 and the Tolerance index ranged from 0.896 to 0.266. It therefore suggested that regression coefficients did not suffer from multicollinearity among the independent variables. The overall goodness of fit for the model parameter estimates was assessed based on several criteria. First, it was found that the correlations between the dependent and independent equations were significantly different from zero the (ρ ≠ 0), which confirmed that the application of probit was valid and it was statistically a true stochastic specification. The distributions are independent if and only if ρ = 0. The relationship between the dependent and independent equations can be estimated consistently with the single-equation probit method. However, such a commonly used approach was inefficient because it ignored the correlation between the error terms of the underlying stochastic production functions (Maddala, 1998; William, 2003). Finally, the validity of the constraint was examined empirically by usual statistical test statistics as well as the LR or Wald test. The overall fit of the equations indicated that LR: the χ2 (10) statistics = 87 was significant at less than a 1% significance level through the livelihoods of surrounding displaced farmers. Based on the outcome of this test, the study yielded the basis to reject the null hypothesis at a reasonable level of significance. Binary probit model analysis was conducted to determine the impacts of urban expansion on the livelihoods of surrounding displaced farmers. The probit estimates the likelihood of urban expansion before and after the displacement of the farmers and statistically significant variables were identified in order to measure the impact of their relatives on the farmers’ decisions (Table 5).
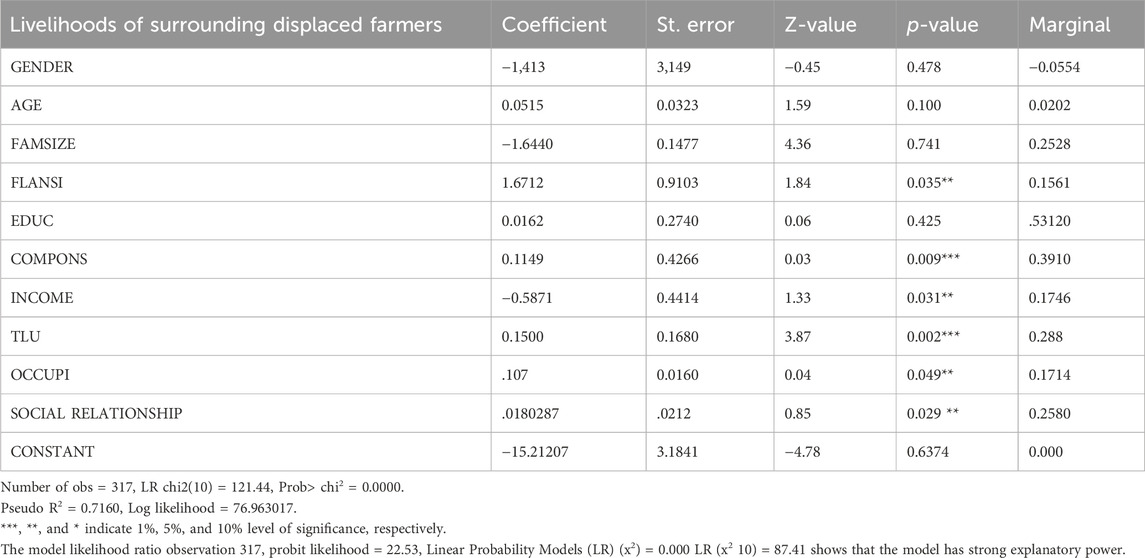
TABLE 5. Maximum likelihood Estimation result for the Binary Probit model.
However, the linkage between the city’s sustainability and land use is not only a matter of proportions. Thus, how natural resources and non-built-up land are spatially distributed determines equity (equitable distribution of benefits provided by natural areas) and the proper functioning of the natural areas. For example, having only one huge park within the city provides natural benefits that are different (in quantity and quality) than the same surface area of green space split into many smaller parks. For this reason, the natural areas of the city cannot only be the random negative of the built-up land and there is a need to think about the green infrastructure of Hawassa City.
Gender is used as a dummy variable. Gender difference is one of the factors expected to influence livelihood status. Female-headed households are expected to have a lower capacity to be responsible for the family’s livelihood. Mostly, women spend their time at home and men do not.
This variable is a categorical variable measured in years. As the age of the household increases, they acquire more knowledge and experience in their field of work, especially in farming. Older people have relatively richer experiences of the social and physical environments as well as greater experience of activities involved in their livelihood (Kindane and Kundhlande, 2005). Thus, the age of the household head is expected to affect the dependent variable positively.
The number of individuals who live in the family is expected to have a positive influence on the dependent variable. Increased numbers of people in the household who are actively involved in the family’s work positively impacts the probability of improved livelihood status(Dibaba and Goshu, 2019).
As expected, the size of farmland was positively and significantly associated with the urban expansion of the livelihoods of surrounding displaced farmers at less than a 5% probability level. Farmland is also a livelihood asset used for food production. In the regression analysis, it was found that the relative probability of food insecurity for households with less farmland was higher than that for households with more land. Table 5 shows that farmland does indeed provide important components for rural livelihoods to prevail on the ground as farmland holdings would encourage displaced farmers to areas that could enhance productivity. From this, we concluded that urban expansion into farmland would reduce the size of farmland owned by the respondents before urban expansion and impact their livelihoods. All other factors remained constant; the marginal effect indicates that a one-hectare increase in farmland size increases the probability of livelihoods of surrounding displaced farmers by 15.61%, which is consistent with the findings of Holden et al. (2020).
Education level was expected to have a positive and significant effect on livelihood improvement. The findings of this study are in agreement with previous observations (Bezemer and Lerman, 2002). Furthermore, generally, human capital in this study is expected to have a positive influence.
We understand compensation to be the other big impact of the displacement of people from their original land due to urban expansion, and it was found to negatively affect the livelihoods of surrounding displaced farmers at a 1% probability level because displaced farmers have neither enough farmland to work on nor the money to plan on for creating job because of having many families. The rural people that were found in the surroundings of the city were forcibly displaced from their original land and they gave away their land and resources freely or in exchange for little compensation. The model results show that an increase in the amount of compensation for displaced households by one Birr increases the probability of supporting urban expansion by 3.91e-06. This means that the compensation amount is used to improve the perception of the urban expansion program.
The results reveal that livestock ownership is also an important welfare measure because livestock is an important asset for households where farmers can store wealth. In the study areas of surrounding farmers, the loss of livestock assets was directly associated with land use changes due to urban expansion, with a 1% probability level. Livestock assets in the context of this study comprise cows, oxen, goats, sheep, and hens; 28% of farmers had livestock assets before the farmlands were expropriated for public use due to urban expansion. Farmers with more livestock are considered wealthier and actively participate in honey production.
Average annual income showed a significant but negative effect at a 5% probability level of urban expansion on the livelihoods of surrounding displaced farmers. Farm household and non-farm incomes have to livelihood household that has better opportunities for food security and sustainable life. Part of the explanation for this result is that income increases the household livelihoods of surrounding displaced farmers. Other factors remained constant; household income increased by a unit and the surrounding displaced farmers’ rural livelihoods shifted by 17.46%. This result was consistent with studies by Tsegaye and Bekele (2010).
The occupation variable negatively affects the livelihoods of the displaced farmers, at a 5% probability level. The loss of agricultural livelihood assets without the replacement of alternative economic systems that grant individual survival forced evicted farmers to change their occupation to non-agricultural activities. Although evicted farmers’ occupational diversification reflects the dynamic dimension after displacement as an alternative livelihood, the results of the study show that the annual total income earned from non-agricultural economic activities resulted in a smaller additional increase in overall economic output at the household level. The implication here indicates that the process of urban expansion into surrounding farmland causes a loss of agricultural livelihood assets that were previously used as the main source of income, forcing evicted farmers to change their occupation in order to find an alternative source of income. Urban expansion into the surrounding communities may, in one way or another, lead to changes in occupational fields for income generation, whereby farmers are forced to shift from traditional agricultural activities to alternative income sources due to the dispossession of their assets. The results show that most respondents were engaged in farming activities before urban expansion, but few farmers were active in diversifying their income sources; thus, a trend in farmers changing their occupation to non-farm activities to find alternative income sources among the sample respondents following land eviction was among the results of the study. An increase in the level of occupation by 1 unit increased farmers’ shift from agricultural activities to non-agricultural occupational activities by 17.1% in the whole sample.
As seen in Figure 4, the size of the farmland of displaced farmers is the main determining factor, but due to the scarcity of land in the city, the majority of farmers, 132 (41.6%) respondents, had a land size of below 0.5 ha, followed by 112 (35.3%) respondents with between 0.5 and 1.5 ha, 56 (17.7%) respondents with between 1.5 and 2.0 ha, 14 (4.4%) respondents with between 2.0 and 2.5 ha, and 3 (1.0%) respondents with between 2.5 and 3.0 ha. All in all, 244 (76.9%) respondents had a land size of below 1.5 ha.
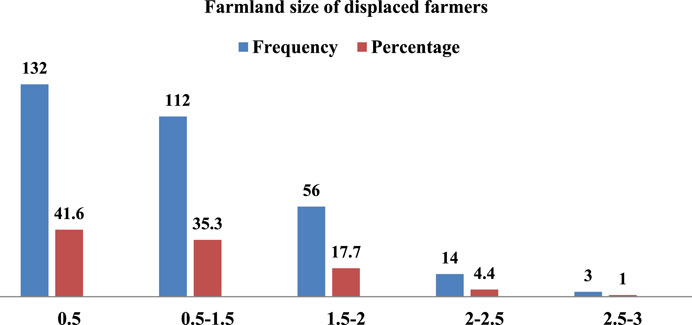
FIGURE 4. Farmland size of displaced farmers.
Land Liquidity, deposit mobilization, and investment linkage stem from an estimate that the capital value of land and property constitutes one-half to three-quarters of a country’s wealth. The proportion is higher in less developed countries with limited domestic capital. This is not only observed at the country level but also at the individual and family level. Land and property are, therefore, likely to form by far the largest class of assets in most developing economies. As a result, the efficient use and management of land and property is the key to promoting inclusive growth that targets the country’s bottom 40% in terms of per capita income. Land registration projects contribute to a more comprehensive and accurate collection of property taxes (World Bank, 2019).
Poorly functioning land management leads to several problems, including land speculation, the creation of slums and squatter settlements, environmental deterioration, and an inefficient urban development pattern, which increases the cost of doing business in the cities/towns and adversely affects urban land management (World Bank, 2019). This results in the creation of slums and squatter settlements, environmental deterioration, urban land-related conflict, an inefficient urban development pattern, and the violation of the structural plan of the area.
As seen in Figure 5, regarding compensation paid to displaced farmers based on permanent agricultural plantations as well as house constructions on the plot of land they owned before land expropriation, one-time compensation payments received by the respondents varied from 100,000 to 500,000 Birr. The majority of farmers, 193 (60.9%) respondents, were paid compensation below 100,000 Birr; 65 (20.5%) respondents were paid lower compensation, between 100,000 and 200,000 Birr; 40 (12.6%) respondents were paid compensation between 200,000 and 300,000 Birr; only 7 (2.2%) respondents were paid higher compensation, between 400,000 and 500,000 Birr; and 7 (2.2%) respondents were paid the highest level of compensation, above 500,000 Birr. On average, each displaced farmer was paid a compensation of 161,075 Birr for the loss of agricultural production. The total compensation paid for the sampled 317 respondents is estimated to be 49,450,000 Birr for the loss of agricultural production. This implies that the farmers who earned more income before displacement and non-displaced farmers received better compensation compared to displaced farmers.
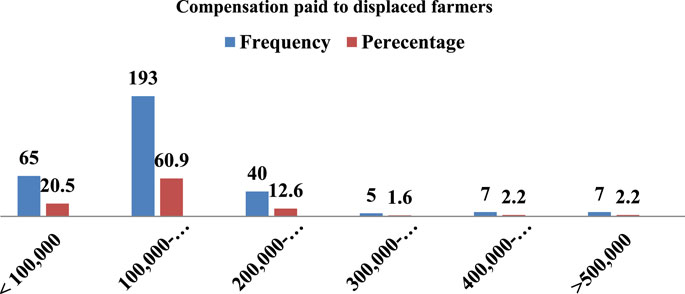
FIGURE 5. Compensation paid to displaced farmers.
The most frequent complaints among displaced farmers were that they were not offered adequate compensation and they were not given a reasonable time to leave the area. The interview discussion regarding compensation payment showed that many of the displaced farmers got 500 square meter plots of land to construct their houses in the city and the other land was taken from them for an unknown rate of payment per parameter. This paves the way for corruption and maladministration.
Expropriation represents both the most serious infringement of private property rights and the manifest exercise of state sovereignty. It is a formal withdrawal of property rights for the benefit of the state or for private persons designated by the state. There are two types of expropriation: direct and indirect. Direct expropriation usually involves formal processes and is explained in an expropriation decree or law. Expropriation of this type is undertaken against one or several investments. Expropriation, or nationalization, can also be against several investments in one economic sector. The second involves indirect expropriation. This type of expropriation may result from measures that a state takes to regulate economic activities within its territory, even where such regulation is not directly targeted at an investment (Nikièma, 2015).
Generally, it is assumed that landowners may be compensated fully using other approaches, especially where the property is not shown to be both unique in nature and location and (Dfid, 1999) indispensable to the conduct of the landowners; business operations on the site from which a part is taken. So, for the most part, buildings of a unique character are valued using this method. This approach can be used in countries where the market value of property is not determined. The method determines the value in terms of current labor and materials required in assembling a similar asset of comparable utility (Ndjovu, 2003).
Respondents were asked to express their levels of social relationships and values before and after land expropriation on a five-level Likert scale: very low (0), low (1), moderate (2), high (3), and very high (4).
Data collected from sampled respondents expressed in Table 6 show that the mean score for the level of social relationship and values after land expropriation was 1.7 (moderate), with a standard deviation of 0.852 in comparison with the mean score for the level of social relationship and values before land expropriation, which was 3.21 (high) with a standard deviation of 0.79. This shows that the land expropriation program negatively affects farmers’ levels of social relationships and values, and their social relationship scores before displacement and after displacement lay between low and moderate.
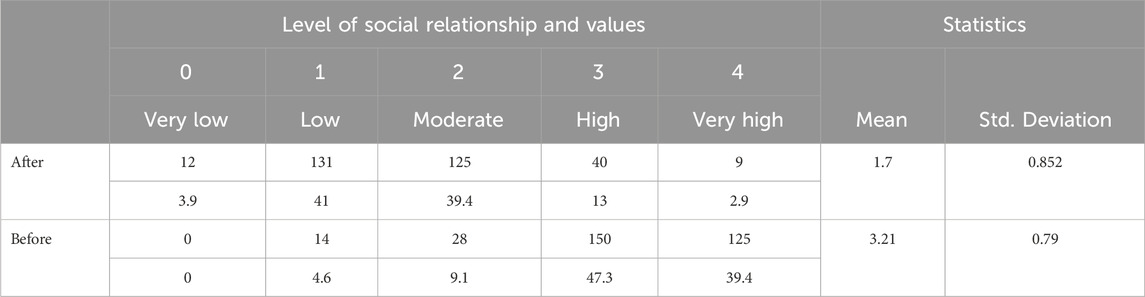
TABLE 6. Level of social relationship and values.
Similarly, respondents were asked to express their average annual income before and after land expropriation on a five-level Likert scale: very low (0), low (1) moderate (2), high (3), and very high (4).
The results show that the mean score for the level of social relationships and values after land expropriation was 1.032 (low), with a standard deviation of 1.244, in comparison to the mean score for average annual income before land expropriation, which was 2.16 (moderate), with a standard deviation of 1.23. This shows the land expropriation program negatively affects farmers’ economic levels (see Table 7).
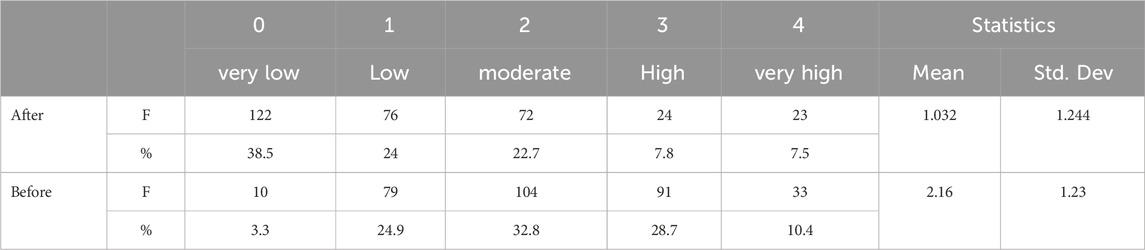
TABLE 7. Average annual income.
As seen in Table 8, the respondents’ main source of income before and after land expropriation drastically changed according to the transition matrix presented in the above table. From a total of 206 (67.1%) respondents who were dependent only on agriculture before land expropriation, 187 (60.9%) turned to non-agricultural activities after land expropriation, while 19 (6.2%) turned to both agricultural and non-agricultural activities after land expropriation. However, none of them remained in agricultural activities.
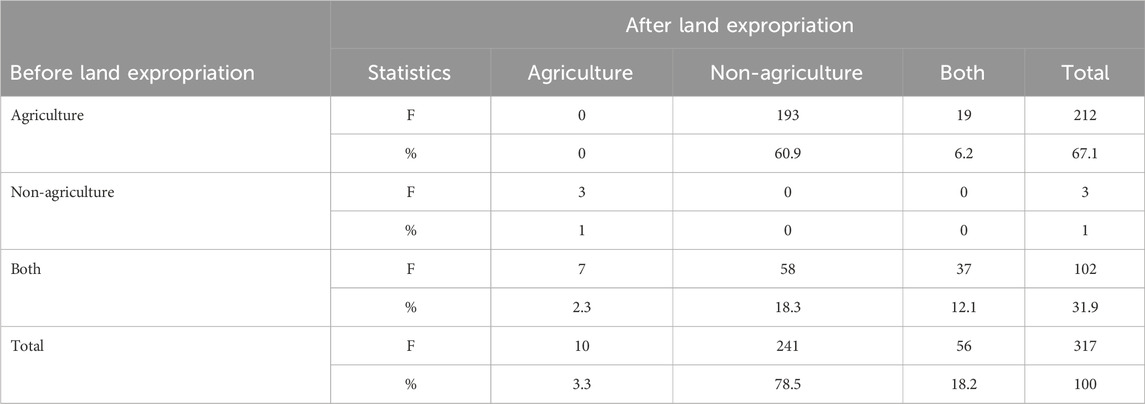
TABLE 8. Main source of farmers’ income before and after land expropriation.
As previously indicated, to see the effect of urban expansion on the community, the researcher employed a multivariate analysis of variance alongside descriptive statistics. The correlation between dependent variables was analyzed using Statistical Package for Social Science (SPSS) version 20, using a Pearson Correlation coefficient. The results of the relationships among the variables used in the questionnaires are indicated.
Bivariate Correlation tests whether the relationship between two variables is linear (as one variable increases, the other also increases, or as one variable increases the other variable decreases). In addition to this, Pearson’s product-moment correlation coefficient is a measure of the linear correlation between two variables, X and Y, giving a value between +1 and −1 inclusive, where 1 is a total positive correlation, 0 is no correlation, and −1 is a total negative correlation (Pedhazur, 1982). When Pearson’s r is close to 1, there is a strong relationship between the two variables. This means that changes in one variable are strongly correlated with changes in the second variable. When Pearson’s r is close to 0, there is a weak relationship between the two variables. This means that changes in one variable are not correlated with changes in the second variable (Malhotra and Briks, 2017).
The result of the multivariate test in Table 9 indicates that the effect of urban expansion on the combined dependent variables, namely, on land use, socioeconomic activities, culture, and environmental change is statistically significant; F(8, 616) = 12.704, p = 0.000, Wilk’s Lambda (λ) = .737, partial eta squared(partial η2) = 0.142, observed power = 1.000.
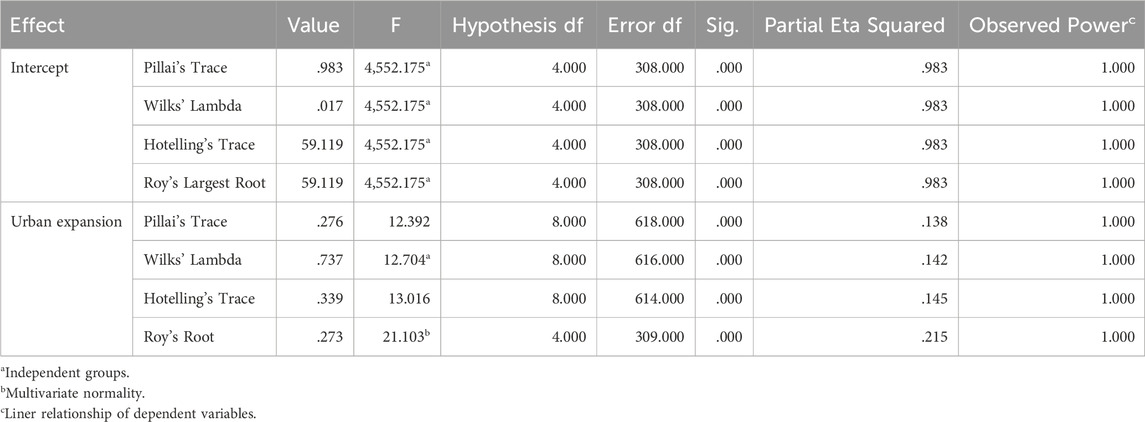
TABLE 9. Multivariate tests on the effect of urban expansion on the combined dependent variables (land use, socioeconomic activities, culture, and environmental change).
As indicated in Table 10, the effects of urban expansion on socioeconomic and cultural aspects and the land use of nearby farmers were found to be significant. Since the results of the multivariate analysis of variance show the existence of significant mean differences in land use, cultural influence, and socioeconomic influence across the levels of perceived urban expansion by respondents, the researcher conducted a post hoc analysis of the difference within groups as shown.
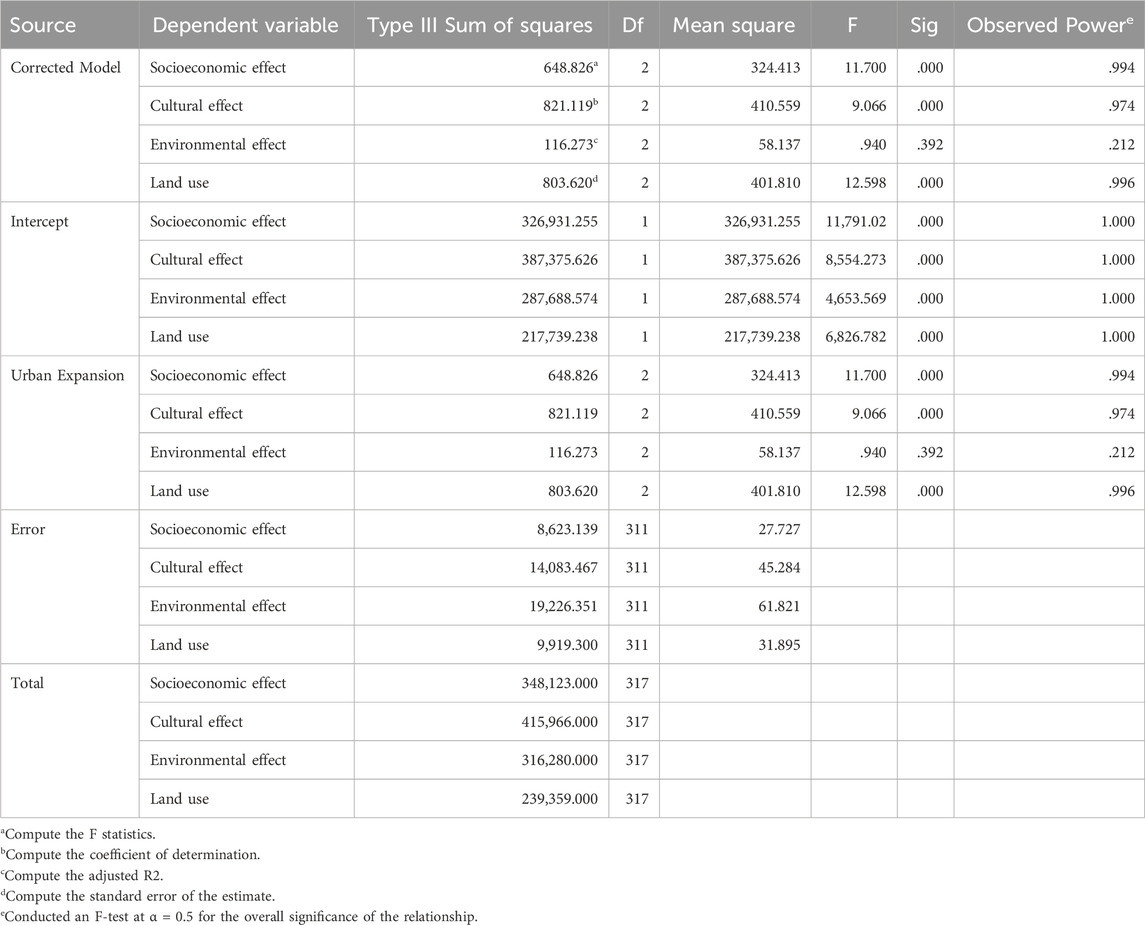
TABLE 10. Tests between group results of one-way multivariate analysis of variance regarding the effect of urban expansion on the combined dependent variables.
The multiple comparisons using Least significant difference (LSD) post hoc analysis indicate that there is a significant difference in terms of perceived socioeconomic effect between those who perceive that there is low urban expansion and those who perceive there is medium urban expansion (M = −3.1442, SEr = .71400; LB; −4.5491, UB = −1.7393), and between those who perceive there is low town expansion and those who perceive there is high urban expansion (M = −3.1545, SEr = .77860; LB; −4.6865, UB = −1.6225).
The post hoc analysis also indicated that there is a significant difference in terms of the cultural effect between those who perceive that there is low urban expansion and those who perceive that there is medium urban expansion (M = −3.3679, SEr = .91248; LB; −5.1633, UB = −1.5725), and between those who perceive there is low urban expansion and those who perceive that there is high urban expansion (M = −3.7530, SEr = .99503; LB; −5.7109, UB = −1.7952).
Furthermore, the post hoc analysis also indicated that there is a significant difference in terms of the perceived effect of urban expansion on land use between those who perceive that there is low urban expansion and those who perceive that there is medium urban expansion (M = −2.6846, SEr = .76579; LB; −4.1914, UB = −1.1779), and between those who perceive there is medium urban expansion and those who perceive that there is high urban expansion (M = 3.6466, SEr = .77321; LB; 2.1253, UB = 5.1680) (see Table 11).
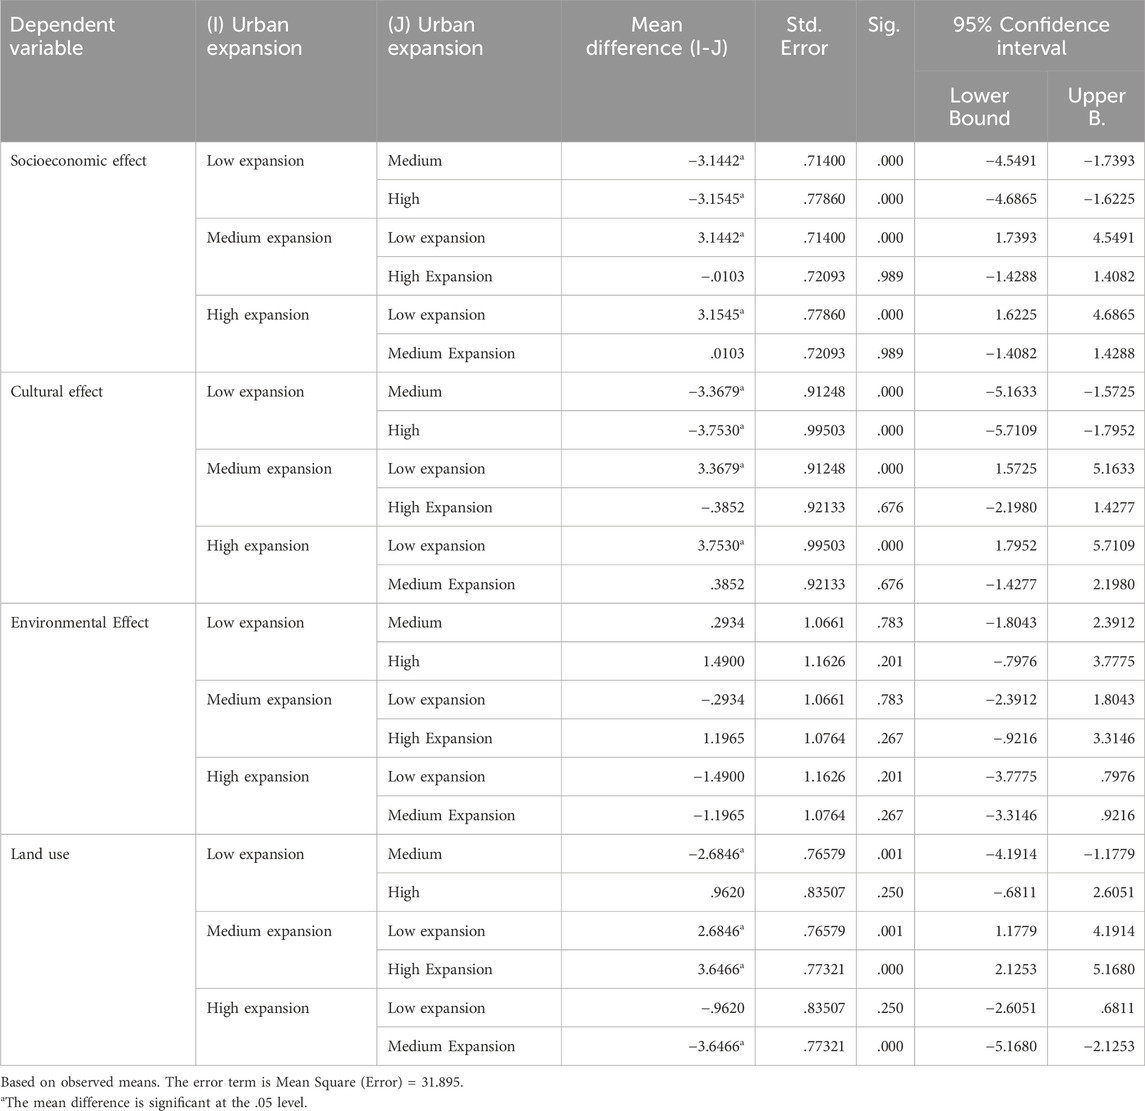
TABLE 11. Least significant difference (LSD’s) post hoc analysis of the difference.
The environmental impact of urban expansion was not observed to have a statistically significant independent influence on the adjacent environment in the current investigation. The authors of Seifollahi et al. (2022) noted that the relevant contribution to land degradation caused by urban expansion was demonstrated to have been derived from socioeconomic drivers, the most significant of which were population growth and urban sprawl. This finding contrasts with their findings. These elements were recognized as producing complex environmental syndromes that are fueled by urbanization. This perspective views peri-urban regions as socio-environmental systems adjusting to strong socioeconomic transitions.
The bi-directional or two-way influence of the urban and rural ways of life on the community is another finding in the literature on how urban growth affects the socioeconomic elements of the adjacent village. This occurs when urban and rural areas are altered via commerce and mutual interactions between the physical and practical aspects of existence, as has been seen by the general public. According to Torquati et al., 2020, the peri-urban environment is increasingly regarded as a unique, hybrid environment that combines urban and rural characteristics.
In the current study, the effect of displacement on the socioeconomic conditions is not uniform across the educational levels of heads of households as well as the personal diligence of the whole members of the family, indicating that the better educated and those with more manageable family sizes tend to lead better lives. This finding relates to that of Kasa et al. (2011) who stated that households with relatively older, male, literate heads, whose families received relatively better transfer income, and who are located near transport stations had an increased likelihood of participating in non-agricultural livelihood strategies. In their study, they stressed that regardless of the diverse livelihoods of peri-urban households, the propensity score matching estimation indicated that fully displaced households received lower compensation than partially displaced and non-displaced households, whereas, their average per capita expenditure was found to be too big, signifying that it would be difficult to lead their life. This shows that regardless of compensation, fully displaced people often fail to establish a comparable means of income and they pursue an asset-depleting consumption style.
Considering the city’s administrative boundary as a basis for land use classifications, the proposed land use exhibits a different percentage. In this regard, urban agriculture takes the major share (41.87%), followed by recreation and environmental uses (21.74%), housing (16.15%), and road and transport (10.85%) (Figure 6).
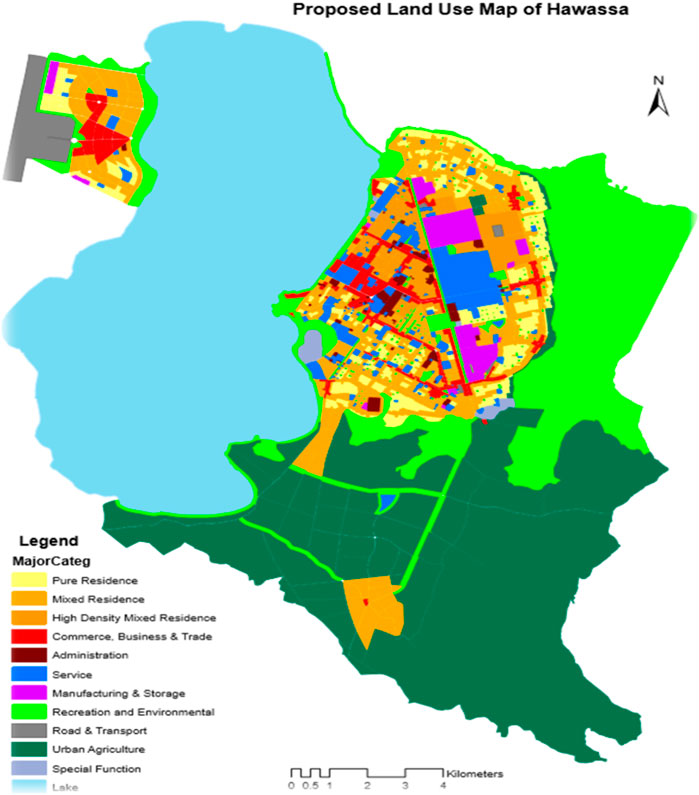
FIGURE 6. Land Use Map within the administrative boundary. Source: Hawassa City Administration, 2020.
Hawassa City is the largest city in the southern region. The city serves as the main political, economic, and employment center for the regional state and within its surrounding context. It is one of the most popular tourist destinations in the country. The presence of Hawassa Lake bounded the city in the west has a significant impact on attracting international and domestic tourists, attracting investment, and, consequently, contributing to local economic development.
Hawassa City has a total area of 178.3019 sq. km made up of residential areas, commercial space, manufacturing centers, roads, recreation, agriculture, etc., of which more than 60% is rural land. The city has eight sub-cities and 32 kebeles. Of the total land area of Tula, 77% constitutes the Tula sub-city while the remaining 23% is shared by the other sub-cities.
The northern part of the city is predominantly flat, while the southern part is predominantly hilly, and the highest peak is located at the southernmost part of the city, at 2,140 m above sea level. Land adjacent to the lake and the oldest settlement is level to very gently sloping, with a slope of 0%–5% and a land area of 86% of the total land of the city. Land in the south and around the Tabour Mountain and Alammura Mountain areas is hilly and has slopes of greater than 10% covering 7% of the total land of the city. These lands are not used for settlement purposes and they are forested suited for recreation and greenery.
Hawassa City is located in the Hawassa sub-basin drainage system and has seasonal and perennial rivers, such as the Tukur-Wuha river, which collect water from the nearby highland areas and drain it into Lake Hawassa. In the city, except in the eastern and southern areas and very flat/lower parts of the city, the run-off flows toward the lake.
Hawassa City is spatially organized mostly in a grid layout settlement pattern with rectangular blocks. The relatively flat topography of the city creates good landscape character, which eases the circulation system and makes the city accessible. The general settlement pattern of the city reveals different characteristics. Settlements along the major corridors, such as the Piassa and Old Bus Terminal corridors and the nodal point at the Sidama Square, have roads radiating toward Tirufat and the Regional Health Bureau area and are characterized by relatively dense and consolidated settlement patterns, where multi-story buildings are emerging. Furthermore, neighborhoods located east of the Misrak sub-city, in the eastern part of the Menaheria sub-city, and south of the Tabor sub-city, represent recent developments and are among the well-planned parts of the city.
Settlements along the back roads of these main corridors are characterized by detached villa houses within individual plots. Most of these buildings are low rises with haphazard morphological patterns. The older settlements of the city, especially those surrounding or close to the old market area are characterized by dense and consolidated settlement patterns that create physical and psychological discomfort to the inhabitants. The housing conditions in these areas are deteriorated, congested, and have poor sanitation (Figure 7).
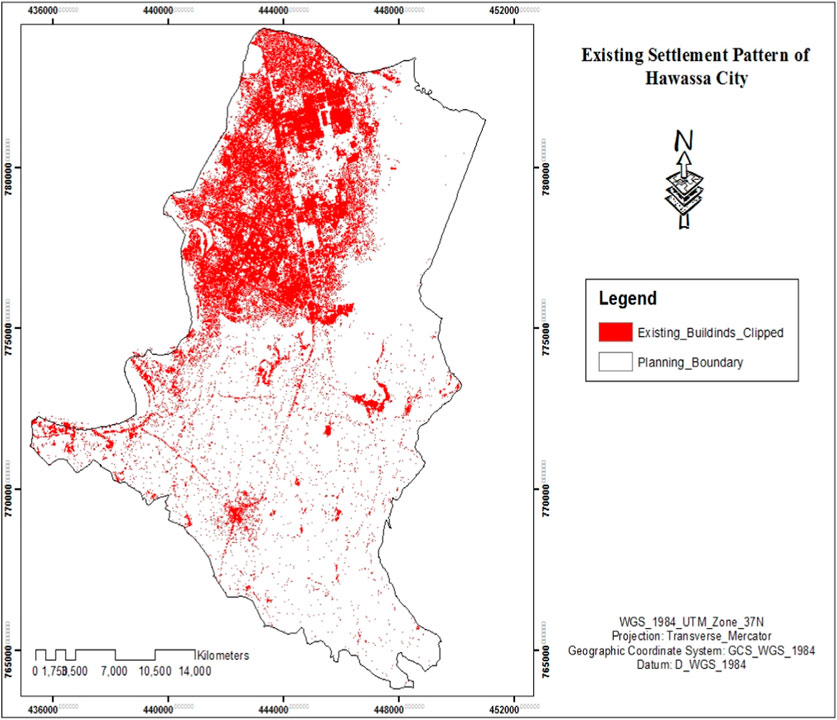
FIGURE 7. Existing settlement pattern of Hawassa City. Source: US Geological Survey (USGS) http://glovis.usgs.gov.
At present, the city has no hierarchies of centers. The main activities/functions of the city are dispersed throughout the city. Central functions, for instance, are concentrated in different areas along the sides of each road that extend from arterial to local ones. However, the most important functions, like restaurants, financial institutions, shopping centers, central government offices, higher education, supermarkets, etc. are concentrated along the major arterial and sub-arterial roads of the city.
Numerous activities have also been found in different areas of the city, such as Hawassa College of Teacher Education, the Membo corridor, the Hawassa View Hotel corridor, around the Haile Resort, the Spring Hotel corridor, and the new bus station and monopole surroundings. Some of the major activities located in these areas include hotels, supermarkets, fuel stations, banking, and shopping facilities. Retail businesses are also located within residential areas and along collector and sub-arterial road corridors. The mix of all these activities illustrates the lack of hierarchical orders of functions or centers in the city.
The land use classification of the study of the city is generally characterized by residential-use-dominated mixed-type settlement. The major land use types found in the area include residential, commercial, administration, mixed-use, services, manufacturing and industry, recreation, urban agriculture, and road and transport. Residential use takes the lion’s share followed by road and transport, services, manufacturing and storage, recreation, commerce and trade, and urban agriculture (Figure 8).
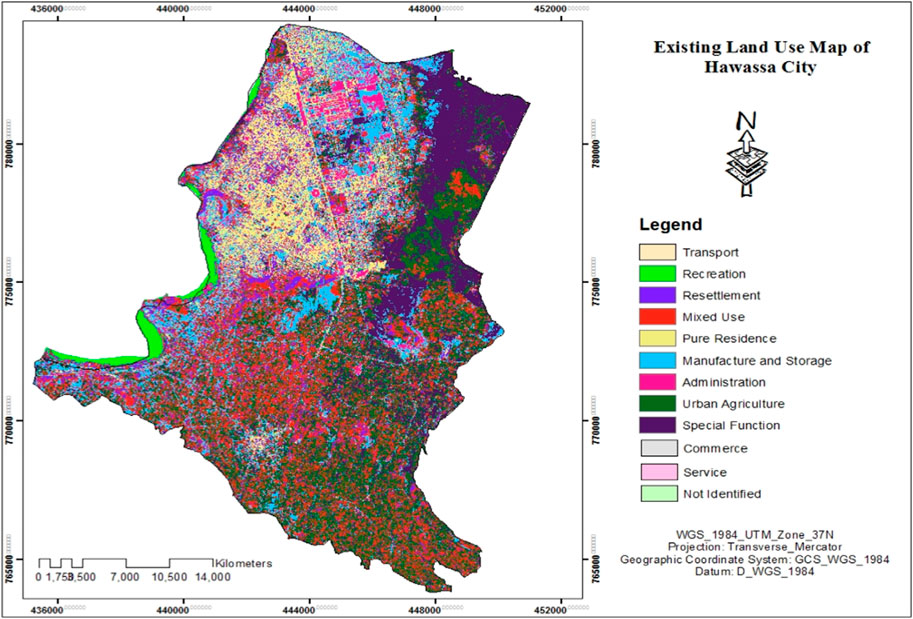
FIGURE 8. Existing land use of Hawassa City. Source: US Geological Survey (USGS) http://glovis.usgs.gov.
The current average density of the city is 12,656 persons per sq. km. Its distribution ranges from 1,090 persons per sq. km in the predominantly scattered settlement of the Tulla sub-city, to as high as 31,700 persons per sq. km in the high-density Bahil-Adarash sub-city of Hawassa. To address this structural difference, an area-specific density distribution is proposed (Figure 9) for the next 10 years.
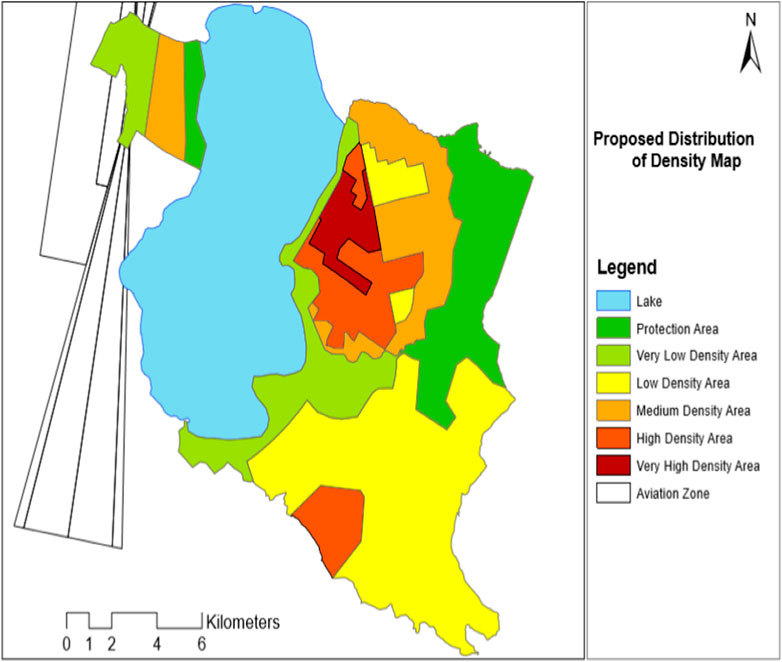
FIGURE 9. Proposed distribution of density within the administrative boundary. Source: Hawassa City Administration, 2020.
The average density for Hawassa City for the next 10 years is proposed to be 20,000 persons per sq. km. Figure 9 shows five different densities distributed across the city’s administrative boundary. The major sites in the city, such as Piaza, the old market surroundings, the old bus station areas, Shell, Turufat, Atote, and the areas in front of HIP are the most strategic areas that accommodate major commercial activities and employment zones for the residents. It is essential to encourage relatively very high-density residential development to provide homes close to these employment zones, and a very high density of at least 30,000 persons per sq. km is proposed for these specific areas. The city will achieve this density through redevelopment that considers the important role of the existing major economic activities of the area and the higher land value of the surrounding settlements that enables the city to create new commercial and employment hubs for the city.
There is a high residential density of 25,000 people per sq. km near the major city centers and employment sectors. In areas where the city has recently grown, districts such as Dato, Chefe, Monopol, and Wondo-Tika, there is a medium residential density, with a capacity of 20,000 people per sq. km. The majority of the Hawella-Tula sub-city and the land along the lake are classified as low- and very-low-density areas, with proposed densities of 15,000 and 10,000 people per sq. km, respectively.
The studied area showed a real growth rate and a pattern of land change, and this tendency was supported by image classification and a growth pattern. Figures 10, 11 show how the classification of LULC has changed throughout the study period in the respective areas. The various urban regions contained the seven classifications of LULC. Based on field observation and general historical information gained from bare land, built-up areas, bushland, cropland, farmland, forest land, and water bodies., It was decided to focus on the following seven major LULC classes identified using the field data and satellite images: bare land, built-up areas, bushland, cropland, farmland, forest land, and water bodies.
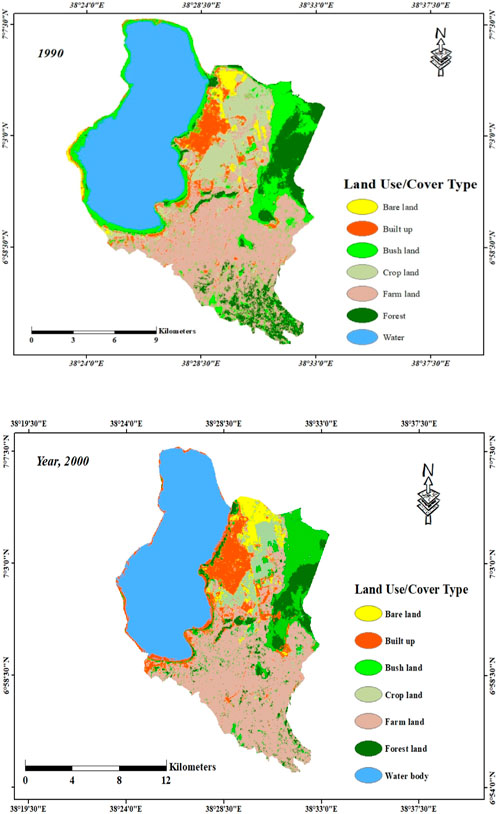
FIGURE 10. Land use/land cover classification map of 1990 and 2000. Source: US Geological Survey (USGS) http://glovis.usgs.gov.
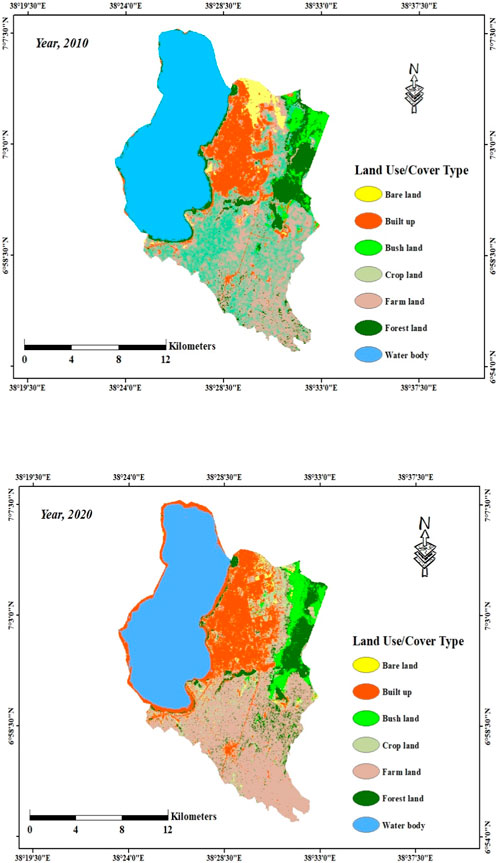
FIGURE 11. Land use/land cover classification map of 2010 and 2020. Source: US Geological Survey (USGS) http://glovis.usgs.gov.
Based on the results of supervised classification between 1990 and 2000, farmland, built-up areas, bare land, and water bodies showed growth, expanding from 28.57% to 31.79%, 5%–8.99%, 1.58%–3.32%, and 34.20%–35%, respectively. The percentages of cropland, forest, and bushland decreased from 9.70% to 5.38%, 9.79%–5.82%, and 9.70%–9.70%, respectively (Table 12; Figure 10).
TABLE 12. LULC of the Hawassa City by year of investigation.
Farmland and bushland were the main LULC types in the study area in 1990. This is due to the area’s relatively low population pressure, land operations, and to some extent, uninterrupted environmental conditions during this time. However, due to a number of rural settlement types being under municipal management, the majority of the land that was covered by farmland and bushland before 30 years is still covered in farmland and built-up land (Table 12; Figure 10).
After 10 years, the highest incremental growth in the LULC classes was observed in built-up areas, forest land, and water bodies, expanding from 8.99% to 11.97%, 5.82%–7.87%, and 35.67%–35.67%, respectively. Farmland decreased from 31.79% to 19.46%. Generally, in this period (2000 and 2020) built-up areas and forest land were significantly increased while farmland was significantly reduced.
There is a significant demand for housing in the nation as a result of rising urbanization and population increase. Housing demand is higher in urban areas than in rural areas. In terms of housing, there are three ways that rural-urban linkages appear in Hawassa City. First, the increasing number of people who come to the city, particularly for higher education/training and investment purposes is putting significant pressure on the housing demands of the city. Secondly, there is a growing tendency for city dwellers to purchase plots from farmers in the nearby peasant associations illegally, which has led to the growth of informal communities in these areas. This illegal dwelling construction endangers the city’s planned growth because these places are located in the adjacent expansion areas. The local government must therefore make all possible efforts to balance the current housing supply and demand.
Comparatively, the area covered by farmland, built-up areas, and bushland increased, from 19.46% to 26.51%, 11.97%–18.71%, and 3.07%–4.51%, respectively. The amount of land covered by bare land, cropland, bushland, and water bodies decreased from 2.84% to 0.91%, 19.12%–8.91%, 7.87%–7.28%, and 35.67%–33.17%, respectively. It can be said that, in terms of the total area covered, farmland and built-up LULC continued to be the two main LULC classes between 2010 and 2020 (Figure 10). This means that built-up areas in the city have been developed dramatically at the expense of bare land and forest land. The reduction of bare land and forests, as well as the utilization of land for residence, commerce, administrative institutions, services, roads, and other urban functions. The rise in bushland was caused by the planting of trees beside city buildings, roads, and recreation areas.
Generally, in this period (1990 and 2020), built-up areas were significantly increased while bushland and bare land were significantly decreased. The use of land by farmers in the peripheral areas in this study was significantly affected by the urban expansion in the current study. Replicating this finding, Salvati and Zitti (2008) underscored that urban expansion in their study area was associated with land degradation in peri-urban areas, which is also closely associated with spatial and temporal changes and interactions of natural and human drivers.
According to the Hawassa City Administration, the total population of Hawassa City in 2018 was approximately 400,000. Based on a 7.5% annual growth rate, which is an assumed growth rate with the expectation of multiple mega projects, such as HIP, international airport, and dry port, it is estimated that the population will reach 825,804 by 2030. By 2025, the Hawassa Industrial Park is expected to employ a total of 84,000 people. The rapid influx of thousands of potential employees to Hawassa in a very short period has created a strong demand for accommodation and contributed to a significant increase in rental prices. As the city expanded, finding appropriate and affordable housing became a major concern. In conjunction with the corporate sector and civic society, the City Administration must design a cohesive and comprehensive strategy for managing rapid urbanization and addressing the predicted high demand for affordable housing as a result of rapid population growth and rural-urban migration.
It has been claimed that Hawassa City has a master plan for the 10 years to come and that the city has expanded to incorporate new territory from the neighboring land. This information relates to patterns and trends of urban expansion. Since it reached the threshold of being a municipality, an alarming number of government and privately initiated projects have been implemented, along with additional services. In response, the city administration has been implementing a 10-year city development plan. This has increased citizen demand for residential and investment lands, which has led to the incorporation of 20 sq. km of land from the eight nearby rural kebeles into the city.
According to the information gathered, the main conclusion from the analysis of satellite images revealed that the rapid population growth associated with the introduction of new agricultural extension programs, which need additional expansion aimed at production maximization, was the main cause of the continuous expansion of farmland and settlements between 2010 and 2020 in the study area. The communities in the study area’s areas of economic activity gradually shift as a result of these programs. In agreement with the findings of this research, studies conducted in some parts of Ethiopia such as Alemu et al., 2015 documented a reduction of woodland areas and an increase in agricultural land. Rapid reductions in woodland and forest land and increases in agricultural land and settlement areas were also reported by Zeleke and Hurni (2001) in the Dembecha area of Gojjam.
Bushland includes areas lined with totally different species of shrub and bush, with wide variable density from one section to another, and is frequently found in rough areas of the Alammura and Tabore hills. This refers to the areas lined with trees, shrubs, bushes, and a few grasses that dominate the foothills and Hawassa City landscapes.
Conversion change maps were analyzed for each period to clearly show the source and destination of the selected land use land cover class. Analysis of the conversion map was computed in ArcGIS desktop 10.8 using spatial analyst extension by overlaying classified images covering 10 years, from 1990 to 2020. Moreover, all change maps show the gross gain and loss of each land cover category during the study periods. The level of conversion varies from one type of LULC to another (Figures 9, 10).
The results of the research, the built-up area increased dramatically from 5% (12.56 sq. km) in 1990 to 18.71% (47.07 sq. km) in 2020. With this percentage growth, even though it decreased from 11.21 sq. km in 1990 to 4.5% in 2020, bushland remained the most common land use category. Between 1990 and 2020, bare land, farmland, forest land, cropland, and water bodies all significantly decreased. The percentage coverage and geographical distribution of land use categories for the years 1990, 2000, 2010, and 2020 are shown in Table 12 and Figures 9, 10.
The high population expansion in the study region can be linked to the significant growth in built-up areas. Between 2010 and 2020, the population of Hawassa increased as a result of Hawassa Industrial Park (HIP), which was the first to open its doors in 2016. The project now employs 20,000 direct employees and 2,000 indirect employees. They plan to have 40,000 direct workers by the end of 2020, reaching the peak by 2025, with 84,000 workers. This can be partly attributed to the architectural changes currently occurring in the region, with more people favoring bungalow-type (single-tenant) houses over compound (multiple-tenant) houses (Grant, 2009). Additionally, economic growth has led to a massive boost in the housing sector. Market forces, rather than urban planning, shape spatial expansion in the region (Figure 12) (Alliance, 2016).
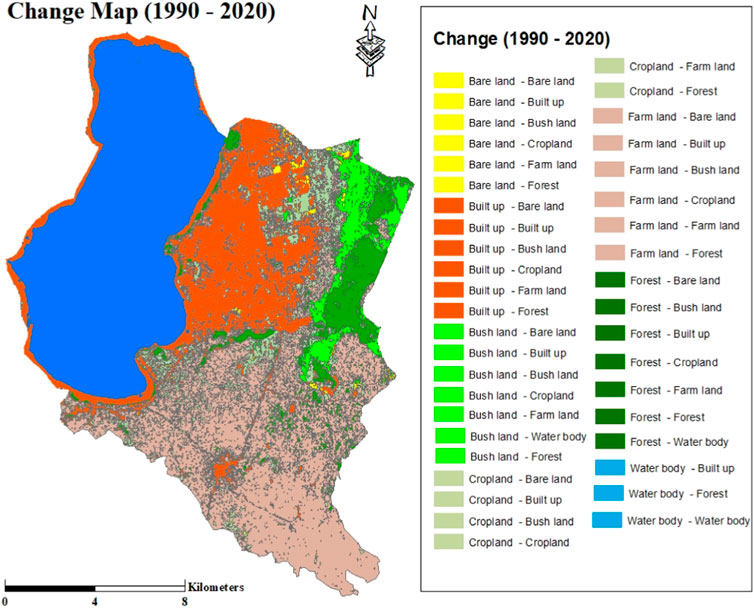
FIGURE 12. Change map showing LULC encroachment between 1990 and 2020. Source: US Geological Survey (USGS) http://glovis.usgs.gov.
This study has investigated physical and socioeconomic driving forces of land use and land cover change. In a case study of Hawassa City, a total of 317 households in the nearby community or peripheral areas of the city were included in the study. To collect data, ArcGIS 10.8, GPS, and GPS Receiver were used to collect data regarding the land use land cover, whereas, questionnaires, key informants, and focus group discussions were used to collect data regarding the effect of urban expansion on the nearby community. LULC driving forces are reported using descriptive statistics such as mean, frequency, percentages, and The Landsat 5, 7, and 8 images that were acquired from USGS. To determine the main socioeconomic driving forces of LULCC and the effectiveness of urban growth continuous variables, the statistical significance of the dummy/discrete variables was also examined using the Chi-square test.
The results of the research show that built-up areas increased dramatically from 5% (12.56 sq. Km) in 1990 to 18.71% (47.07 sq. km) in 2020. With this percentage growth, even though it decreased from 11.21 sq. km in 1990 to 4.5% in 2020, bushland remained the most common land use category. Between 1990 and 2020, bare land, farmland, forest land, cropland, and water bodies all significantly decreased. The percentage coverage and geographical distribution of land use categories for the years 1990, 2000, 2010, and 2020.
The factors leading to built-up land expansion are diverse and complex. We find that three main types of factors drive built-up land expansion: physical factors, socioeconomic factors, and policy factors (Ju et al., 2016). The three types of factors interact with each other, resulting in built-up land expansion. Based on the literature review and available data, physical and socioeconomic factors were selected to be included in the geographical detector (Ju et al., 2016). Policy factors, which also have a significant influence on built-up land expansion, are not included in the geographical detector because they are difficult to express quantitatively and spatially. To overcome this difficulty, this study uses physical and socioeconomic factors as proxies of the policy factors because policy factors interact with physical and socioeconomic factors. Built-up land comprises three second-level types: urban land, rural settlements, and industry traffic land. The data were obtained from the National LULC Database of China and mapped by visual interpretation based on multiple sources of remote sensing data (Zhanget et al., 2014).
This study tests the applicability of the geographical detector for analyzing the mechanism of built-up land expansion (Ju et al., 2016). The method is capable of identifying the relative importance of different factors, the expansion speed of the different levels of each factor, and the interactions between factors. Compared with other methods, the geographical detector has two main advantages. It extracts the implicit interrelationships between factors and geographical phenomena without any assumptions or restrictions concerning explanatory and response variables (Wang and Hu, 2012). Like other spatial statistical methods, the geographical detector can analyze both continuous and categorical factors with only two sets of historical data. Developing such spatial statistical methods to analyze the drivers of built-up land expansion is essential, especially for places without long time-series data. In this study, we analyzed only one period because historical socioeconomic data at the district level of Beijing were not available. We suggest that future studies focusing on larger areas with historical data available could analyze the spatiotemporal variation of factors using the geographical detector.
Regarding the patterns and trends of the urban expansion of Hawassa City, it has been reported that the city has a master plan for the upcoming 10 years and indicated that the city has expanded to incorporate new territory from the nearby land. Since its development into a municipality, private business and government-induced projects along with new services have been launched at an alarming rate. As for the responses, in these years, the city administration launched a 10-year city development plan, which has caused an increment in the demand for residential and investment lands by the citizens.
Previous urban plans for the Greater Cairo Metropolitan Region (GCMR) have been in place since 1956, and new plans were introduced in 1973, 1982, 1991, and 2006 (Osman et al., 2016). However, urban sprawl rates increased over time from 3.4% annually in the 1990s to more than 6.3% in the 2010s (Osman et al., 2016). The failure of authorized urban plans to find the real driving forces of local communities to buildable land demand and use them as pillars to prepare and enforce plans was the main reason for this severe increase in sprawl rates. The GCMR local community has a need for buildable land for residential and business activities, which is largely ignored in authorized urban plans. Therefore, local communities meet these needs through urban sprawl activities outside of the authorized plans. Strict urban planning procedures should be followed to use the active driving factors as tools to direct the urban plans in GCMR in the right way. Otherwise, the negative impacts of urban sprawl will persist haphazardly. Consequently, the outcome of this model can assist decision-makers in managing development by formulating various options for future urban sprawl scenarios (Osman and Monir, 2018).
The qualitative results regarding the effect of Hawassa City urban expansion on the livelihood, overall socioeconomic status, and cultural aspects of peripheral farmers, the participants highlighted that they have faced numerous socioeconomic crises due to urban expansion. They enumerated a decrease in agricultural land and uncontrolled and illegal sewage disposal, which makes the area vulnerable to pandemic diseases; cultural diffusion; and psychological pressure on households and children to practice and cope with the urban styles of life were the main crises faced. Furthermore, the government’s predilection for taking customary lands without paying compensation has given the chiefs extra motivation to sell these lands to private developers (Fiadzigbey, 2006). These, coupled with mismanagement, lack of proper policies, and corruption have led to uncontrolled land acquisition and further contributed to the massive urban expansion occurring in the region, especially on the urban fringes (Larbi et al., 2004).
The city administration should refrain from engaging in anti-farmer ownership policies and practices that can destroy livelihoods or assets and reduce household income through such actions as implementing a horizontal urban expansion policy, offering low compensation rates, evicting farmers from their land and forcing them to leave behind their livelihood, and providing a lack of agricultural extension services in the periphery. Without any options and without creating better economic opportunities need to be reconsidered. An office that coordinates technical support (training and education) should also be re-established to relocate the farming community and create a stable economic environment.
Therefore, this study suggests the following recommendations for future success in urban expansion-related issues:
➢ Urban planning authorities and Hawassa City planners should think about the future growth of the city and understand the consequences of unbalanced physical urban growth and public service and infrastructure supply.
➢ The urban expansion program implemented so far indicates that the communities were not given any input in the planning and implementation of the process. Before displacement, livelihood initiatives like skill development, training, and awareness should be given to families in peri-urban areas to help them diversify their livelihood.
➢ The government must have a responsible body to compensate the people who are displaced from their original land and who lose their agricultural land due to urban expansion. An appropriate compensation package that could replace the resources lost by evicted households should be pursued.
➢ The biggest steps that come to be taken to off get current and future effects of urbanization on the people involve better city management and forward-looking urban planning proper land use policy must be designed in a way that facilitates the expansion of the city in proper plan trained. Better and more efficient urban planning must take place to control urban growth, considering both the physical and human environment. To achieve these administers, municipality officials and professional labor must work together.
Urban expansion is occurring throughout the world at different speeds and in different forms. The main determinants of urban expansion in Ethiopia as a whole, and particularly in the study area, include the decline of agricultural production and land fertility, insufficient land holding and security; population pressure on rural land, rural to urban migration, natural population increase, decentralization of power, and government’s housing policy; urban bias and pro-rich investment approach of the government, the re-classification of rural areas as urban, and exaggerated perceptions of urban life caused by the government mass media agencies.
There is a high residential density of 25,000 people per sq. km near the major city centers and employment sectors of Hawassa City. In the districts of the city that have undergone recent growth, such as Dato, Chefe, Monopol, and Wondo-Tika, there is a medium residential density, with a capacity of 20,000 people per sq. km. The majority of the Hawella-Tula sub-city and the lands along the lake are classified as low- and very-low-density areas, with proposed densities of 15,000 and 10,000 people per sq. km, respectively.
Significant economic, social, political, and cultural benefits can be derived from urbanization. It provides people access to opportunities that are not available in Peri-urban areas, enhances economic and commercial activity, encourages cultural and social integration, and provides better services. It also creates commercial activity, facilitates access to new technologies, and produces new jobs for those seeking work. Political mobilization plays a significant part in the process of democracy growth and democratization.
Beyond the main economic drivers, land serves as a marker of identity and a source of social and cultural values, making it an integral part of humanity. Therefore, when the government is expropriated for another purpose, compensation needs to be paid fairly. Rapid urban growth causes many issues, including the loss of agricultural land, a widening of economic division, land insecurity, a rise in unemployment rates, and a lack of suitable urban services.
Hawassa City is showing rapid demographic consecutive infrastructural improvements and socioeconomic growth and numerous socioeconomic problems such as a high rate of unemployment, social instability, addiction, etc. Urban expansion programs and the inclusion of rural areas within the boundaries of urban areas have highly accelerated the urban modification of peri-urban areas in recent years. This means that most earlier rural land uses like open space, grassland, and forest areas have shifted to residential, industrial, and other various urban uses though that of urban agriculture displayed oscillation.
Hawassa City has been experiencing horizontal urban expansion due to its comfortable landscape, suitable for settlement and other infrastructure development, and its impact is clear to the peripheral farming communities. During the town’s expansion, despite the community’s awareness of the expansion through public orientation and official meeting training, farming communities were not allowed to participate in the decisions about the types and amount of compensation and related benefits they would receive for vacating their land, for the property they lost, and consequently, for the interruption of their livelihood and the resulting impact on their family. In fact, in most developing countries like Ethiopia, participation of stakeholders in decisions regarding urban expansion compensation is not customary. As a result, dissatisfaction with land compensation goes from bad to worse. In the same vein, for most of the households in the study area, the town administration calculated the compensation amounts and/or made decisions regarding housing plots for the displaced placed without an agreement between those receiving the compensation and the responsible bodies.
In terms of policy and strategic limits relating to city expansion, this study found that there was no prior notification or education provided to farmers and expropriated communities. Most expropriated households received less compensation for their land, and most family members under the age of 18 were denied access to even a plot of land. This demonstrates policy and strategy gaps in issues related to the expansion program, and this policy issue has hampered the city’s development and created a severe good governance problem in the area. The concern was raised by nearly all key informants and focus group discussion participants, who said that the valuation of property generated and farmland lost was unfair in contrast to the nationally asserted valuation technique.
The original contributions presented in the study are included in the article/Supplementary Material, further inquiries can be directed to the corresponding author.
Ethical review and approval was not required for the study on human participants in accordance with the local legislation and institutional requirements. Written informed consent from the participants was not required to participate in this study in accordance with the national legislation and the institutional requirements.
Conceptualization: MT and BA; data curation: MT and BA; formal analysis: MT and BA; methodology: MT and BA; software: MT and BA; visualization: MT and BA; writing–original draft: MT and BA. All authors contributed to the article and approved the submitted version.
The authors extend their acknowledgments to Addis Ababa University, Hawassa City Municipality, Hawassa University, and Wolaita Sodo University. The researchers also appreciate the contributions made by various institutions and individuals in providing necessary data. We are also grateful to the experts who shared their knowledge and valuable information to enrich the quality of this paper.
The authors declare that the research was conducted in the absence of any commercial or financial relationships that could be construed as a potential conflict of interest.
All claims expressed in this article are solely those of the authors and do not necessarily represent those of their affiliated organizations, or those of the publisher, the editors and the reviewers. Any product that may be evaluated in this article, or claim that may be made by its manufacturer, is not guaranteed or endorsed by the publisher.
Abate, T., and Angassa, A. (2016). Conversion of savanna rangelands to bush dominated landscape in Borana, Southern Ethiopia. Ecol. Process. 5, 6–18. doi:10.1186/s13717-016-0049-1
Abebe, J. T. (2020). An impacts of urban expansion on the livelihood of farming community in peri-urban areas of dessie town using GIS and remote sensing techniques. J. High. Educ. Serv. Sci. Manag. (JoHESSM) 3 (3).
Adamu, Z. Y. (2014). “Critical analysis of Ethiopian urban land lease policy reform since early 1990s,” in FIG congress, 16–21.
Addis, G. Y. (2010). Spatio-temporal land use/land cover changes analysis and monitoring in Valencia municipality, Spain. An MSc Thesis in Geospatial Technologies at the University of ISEGI. New Lisbon (Portugal), Muenster, IFGI (Germany): University Jaume I Castellon Spain, 69.
Alaci, D. S. A. (2010). Regulating urbanisation in Sub-Saharan Africa through cluster settlements: lessons for urban mangers in Ethiopia. Theor. Empir. Res. urban Manag. 5 (14), 20–34.
Aldrich, J. H., and Nelson, F. D. (1984). Linear probability, logit, and probit models (No. 45). London: Sage pub. Inc, University of Minnesota and Iola.
Alemu, B., Garedew, E., Eshetu, Z., and Kassa, H. (2015). Land use and land cover changes and associated driving forces in north western lowlands of Ethiopia. Int. Res. J. Agric. Sci. soil Sci. 5 (1), 28–44. doi:10.14303/irjas.2014.063
Alemu, Y., and Tolossa, D. (2022). Consultation and displacement in large-scale agriculture investment: evidence from Oromia region’s shashamane rural district. Land 11 (9), 1384. doi:10.3390/land11091384
Alliance, C. (2016). Future proofing cities metropolitan cities in Ghana. London, UK: Arup. Available online: https://www.arup.com/perspectives/publications/research/section/future-cities-africa.
Ambaye, D. W. (2012). Compensation for expropriation in Ethiopia and the UK: a comparative analysis. Bahir Dar UJL 3, 253.
Asghar Pilehvar, A. (2021). Spatial-geographical analysis of urbanization in Iran. Humanit. Soc. Sci. Commun. 8 (1), 1–12. doi:10.1057/s41599-021-00741-w
Banja, T., and Chimdesa, G. (2023). Impact of urban expansion on livelihood of urban fringe agricultural community: a case of ambo town, Oromia, Ethiopia. ISSN: 2165-784X.
Barrett, L., Dunbar, R., and Lycett, J. (2002). Human evolutionary psychology. Princeton, NJ, United States: Princeton University Press.
Benjamin, K., Bouchard, A., and Domon, G. (2007). Abandoned farmlands as components of rural landscapes: an analysis of perceptions and representations. Landsc. Urban Plan. 83 (4), 228–244. doi:10.1016/j.landurbplan.2007.04.009
Bezemer, D. J., and Lerman, Z. (2002). Rural livelihoods in Armenia: the centre for agricultural economic research. Europe-Asia Studies © 2002 University of Glasgow. Discussion Paper No, 4. doi:10.22004/ag.econ.15009
Burka, A. (2008). Land use/land cover dynamics in Prosopis juliflora invaded area of Metehara and the surrounding districts using remote sensing and GIS techniques. Ethiopia: Addis Ababa University.
Campbell, J. B., and Wynne, R. H. (2011). Introduction to remote sensing. New York: The Guilford Press. doi:10.3390/rs5010282
Chipman, J. W., Lillesand, T. M., Schmaltz, J. E., Leale, J. E., and Nordheim, M. J. (2004). Mapping lake water clarity with Landsat images in Wisconsin, USA. Can. J. remote Sens. 30 (1), 1–7. doi:10.5589/m03-047
DeMaris, A. (1992). Logit modeling: practical applications. Newcastle upon Tyne, UK: Sage. Volume 86.
Dfid, D. (1999). Sustainable livelihoods guidance sheets: framework introduction vulnerability transforming. Context 26. org/info/info guidanceSheets.html. [Viewed on 12 June 2007].
Dibaba, R., and Goshu, D. (2019). Small-holder farmers: evidence from Ethiopia. Small 9 (1). doi:10.15414/raae.2018.21.02.103-112
Dingle Robertson, L., and King, D. J. (2011). Comparison of pixel-and object-based classification in land cover change mapping. Int. J. Remote Sens. 32 (6), 1505–1529. doi:10.1080/01431160903571791
Dociu, M., and Dunarintu, A. (2012). The socio-economic impact of urbanization. Int. J. Acad. Res. Account. Finance Manag. Sci. 2 (1), 47–52.
Fiadzigbey, M. E. (2006). “Customary land administration in Ghana. Challenges and prospects,” in XXIII FIG Congress, Munich, Germany, 8-13 October 2006.
Gebreamanuel, D. B., and Mekebo, G. D. (2018). Res nullius vs Res communis in matters of communal lands of smallholder farmers in Ethiopia. Mizan Law Rev. 12 (1), 99–126. doi:10.4314/mlr.v12i1.4
Grant, R. (2009). Globalizing city: the urban and economic transformation of Accra. Ghana: Syracuse University Press.
Hamza, I. A., and Iyela, A. (2012). Land use pattern, climate change, and its implication for food security in Ethiopia: a review. Ethiop. J. Environ. Stud. Manag. 5 (1), 26–31. doi:10.4314/ejesm.v5i1.4
Hawassa City Municipality (2020). Hawassa City government analysis and development of strategic plan report (unpublished) the first five (2020/21-2024/25) and the second five (2025/26-2029/30) years strategic plan Hawassa City planning project office, Hawassa, Ethiopia.
Henderson, J. V. (2003). Marshall's scale economies. J. urban Econ. 53 (1), 1–28. doi:10.1016/S0094-1190(02)00505-3
Hoepfl, M. C. (1997). Choosing qualitative research: a primer for technology education researchers. J. Technol. Educ. 9 (1). doi:10.21061/jte.v9i1.a.4
Holden, S. T., and Tilahun, M. (2020). Farm size and gender distribution of land: evidence from Ethiopian land registry data. World Dev. 130, 104926. doi:10.1016/j.worlddev.2020.104926
Hostert, P., Kuemmerle, T., Prishchepov, A., Sieber, A., Lambin, E. F., and Radeloff, V. C. (2011). Rapid land use change after socio-economic disturbances: the collapse of the Soviet Union versus Chernobyl. Environ. Res. Lett. 6 (4), 045201. doi:10.1088/1748-9326/6/4/045201
Hunziker, M. (1995). The spontaneous reafforestation in abandoned agricultural lands: perception and aesthetic assessment by locals and tourists. Landsc. urban Plan. 31 (1-3), 399–410. doi:10.1016/0169-2046(95)93251-J
Ju, H., Zhang, Z., Zuo, L., Wang, J., Zhang, S., Wang, X., et al. (2016). Driving forces and their interactions of built-up land expansion based on the geographical detector–a case study of Beijing, China. Int. J. Geogr. Inf. Sci. 30 (11), 2188–2207. doi:10.1080/13658816.2016.1165228
Karutz, R., Klassert, C. J., and Kabisch, S. (2023). On farmland and floodplains—modeling urban growth impacts based on global population scenarios in Pune, India. Land 12 (5), 1051. doi:10.3390/land12051051
Kasa, L., Zeleke, G., Alemu, D., Hagos, F., and Heinimann, A. (2011). Impact of urbanization of Addis Abeba city on peri-urban environment and livelihoods. Addis Ababa, Ethiopia: Sekota Dry Land Agricultural Research Centre of Amhara Regional Agricultural Research Institute.
Keenleyside, C., Tucker, G., and McConville, A. (2010). Farmland abandonment in the EU: an assessment of trends and prospects. London, UK: Institute for European Environmental Policy, 1–98. Available at: https://www.researchgate.net/publication/303516870.
Kidane, H., Alemu, Z. G., and Kundhlande, G. (2005). Causes of household food insecurity in Koredegaga peasant association, Oromiya zone, Ethiopia. Agrekon 44 (4), 543–560. doi:10.1080/03031853.2005.9523727
Koroso, N. H., Lengoiboni, M., and Zevenbergen, J. A. (2021). Urbanization and urban land use efficiency: evidence from regional and Addis Ababa satellite cities, Ethiopia. Habitat Int. 117, 102437. doi:10.1016/j.habitatint.2021.102437
Kuntz, K. A., Beaudry, F., and Porter, K. L. (2018). Farmers’ perceptions of agricultural land abandonment in rural western New York State. Land 7 (4), 128. doi:10.3390/land7040128
Lambin, E. F., Geist, H. J., and Lepers, E. (2003). Dynamics of land-use and land-cover change in tropical regions. Annu. Rev. Environ. Resour. 28 (1), 205–241. doi:10.1146/annurev.energy.28.050302.105459
Larbi, W. O., Antwi, A., and Olomolaiye, P. (2004). Compulsory land acquisition in Ghana policy and praxis. Land use policy 21 (2), 115–127. doi:10.1016/j.landusepol.2003.09.004
Leal Filho, W., Mandel, M., Al-Amin, A. Q., Feher, A., and Chiappetta Jabbour, C. J. (2017). An assessment of the causes and consequences of agricultural land abandonment in Europe. Int. J. Sustain. Dev. World Ecol. 24 (6), 554–560. doi:10.1080/13504509.2016.1240113
Ling, G. H., Hob, C. S., and Ali, H. M. (2018). Institutions on public open space governance. Asian J. Environment-Behaviour Stud. 3 (10), 68–77. doi:10.21834/aje-bs.v3i10.314
Lofland, J., Snow, D., Anderson, L., and Lofland, L. H. (2022). Analyzing social settings: a guide to qualitative observation and analysis. Long Grove: Waveland Press.
MacDonald, D., Crabtree, J. R., Wiesinger, G., Dax, T., Stamou, N., Fleury, P., et al. (2000). Agricultural abandonment in mountain areas of Europe: environmental consequences and policy response. J. Environ. Manag. 59 (1), 47–69. doi:10.1006/jema.1999.0335
Macleod, R. D., and Congalton, R. G. (1998). A quantitative comparison of change-detection algorithms for monitoring eelgrass from remotely sensed data. Photogrammetric Eng. remote Sens. 64 (3), 207–216.
Macro, O. (2006). Central statistical agency Addis Ababa, Ethiopia. Ethiopia: Central Statistical Agency Addis Ababa.
Maddala, G. S. (1998). Recent developments in dynamic econometric modelling: a personal viewpoint. Polit. Anal. 7, 59–87. doi:10.1093/pan/7.1.59
Malhotra, N. K., Nunan, D., and Birks, D. F. (2017). Marketing research: an applied approach. Pearson, University of Winchester Georgia Institute of Technology. doi:10.1108/S1548-6435(2006)2
Mikias, B. M. (2015). Land use/land cover dynamics in the central rift valley region of Ethiopia: case of Arsi Negele District. Afr. J. Agric. Res. 10 (5), 434–449. doi:10.5897/ajar2014.8728
Mohamed, A., and Worku, H. (2019). Quantification of the land use/land cover dynamics and the degree of urban growth goodness for sustainable urban land use planning in Addis Ababa and the surrounding Oromia special zone. J. Urban Manag. 8 (1), 145–158. doi:10.1016/j.jum.2018.11.002
Mohr, D., Camplone, G., Wee, D., Moller, T., and Bertoncello, M. (2016). Car data: paving the way to value-creating mobility: perspectives on a new automotive business model. Adv. Ind.
Nikièma, S. H. (2015). L’expropriation indirecte en droit international des investissements. Paris: Presses Universitaires de France 6, Graduate Institute Publications.
Osman, T., Arima, T., and Divigalpitiya, P. (2016). Measuring urban sprawl patterns in greater Cairo metropolitan region. J. Indian Soc. Remote Sens. 44, 287–295. doi:10.1007/s12524-015-0489-6
Osman, T., and Monir, M. (2018). Modelling urban expansion in the greater Cairo metropolitan region. Int. J. Appl. Eng. Res. 13 (10), 8467–8481.
Paulrud, S., and Laitila, T. (2010). Farmers’ attitudes about growing energy crops: a choice experiment approach. Biomass Bioenergy 34 (12), 1770–1779. doi:10.1016/j.biombioe.2010.07.007
Pedhazur, E. J., and Kerlinger, F. N. (1982). Multiple regression in behavioral research: explanation and prediction.
Peneze, Z. (2009). Transformations of the Latvian rural landscape in the 20th and 21stcenturies: causes, processes, tendencies. Riga, Latvia: University of Latvia. PhD.
Pointereau, P., Coulon, F., Girard, P., Lambotte, M., Stuczynski, T., Sánchez Ortega, V., et al. (2008). Analysis of the driving forces behind farmland abandonment and the extent and location of agricultural areas that are actually abandoned or are in risk to be abandoned. Riga, Latvia: European Communities. doi:10.13140/RG.2.1.2467.7849
Pröbstl-Haider, U., Mostegl, N. M., Kelemen-Finan, J., Haider, W., Formayer, H., Kantelhardt, J., et al. (2016). Farmers’ preferences for future agricultural land use under the consideration of climate change. Environ. Manag. 58, 446–464. doi:10.1007/s00267-016-0720-4
Qasim, S., Khan, A. N., Shrestha, R. P., Ahmad, I., and Qasim, M. (2016). The analysis of farmers, perceptions of land management technologies to combat land degradation and desertification in balochistan, Pakistan. J. Appl. Emerg. Sci. 5 (1), pp20–25.
Ravetz, J., Fertner, C., and Nielsen, T. S. (2012). “The dynamics of peri-urbanization,” in Peri-urban futures: scenarios and models for land use change in Europe (Berlin, Heidelberg: Springer Berlin Heidelberg), 13–44. doi:10.1007/978-3-642-30529-0
Salvati, L., and Zitti, M. (2008). Regional convergence of environmental variables: empirical evidences from land degradation. Ecol. Econ. 68 (1-2), 162–168. doi:10.1016/j.ecolecon.2008.02.018
Satterthwaite, D., and Tacoli, C. (2003). The urban part of rural development: the role of small and intermediate urban centres in rural and regional development and poverty reduction (No. 9). London: IIED.
Seifollahi-Aghmiuni, S., Kalantari, Z., Egidi, G., Gaburova, L., and Salvati, L. (2022). Urbanisation-driven land degradation and socioeconomic challenges in peri-urban areas: insights from Southern Europe. Ambio 51 (6), 1446–1458. doi:10.1007/s13280-022-01701-7
Simon, D., McGregor, D., and Thompson, D. (2012). “Contemporary perspectives on the peri-urban zones of cities in developing countries,” in The peri-urban interface (London: Routledge), 26–40. Earth scan. doi:10.4324/9781849775878
Singh, A. (1989). Review article digital change detection techniques using remotely-sensed data. Int. J. remote Sens. 10 (6), 989–1003. doi:10.1080/01431168908903939
Talema, A. H., and Nigusie, W. B. (2023). Impacts of urban expansion on the livelihoods of local farming communities: the case of Burayu town, Ethiopia. Heliyon 9 (3), e14061. doi:10.1016/j.heliyon.2023.e14061
Torquati, B., Giacchè, G., and Tempesta, T. (2020). Landscapes and services in peri-urban areas and choice of housing location: an application of discrete choice experiments. Land 9 (10), 393. doi:10.3390/land9100393
Tsegaye, G., and Bekele, W. (2010). Farmers’ perceptions of land degradation and determinants of food security at Bilate Watershed, Southern Ethiopia. Ethiop. J. Appl. Sci. Technol. 1 (1), 49–62. doi:10.13140/RG.2.1.3382.8968
United Nations Human Settlements Programme (2010). Citywide action plan for upgrading unplanned and unserviced settlements in Dar es Salaam. UN-HABITAT.
United States Geological Survey (USGS) (1990). “Earth explorer, Landsat data archive,” in U.S geological Survey [USGS], 1990-2020, Landsat archive. Available online at: satellite-imagery https://earthexplorer.usgs.gov/.
van Vliet, J., Bregt, A. K., Brown, D. G., van Delden, H., Heckbert, S., and Verburg, P. H. (2016). A review of current calibration and validation practices in land-change modeling. Environ. Model. Softw. 82, 174–182. doi:10.1016/j.envsoft.2016.04.017
Wang, D., Morton, D., Masek, J., Wu, A., Nagol, J., Xiong, X., et al. (2012). Impact of sensor degradation on the MODIS NDVI time series. Remote Sens. Environ. 119, 55–61. doi:10.1016/j.rse.2011.12.001
Weldesilassie, A. B., Gebreeyesus, M., Abebe, G., and Aseffa, B. (2017). Study on industrial park development: issues, practices and lessons for Ethiopia. Addis Ababa, Ethiopia: Ethiopian Development Research Institute.
Woldehanna, T. (2008). Determinants of poverty in rural and urban Ethiopia. Ethiop. J. Agric. Econ. 7 (1), 1–23.
World Bank (2003). Global economic prospects 2004: realizing the development promise of the Doha Agenda. Washington: The World Bank.
World Bank Group (2019). Minister of Urban Development and Construction Federal Democratic Republic Ethiopia. World Bank.
Zeleke, G., and Hurni, H. (2001). Implications of land use and land cover dynamics for mountain resource degradation in the Northwestern Ethiopian highlands. Mt. Res. Dev. 21 (2), 184–191. doi:10.1659/0276-4741(2001)021[0184:IOLUAL]2.0.CO;2
Zewdu, T. (2021). Assessment on the effects of urban expansion on the livelihood of peripheral farmers: the case of shewarobit town; Ethiopia. Doctoral dissertation.
Keywords: Hawassa Industrial Park, land use, livelihood, probit model, urban expansion
Citation: Tessema MW, Abebe BG and Bantider A (2024) Physical and socioeconomic driving forces of land use and land cover changes: the case of Hawassa City, Ethiopia. Front. Environ. Sci. 12:1203529. doi: 10.3389/fenvs.2024.1203529
Received: 10 April 2023; Accepted: 29 January 2024;
Published: 08 March 2024.
Edited by:
Luis A. Ruiz, Universitat Politècnica de València, SpainReviewed by:
Amar Razzaq, Huanggang Normal University, ChinaCopyright © 2024 Tessema, Abebe and Bantider. This is an open-access article distributed under the terms of the Creative Commons Attribution License (CC BY). The use, distribution or reproduction in other forums is permitted, provided the original author(s) and the copyright owner(s) are credited and that the original publication in this journal is cited, in accordance with accepted academic practice. No use, distribution or reproduction is permitted which does not comply with these terms.
*Correspondence: Mefekir Woldegebriel Tessema, d21lZmVraXJAZ21haWwuY29t
Disclaimer: All claims expressed in this article are solely those of the authors and do not necessarily represent those of their affiliated organizations, or those of the publisher, the editors and the reviewers. Any product that may be evaluated in this article or claim that may be made by its manufacturer is not guaranteed or endorsed by the publisher.
Research integrity at Frontiers
Learn more about the work of our research integrity team to safeguard the quality of each article we publish.