 Di Guo1
 Danlan Xie
94% of researchers rate our articles as excellent or good
Learn more about the work of our research integrity team to safeguard the quality of each article we publish.
Find out more
ORIGINAL RESEARCH article
Front. Environ. Sci., 11 April 2024
Sec. Environmental Economics and Management
Volume 12 - 2024 | https://doi.org/10.3389/fenvs.2024.1155409
Humanity has consumed a large amount of energy and resources to maintain the rapid development of the economy and society, causing greenhouse gas and air pollutants to rise continuously, generating enormous pressures for the sustainable development of many cities. It is economical to control greenhouse gas and air pollutants from the synergy perspective. To identify the key driving factors involved in synergistic control, this paper uses the pressure-state-response (PSR) model to design a performance evaluation model of greenhouse gas and air pollutants synergistic control (GASC) utilizing pressure, state, and response dimensions. The performance evaluation factor system of GASC comprises three primary aspects and 18 criteria. The analytic hierarchy process (AHP) was used to determine the weight of each factor in the evaluation system. The technique for order preference by similarity to an ideal solution (TOPSIS) method was used to calculate the ranking of the synergistic control effects of the four representative provinces in China. We use Importance-performance analysis (IPA) to analyze the performance of driving factors of synergistic control in the province with the lowest ranking from 2016 to 2020. The research shows that in Northeast China, represented by Liaoning province, the government’s response should include changing the support strategy for the new energy consumer, introducing synergistic control standards and policies, and making flexible adjustments to the supply chain. The research provides a scientific basis for the performance evaluation of GASC and decision-making support for lean response strategies.
Greenhouse gas and air pollutants have brought double pressure to the sustainable development of cities. Though greenhouse gas and air pollutant emissions in most cities are controlled in practice, they are disposed of separately with different regulatory subjects and methods (Premakumara et al., 2018; Nelson, 2023). Separate governance can lead to conflicts among different policies, waste resources, and ultimately reduce the effectiveness of governance, hindering the development of green industries. Therefore, exploring the synergistic effect between carbon and air pollutants and determining the driving force of policies are key issues for urban environmental security.
In this paper, we explore the answers to the following research questions: Which dimensions are used to evaluate the effect of GASC? How to determine the impact weight of factors in the evaluation system? How to identify key factors hindering the effectiveness of synergistic control based on practical data? This paper uses the Delphi method and pressure-state-response (PSR) model to determine the evaluation factor system of GASC, the analytic hierarchy process (AHP) method to determine the weight of each evaluation factor, the technique for order preference by similarity to an ideal solution (TOPSIS) method to conduct a horizontal comparison of performance among multiple provinces in China, and importance-performance analysis (IPA) to vertically compare the performance changes of the province with the lowest performance for five consecutive years, so as to identify the key factors hindering the effectiveness of synergistic control.
This paper explores a multidimensional GASC scheme of “Energy-Environment-Economy” and evaluates the impact of synergistic control factors on the economy and the environmental benefits associated with emission sources, diffusion paths, green governance technologies and other aspects, while identifying key factors. Meanwhile, on the basis of regional differences, this paper evaluates the policy performance of key factors and provides reasonable suggestions for policy adjustment.
The paper identifies the key driving factors and puts GASC under a unified framework mechanism, prevents the benefit contradiction among different policies, and significantly reduces governance costs. At the same time, the paper forwards the critical paths to ensure that the synergistic control scheme matches the characteristics of the implementation objects. The structural framework of the remainder of this paper is as follows: Section 2 presents a literature review and builds a prototype decision structure for GASC. Section 3 introduces the methodology used. Section 4 evaluates the GASC performance of representative provinces and identifies the critical obstacle factors. Section 5 discusses related implications for management, and Section 6 summarizes the conclusions of this paper.
Research on air pollution control has always been a hot issue and can be traced back to the early 20th century. The research content is mainly divided between the theoretical and practical fields. The common control theories are policy tool theory and synergistic control theory (Howlett and Ramesh, 2006), and governance practice mainly focuses on the strategies adopted by different countries and regions according to their respective atmospheric environment characteristics (Gulia et al., 2022; Mir et al., 2022; Cheng et al., 2023; Lopes et al., 2023). In recent years, as the concept of green and low-carbon has won support among the people (Yang et al., 2022; Yang et al., 2023), scholars have begun to attach importance to the governance of greenhouse gases. Some countries began to propose greenhouse gas and air pollutants synergistic control (GASC) in the form of laws. The emission of greenhouse gases and air pollutants is characterized by “same root” (mainly from fossil fuel emissions), “same source” (from the same equipment and emission outlet), and “simultaneous” (mainly from the combustion process). Therefore, there is a strong “synergy effect” between emission reduction and pollution governance. Scholars conducted extensive research on synergistic effects. Zhang et al. (2023) analyzed the synergistic effect between air pollutants and greenhouse gases emission. Yan (2017) found that the synergistic effect was strongly associated with the degree of urbanization in different regions. Zhang et al. (2015) estimated the synergistic effect of CO2 and air pollutant emission reduction by using the energy-saving supply curve and the greenhouse gas and air pollution interactions and synergies model. The impact of policies on synergistic effects is also one of the research hot spots. Li et al. (2017) studied the overall impact of China’s actual air pollution regulatory policies on greenhouse gas reduction based on the theoretical framework of synergies and empirical analysis. Braspenning Radu et al. (2016) proposed to use the IMAGE2.4 framework to explore how different future climate conditions and air pollution policies affect greenhouse gas and air pollutant emissions. Nam et al. (2014) employed a game equilibrium model to set up scenarios according to the policy portfolio and investigated the response of China and the United States to the policy portfolio of GASC.
From the academic research results, research on air pollution control started earlier, and more recently, greater attention has been paid to the control of greenhouse gas emissions. After China promised the world that it would reach the peak of carbon in 2035 and achieve carbon neutrality in 2060 (Wang et al., 2021), more and more scholars’ research enthusiasm for greenhouse governance is rising to unprecedented heights, which has led to a worldwide upsurge in this field. Golpîra and Javanmardan, 2022 focused on developing an optimal sustainable closed-loop supply by considering carbon emission schemes, and Park et al., 2022 compared the effects of different policies on carbon emissions and carbon governance. It should also be noted that research on GASC has been conducted for a relatively short period. In practice, carbon source reduction measures (Yan et al., 2022), carbon absorption technologies (Sheng et al., 2023), and carbon sink trading (Ke et al., 2023) are widely used in greenhouse gas control. In the field of air pollution management, the main measures include strict control of high energy consumption and new production capacity in high-pollution industries, accelerating the adjustment of energy structure, and increasing the collection of pollution fees. Some countries incorporate heavily polluted weather into local government emergency management for emergencies (Duan et al., 2023). It can be seen that various countries have made a lot of efforts to control greenhouse gas and air pollutants, but greenhouse gas and air pollutant emissions in most countries are controlled separately. Scholars have demonstrated through various methods the synergistic effects of carbon and air pollutant governance in different regions and industries, and also the important guiding role of policies for GASC. However, the research on the identification of factors that play a crucial role in GASC and the evaluation performance of policy intensity for key factors is still in the initial stage.
The PSR model is an evaluation model commonly used in monitoring the environment, which is mainly divided into three dimensions: pressure, state, and response (Sahana et al., 2022). Each dimension is composed of many influencing factors (Chung and Lee, 2009). With the continuous improvement of the PSR model and the development of environmental performance evaluation, its application in the field of the environment has become more common (dos Santos Sá et al., 2022; Sahana et al., 2022; Tu et al., 2022; Zhu et al., 2022). Ana et al. (2022) used the PSR model to assess the environmental quality of transitional waters along the tropical coastline of Brazil, and it was applied by Zhu et al. (2022) to evaluate the environment of an abandoned area. Tu et al. (2022) adopted the PSR model to assess biodiversity in the near-shore waters of Tianjin city, while Cheng et al. (2021) used it to evaluate the ecological security of land resources in mainland China. Indeed, Li et al.‘s study (2021) applied the model to evaluate alpine pastoral ecosystem health. Zhang et al. (2023) based on PSR model to construct an assessment index system to identify the ecological problems of each region in China. Xie et al. (2023) used the PSR model to vertically evaluate Yunnan’s ecological security and horizontally compared ecological security between Yunnan and other four neighboring provinces.
In addition to the above environmental fields, the PSR model is also widely adopted in atmospheric environment fields. Yang et al. (2019) used PSR model to examine the impact of urbanization on the air environment in Shandong Province with factor component analysis. Li (2016) built the atmospheric environmental management performance evaluation system according to the PSR model. The system can achieve a comprehensive evaluation, reveal the relationship between the evaluation factors, and it can be easily adapted to conduct atmospheric environmental governance analysis (Li, 2016). Adopting the evaluation system of PSR, Xiong and Liu, (2018) analyzed the principal components of the Beijing-Tianjin-Hebei region and the Yangtze River Delta urban agglomerations’ treatment of air pollution. Under the PSR framework, Zhang et al. (2020) designed the evaluation system for air pollution prevention and control performance auditing, and further used the entropy weight method and fuzzy comprehensive evaluation method to evaluate the status of air pollution prevention and control performance auditing.
It is more logical to divide evaluation indicators into different categories based on the PSR model, which has been widely used by scholars in the field of environments, especially the atmospheric environment field. It has become a widely recognized model and mature framework in the field of environmental performance evaluation. Therefore, the PSR model is suitable for studying the performance evaluation of GASC and has practical application value.
One of the key problems encountered in a performance evaluation of GASC is the criteria selection. The selection of different criteria produces great differences in evaluation results. Establishing a comprehensive and effective evaluation criteria system is the key to accurately and qualitatively evaluating the performance of GASC. Scholars construct different evaluation criteria systems by using various perspectives to evaluate the performance of atmospheric environmental management. Examining the severe air pollution problem of the Beijing-Tianjin-Hebei region, Li et al. (2020) established an environmental performance evaluation model for air pollution control consisting of four parts, namely, economic benefits, public service, government management and development potential. Guo et al. (2011) constructed an index system from input and output indicators, and considered CO2 and energy structure adjustment, but ignored the emission of other air pollutants in energy consumption. Xiong et al. (2019) considered CO2 emissions as an undesirable output for analyzing the impact of industrial structures on energy efficiency. Ye et al. (2020) determined the criteria by considering two aspects: air pollutants and technological innovation. Aung, (2017) selected criteria to evaluate the implementation of an environmental impact assessment system while considering four aspects: legislation, management, process and measures. Clausen et al. (2011) selected evaluation criteria by referring to four factors: environmental, economic, political and social factors. Xue et al. (2023) established an index system consisting of index for synergistic assessment and its two subindices: index for HII assessment and the index for CEI assessment. Wu et al. (2021) established a novel index system that considered four dimensions: supervisory, environment, society and economy. Zhou et al. (2018) indicated that the unification of air pollution, wastewater, and solid waste will lead to the comprehensive calculation of the efficiency of environmental pollution control. Zhou et al. (2024) combined three essential dimensions: effectiveness, efficiency, and equity assessment to build integrated assessment framework of air pollution emission permit allocation. Li et al. (2023) used fixed asset investment, energy consumption, and employment as the input indicators. Industrial output was considered an indicator of desirable output, whereas pollutant emission was the indicator of undesirable output.
Selecting the evaluation criteria scientifically and reasonably can not only reflect the particularity of the atmospheric environment which is being examined but can comprehensively and accurately evaluate the performance of GASC. By referring to literature publications produced by different scholars, it is possible to adopt evaluation criteria using multiple perspectives, which provides a reference for the selection of the criteria applied in this paper.
Given the frequent problems that are encountered with air pollution and the fact that greater attention has been paid to carbon emissions in recent years, the development of an effective environmental performance evaluation model for air pollution has occurred rapidly. Air quality modeling has been used to study and guide environmental decision-making in North America, Europe, and China for years (Palacios et al., 2002; Cohan et al., 2007; Carnell, 2019; Yang et al., 2019). Vautard et al. (2007) used different air quality models to simulate and evaluate the impact of ozone and particulate matter 10 concentrations on air quality in the European region, while Li W. et al. (2021) explored the application of an air quality model for air pollution control in the Sichuan Basin. Furthermore, East et al. (2021) employed air quality modeling to develop pollution mitigation strategies in a Latin American megacity. In the field of atmospheric collaborative control, many scholars have conducted relevant research using different methods, Yi et al. (2023) used the composite system synergy model to measure the level of China’s synergistic governance integrating process governance and outcome governance. Zhou et al. (2022) examined the effects, spatial effects, and transmission mechanisms of the digital economy on the synergistic control of carbon and haze using the econometrics method. Yi et al. (2022) integrated a synergy measure model and spatial panel model to quantitatively explore the spatial distribution of the CASD in 30 China’s provinces and its influencing factors. Dong et al. (2019) explored the mechanism of changes in PM2.5 emissions and quantified the impacts of CO2 emissions reduction activities on PM2.5 emissions reduction. Jia et al. (2023) adopted the LMDI method to analyze the influencing factors of PM2.5 emissions from CC and the synergy of CO2 and PM2.5 emissions was quantified. In addition to the above methods, Multiple-criteria decision-making (MCDM) can help solve a single problem affected by multiple factors, and the performance evaluation of atmospheric environmental management is a single problem affected by many factors. Therefore, MCDM is a mature approach that is widely applied in the performance evaluation of atmospheric environmental governance. Li et al. (2020) assessed different stages of air pollution management in Beijing-Tianjin-Hebei by applying a multi-level fuzzy comprehensive evaluation, which combined the entropy weight method and AHP, as well as a back-propagation neural network. Ye et al. (2020) proposed a new efficiency evaluation model, namely, the interval evidential reasoning and the interval data envelopment analysis-model, to evaluate the efficiency of air pollution management, while Zhou et al. (2010) utilized the DEA model to evaluate the efficiency of air pollution management. Toshiyuki et al. (2015) utilized DEA method for assessment on its regional performance by incorporating PM2.5 and PM10 as undesirable outputs. Zhou et al. (2020) constructed window DEA model to compute the dynamic air quality index after applying hierarchy analysis to resolve the heterogeneity of time varying data. Wu et al. (2021) assessed air pollution prevention and control under collaborative supervision in the Beijing-Tianjin-Hebei region based on combination weights and grey fuzzy synthetic evaluation analysis. Xue et al. (2023) evaluated the gradation of sub-regions by applying a TOPSIS-grey relational comprehensive simulation model.
The MCDM framework includes a variety of methods, among which AHP and TOPSIS are representative. The comprehensive AHP-TOPSIS method is widely used for evaluating problems that are influenced by multiple factors. Menon and Ravi, (2022) proposed a combined AHP-TOPSIS multiple criteria decision-making approach to select sustainable suppliers while considering the uncertainty involved to evaluate quantitative and qualitative data. Ganesh et al. (2015) suggested the use of a multi-criteria decision-making model to identify the critical path in road transport networks by employing an integrated fuzzy AHP–fuzzy TOPSIS method. Nazim et al. (2022) applied an integrated fuzzy AHP–TOPSIS method to evaluate different software requirements. Therefore, the comprehensive AHP-TOPSIS method can effectively solve the problem of performance evaluation with respect to GASC.
Based on the aforementioned literature, the evaluation criteria of GASC were selected and integrated. According to the PSR model, these evaluation criteria were classified into three dimensions: i) pressure, ii) state, and iii) response. Then, according to the meaning of each criterion, the criteria with the same meaning were deleted. Following these steps, this paper is able to propose a prototype of a decision structure consisting of three aspects and 18 criteria. A detailed description of each evaluation criterion is shown in Table 1.
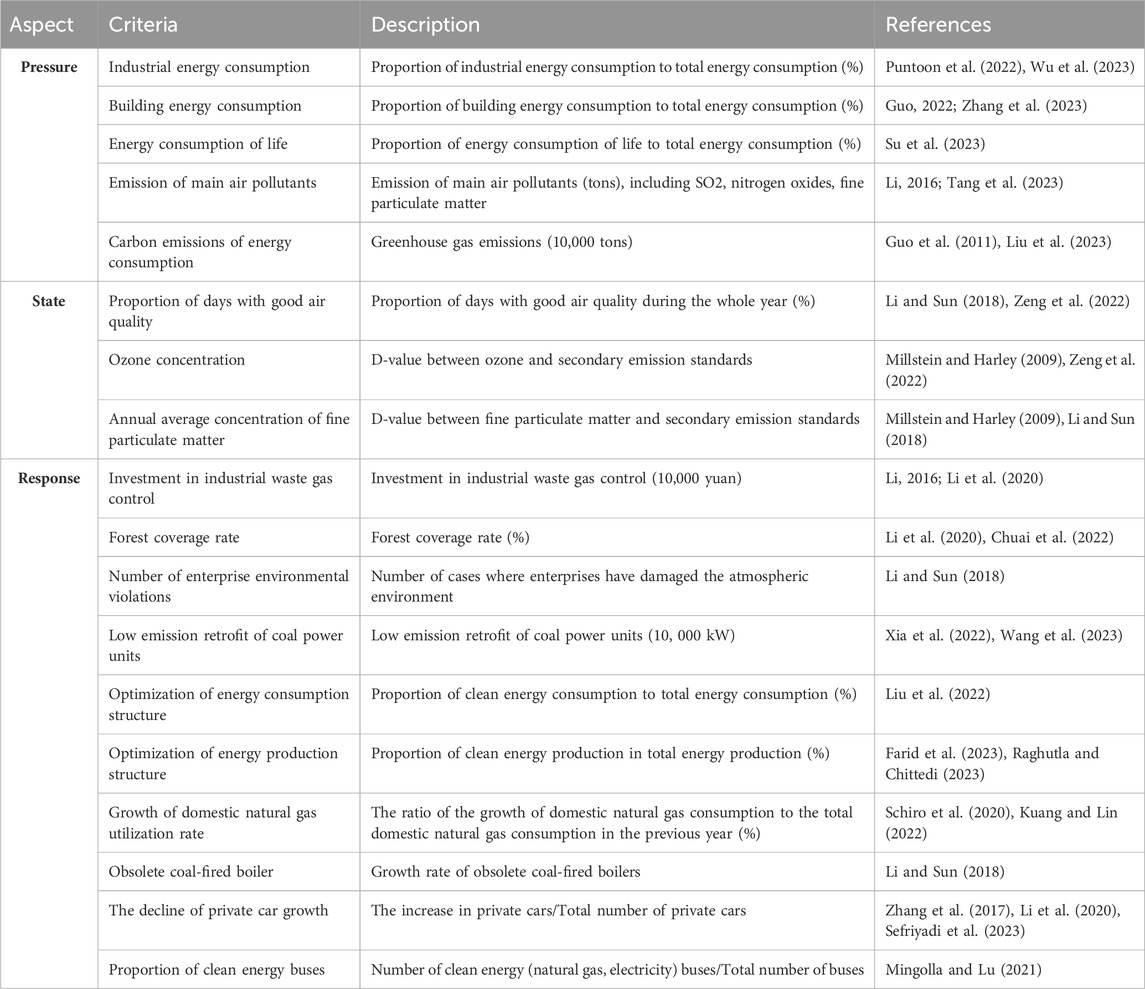
Table 1. Prototype decision structure.
Through the literature review above, we found that many scholars have studied the GASC. However, there is a lack of research on identifying and evaluating the factors that affect GASC. Therefore, further research is needed on this issue. When studying atmospheric environmental issues, the PSR model has been widely applied and is relatively mature. It has been proven through literature by many scholars that this model is very suitable for studying the performance evaluation of GASC. Based on the PSR model, the criteria selection is a key issue in GASC performance evaluation. Many scholars have constructed different evaluation criteria systems but found them to be incomplete. Therefore, we referred to a large number of evaluation criteria systems in different literature and organized and merged them to establish a comprehensive and effective evaluation criteria system to prepare for subsequent research. For environmental performance evaluation, many scholars have used different methods. By comparing some methods, we found that the comprehensive AHP-TOPSIS method can effectively solve the performance evaluation of GASC.
GASC effect evaluation is a typical MCDM problem. To solve this problem, it is necessary to first construct a formal decision structure. Based on the preliminary statistical analysis of decision structures in the literature review section, the Delphi method was chosen to collect anonymous expert suggestions multiple times. Experts interpret each criterion and rate its necessity (Skulmoski et al., 2007; Boulkedid et al., 2011). After collecting expert opinions multiple times, we use the consensus deviation index (CDI) for consistency assessment, the consensus was ultimately reached. This method invites experts to participate in prediction, and makes full use of expert knowledge and experience. Adopting the principles of anonymity or “back-to-back” consultations can help each expert to reach their own judgments independently and freely. Several rounds of feedback during the prediction process allow the experts to gradually reach a consensus (Landeta, 2005). Secondly, determine the weights of each criterion. As is well known, there are various methods for calculating weights, such as AHP, ANP, entropy weight, etc. Each method has its own advantages and disadvantages, as well as its unique applicability. For example, ANP is the general form of AHP, emphasizing the existence of a dependency relationship between aspects and criteria, that is, the mutual influence relationship between aspects and criteria. Entropy weight is not a true weight, but a measure of the degree of system data clutter. The higher the data clutter, the greater the entropy weight. Therefore, it is not used in most decision problems. However, AHP emphasizes the independence between aspects and criteria, which means that if the aspects and criteria are mutually independent, only the AHP method can be used. The hierarchical structure constructed in this study has an independent relationship between the aspects and criteria. Therefore, AHP is an appropriate method. Then, conduct a multi criteria scheme evaluation, namely, the GASC effect evaluation of typical provinces in China. The evaluation in this section is based on real data from each province. The advantage of TOSIS is that it can fully use the information of the original data, and its results can accurately reflect the differences between various evaluation schemes. Finally, the IPA method can be chosen. The IPA analysis method uses importance evaluation data as the horizontal axis and performance evaluation data as the vertical axis, thus dividing them into four quadrants, representing different regions. Vertical comparison and analysis of real data from a province in the past 5 years, in-depth analysis of the core issues of the province, laying the foundation for proposing suggestions.
First, on the basis of a literature review, the Delphi method is used to determine the formal decision structure, as shown in Section 3.1. Second, AHP is used to determine the weight of each criterion, as shown in Section 3.2. Finally, the TOPSIS method is used to comprehensively evaluate the effect of GASC, as shown in Section 3.3. The overall research approach is shown in Figure 1.
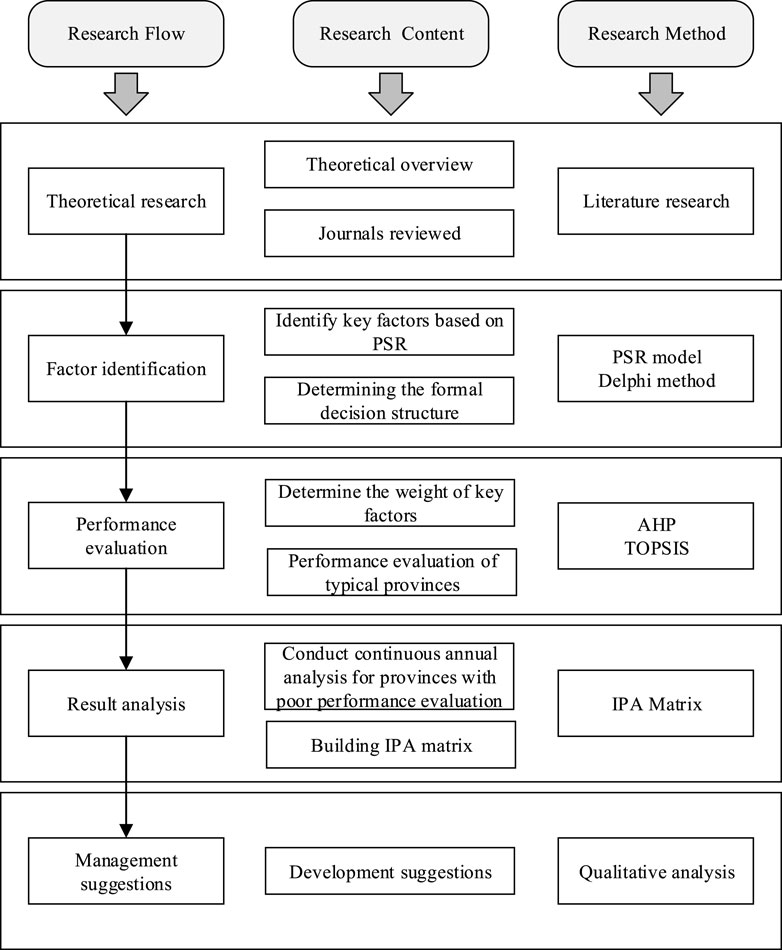
Figure 1. An overall flowchart of methodology.
The Delphi technique was proposed by the RAND Corporation (Schmidt, 1997). In this paper, the consensus deviation index (CDI) (Zhang et al., 2022), namely, the mean divided by the variance, is applied to determine consensus.
According to the prototype decision structure based on the results of interviews, an open-ended questionnaire was distributed to each expert. Based on their experience, the experts judged whether the listed factors were suitable for GASC, and checked whether the definitions of the criteria were clear.
In the second round of the Delphi questionnaire, the experts scored the factors on a scale ranging from 0 to 10. A score of 0 was taken to indicate that the factor was absolutely unnecessary and a score of 10 indicated that it was absolutely necessary. The CDI was used to calculate the consensus degree of the expert panel.
In the third round of the Delphi questionnaire, the mean value and standard deviation of the second-round questionnaire completed by all of the experts were presented. The experts whose scores exceeded the mean value plus or minus one standard deviation in the second round were asked to explain their reasoning before they assigned new scores.
If the experts did not agree after the second round, the researchers conducted a third round of questionnaires until a consensus was reached. A value of 0.2 was taken as the threshold of the CDI; if the latter exceeded 0.2, this indicated a significant divergence in the experts’ opinions, and a further round of expert scoring was required until all the CDI values were lower than 0.2 (Zhang et al., 2022). The procedures involved in the Delphi technique are briefly illustrated in Figure 2.
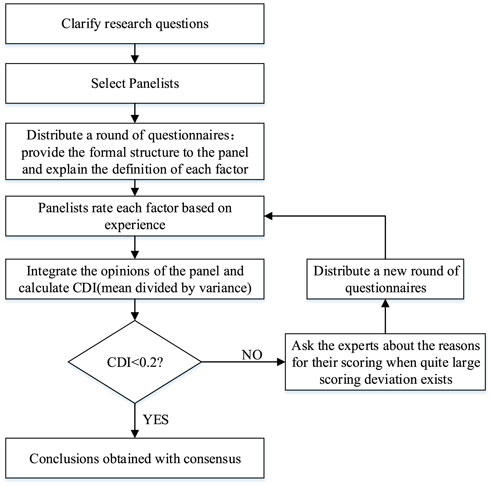
Figure 2. Procedure of the Delphi technique.
Analytic Hierarchy Process is a decision-making method. Decompose elements related to decision making into levels such as goals, criteria, and plans. On this basis, conduct qualitative and quantitative analysis. The procedure of the AHP is as follows:
Step 1:Build the AHP Hierarchy Model.
The formal decision structure is divided into the hierarchical structure of the AHP. In general, the hierarchy includes a target layer, criterion layer and scheme layer.
Step 2:Build a pairwise judgment matrix.
The pairwise judgment matrix is used to judge the importance of two criteria in the same level. It is usually presented in the form of a numerical value, which is the key link to convert a qualitative judgment into a quantitative analysis. Questionnaires are issued to the expert group established by the Delphi method, and the experts assign scores according to the experience. By means of pre-integration, it is necessary to calculate the geometric mean value of the expert group’s scores on the importance degree, and form several pairwise judgment matrices. At present, a nine-point scale is mainly used for scoring purposes, whereby scores of one–9, and the reciprocal, are used as scales to indicate the importance of a pairwise comparison between criteria. The specific meaning of each scale is shown in Table 2. (
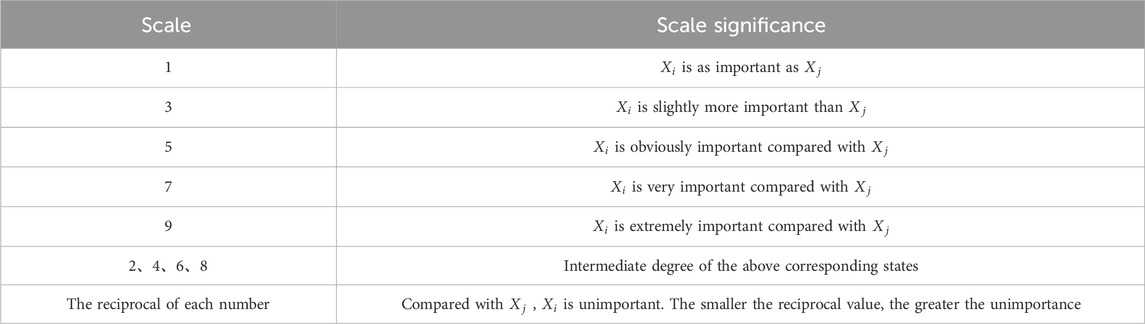
Table 2. Scale significance of the 9-level scale.
Step 3:Calculate the relative weight of criteria.
According to Perron-Frobenius Theorem, the essence of the calculation of the relative weight of the criterion is to calculate the maximum eigenvalue of the matrix and the corresponding eigenvector. The procedure is as follows:
• Data normalization. Normalize the data of each column of criteria in the matrix according to the following formula to form a new data matrix.
• Calculate
• Normalize the vector w to form the vector
Calculate the relative weight of the criterion; that is, the maximum eigenvalue of the matrix, and check the consistency. The obtained eigenvector can only be deemed reliable and applicable if the judgment matrix passes the consistency test. The formula of the consistency test is:
Where,
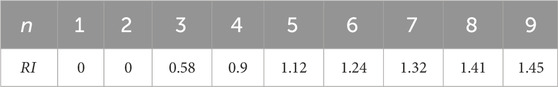
Table 3. Average random consistency criteria.
Where,
Where,
Step 4: Calculate the composite weight of the criteria.
When the relative weight of the indicators has been determined, the calculation of the composite weight of the indicators is relatively simple. The formula is:
TOPSIS is based on the fundamental premise that the best solution should have the shortest distance from the positive-ideal solution, and the longest distance from the negative-ideal one. Alternatives are ranked with the use of an overall index calculated based on the distances from the ideal solutions (Chakraborty). TOPSIS and VIKOR are essentially compromise sorting methods. TOPSIS and VIKOR were compared in four aspects: procedural basis, normalization, aggregation, and solution, proving that the biggest drawback of TOPSIS method is the vector normalization formula (Opricovic and Tzeng, 2004). Vector normalization cannot effectively solve the requirement of linear normalization processing on data. Therefore, if the normalization formula is unified into a linear normalization formula, usually the results obtained by the two methods are not different. In this paper, we use linear normalization method to process data, as shown in formula 9 below. The procedure of the TOPSIS is as follows:
Step 1: The matrix is established according to the original data. Assuming that the evaluation object is
Step 2: The criterion attribute assimilation processing, namely, the negative criterion, is transformed into a positive criterion, the formula for which is as follows:
Let
Step 3: The normalized matrix is obtained by normalizing the data after index convergence. Vector normalization cannot effectively solve the requirement of linear normalization processing on data. Therefore, if the normalization formula is unified into a linear normalization formula, usually the results obtained by the two methods are not different (Serafim et al., 2004). In this paper, we use linear normalization method to process data, and the formula is as follows, effectively solving this problem.
Where,
Step 4: Weighted normalized matrix
Step 5: Find positive and negative ideal solutions.
Step 6: Obtain the separation values.
The separation measure is the distance of each alternative rating from both the positive and negative ideal solutions. This is obtained by applying the Euclidean distance theory. Eqs 12, 13 set forth the process for positive and negative separation calculations, respectively.
Where,
Step 7: Calculate the overall preference score
Step 8:Alternatives are ranked based on higher
The Importance Performance Analysis model was first proposed by Martilla and James in 1977 and was initially used for performance analysis of automotive dealerships. Due to its intuitive and practical nature, it has been widely used in academia. The IPA analysis method uses importance evaluation data as the horizontal axis and performance evaluation data as the vertical axis, thus dividing them into four quadrants, representing different regions, as shown in Figure 3.
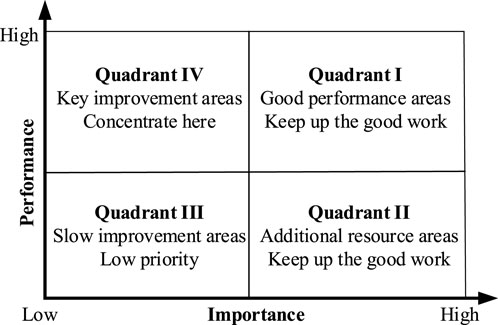
Figure 3. IPA quadrant diagram.
Quadrant I is a well performing area with high importance and performance, which needs to be maintained; Quadrant II is a key improvement area with high importance and low performance, which requires key improvement; Quadrant III is a slow improvement area, with low importance and performance, and the lowest priority level; Quadrant IV is an additional resource area with low importance and high performance, and does not require excessive investment.
In recent years, China has attached great importance to GASC. In 2015, the country amended the law and proposed GASC. In 2018, the country set up the Ministry of Ecology and Environment to connect carbon monoxide and carbon dioxide, making coordinated control possible. In 2020, the country stated its aim to achieve peak carbon dioxide emissions by 2030, and carbon neutralization by 2060. Recently, the Ministry of Ecology and Environment has highlighted the need to promote synergy in the aspects of climate change and pollution control, ecosystem protection and restoration at a meeting briefing in an effort to actively respond to climate change.
Under the guidance of national policies, all provinces and cities in China have responded positively and taken corresponding measures which focus on end treatment, improvement in energy efficiency and structural adjustment. We decided to select representative provinces with different locations and economic levels for the analysis. Guangdong Province, located in the south of China, was ranked first in terms of GDP for many consecutive years, representing the first-tier province with relatively rapid economic development; Zhejiang Province, located in the east coast of China, is dominated by the manufacturing industry. New industries borne from advanced equipment manufacturing, new energy, new technology, energy conservation and environmental protection also take the lead in China, and have led to the creation of a province with strong development momentum; Hubei Province is located in inland China. Its advantageous industries are concentrated in metallurgy, automobiles, textiles, building materials and other traditional polluting industries, and its GDP is ranked at the upper reaches, which means that the province has a stronger economy dominated by traditional industries; Liaoning Province is located in the north of China. Its advantageous industries are concentrated in resource mining, processing, machinery and equipment manufacturing and other highly polluting industries. Its GDP ranks in the middle and lower reaches, and the province is dominated by traditional industries. This paper selects all four representative provinces, evaluates the effect of their collaborative governance, identifies regions with relatively backward collaborative governance, analyzes the effect of their governance in detail from multiple perspectives, and puts forward corresponding development suggestions.
The Delphi method was used to screen and optimize the initial set of effect factors in GASC. Six experts, with rich practical experience and a strong theoretical background in pollution control, environmental assessment, environmental protection technology, and environmental consulting, were selected, as shown in Table 4.
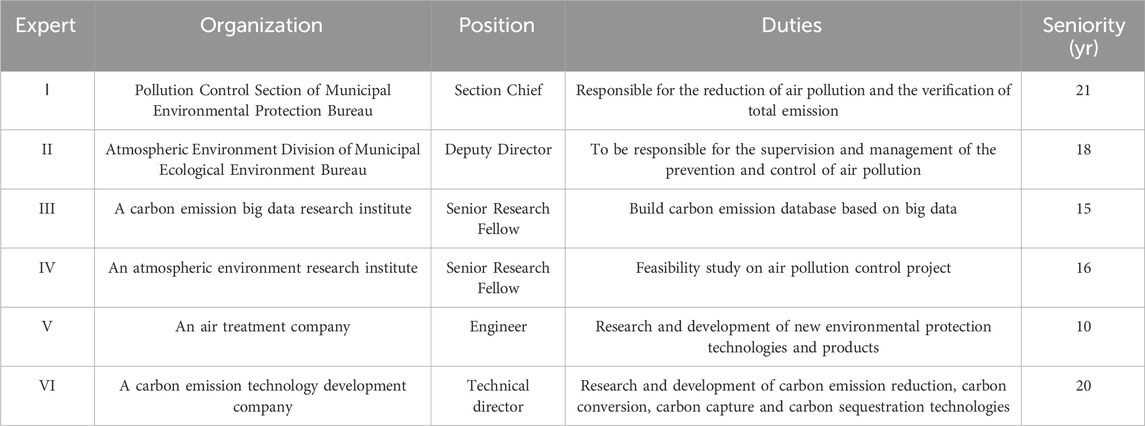
Table 4. Professional backgrounds of the selected six experts.
In the first round, the preliminary decision structure for the literature review (Table 1) was distributed to the expert group to judge whether each criterion was appropriate and whether the classification was reasonable.
In the second round, the experts were asked to assign a score ranging from 1 to 10. The scoring mean, variance and CDI of each criterion were calculated respectively, the results of which are shown in Table 5 below. The CDI value of some criteria was greater than 0.2, which means that the expert group had not yet reached a consensus and it was necessary to continue scoring by engaging in a third round.
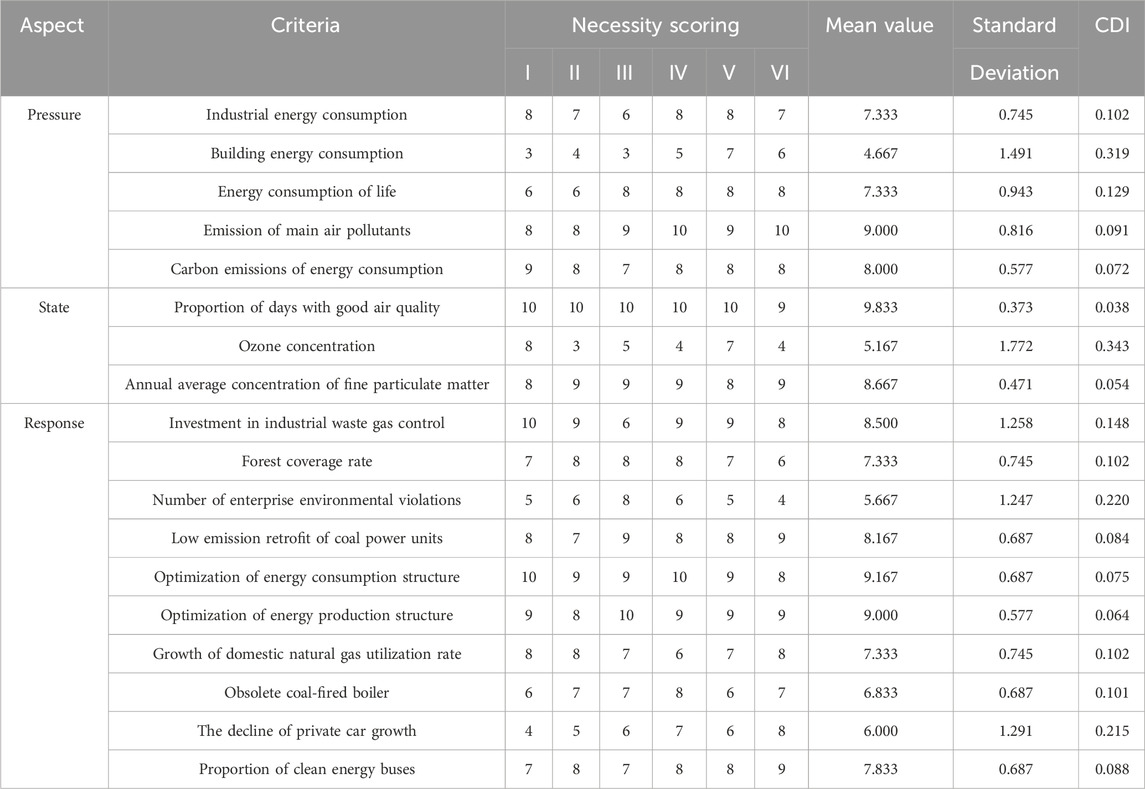
Table 5. Necessity scores of criteria in the second round of the Delphi questionnaire.
In the third round, the mean and variance data of each indicator calculated in the second round were fed back to the experts who were asked to explain scores with large deviations. After the third round of scoring, the CDI values of all indicators were less than 0.2, and the expert group basically reached an agreement. In addition, following discussion by the expert group, some indicators had a relatively limited impact on the research object, and indicators with an average value of less than six could be discarded; these mainly included those corresponding to building energy consumption, ozone concentration, the number of enterprise environmental violations and the decline of private car growth. The formal decision structure is shown in Table 6 below.
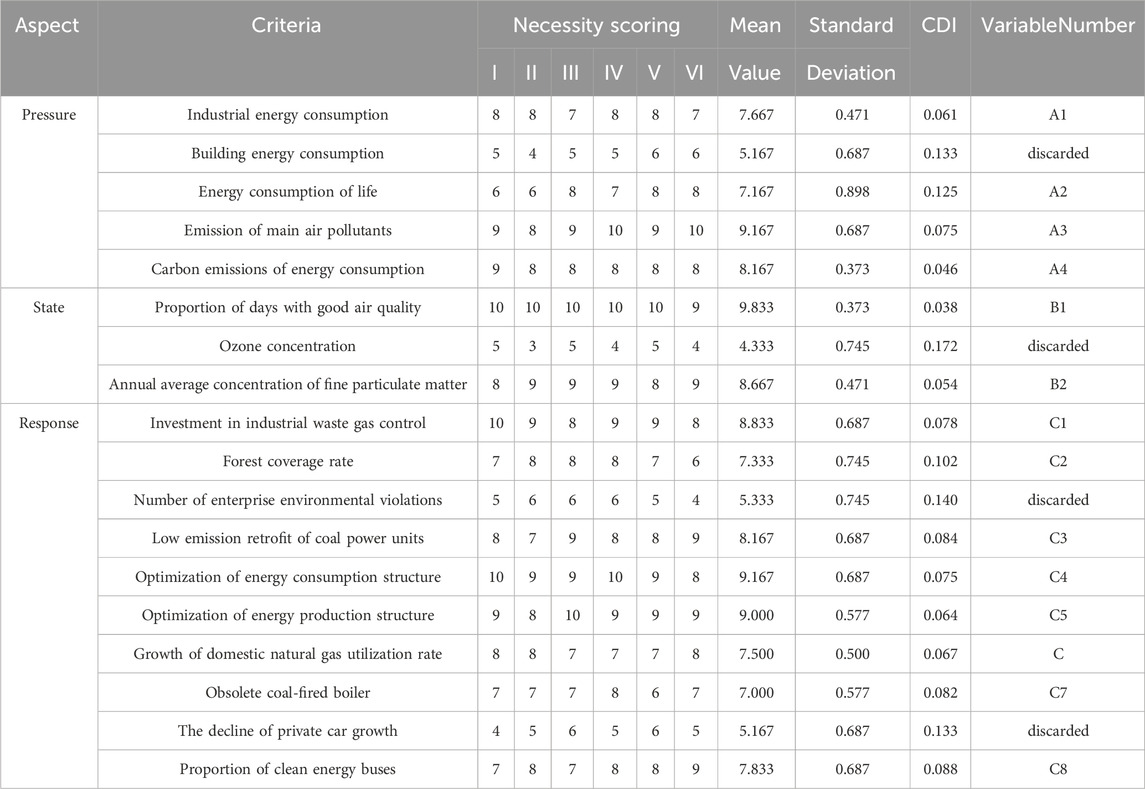
Table 6. Necessity scores of criteria in the third round of the Delphi questionnaire.
We build a hierarchy suitable for the AHP. The GASC is taken as the target layer, and the criterion layer includes two levels, in which pressure, state and response are taken as the first criterion level. Industrial energy consumption, energy consumption of life and others have a total of 14 criteria, and are regarded as the second criterion level which then forms a weight determination hierarchy model that is applicable to the AHP, as shown in Figure 4 below.
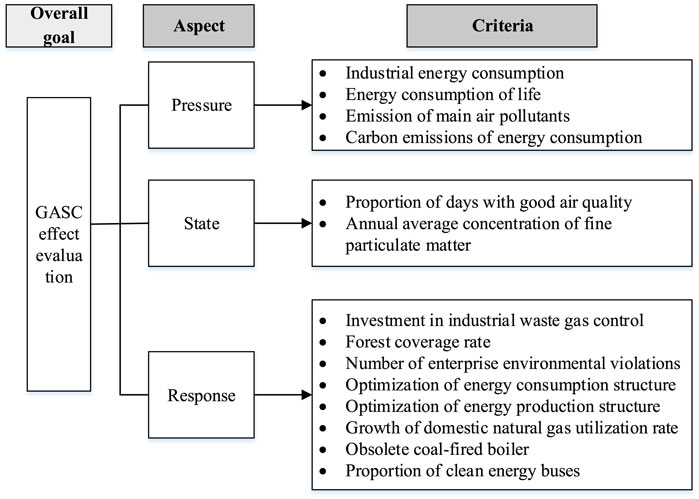
Figure 4. Hierarchy diagram.
We invited the six experts in Table 3 to assign scores ranging from one to nine points, and each expert constructed four pairwise judgment matrices. For the pairwise judgment matrix at each level, the geometric mean value was taken to integrate the data in advance, and then the weight was calculated. At the same time, the consistency test was carried out. The specific results are shown in Tables 7–10 below. The results showed that the consistency level of the integrated judgment matrix was acceptable, and the composite weight of the criteria could be calculated. The composite weight of each criterion was obtained according to Formula (7), as shown in Table 11 below.
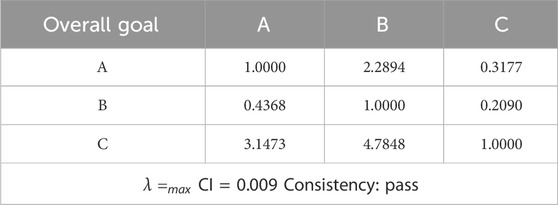
Table 7. Pairwise judgement matrix and consistency test for overall goal.
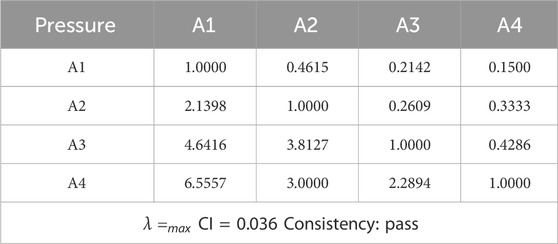
Table 8. Pairwise judgement matrix and consistency test for pressure.
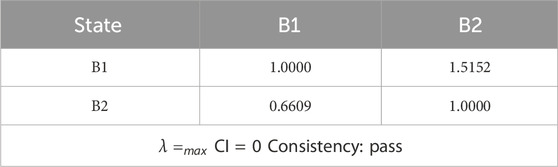
Table 9. Pairwise judgement matrix and consistency test for state.
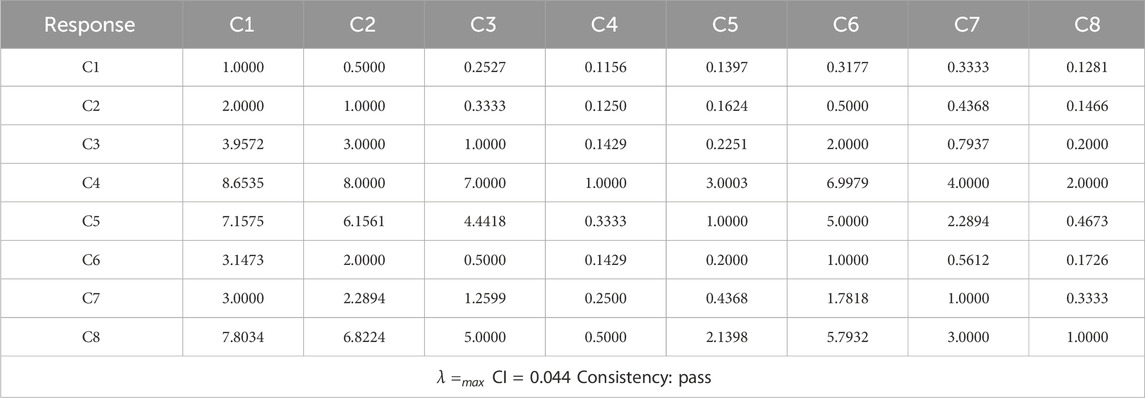
Table 10. Pairwise judgement matrix and consistency test for state.

Table 11. Composite weight of criteria.
It can be seen from Table 11 that the response aspect has a large weight and is the focus of the effectiveness evaluation of collaborative governance, which is basically consistent with the practice in various regions of China. Optimization of energy consumption structure (C4), proportion of clean energy buses (C8), carbon emissions of energy consumption (A4), optimization of energy production structure (C5), emission of main air pollutants (A3) and proportion of days with good air quality (B1) are important standards.
First, through communication with the expert group, the specific attributes and calculation methods of each criterion were determined, as shown in Table 12 below. In the process of determining the calculation method, most of the criteria can be directly obtained through simple calculation of the original data. However, in respect to the accounting of greenhouse gas emissions, after communication with the expert group, it was agreed that the following method was more reasonable.
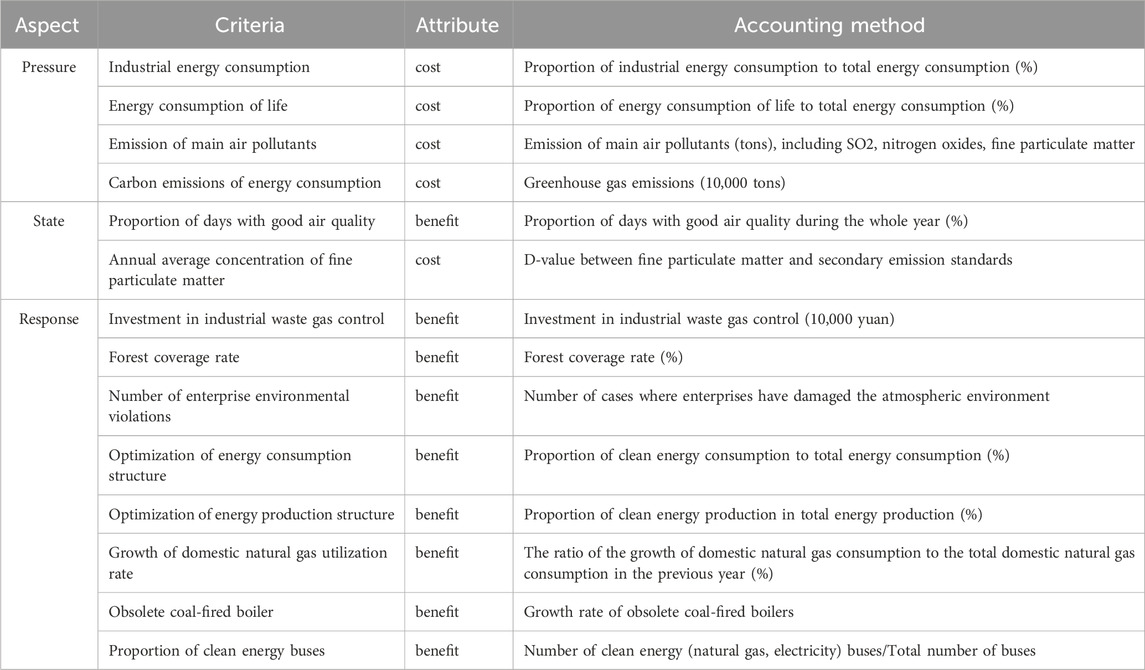
Table 12. Indicator attribute and calculation method.
Where,
Our specific data were mainly sourced from the China Statistical Yearbook (2020), China Environmental Statistical Yearbook (2020), Guangdong Statistical Yearbook (2020), Zhejiang Statistical Yearbook (2020), Liaoning Statistical Yearbook (2020), Hubei Statistical Yearbook (2020), the website of the National Bureau of Statistics, the websites of provincial statistical bureaus, China’s economic and social big data research platform and government website announcements. On the basis of data collection, combined with the determined weight of each index, the TOPSIS method was used to perform a comprehensive evaluation.
Guangdong Province, Hubei Province, Zhejiang Province and Liaoning Province were selected as the appraisal objects. According to the steps described in Section 3.3, the original data were first normalized, then weighted. The calculation results are shown in Table 13 below.
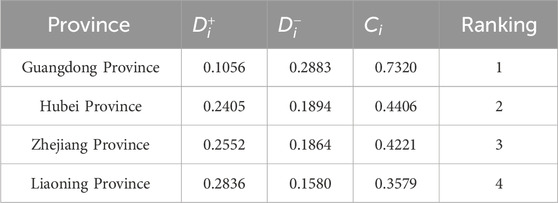
Table 13. Ranking of comprehensive results of assessment.
In terms of collaborative governance, Guangdong Province has outstanding performance, Hubei Province has good performance, Zhejiang Province has average performance, and Liaoning Province has poor performance, which indicates that Liaoning Province has certain problems in terms of collaborative governance. To explore the specific situation of Liaoning Province in more detail, the paper was to carry out a comparative analysis of collaborative governance in Liaoning Province in the past 5 years from 2016 to 2020 in order to uncover more deep-seated problems.
According to the reference (Opricovic and Tzeng, 2004), TOPSIS and VIKOR are usually discussed together, both of which belong to the compromise ranking method. We conducted a comparative analysis of the methods using VIKOR. V is introduced as the weight of the strategy of “the majority of criteria” (or “the maximum group utility”). When V = 0.4, 0.5, 0.6, and 0.7, the same sorting results were obtained, as shown in Table 14. We conducted multiple data experiments by adjusting the V value and obtained consistent sorting results. After our comparative research, there is no difference between using TOPSIS and VIKOR in this article, and it is consistent. So, the results are not sensitive to the method.
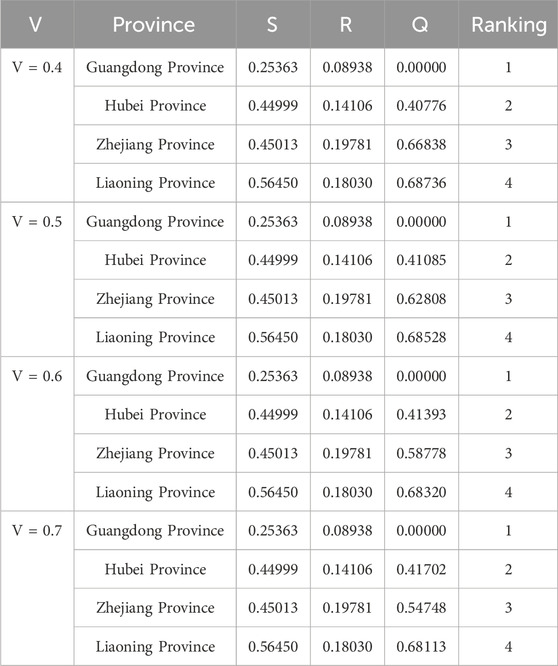
Table 14. Ranking of results of assessment.
Table 9 shows that the synergistic control performance of Liaoning Province fell behind that of the other three provinces. To further confirm the performance of each key factor, the criteria in the performance indicator system was used (Table 10), with importance (factor weight) as the horizontal axis and the performance value (normalized data after Formula 9) as the vertical axis, to create the IPA matrix of Liaoning Province from 2016 to 2020, as shown in Figure 5 below. In the IPA matrix, the factors in quadrant Ӏ are of high importance and have good performance and should be maintained; the factors in quadrant Ⅱ are of high importance and have poor performance and need to be improved first; the factors in quadrant Ⅲ are of low importance and have poor performance, and belong to the low priority improvement area; the factors in quadrant Ⅳ are of low importance and have good performance, and there is a problem of resource misplacement.
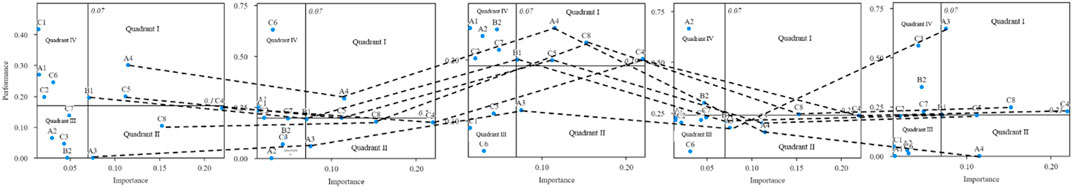
Figure 5. IPA matrix of liaoning province from 2016 to 2020.
The performance of the key factors (in the first quadrant and the second quadrant) significantly influences the GASC performance of Liaoning Province; thus, greater attention needs to be paid to them. The following conclusions can be drawn from Figure 4:
1) B1(Proportion of days with good air quality) is always in the first quadrant, with stable performance;
2) A3 (Emission of main air pollutants) was in the second quadrant from 2016 to 2019, and turned to the first quadrant in 2020. C8 was in the second quadrant from 2016 to 2017, and fell within the first quadrant from 2018 onwards. The performance of the two factors changed for the better, and is expected to be maintained.
3) C5 (Optimization of energy production structure) only transiently changed position from the first quadrant to the second quadrant in 2019, with stable performance in the remaining years;
4) C4 (Optimization of energy consumption structure) fluctuated between the first quadrant and the second quadrant. Considering the importance of C4, investment in C4 should be further increased.
5) A4 (Carbon emissions of energy consumption) changed position from the first quadrant to the second quadrant in 2019, which means that insufficient attention has been paid to A4;
6) Although B2 (Annual average concentration of fine particulate matter) and C2 (Forest coverage rate) are insignificant factors, they often feature in the fourth quadrant. As such, attention should be paid to the problem of resource dislocation.
From the above analysis, there are still problems in the implementation of some key factors in Liaoning Province; policy intensity, in particular, has not reflected the importance of factors in the GASC evaluation system. Therefore, we propose the following suggestions for targeted policy adjustment:
1) Optimization of energy consumption structure is the most important factor in the GASC evaluation system for Liaoning Province. Subsidies mainly encourage the consumption of new energy. This strategy boosts growth in the short term but cannot be maintained for long, especially when the government is in a tight financial situation. The correct path is to make it more convenient for urban residents to use new energy modes and reduce the comprehensive promotion cost of new energy, while allowing the market mechanism to drive the new energy industry in order to achieve a dynamic balance with the traditional oil and coal industries by supporting the construction of hydrogen refueling stations and improving the layout of charging piles, for example,.
2) Carbon emissions of energy consumption is another key factor related to poor performance. At the same time, the emission of main air pollutants performs well. According to the investigation, in Liaoning Province, most policies still focus solely on the control of air pollutants and fail to consider the GASC system. Therefore, specific laws, regulations and governance standards for GASC are imminent. The government should fully consider the effect of GASC and its impact on the economy and society, solicit the opinions and suggestions of stakeholders, and set up an incentive mechanism that combines rewards and punishments to ensure the implementation of policies.
3) Some unimportant factors have been paid too much attention, and there is a problem of resource misplacement. For example, to reduce the emissions of greenhouse gas and air pollutants, Liaoning Province has undertaken great efforts to make structural adjustments in recent years, but the performance of GASC remains in a backward state. It will take more than 10 years for the business model of emerging industries to mature and the supply chain to improve (Amoozad Mahdiraji et al., 2022), which proves that compulsory structural adjustment should not be carried out. Therefore, the reasonable path of structural adjustment is to encourage positive market competition and establish a more fair and open business environment. On the one hand, policies should contribute to removing trade barriers so as to help emerging industries enter the market. On the other hand, new policies should promote deep integration of traditional industrial and innovation chains, encourage traditional supply chains to be flexible, and purposefully design and develop environment-friendly new products based on existing production conditions (Rowan et al., 2022).
Taking China’s unique conditions, this paper summarized the GASC evaluation factors so as to evaluate the GASC performance of Guangdong, Zhejiang, Hubei, and Liaoning Provinces. For provinces with the lowest levels of performance, this study proposed feasible suggestions for improvements, according to the analysis conclusions. The main conclusions of this paper are as follows:
1) This paper used the PSR model to construct a GASC evaluation factor system according to three dimensions: pressure, state and response. The AHP model was employed to calculate the weight of factors at all levels. Key factors of GASC were identified according to the weights.
2) The TOPSIS method was used to evaluate the performance of GASC in four provinces in China, and it was concluded that Guangdong Province had excellent performance, Hubei Province had good performance, Zhejiang Province had average performance, and Liaoning Province had poor performance in GASC. Guangdong Province is one of the most economically developed regions in China, and the evaluation results show that there is no conflict between economic development and ecological environment protection. According to the regional characteristics, designing targeted GASC strategies is key to the synergistic development of the economy and environment.
3) To determine the cause of the poor GASC performance in Liaoning Province, the IPA matrix was used to analyze the performance of key GASC factors in Liaoning Province in the past 5 years from 2016 to 2020. The results showed that the supporting strategy for the consumption of new energy in Liaoning Province needs to change from subsidy support to a market-oriented incentive mechanism; it is urgent to introduce standards and policies for the GASC system. Structural optimization should not be adjusted rigidly, and it should mainly encourage correct market competition and the flexible transformation of traditional production enterprises.
This paper took China as an example, but the prototype decision structure constructed based on the PSR model is applicable to important developed cities affected by greenhouse gas and air pollutants. By combining the national development strategy and governance goals with AHP to construct a hierarchical structure model, the weights of GASC influencing factors that are suitable for the national conditions could be calculated. Using statistical yearbooks and comparing the performance of key factors in regions with poor performance in different years can help solve the problems of insufficient and excessive resource investment, achieve the optimal allocation of urban resources and validate the government policy adjustment. However, in the comparison of provincial performance, this paper selected specific years for comparison, which may lead to evaluation bias. Future research could focus on comparing the performance of consecutive years, and analyzing the sustainability and development trend of GASC in the provinces. In addition, due to the different traditional industrial structures in different regions, each region may introduce specific policies to reduce greenhouse gas or air pollutants within a certain period. The impact of policies is also one of the factors that should be specifically considered in future research.
In this paper, precise numerical values are used and precise pairwise comparison judgments are provided. When there are more criteria and the dataset is incomplete, accurate pairwise comparison becomes very difficult. In this case, data mining can help to extract hidden structures and patterns in data, and it is suitable for processing large amounts of data. In addition, if the risk aversion level of the decision maker may be a non-negligible parameter (Golpîra, 2018), the TOPSIS model used in this paper needs to be adapted in the future.
The original contributions presented in the study are included in the article/Supplementary material, further inquiries can be directed to the corresponding author.
Conceptualization, DS; Data curation, DG; formal analysis, DG; resources, DX; supervi-sion, YL; writing—original draft, DX and DG; writing—review and editing, DS and YL. All authors contributed to the article and approved the submitted version.
This research was funded by 2021 Scientific Study Project for Institutes of Higher Learning, Ministry of Education, Liaoning Province (Key Program), grant number LJKZ1409.
The authors would like to thank the editor and reviewers for their valuable comments.
The authors declare that the research was conducted in the absence of any commercial or financial relationships that could be construed as a potential conflict of interest.
All claims expressed in this article are solely those of the authors and do not necessarily represent those of their affiliated organizations, or those of the publisher, the editors and the reviewers. Any product that may be evaluated in this article, or claim that may be made by its manufacturer, is not guaranteed or endorsed by the publisher.
Amoozad Mahdiraji, H., Yaftiyan, F., Abbasi-Kamardi, A., and Garza-Reyes, J. A. (2022). Investigating potential interventions on disruptive impacts of Industry 4.0 technologies in circular supply chains: evidence from SMEs of an emerging economy. Comput. Industrial Eng. 174, 108753. doi:10.1016/j.cie.2022.108753
Aung, T. S. (2017). Evaluation of the environmental impact assessment system and implementation in Myanmar: its significance in oil and gas industry. Environ. Impact Assess. Rev. 66, 24–32. doi:10.1016/j.eiar.2017.05.005
Boulkedid, R., Abdoul, H., Loustau, M., Sibony, O., and Alberti, C. (2011). Using and reporting the delphi method for selecting healthcare quality indicators: a systematic review. Plos One 6, e20476. doi:10.1371/journal.pone.0020476
Braspenning Radu, O., Van Den Berg, M., Klimont, Z., Deetman, S., Janssens-Maenhout, G., Muntean, M., et al. (2016). Exploring synergies between climate and air quality policies using long-term global and regional emission scenarios. Atmos. Environ. 140, 577–591. doi:10.1016/j.atmosenv.2016.05.021
Carnell, E., Vardoulakis, S., Beck, R., Heaviside, C., Tomlinson, S., Dragosits, U., et al. (2019). Modelling public health improvements as a result of air pollution control policies in the UK over four decades—1970 to 2010. Environ. Res. Lett. 14, 074001. doi:10.1088/1748-9326/ab1542
Chakraborty, S. (2022). TOPSIS and modified TOPSIS: a comparative analysis. Decis. Anal. J. 2, 100021. doi:10.1016/j.dajour.2021.100021
Cheng, H., Zhu, L., and Meng, J. (2022). Fuzzy evaluation of the ecological security of land resources in mainland China based on the Pressure-State-Response framework. Sci. Total Environ. 804, 150053. doi:10.1016/j.scitotenv.2021.150053
Cheng, Y., Du, K., and Yao, X. (2023). Stringent environmental regulation and inconsistent green innovation behavior: evidence from air pollution prevention and control action plan in China. Energy Econ. 120, 106571. doi:10.1016/j.eneco.2023.106571
Chuai, X., Xia, M., Xiang, A., Miao, L., Zhao, R., and Zuo, T. (2022). Vegetation coverage and carbon sequestration changes in China’s forest projects area. Glob. Ecol. Conservation 38, e02257. doi:10.1016/j.gecco.2022.e02257
Chung, E.-S., and Lee, K. S. (2009). Prioritization of water management for sustainability using hydrologic simulation model and multicriteria decision making techniques. J. Environ. Manag. 90, 1502–1511. doi:10.1016/j.jenvman.2008.10.008
Clausen, A., Vu, H. H., and Pedrono, M. (2011). An evaluation of the environmental impact assessment system in Vietnam: the gap between theory and practice. Environ. Impact Assess. Rev. 31, 136–143. doi:10.1016/j.eiar.2010.04.008
Cohan, D. S., Boylan, J. W., Marmur, A., and Khan, M. N. (2007). An integrated framework for multipollutant air quality management and its application in Georgia. Environ. Manag. 40, 545–554. doi:10.1007/s00267-006-0228-4
Dong, F., Yu, B., and Pan, Y. (2019). Examining the synergistic effect of CO2 emissions on PM2.5 emissions reduction: evidence from China. J. Clean. Prod. 223, 759–771. doi:10.1016/j.jclepro.2019.03.152
Dos Santos Sá, A. K. D., Cutrim, M. V. J., Do Nascimento Feitosa, F. A., De Jesus Flores-Montes, M., Cavalcanti, L. F., Dos Santos Costa, D., et al. (2022). Multiple stressors influencing the general eutrophication status of transitional waters of the Brazilian tropical coast: an approach utilizing the pressure, state, and response (PSR) framework. J. Sea Res. 189, 102282. doi:10.1016/j.seares.2022.102282
Duan, J., Mao, S., Xie, P., Lang, J., Li, A., Tong, J., et al. (2023). Key emergency response technologies for abrupt air pollution accidents in China. J. Environ. Sci. 123, 235–254. doi:10.1016/j.jes.2022.03.030
East, J., Montealegre, J. S., Pachon, J. E., and Garcia-Menendez, F. (2021). Air quality modeling to inform pollution mitigation strategies in a Latin American megacity. Sci. Total Environ. 776, 145894. doi:10.1016/j.scitotenv.2021.145894
Farid, S., Karim, S., Naeem, M. A., Nepal, R., and Jamasb, T. (2023). Co-movement between dirty and clean energy: a time-frequency perspective. Energy Econ. 119, 106565. doi:10.1016/j.eneco.2023.106565
Golpîra, H. (2018). A novel Multiple Attribute Decision Making approach based on interval data using U2P-Miner algorithm. Data and Knowl. Eng. 115, 116–128. doi:10.1016/j.datak.2018.03.001
Golpîra, H., and Javanmardan, A. (2022). Robust optimization of sustainable closed-loop supply chain considering carbon emission schemes. Sustain. Prod. Consum. 30, 640–656. doi:10.1016/j.spc.2021.12.028
Gulia, S., Shukla, N., Padhi, L., Bosu, P., Goyal, S. K., and Kumar, R. (2022). Evolution of air pollution management policies and related research in India. Environ. Challenges 6, 100431. doi:10.1016/j.envc.2021.100431
Guo, X.-D., Zhu, L., Fan, Y., and Xie, B.-C. (2011). Evaluation of potential reductions in carbon emissions in Chinese provinces based on environmental DEA. Energy Policy 39, 2352–2360. doi:10.1016/j.enpol.2011.01.055
Guo, Y.-Y. (2022). Revisiting the building energy consumption in China: insights from a large-scale national survey. Energy Sustain. Dev. 68, 76–93. doi:10.1016/j.esd.2022.03.005
Hari Ganesh, A., Helen Shobana, A., and Ramesh, R. (2021). Identification of critical path for the analysis of bituminous road transport network using integrated FAHP – FTOPSIS method. Mater. Today Proc. 37, 193–206. doi:10.1016/j.matpr.2020.05.015
Howlett, M., and Ramesh, M. (2006). Globalization and the choice of governing instruments: the direct, indirect, and opportunity effects of internationalization. Int. Public Manag. J. 9, 175–194. doi:10.1080/10967490600625803
Huichun, Y., Chunyuan, M., Qingsong, W., Xueliang, Y., Zhang, , and Ma, C. (2013). Key evaluation framework for the impacts of urbanization on air environment - a case study. Ecol. Indic. Integrating, Monit. Assess. Manag. 24, 266–272. doi:10.1016/j.ecolind.2012.07.004
Jia, W., Li, L., Lei, Y., and Wu, S. (2023). Synergistic effect of CO2 and PM2.5 emissions from coal consumption and the impacts on health effects. J. Environ. Manag. 325, 116535. doi:10.1016/j.jenvman.2022.116535
Ke, S., Zhang, Z., and Wang, Y. (2023). China's forest carbon sinks and mitigation potential from carbon sequestration trading perspective. Ecol. Indic. 148, 110054. doi:10.1016/j.ecolind.2023.110054
Kuang, Y., and Lin, B. (2022). Natural gas resource utilization, environmental policy and green economic development: empirical evidence from China. Resour. Policy 79, 102992. doi:10.1016/j.resourpol.2022.102992
Landeta, J. (2005). Current validity of the delphi method in social sciences. Technol. Forecast. Soc. Change 73 (5), 467–482. doi:10.1016/j.techfore.2005.09.002
Li, C. Y. (2016). An empirical analysis about the performance of atmospheric environmental management:base on PSRModel and the principal component analysis method. J. Central Univ. Finance Econ., 104–112.
Li, L., and Sun, W. Y. (2018). Performance audit of air pollution control based on PSR model: a case study of jiangsu province. Commer. Account., 17–20.
Li, T., Zhang, Y., Bi, X., Wu, J., Chen, M., Luo, B., et al. (2023). Comprehensive performance evaluation of coordinated development of industrial economy and its air pollution control. Heliyon 9, e17442. doi:10.1016/j.heliyon.2023.e17442
Li, W., Liu, C., Su, W., Ma, X., Zhou, H., Wang, W., et al. (2021a). Spatiotemporal evaluation of alpine pastoral ecosystem health by using the Basic-Pressure-State-Response Framework: a case study of the Gannan region, northwest China. Ecol. Indic. 129, 108000. doi:10.1016/j.ecolind.2021.108000
Li, X., Hussain, S. A., Sobri, S., and Md Said, M. S. (2021b). Overviewing the air quality models on air pollution in Sichuan Basin, China. Chemosphere 271, 129502. doi:10.1016/j.chemosphere.2020.129502
Li, X., Qiao, Y., and Shi, L. (2017). The aggregate effect of air pollution regulation on CO2 mitigation in China's manufacturing industry: an econometric analysis. J. Clean. Prod. 142, 976–984. doi:10.1016/j.jclepro.2016.03.015
Li, Y., Huang, S., Yin, C., Sun, G., and Ge, C. (2020). Construction and countermeasure discussion on government performance evaluation model of air pollution control: a case study from Beijing-Tianjin-Hebei region. J. Clean. Prod. 254, 120072. doi:10.1016/j.jclepro.2020.120072
Liu, H., Wong, W.-K., The Cong, P., Nassani, A. A., Haffar, M., and Abu-Rumman, A. (2023). Linkage among Urbanization, energy Consumption, economic growth and carbon Emissions. Panel data analysis for China using ARDL model. Fuel 332, 126122. doi:10.1016/j.fuel.2022.126122
Liu, J., Ma, H., Wang, Q., Tian, S., Xu, Y., Zhang, Y., et al. (2022). Optimization of energy consumption structure based on carbon emission reduction target: a case study in Shandong Province, China. Chin. J. Popul. Resour. Environ. 20, 125–135. doi:10.1016/j.cjpre.2022.06.003
Lopes, D., Ferreira, J., Rafael, S., Hoi, K. I., Li, X., Liu, Y., et al. (2023). High-resolution multi-scale air pollution system: evaluation of modelling performance and emission control strategies. J. Environ. Sci. 137, 65–81. doi:10.1016/j.jes.2023.02.046
Menon, R. R., and Ravi, V. (2022). Using AHP-TOPSIS methodologies in the selection of sustainable suppliers in an electronics supply chain. Clean. Mater. 5, 100130. doi:10.1016/j.clema.2022.100130
Millstein, D. E., and Harley, R. A. (2009). Revised estimates of construction activity and emissions: effects on ozone and elemental carbon concentrations in southern California. Atmos. Environ. 43, 6328–6335. doi:10.1016/j.atmosenv.2009.09.028
Mingolla, S., and Lu, Z. (2021). Carbon emission and cost analysis of vehicle technologies for urban taxis. Transp. Res. Part D Transp. Environ. 99, 102994. doi:10.1016/j.trd.2021.102994
Mir, K. A., Purohit, P., Cail, S., and Kim, S. (2022). Co-benefits of air pollution control and climate change mitigation strategies in Pakistan. Environ. Sci. Policy 133, 31–43. doi:10.1016/j.envsci.2022.03.008
Nam, K.-M., Waugh, C. J., Paltsev, S., Reilly, J. M., and Karplus, V. J. (2014). Synergy between pollution and carbon emissions control: comparing China and the United States. Energy Econ. 46, 186–201. doi:10.1016/j.eneco.2014.08.013
Nazim, M., Wali Mohammad, C., and Sadiq, M. (2022). A comparison between fuzzy AHP and fuzzy TOPSIS methods to software requirements selection. Alexandria Eng. J. 61, 10851–10870. doi:10.1016/j.aej.2022.04.005
Nelson, P. F. (2023). “"2 - environmental issues: emissions, pollution control, assessment, and management,” in The coal handbook (Sawston, United Kingdom: Woodhead Publishing), 31–76.
Opricovic, S., and Tzeng, G. H. (2004). Compromise solution by MCDM methods: a comparative analysis of VIKOR and TOPSIS. Eur. J. Operational Res. 156, 445–455. doi:10.1016/s0377-2217(03)00020-1
Palacios, M., Kirchner, F., Martilli, A., Clappier, A., MartiN, F., and RodriGuez, M. E. (2002). Summer ozone episodes in the Greater Madrid area. Analyzing the ozone response to abatement strategies by modelling. Atmos. Environ. 36, 5323–5333. doi:10.1016/s1352-2310(02)00590-3
Park, J., Lee, J., and Shin, J. (2023). Corporate governance, compensation mechanisms, and voluntary disclosure of carbon emissions: evidence from Korea. J. Contemp. Account. Econ. 19, 100361. doi:10.1016/j.jcae.2023.100361
Premakumara, D. G. J., Menikpura, S. N. M., Singh, R. K., Hengesbaugh, M., Magalang, A. A., Ildefonso, E. T., et al. (2018). Reduction of greenhouse gases (GHGs) and short-lived climate pollutants (SLCPs) from municipal solid waste management (MSWM) in the Philippines: rapid review and assessment. Waste Manag. 80, 397–405. doi:10.1016/j.wasman.2018.09.036
Puntoon, W., Tarkhamtham, P., and Tansuchat, R. (2022). The impacts of economic growth, industrial production, and energy consumption on CO2 emissions: a case study of leading CO2 emitting countries. Energy Rep. 8, 414–419. doi:10.1016/j.egyr.2022.10.219
Raghutla, C., and Chittedi, K. R. (2023). The effect of technological innovation and clean energy consumption on carbon neutrality in top clean energy-consuming countries: a panel estimation. Energy Strategy Rev. 47, 101091. doi:10.1016/j.esr.2023.101091
Rowan, N. J., Murray, N., Qiao, Y., O'neill, E., Clifford, E., Barceló, D., et al. (2022). Digital transformation of peatland eco-innovations (‘Paludiculture’): enabling a paradigm shift towards the real-time sustainable production of ‘green-friendly’ products and services. Sci. Total Environ. 838, 156328. doi:10.1016/j.scitotenv.2022.156328
Sahana, M., Saini, M., Areendran, G., Imdad, K., Sarma, K., and Sajjad, H. (2022). Assessing Wetland ecosystem health in Sundarban Biosphere Reserve using pressure-state-response model and geospatial techniques. Remote Sens. Appl. Soc. Environ. 26, 100754. doi:10.1016/j.rsase.2022.100754
Schiro, F., Stoppato, A., and Benato, A. (2020). Modelling and analyzing the impact of hydrogen enriched natural gas on domestic gas boilers in a decarbonization perspective. Carbon Resour. Convers. 3, 122–129. doi:10.1016/j.crcon.2020.08.001
Schmidt, R. C. (1997). Managing Delphi surveys using nonparametric statistical techniques. Hoboken, New Jersey, United States: Blackwell Publishing Ltd, 763–774.
Sefriyadi, I., Andani, I. G. A., Raditya, A., Belgiawan, P. F., and Windasari, N. A. (2023). Private car ownership in Indonesia: affecting factors and policy strategies. Transp. Res. Interdiscip. Perspect. 19, 100796. doi:10.1016/j.trip.2023.100796
Serafim, O., And, G.-H., and Tzeng, (2004). Compromise solution by MCDM methods: a comparative analysis of VIKOR and TOPSIS. Eur. J. Operational Res. 156, 445–455. doi:10.1016/s0377-2217(03)00020-1
Sheng, L., Wang, K., Deng, J., Chen, G., and Luo, G. (2023). Gas–liquid microdispersion and microflow for carbon dioxide absorption and utilization: a review. Curr. Opin. Chem. Eng. 40, 100917. doi:10.1016/j.coche.2023.100917
Skulmoski, G. J., Hartman, F. T., and Krahn, J. (2007). The delphi method for graduate research. J. Inf. Technol. Educ. 6, 1–21.
Su, S., Ding, Y., Li, G., Li, X., Li, H., Skitmore, M., et al. (2023). Temporal dynamic assessment of household energy consumption and carbon emissions in China: from the perspective of occupants. Sustain. Prod. Consum. 37, 142–155. doi:10.1016/j.spc.2023.02.014
Tang, L., Guo, J., Wan, R., Jia, M., Qu, J., Li, L., et al. (2023). Air pollutant emissions and reduction potentials from municipal solid waste incineration in China. Environ. Pollut. 319, 121021. doi:10.1016/j.envpol.2023.121021
Tu, J., Wan, M., Chen, Y., Tan, L., and Wang, J. (2022). Biodiversity assessment in the near-shore waters of Tianjin city, China based on the Pressure-State-Response (PSR) method. Mar. Pollut. Bull. 184, 114123. doi:10.1016/j.marpolbul.2022.114123
Vautard, R., Builtjes, P. H. J., Thunis, P., Cuvelier, C., Bedogni, M., Bessagnet, B., et al. (2007). Evaluation and intercomparison of Ozone and PM10 simulations by several chemistry transport models over four European cities within the CityDelta project. Atmos. Environ. 41, 173–188. doi:10.1016/j.atmosenv.2006.07.039
Wang, Y., Guo, C.-H., Chen, X.-J., Jia, L.-Q., Guo, X.-N., Chen, R.-S., et al. (2021). Carbon peak and carbon neutrality in China: goals, implementation path and prospects. China Geol. 4, 720–746.
Wang, Y., Wang, X., Ning, M., He, J., He, J., Lei, Y., et al. (2023). The collaborative pollutants and carbon dioxide emission reduction and cost of ultra-low pollutant emission retrofit in China's cement kiln. J. Clean. Prod. 405, 136939. doi:10.1016/j.jclepro.2023.136939
Wu, Q., Ren, H., Shi, S., Fang, C., Wan, S., and Li, Q. (2023). Analysis and prediction of industrial energy consumption behavior based on big data and artificial intelligence. Energy Rep. 9, 395–402. doi:10.1016/j.egyr.2023.01.007
Wu, Y., Liao, M., Hu, M., Xu, C., Tao, Y., and Zhou, J. (2021). Effectiveness assessment of air pollution prevention and control under collaborative supervision in the Beijing-Tianjin-Hebei region based on combination weights and grey fuzzy synthetic evaluation analysis. Sustain. Cities Soc. 64, 102543. doi:10.1016/j.scs.2020.102543
Xia, Y., Deng, J., Hu, B., Yang, Q., Li, J., Gu, H., et al. (2022). Ready-to-implement low-carbon retrofit of coal-fired power plants in China: optimal scenarios selection based on sludge and photovoltaic utilization. Environ. Sci. Ecotechnology 9, 100147. doi:10.1016/j.ese.2022.100147
Xie, B., Jones, P., Dwivedi, R., Bao, L., and Liang, R. (2023). Evaluation, comparison, and unique features of ecological security in southwest China: a case study of Yunnan Province. Ecol. Indic. 153, 110453. doi:10.1016/j.ecolind.2023.110453
Xiong, S., Ma, X., and Ji, J. (2019). The impact of industrial structure efficiency on provincial industrial energy efficiency in China. J. Clean. Prod. 215, 952–962. doi:10.1016/j.jclepro.2019.01.095
Xiong, Y., and Liu, Y. (2018). Pollution treatment evaluation research on beijing-tianjin-hebei region and the Yangtze River Delta city group———based on PSR evaluation system. China Dev. 18, 13–18.
Xue, W., Lei, Y., Liu, X., Shi, X., Liu, Z., Xu, Y., et al. (2023). Synergistic assessment of air pollution and carbon emissions from the economic perspective in China. Sci. Total Environ. 858, 159736. doi:10.1016/j.scitotenv.2022.159736
Yan, M., Sun, H., and Gu, K. (2022). Driving factors and key emission reduction paths of Xinjiang industries carbon emissions: an industry chain perspective. J. Clean. Prod. 374, 133879. doi:10.1016/j.jclepro.2022.133879
Yan, Y. X. (2017). Co-Benefit analysis on carbon emissions and haze pollution. J. Environ. Econ. 2, 52–63.
Yang, J., Ji, Z., Kang, S., Zhang, Q., Chen, X., and Lee, S.-Y. (2019). Spatiotemporal variations of air pollutants in western China and their relationship to meteorological factors and emission sources. Environ. Pollut. 254, 112952. doi:10.1016/j.envpol.2019.07.120
Yang, X., Liu, X., Ran, Q., and Razzaq, A. (2023). How does natural resource dependence influence industrial green transformation in China? Appraising underlying mechanisms for sustainable development at regional level. Resour. Policy 86, 104191. doi:10.1016/j.resourpol.2023.104191
Yang, X. D., Su, X. F., Ran, Q. Y., Ren, S. Y., Chen, B., Wang, W. L., et al. (2022). Assessing the impact of energy internet and energy misallocation on carbon emissions: new insights from China. Environ. Sci. Pollut. Res. 29, 23436–23460. doi:10.1007/s11356-021-17217-8
Ye, F.-F., Yang, L.-H., and Wang, Y.-M. (2020). An interval efficiency evaluation model for air pollution management based on indicators integration and different perspectives. J. Clean. Prod. 245, 118945. doi:10.1016/j.jclepro.2019.118945
Yi, H., Zhao, L., Qian, Y., Zhou, L., and Yang, P. (2022). How to achieve synergy between carbon dioxide mitigation and air pollution control? Evidence from China. Sustain. Cities Soc. 78, 103609. doi:10.1016/j.scs.2021.103609
Yi, M., Guan, Y., Wu, T., Wen, L., and Sheng, M. S. (2023). Assessing China's synergistic governance of emission reduction between pollutants and CO2. Environ. Impact Assess. Rev. 102, 107196. doi:10.1016/j.eiar.2023.107196
Zeng, X., Gao, Y., Wang, Y., Ma, M., Zhang, J., and Sheng, L. (2022). Characterizing the distinct modulation of future emissions on summer ozone concentrations between urban and rural areas over China. Sci. Total Environ. 820, 153324. doi:10.1016/j.scitotenv.2022.153324
Zhang, C., Zhang, J., and Yang, Q. (2022). Identifying critical risk factors in green product certification using hybrid multiple-criteria decision-making. Sustainability 14, 4513. doi:10.3390/su14084513
Zhang, R., Wang, C., and Xiong, Y. (2023a). Ecological security assessment of China based on the Pressure-State-Response framework. Ecol. Indic. 154, 110647. doi:10.1016/j.ecolind.2023.110647
Zhang, R., Zhang, X., Sun, M., Xi, J., Meng, Z., et al. (2020). A cluster-randomized field trial to reduce cesarean section rates with a multifaceted intervention in Shanghai, China. Green Finance Account. 18, 27–33. doi:10.1186/s12916-020-1491-6
Zhang, S., Worrell, E., and Crijns-Graus, W. (2015). Evaluating co-benefits of energy efficiency and air pollution abatement in China’s cement industry. Appl. Energy 147, 192–213. doi:10.1016/j.apenergy.2015.02.081
Zhang, X., Yin, S., Lu, X., Liu, Y., Wang, T., Zhang, B., et al. (2023b). Establish of air pollutants and greenhouse gases emission inventory and co-benefits of their reduction of transportation sector in Central China. J. Environ. Sci., doi:10.1016/j.jes.2023.12.025
Zhang, Y., Teoh, B. K., Wu, M., Chen, J., and Zhang, L. (2023). Data-driven estimation of building energy consumption and GHG emissions using explainable artificial intelligence. Energy 262, 125468. doi:10.1016/j.energy.2022.125468
Zhang, Y.-J., Liu, Z., Qin, C.-X., and Tan, T.-D. (2017). The direct and indirect CO2 rebound effect for private cars in China. Energy Policy 100, 149–161. doi:10.1016/j.enpol.2016.10.010
Zhou, B., Zhao, H., Yu, J., He, T., and Liu, J. (2022). Does the growth of the digital economy boost the efficiency of synergistic carbon-haze governance? evidence from China. Front. Environ. Sci. 10. doi:10.3389/fenvs.2022.984591
Zhou, J., Wang, J., Bi, J., and Zhou, Q. (2024). Comprehensive evaluation of air pollution emission permit allocation: effectiveness, efficiency, and equity in China's environmental management framework. J. Clean. Prod. 434, 139855. doi:10.1016/j.jclepro.2023.139855
Zhou, P., Ang, B. W., and Han, J. Y. (2010). Total factor carbon emission performance: a Malmquist index analysis. Energy Econ. 32, 194–201. doi:10.1016/j.eneco.2009.10.003
Zhou, Z., Chen, Y., Song, P., and Ding, T. (2020). China's urban air quality evaluation with streaming data: a DEA window analysis. Sci. Total Environ. 727, 138213. doi:10.1016/j.scitotenv.2020.138213
Zhou, Z., Guo, X., Wu, H., and Yu, J. (2018). Evaluating air quality in China based on daily data: application of integer data envelopment analysis. J. Clean. Prod. 198, 304–311. doi:10.1016/j.jclepro.2018.06.180
Keywords: gasc, pressure-state-response model, AHP, TOPSIS, IPA
Citation: Guo D, Li Y, Xie D and Sun D (2024) Driving factors and key paths of greenhouse gas and air pollutants synergistic control using hybrid multiple-criteria decision-making. Front. Environ. Sci. 12:1155409. doi: 10.3389/fenvs.2024.1155409
Received: 31 January 2023; Accepted: 02 April 2024;
Published: 11 April 2024.
Edited by:
Faik Bilgili, Erciyes University, TürkiyeReviewed by:
Suresh M, Amrita Vishwa Vidyapeetham University, IndiaCopyright © 2024 Guo, Li, Xie and Sun. This is an open-access article distributed under the terms of the Creative Commons Attribution License (CC BY). The use, distribution or reproduction in other forums is permitted, provided the original author(s) and the copyright owner(s) are credited and that the original publication in this journal is cited, in accordance with accepted academic practice. No use, distribution or reproduction is permitted which does not comply with these terms.
*Correspondence: Yingqiu Li, bGl5aW5ncWl1QG5ldXNvZnQuZWR1LmNu
Disclaimer: All claims expressed in this article are solely those of the authors and do not necessarily represent those of their affiliated organizations, or those of the publisher, the editors and the reviewers. Any product that may be evaluated in this article or claim that may be made by its manufacturer is not guaranteed or endorsed by the publisher.
Research integrity at Frontiers
Learn more about the work of our research integrity team to safeguard the quality of each article we publish.