 Jiqiang Huang1
 Yanfeng Li2*
- 1Zhongnan University of Economics and Law, Hubei, China
- 2Hunan University of Finance and Economics, Hunan, China
To protect and improve the environment, reduce pollutant emissions, and promote ecological civilization, China implemented “the Environmental Protection Law of the People’s Republic of China” on 1 January 2018. However, what is the impact of strict environmental regulation on foreign direct investment (FDI)? The study uses the data from 287 cities in 30 of China’s provinces between 2003 and 2019 and constructs an intensity difference-in-difference model to test the impact of China’s environmental “fee-to-tax” on FDI. Empirical results show that environmental “fee-to-tax” significantly boosts FDI. The “pollution halo” hypothesis is confirmed, and the findings hold up through robustness tests. In addition, the heterogeneity test found that environmental “fee-to-tax” mainly promoted FDI in the eastern and central regions but not significantly in the western regions. Further expansion found that environmental “fee-to-tax” can effectively reduce the emission of pollutants. The results provide important policy implications for deepening the environmental protection tax reform and optimizing FDI.
1 Introduction
Since the reform and opening-up, China’s market has established a good foundation for the entry of foreign direct investment (FDI). According to the data published by the National Bureau of Statistics1, the amount of FDI utilized in China increased from 0.92 billion dollars in 1983 to 144.37 billion dollars in 2020. The role of soaring FDI entry in promoting China’s economic growth cannot be ignored (Li et al., 2021; Tawiah et al., 2021), but the problems of over-investment and massive energy consumption are increasingly exposed. Furthermore, with the accelerated economic globalization and trade liberalization, FDI is an indicator of economic globalization, and although, to a large extent, economic globalization positively drives energy efficiency (Liu et al., 2023), FDI is also an essential source of carbon emissions (Shahbaz et al., 2018a). Developed countries focus more on the return of capital to the outward investing countries and ignore the possible environmental problems in developing countries (Zugravu-Soilita, 2017), resulting in issues such as energy shortage and environmental pollution in China (Zhang et al., 2020), which have a significant impact on the local environment. Khan and Ozturk (2020) found that FDI increases local carbon dioxide, manufacturing emission pollution, and China’s urban PM2.5 pollution (Cheng et al., 2020). Caetano et al. (2022) found that FDI may increase pollution by increasing overall energy consumption rather than shifting polluting industries. Therefore, appropriate environmental rules are necessary for the sustainable use of physical resources and clean energy to achieve the green growth agenda. Environmental protection taxes can reduce the consumption of natural resources and energy, magnify the consumption of renewable energy, reduce carbon emissions, and promote green development. Therefore, selecting and designing appropriate environmental regulation policies can improve the quality of FDI and effectively alleviate energy consumption and environmental pollution problems. A reasonable ecological system is an indispensable guide to building a harmonious and healthy green economic system and promoting the high-quality development of the national economy.
FDI has a meaningful impact on China’s fossil energy consumption, natural resources, and ecological environment (Tan et al., 2021). With the development of the concept of ecological civilization construction in China, environmental problems have been given more and more attention by the Chinese government. Environmental problems affect residents’ health and wellbeing and significantly hinder national technological progress and economic development (Rehman et al., 2021). Therefore, coordinating environmental protection and economic growth, effectively utilizing foreign capital, continuously optimizing China’s energy structure, rationally utilizing and exploiting natural resources, and realizing green environmental development are crucial to promoting China’s technological innovation and high-quality economic development (Jiang et al., 2022). Since carbon emissions are the main product of fossil energy consumption, FDI plays a vital role in energy consumption, economic growth, technological innovation (Chen et al., 2022), and pollutant emissions. Salim et al. (2017) suggested that the Chinese government supports inward FDI in the tertiary and energy sectors and strengthens local absorptive capacities to fully internalize FDI-related knowledge spillovers in energy conservation.
This study uses the data of 287 prefecture-level cities in 30 provinces and cities from 2003 to 2019 to construct an intensity difference-in-difference method to test the environmental “fee-to-tax” effect on FDI. In determining the empirical impact of environmental protection tax implementation on FDI, it is crucial to deal with the potential endogeneity of environmental regulation using instrumental variables (Millimet and Roy, 2015) or difference-in-difference (DID) (Hanna, 2011; Chung, 2014). To overcome the problems caused by endogenous environmental regulation variables and unobservable factors in the empirical analysis, we use the 2018 environmental protection tax reform as a quasi-natural experiment. Compared to previous studies, the main contributions of this study are as follows.
First, the innovative method adopted in my research: In the measurement of environmental regulation, the qualitative scoring method, single indicator method, and comprehensive indicator method are often used, such as the use of a broad environmental protection tax as an agent explanatory variable; taxes of environmental nature, such as resource taxes, consumption taxes, vehicle taxes, and vehicle purchase taxes; or the use of comprehensive indicators to measure environmental regulation. All of the abovementioned methods have been gradually optimized in the treatment of environmental regulation. However, it is still difficult to effectively reflect the net effect of environmental protection tax, and the research has obvious endogenous problems. Second, the research object is innovation: Since the environmental protection tax implementation was not long ago, most of the research identification uses the discharge fees from 2003 to 2017 as the research. Few scholars used the environmental protection tax policy in 2018 as the subject of a natural experimental study on the relationship between environmental regulation and FDI. Therefore, this paper adopts the intensity difference-in-difference method to identify the differences in the intensity of environmental regulation in cities and effectively identify the impact of an environmental protection tax on FDI. Third, we re-examine the “pollution haven” hypothesis and the “pollution halo” hypothesis effects of environmental “fee-to-tax” in China and explore the differences in the impact of the environmental “fee-to-tax.” It can provide policy guidance and enrich the existing research for effectively clarifying the macro effects of environmental “fee-to-tax” on FDI.
The rest of the article is structured as follows: Section 2 is the background of environmental protection tax policy reform and literature review; Section 3 introduces the data sources, variable selection, and model construction; Section 4 conducts baseline regression, mechanism analysis, the parallel trend test, the heterogeneity test, the robustness test, and the placebo test; Section 5 is the expanded analysis, testing the relationship between environmental “fee-to-tax” and pollutant emission; and Section 6 is the conclusion and policy implications.
2 Policy background and literature review
2.1 Policy background
China’s environmental protection tax system can be traced back to the late 1970s and early 1980s and has undergone the following stages of development: the piloting and formation stage. In 1979, “the Environmental Protection Law (piloting)” was promulgated, which formed the rudiments of the environmental protection tax; second, the development and fulfillment stage. “The Interim Measures for Compensated Use of Special Funds for Pollution Control,” promulgated in 1988, and “the Notice on Collection of Sewage Discharge Fees,” promulgated in 1993, are important measures taken by the state to control pollution, protect and improve the environment, and promote ecological civilization construction. The third is the full implementation stage. In 2003, the State Council promulgated “the administrative regulations on pollution discharge fee levy,” which implemented the original overweight charge instead of a discharge fee and overweight in parallel, has been clear about the discharge capital budget management, the clarity of the waste gas, and the wastewater discharge standard; since 2003, provinces have been adjusting their discharge fee levy standards one after another. By 2016, all 31 provinces in China had adjusted the standards for discharge fees. Fourth is the stage of the environmental protection tax levy. At the government level, the pollutant discharge charge system has problems such as poor standardization of management processes and insufficiently innovative supervisory methods. On the enterprise side, problems included poor auditing of law enforcement plans, poor implementation of the ledger system, and a lack of disclosure of pollution data (Ren et al., 2022). To further promote the green development of the industry, China’s green technology innovations should be promoted. On 25 December 2016, “the Environmental Protection Tax Law of the People’s Republic of China” was passed and became effective on 1 January 2018. With this, China ended nearly 40 years of the “discharge fee” levy system, and the environmental protection tax system entered the stage of history. Before 2018, it was a “pollution charge system,” and in 2018, it was changed to an “environmental protection tax system.” Therefore, this study takes the environmental protection tax policy reform in 2018 to discuss the impact of the “pollution charge system” to the “environmental protection tax system” (referred to as the environmental “fee-to-tax”) on FDI.
The “pollutant discharge charge system” and the “environmental protection tax system” levy taxes on the pollution within the scope of air, water, solid, and noise pollutants directly discharged to the environment. The “pollution charge system” is collected in the form of a “fee,” and the “environmental protection tax system” is collected in the form of a “tax.” Therefore, the environmental protection tax law implementation is significantly different from the discharge fee system in terms of the institutional design at many levels. First: Different legal statuses: The penalty form of the discharge fee system is an administrative penalty. At the same time, the environmental protection tax law incorporates the payment of environmental protection tax into the legal principle of taxation so that enterprises are punished by law when there is theft or omission of environmental protection tax. As a result, implementing environmental protection taxes is subject to stricter government supervision and public monitoring. Second: Different tax deductions: For example, if the concentration value of taxable air or water pollutants is less than 30% of the national and local pollutant emission standards, the environmental protection tax is reduced by 75%. If it is less than 50% of the emission standards, the environmental protection tax is reduced by 50%. Third: Different levies and management: The environmental protection tax law will no longer be levied by administrative methods but by the taxation department for levy and the environmental protection department for monitoring and control using the levy and management model of “enterprise declaration, taxation collection, environmental protection coordination, and information sharing.”2 The design of the tax system of “more emission, more payment, less emission, less payment, no emission, no payment” guides emission enterprises to enhance environmental awareness, increase treatment, accelerate the transformation and upgrading, promote the construction of ecological civilization, and help enterprises develop with high quality.
2.2 Literature review
There are mainly two views on the impact of environmental regulation on FDI. The first view is the “pollution haven” hypothesis (Baek, 2016; Shahbaz et al., 2018b; Luo et al., 2022). Another idea is the “pollution halo” hypothesis (Wang et al., 2019; Yu and Xu, 2019; Mert and Caglar, 2020; Pan et al., 2020), which is based on the “Porter hypothesis” proposed by Porter and van der Linder (1995).
The “pollution heaven” hypothesis was first proposed by Walter and Ugelow (1979) and further developed by Copeland and Taylor (1994) in combination with the North–South trade model. The hypothesis states that under open economy conditions, free trade results in the continuous migration of highly polluting industries from developed to developing countries. Foreign companies prefer to invest in low-cost areas with looser environmental regulations. As a result, FDI eventually transfers heavily polluting industries to countries with low environmental regulation and obtains corresponding benefits from the government (Alfredon, 2015; Aziz, 2018; Vo, 2020; Duana and Jiang, 2021), making tax environmental regulation a preferred destination for FDI (Dong et al., 2021). In addition, foreign-invested enterprises invest a lot of low-end intensive products in developing countries, which hinders local technological progress to a certain extent, thus locking developing countries at the lower end of the global value chain (Feng et al., 2019). Strict environmental regulation can enhance the inhibitory effect of FDI on green innovation (Xu et al., 2021). As a result, countries and regions compete to lose environmental regulations and choose lower environmental standards (Hakimi and Hamdi, 2016). Naughton (2014) found that host country regulation reduces the return on monetary capital and triggers capital outflows to regions with lower environmental regulatory standards and that strict environmental regulation hinders the overseas investment expansion of pollution-intensive industries (Cai et al., 2016). Some energy-intensive and polluting MNCs exit the market due to high local environmental regulations (Yang and Song, 2019).
In contrast, the “pollution halo” hypothesis states that for developing countries, FDI inflows can bring advanced technologies that the motherland can imitate to drive technological innovation, reduction of pollutant discharge, and economic growth (Dada and Abanikanda, 2021; Jiang et al., 2021). Furthermore, according to the “Porter hypothesis” (Porter and van der Linder, 1995), strict environmental protection can stimulate innovation, offset environmental costs, and give manufacturers a competitive advantage. Therefore, strict environmental regulations can promote enterprises to invest in technology and actively explore ways to cope with stricter environmental regulations, such as improving productivity (i.e., the weak Porter hypothesis) and technological reform (i.e., the strong Porter hypothesis), to realize “innovation compensation” (Porter, 1991; Porter and Van der Linde, 1995; Albrizio et al., 2017; Naqvi and Stockhammer, 2018). Using transnational data from 34 host countries and 115 countries in Asia from 2001 to 2012, Bashir and Khan (2019) found that stronger environmental regulatory policies can promote the development of new energy and technology-intensive industries and attract FDI from developed countries. In addition, strict environmental regulations can increase domestic production, attract foreign multinationals, and increase FDI (Kim and Rhee, 2019) because foreign-invested enterprises have sufficient funds and advanced technologies. Moreover, their compliance costs with environmental regulations are relatively low. At the same time, strengthening environmental policies in the host country brings higher costs to local companies than to multinational companies, reducing local companies’ market competitiveness and improving the core competitiveness of foreign-invested enterprises. Therefore, strengthening the environmental protection tax can still increase FDI (Dijkstra et al., 2011; Yu and Li, 2020).
3 Research design
3.1 Data sources
The article selects 2873 cities in 304 provinces in China from 2003 to 2019 to analyze the impact of the environmental “fee-to-tax” reform on FDI based on panel data. The main reason for choosing 2003 as the study’s starting point is that the “Regulations on the Collection and Use of Discharge Fee” were implemented on 1 July 2003. All of the data are obtained from the EPS database.
3.2 Variable selection
3.2.1 Explained variable
Drawing on Cai et al. (2016), the article adopts the actual FDI flow utilized by cities to reflect the level of FDI and takes the logarithm of the FDI used to express it.
3.2.2 Explanatory variables
The environmental protection tax was officially implemented on 1 January 2018. Since the environmental protection tax has different levy standards in each city, which leads to differences in the size of the environmental regulation impact of the implementation of the environmental protection tax on the cities, the study takes the change in the sulfur dioxide tax rate as the object. It sets the policy dummy variable, setting cities larger than the median environmental protection tax rate as 1 and 0 otherwise. Furthermore, it sets the years after 2017 as 1 and 0 otherwise. Finally, the intensity interaction term was obtained by multiplying the policy dummy and the time dummy, reflecting the net effect of environmental protection tax policy implementation on FDI.
3.2.3 Control variables
There are more factors affecting FDI. If we do not add control variables for them, it leads to bias due to omitting critical explanatory variables and affects the empirical results. According to Cai et al. (2016), this study mainly selects the following control variables: to ensure that the empirical results are more accurate, the following variables were selected for control: when the higher local GDP indicates the fact that the cities have more economic strength and are more capable of attracting FDI, the per capita GDP is selected for control; the industrial structure is also one of the critical indicators of regional development; the level of industrial structure is controlled; the openness of the region affects the aggressiveness of FDI enterprises; when the openness is higher, it can naturally attract more FDI; and the article chose the proportion of total imports and exports to GDP to indicate the openness. Local taxation will increase the tax burden of enterprises, and a higher tax burden will affect profit, as reflected by the proportion of local general budgetary revenue in GDP. The urban population can provide sufficient labor for FDI enterprises. When the people and population density of the cities are more extensive, it indicates a better local economic development. The resident population and population density of the cities are selected to control and aim for the local income level and financial development level, which are expressed by the average wage of employees and the loans of various balances of financial institutions at the end of the year as a percentage of GDP, respectively. In Table 1, we can see the variable names, symbols, and calculation methods.
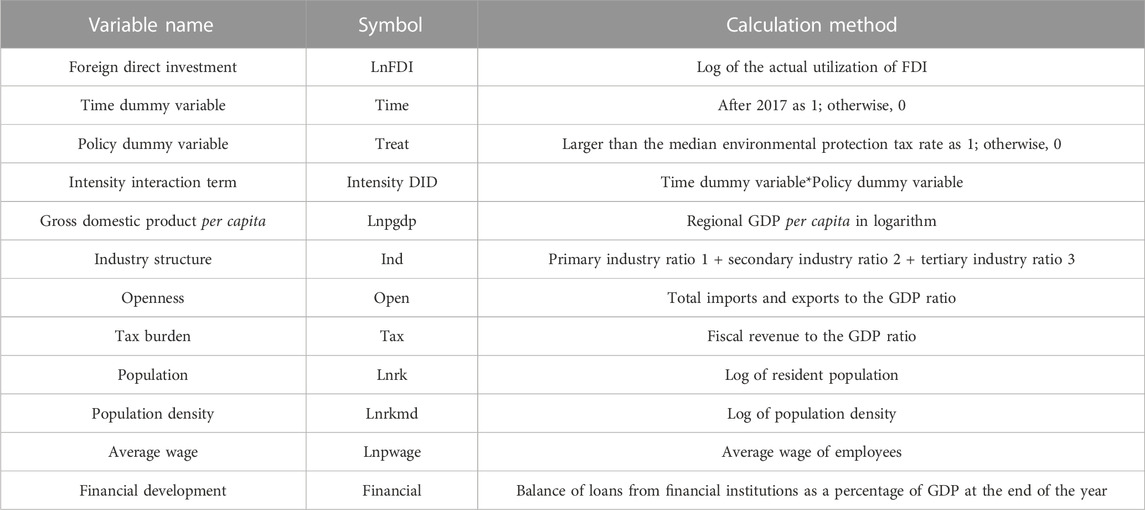
TABLE 1. Variable names, symbols, and calculation methods.
Table 2 reflects the descriptive statistics of each variable with the observed mean, standard deviation, and minimum and maximal variables. We can see that the maximum of the logarithm of FDI is 14.152 and the minimum is 2.996, with standard deviations of 1.935, indicating that the distribution of FDI in the cities has a gap. The mean value of the policy dummy variable is 0.422, indicating that half of the cities are included in the experimental group, which also ensures the adequacy of experimental subjects.
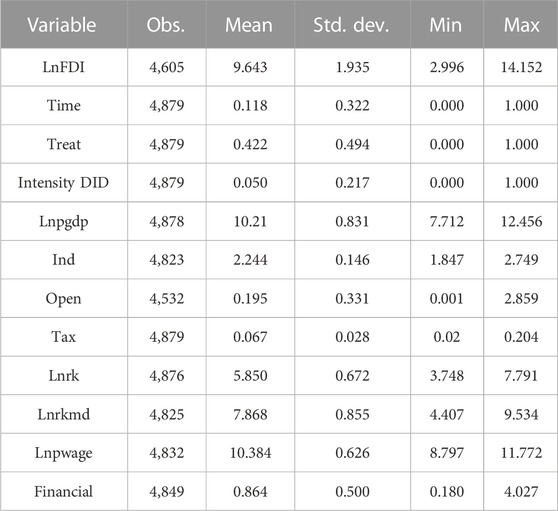
TABLE 2. Descriptive statistics.
3.3 Model setting
We establish an intensity difference-in-difference model to examine the impact of environmental “fee-to-tax” on FDI. The intensity difference-in-differences model is an econometric regression method similar to difference-in-difference. In the difference-in-difference model, we divide the sample into an experimental group and a control group according to whether they were shocked by the policy. However, all samples were affected by the environmental protection tax reform, making it impossible to construct an experimental group and a control group according to whether they were shocked by the policy. Therefore, according to Chen (2017), we divided it into experimental and control groups based on intensity. It should be noted that this study uses intensity difference-in-differences and median to distinguish between the experimental and control groups for the following reasons. First, the median environmental protection tax rate in this study is 1.8. Second, most cities increase the environmental protection tax rate based on 1.26 and raise the standard by more than 1.8. For example, taking sulfur dioxide as an example, Liaoning Province still adopted the standard of 1.26 Yuan/kg, Hunan Province raised it from 1.26 Yuan/kg to 2.48 Yuan/kg, and Tianjin still adopted the standard of 6.3 Yuan/kg. Therefore, the empirical strategy of this study not only ensures the advantage of traditional difference-in-differences but also ensures that cities with higher standards fall into the control group. Furthermore, we set cities larger than the median of the environmental protection tax as the experimental group and cities smaller than the median of the levy standard as the control group, so grouping based on the intensity difference-in-difference method is relative rather than absolute. Based on the intensity difference-in-difference design requirements, the following intensity difference-in-difference model is used to test the impact of environmental “fee-to-tax” on FDI:
where
4 Empirical results
4.1 Baseline regression
Table 3 reports the results of the baseline regression of environmental “fee-to-tax” for FDI. Models (1)–(4) represent the two-way fixed effects without control variables, random effects with control variables, fixed effects, and two-way fixed effects, respectively. The final results are presented in model (4). In the latter, we use a two-way fixed effects model with the inclusion of control variables for analyses. The results of model (4) show that the impact of environmental “fee-to-tax” on FDI is positive and passes the 1% significance level test, indicating that the environmental “fee-to-tax” policy does not expel FDI from the country. On the contrary, it can promote the growth of FDI.
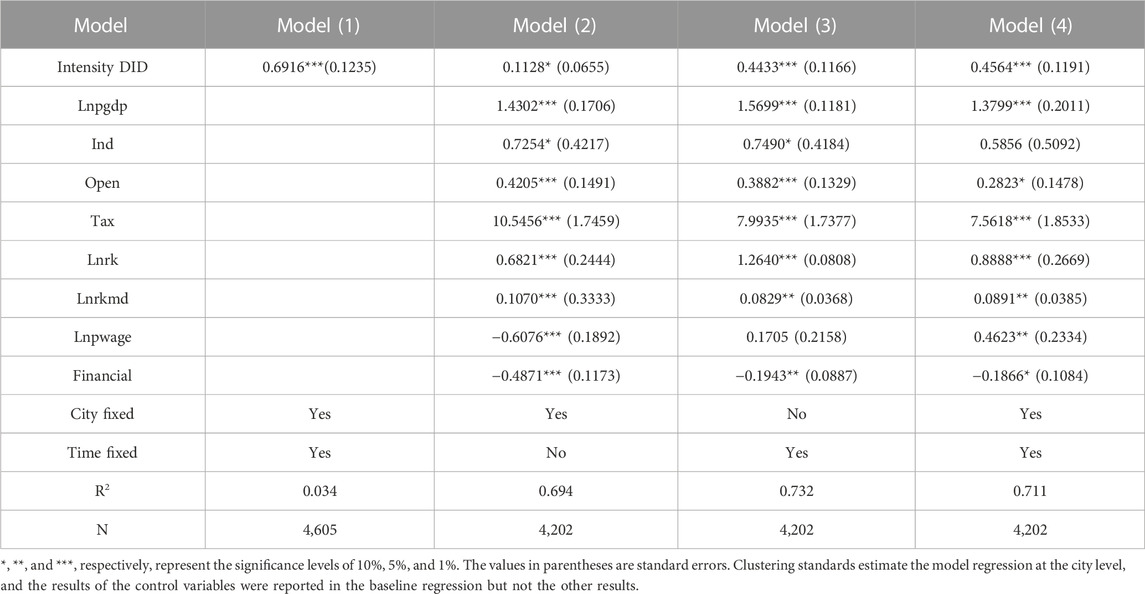
TABLE 3. Baseline regression.
4.2 Mechanism analysis
In the baseline regression, we have confirmed that the environmental “fee-to-tax” does not lead to the withdrawal of FDI. On the contrary, it increases traumatic FDI, and the “pollution halo” effect is confirmed. Therefore, we used the mediation model (Muller et al., 2005; Yuan and MacKinnon, 2009; Zhang and Kong, 2021) to test the effect of the “pollution halo” and analyze whether environmental “fee-to-tax” significantly increases enterprise R&D. We use the proportion of green invention patents to all invention patents to measure the level of green innovation in cities. According to the “Porter hypothesis,” proper environmental regulation can promote green innovation. Fahad et al. (2020) found that environmental regulation attracted more foreign capital investment, the influx of capital further promoted technological progress (Zeng and Zhou, 2021), and there was a positive interaction between technological innovation and FDI. According to model (1) in Table 4, the environmental “fee-to-tax” significantly promotes green innovation. According to model (2), the environmental “fee-to-tax” interaction and green innovation terms can significantly promote FDI. Therefore, the study finds that the environmental “fee-to-tax” can increase FDI, and the “pollution halo” effect is verified.
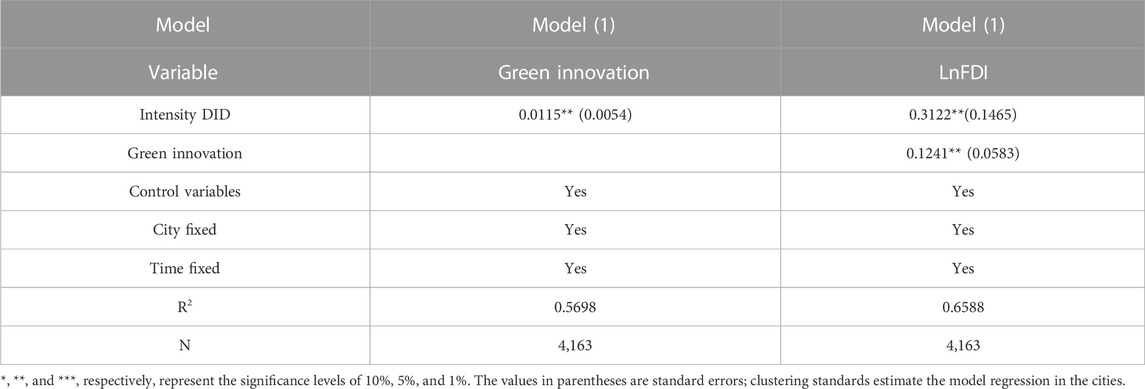
TABLE 4. Mechanism analysis.
4.3 Parallel trend test
We adopt a quasi-natural experiment approach to study the impact of environmental “fee-to-tax” on FDI. We must ensure that our research subjects satisfy the assumption of parallel trends. If they do not meet the assumption of parallel trends, they lead to unreliable results. Our research subjects should maintain the same trend when there is no policy shock, and the research subjects should change when there is a policy shock. In model (4) of Table 3, the environmental “fee-to-tax” significantly drives FDI, which means that to verify the conclusion here, we need to ensure that the trend of FDI is consistent until 2018; after 2017, the level of FDI in the experimental group should be significantly higher than the trend of the control group.
In Figure 1A, we can see the parallel trend with the mean method of FDI. The trend of the experimental group in FDI and the control group remained the same before 2018, when the policy was implemented, but after 2017, it showed a significant difference; FDI in the experimental group was significantly higher than that of the control group. The parallel trend test graph is drawn using the mean method to determine whether the common trend test may be crude, and we further adopt the event study method for the parallel trend test, whose results are more accurate and scientific, where Figure 1B indicates the parallel trend test with the event study method of FDI, pre1–pre13 represent the previous policies, cur represents the current policy, and post1 represents the first issue after the policy. Before 2018, FDI fluctuated around 0; its 95% confidence interval contains 0. In 2018 and after 2018, FDI showed a significant increase, and its 95% confidence interval is significantly different from 0, indicating that FDI showed a significant increase after implementing the policy. However, a part of the interval containing 0 in 2019 still passed the 5% significance level test.
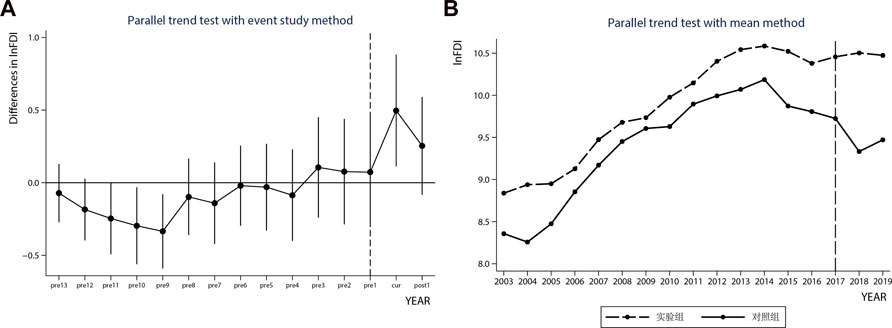
FIGURE 1. Parallel trend test.
4.4 Heterogeneity test
China is a vast country with a severe development imbalance between regions, and there may be significant differences in the shock effects on FDI. Therefore, we explore the differences in the influence of environmental “fee-to-tax” FDI from three perspectives: east, central, and west China5. Models (1)–(3) in Table 5 represent the impact of environmental “fee-to-tax” on FDI in east, central, and west China, respectively. We find that the environmental “fee-to-tax” has a significant positive effect on FDI in the eastern and central regions, passing the 1% and 5% significance level tests, but it is not significant in the western region.
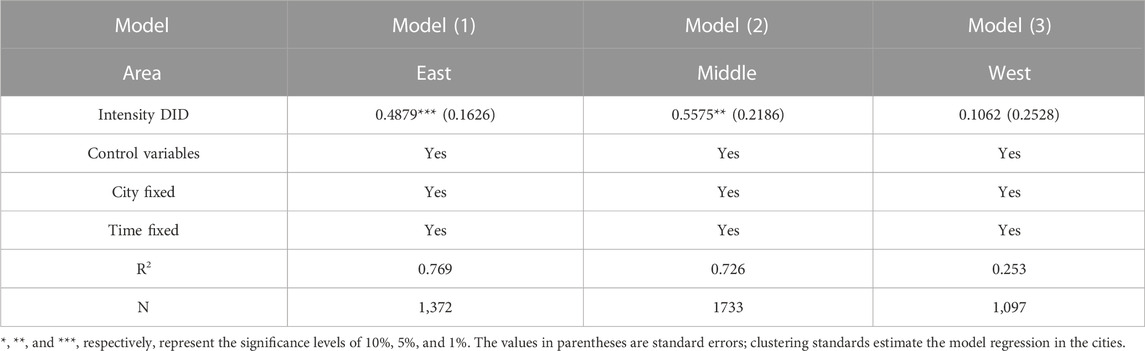
TABLE 5. Heterogeneity test.
On the whole, the environmental “fee-to-tax” did not trigger the withdrawal of FDI, and the hypothesis of the “pollution halo” was verified, indicating that the environmental “fee-to-tax” reform significantly promoted technological innovation of foreign-invested enterprises and improved market competitiveness. As the eastern region is a developed coastal area, its superior geographical location has local natural advantages for the location of foreign-invested enterprises. In addition, the eastern region has a high level of economic development, good resource conditions, and greater urban openness. This region can provide sufficient technology demand and labor supply for foreign-invested enterprises. Therefore, environmental regulation can continuously strengthen technology spillover, and a good market environment can also provide a recasting power for FDI in the eastern region. In recent years, Southeast Asian countries have introduced many preferential policies to attract foreign investment in land, tax revenue, foreign exchange, and other aspects and formed great competition with our country in undertaking the international industrial transfer. Compared with the adjacent Southeast Asian countries, the western region does not have a competitive advantage in attracting foreign investment through preferential tax policies. For a long time, in the western region, the preferential tax policy and no corresponding adjustments according to the international and domestic situations changed before the formulation of the narrow scope of the national encouraging directory, and infrastructure and technical conditions in the western regions were relatively scarce. There is little attraction for FDI. Environmental “fee-to-tax” cannot promote the performance of FDI in western China through the technology spillover effect. The central region’s economic development, market conditions, and technological level are between the eastern and western regions. The central region provides a stable market for FDI and relatively suitable environmental standards for enterprises. Therefore, the environmental “fee-to-tax” plays a significant role in FDI in the central region.
4.5 Robustness tests
We use a series of methods to test the empirical results to ensure that they are robust. Since the financial crisis outbreak turned the economy into a depression to ensure that the empirical results were not affected by economic cycle shocks, the financial crisis occurred in 2008. The main impact was in 2009. Therefore, model (1) in Table 5 excludes the policy year of 2008 and adds the 2009 dummy variable. The impact generated by the financial crisis is not short-term. China has launched its currency policy and released four trillion dollars to stimulate the economy; therefore, the outbreak of the financial crisis will have an impact on economic growth and FDI. Model (2) identifies the sample interval as after 2008; the 287 prefecture-level cities include municipalities, provincial capitals, and vice-ministerial-level cities, which are of a higher administrative level and have better economic resources and a better market environment to attract FDI. Model (3) deletes municipalities, provincial capitals, and vice-ministerial-level cities; the level of FDI in the previous period is more related to the level of FDI in the current period. Model (4) controls for the lagged period of FDI data in the model for control; the implementation of the environmental protection tax levy standard is not random and plays a leading role in demonstration. The areas with high levy standards are generally those with better economic development. Therefore, non-randomization of the grouping can lead to biased policy results. The PSM approach can reduce these biases and the influence of confounding variables so that the experimental and control groups can be compared more reasonably. Therefore, we use the propensity score matching–difference-in-difference (PSM–DID) method to continue the analysis. Using the logit regression method to determine the matching variables based on 1:1 matching (one-to-one matching) removes the unmatched cities for intensity difference-in-difference regression analysis. Model (5) reflects the study based on the PSM–DID method in our empirical research.
We use the method to cluster at the city level. The higher the clustering level, the weaker the implied hypothesis. However, suppose the empirical results after defining the clustering level at the provincial level are still significant. In that case, it indicates that the empirical results are trustworthy. Model (6) uses the clustering method at the provincial level, and the change in the clustering level does not change the regression coefficient. However, only the standard error, the magnitude of the baseline regression coefficient of model (6) in Table 6, is consistent with model (4) in Table 3. The identification method of this paper is to use the median environmental protection tax rate to distinguish the experimental group from the control group and construct the intensity difference-in-differences model. Therefore, model (7) directly interacts with the time dummy variable and the environmental protection tax rate to obtain a new intensity difference-in-differences interaction term. From the robustness regression results of models (1)–(7) in Table 6, we find that the impact of environmental “fee-to-tax” on the FDI remains significantly positive and passes the significance test at 10% and smaller. A series of robustness tests reveal that the empirical results are consistent with those of the baseline regressions and that there are no significant fluctuations in the coefficient changes, indicating that the empirical evidence is very robust and valid and that the empirical results are credible.
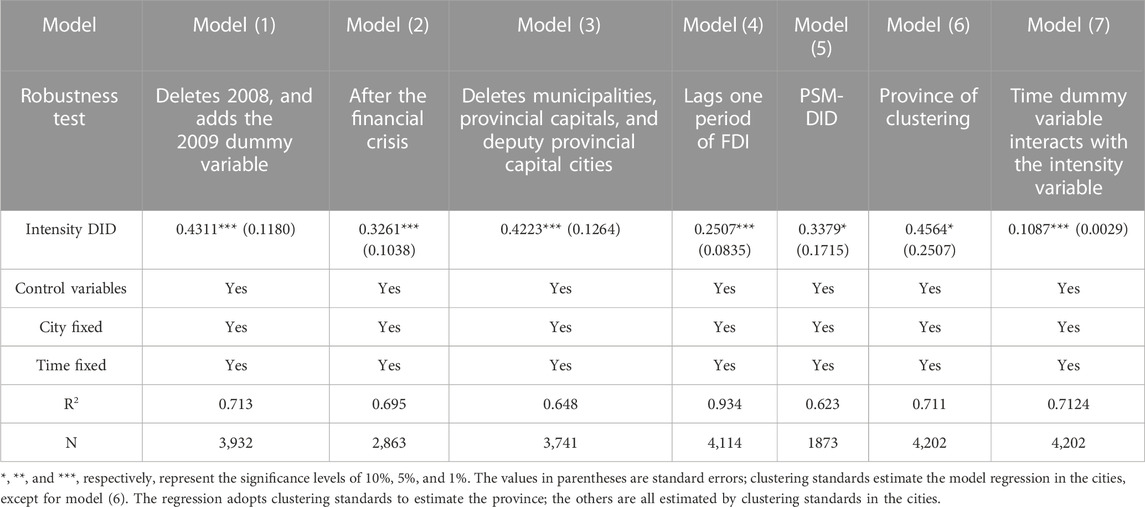
TABLE 6. Robustness test.
4.6 Policy uniqueness test
During the sample period of this study, China announced a series of policies to improve the environment. To accurately and effectively identify the increase in FDI due to the environmental protection tax policy in 2018, the article excludes the interference of other policies to increase the robustness of the results. If, after controlling for other policies, the effect of the environmental “tax reform” on FDI becomes insignificant, then there is at least a reason to doubt the effect of the environmental “tax reform” on FDI; conversely, the results’ reliability is enhanced. Although discharge fees were levied during 2003–2017, the levy standards for discharge fees have continued to be adjusted by cities. Taking the sulfur dioxide levy as an example, the levy standard in Beijing was increased from 0.63 RMB/pollution equivalent to 10 RMB/pollution equivalent during the period; Tianjin also experienced the following adjustments: 0.42 RMB/pollution equivalent, 0.63 RMB/pollution equivalent, 0.96 RMB/pollution equivalent, 1.26 RMB/pollution equivalent, 2.52 RMB/pollution equivalent, and 5.04 RMB/pollution equivalent. However, the adjustment of discharge fees was completed in 2015 in all cities. Thus, to exclude the error caused by the increase of the emission levy standard, which affects FDI, model (1) in Table 7 excludes this policy interference by shortening the time years, so the time interval years are set to 2016–2019. The carbon trading policy is also essential for optimizing the energy structure, promoting technological innovation, reducing pollution, and facilitating the entry and exit of FDI. In October 2011, the National Development and Reform Commission issued “the Notice on the Pilot Work of Carbon Emission Trading,” which approved the pilot work of carbon trading in seven provinces and cities, including Beijing, Shanghai, Tianjin, Chongqing, Hubei, Guangdong, and Shenzhen. Excluding the carbon trading policy, cities implementing carbon trading policies are removed from the model (2). The empirical regression results of models (1)–(2) in Table 7 show that the environmental “fee-to-tax” still significantly promotes FDI, indicating that the environmental “fee-to-tax” policy indeed causes the increase in FDI.
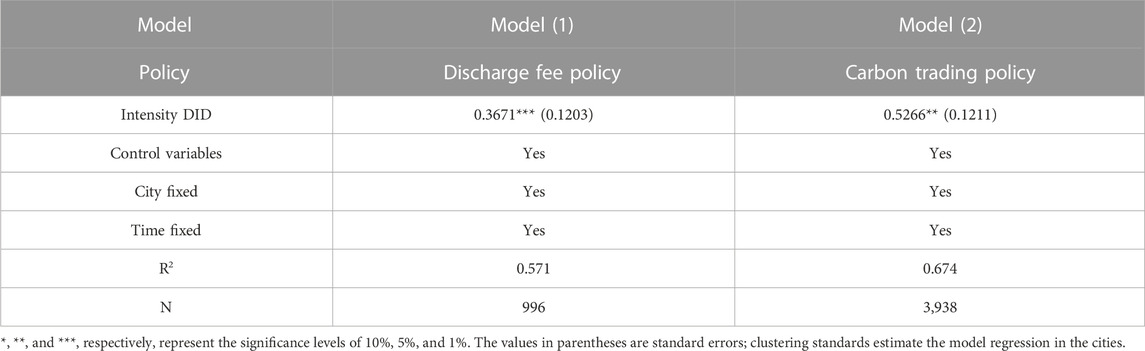
TABLE 7. Policy uniqueness test.
4.7 Placebo test
In addition to being affected by policy shocks and relevant variables, we need to eliminate the possibility that the empirical results are a randomized conclusion. First, the experimental and control groups are randomly assigned to construct new grouping dummy variables. Second, intensity difference-in-difference regression is re-run to obtain t-values and interaction term coefficients for the interaction terms of the policy variables. Finally, the aforementioned steps are repeated 500 times to observe the distribution of t-values and interaction term coefficients. From Figure 2, we found that the t-value (A) and interaction term coefficient (B) of the placebo test showed a normal distribution with a mean close to 0, and the accurate estimate of 0.4564 obtained by the benchmark regression model (4) in Table 3 was significantly different from the value obtained by the placebo test, indicating that the empirical results were not random.
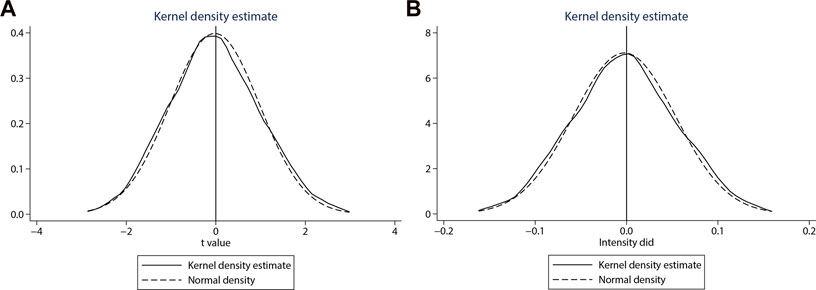
FIGURE 2. Placebo test.
4.8 Expand analysis
The environmental protection tax has an important impact on reducing pollutant emissions and promoting environmental protection. Therefore, this study explores the impact of environmental “fee-to-tax” on pollutant emissions. In Table 8, we select industrial waste water, waste gas, and dust to construct a comprehensive index to reflect pollutant emissions by entropy. The larger the value, the more pollutants are discharged. The results show that the environmental “fee-to-tax” is conducive to reducing the emission of pollutants and can achieve the effect of pollution control, which has passed the significance level test of 1%, and that environmental protection tax plays a vital role in reducing the emission of pollutants. Therefore, we can actively promote the implementation of the environmental protection tax, which is not only conducive to the promotion of high-quality development through FDI but also conducive to the use of low-carbon technologies to reduce pollutant emissions (Edziah et al., 2022).
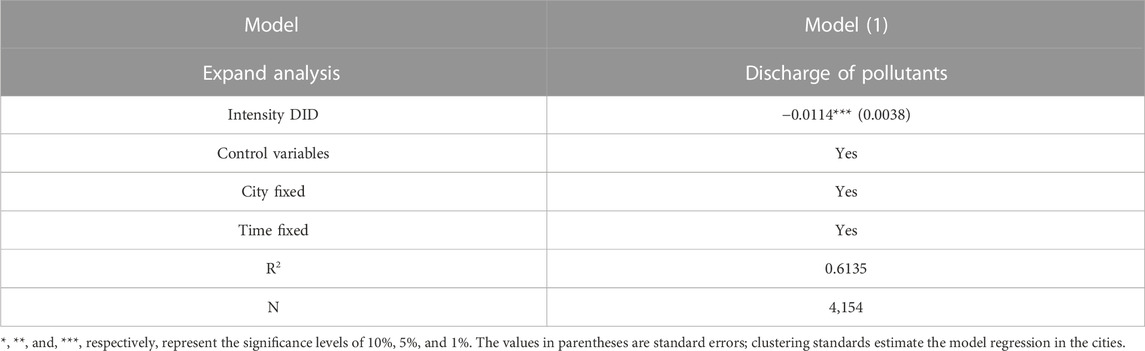
TABLE 8. Expand analysis.
5 Conclusion and policy implications
Using the data from 287 cities in 30 provinces in China, this paper constructs an intensity difference-in-difference model to examine the impact of the environmental “fee-to-tax” on FDI and finds the following conclusions: first, empirical results show that the environmental “fee-to-tax” significantly boosts FDI, and the findings hold up through a series of robustness tests. The “pollution halo” hypothesis is confirmed by the latest environmental policy. Second, the heterogeneity test found that the environmental “fee-to-tax” mainly promoted FDI in the east and central regions but not significantly in the western regions. Third, further research found that the environmental “fee-to-tax” can effectively reduce the emission of pollutants. The main limitation of this study is that it cannot accurately depict the behaviors of enterprises under strict environmental regulations at the company. Therefore, in the following research, we can analyze the impact of environmental “fee-to-tax” on the investment of foreign-invested enterprises, such as the company’s investment scale and the number of foreign-invested enterprises. Further analysis of environmental “fee-to-tax” significantly increases the innovation of foreign-invested enterprises and explores the impact of environmental “fee-to-tax” on firm heterogeneity. Due to the differences in environmental protection tax rate standards between regions, company registration data are used to analyze whether environmental “fee-to-tax” be transferred internally between regions in China.
Based on the research, this paper puts forward the following suggestions: the first is implementing and strengthening environmental protection tax policies and exploring more reasonable environmental protection tax regulations and giving full play to the policy effect of “treating pollution with taxes and increasing efficiency.” The second is the government should strengthen its support for green innovation activities of foreign-invested enterprises to reduce the risk of R&D and innovation. The third is expanding the degree of openness to attract high-quality foreign-invested enterprises. The fourth is the government can make a negative list of FDI, include more polluting industries in the negative list, and guide FDI to clean industries. The fifth is paying attention to FDI regional differences and promoting FDI regional synergistic development. Finally, innovation support for foreign-invested enterprises in the east and central regions should be strengthened, tax incentives should be increased, and environmental subsidies should be provided for foreign-invested enterprises in the West.
Data availability statement
Publicly available datasets were analyzed in this study. This data can be found here: https://www.epsnet.com.cn/index.html#/Index.
Author contributions
JH: Conceptualization, Formal analysis, Software, Validation, Data curation, Writing—original draft and review. YL: Methodology, Formal analysis, Funding acquisition.
Funding
This work is supported by the General Program of the National Social Science Fund of China (No 20BJL061), Hunan Provincial Department of Education Outstanding Youth Science Research Project (No 20B099), the Fundamental Research Funds for the Central Universities, and Zhongnan University of Economics and Law (No 202210408).
Conflict of interest
The authors declare that the research was conducted in the absence of any commercial or financial relationships that could be construed as a potential conflict of interest.
Publisher’s note
All claims expressed in this article are solely those of the authors and do not necessarily represent those of their affiliated organizations, or those of the publisher, the editors, and the reviewers. Any product that may be evaluated in this article, or claim that may be made by its manufacturer, is not guaranteed or endorsed by the publisher.
Footnotes
1https://data.stats.gov.cn/easyquery.htm?cn=C01.
2In addition to the aforementioned three differences, there are significant differences in the basis of tax calculation, content of tax collection, subject of tax collection, and other methods. For details, please refer to “the Implementation Regulations of the Environmental Protection Tax Law of the People’s Republic of China.”
3Currently, there are 333 prefecture-level city administrative regions in China; the number of prefecture-level cities is 293; and the prefecture-level cities with more serious missing data are deleted.
4There are 31 provinces (autonomous regions and municipalities) in mainland China, where the data do not include Chinese Hong Kong, Chinese Macao, and Chinese Taiwan. Due to the more serious data deficiency in the Tibet Autonomous Region, Chinese scholars generally do not include data from the Tibet Autonomous Region in their empirical studies.
5See https://data.stats.gov.cn/easyquery.htm?cn=E0103: the three zones of the areas.
References
Albrizio, S., Kozluk, T., and Zipperer, V. (2017). Environmental policies and productivity growth: Evidence across industries and firms. J. Environ. Econ. Manage. 81, 209–226. doi:10.1016/j.jeem.2016.06.002
Alfredon, J. (2015). Political risk as a determinant of southern European FDI in neighboring developing countries. Emerg. Mark. Financ. Trade 47, 59–74. doi:10.2753/REE1540-496X470404
Aziz, O. (2018). Institutional quality and FDI inflows in Arab economies. Financ. Res. Lett. 25, 111–123. doi:10.1016/j.frl.2017.10.026
Baek, J. (2016). A new look at the FDI–income–energy–environment nexus: Dynamic panel data analysis of ASEAN. Energy Policy. 91, 22–27. doi:10.1016/j.enpol.2015.12.045
Bashir, M., and Khan, S. (2019). Effect of bilateral FDI, energy consumption, CO2 emission and capital on economic growth of Asia countries. Energy Rep. 5, 1305–1315. doi:10.1016/j.egyr.2019.09.004
Caetano, R. V., Marques, A. C., Afonso, T. L., and Vieiracd, I. (2022). A sectoral analysis of the role of Foreign Direct Investment in pollution and energy transition in OECD countries. J. Environ. Manage 302, 114018. doi:10.1016/j.jenvman.2021.114018
Cai, X. Q., Lu, Y., Wu, M. Q., and Yu, L. H. (2016). Does environmental regulation drive away inbound foreign direct investment? Evidence from a quasi-natural experiment in China. J. Dev. Econ. 123, 73–85. doi:10.1016/j.jdeveco.2016.08.003
Chen, S. X. (2017). The effect of a fiscal squeeze on tax enforcement: Evidence from a natural experiment in China. J. Public Econ. 147, 62–76. doi:10.1016/j.jpubeco.2017.01.001
Chen, Z. C., Paudel, K. P., and Zheng, R. (2022). Pollution halo or pollution haven: Assessing the role of foreign direct investment on energy conservation and emission reduction. J. Environ. Plan. Manag. 65, 311–336. doi:10.1080/09640568.2021.1882965
Cheng, Z. H., Li, L. S., and Liu, J. (2020). The impact of foreign direct investment on urban PM2.5 pollution in China. J. Environ. Manage 265, 110532. doi:10.1016/j.jenvman.2020.110532
Chung, S. (2014). Environmental regulation and foreign direct investment: Evidence from South Korea. J. Dev. Econ. 108, 222–236. doi:10.1016/j.jdeveco.2014.01.003
Copeland, B. R., and Taylor, M. S. (1994). North-South trade and the environment. Q. J. Econ. 109, 755–787. doi:10.2307/2118421
Dada, J. T., and Abanikanda, E. O. (2021). The moderating effect of institutions in foreign direct investment led growth hypothesis in Nigeria. Restruct 55, 903–929. doi:10.1007/s10644-021-09332-w
Dijkstra, B. R., Mathew, A. J., and Mukherjee, A. (2011). Environmental regulation: An incentive for foreign direct investment. Rev. Int. Econ. 19, 568–578. doi:10.1111/j.1467-9396.2011.00966.x
Dong, Y., Tian, J. H., and Ye, J. J. (2021). Environmental regulation and foreign direct investment: Evidence from China's outward FDI. Financ. Res. Lett. 39, 101611. doi:10.1016/j.frl.2020.101611
Duana, J., and Jiang, X. M. (2021). Pollution haven or pollution halo? A Re-evaluation on the role of multinational enterprises in global CO2 emissions. Energy Econ. 97, 105181. doi:10.1016/j.eneco.2021.105181
Edziah, B. K., Sun, H. P., Adom, P. K., Wang, F., and Agyemang, A. O. (2022). The role of exogenous technological factors and renewable energy in carbon dioxide emission reduction in Sub-Saharan Africa. Energy 196 (16), 1418–1428. doi:10.1016/j.renene.2022.06.130
Fahad, S., Bai, G. B., Liu, L. C., and Baloch, Z. A. (2020). Heterogeneous impacts of environmental regulation on foreign direct investment: Do environmental regulation affect FDI decisions? Environ. Sci. Pollut. Res. 29, 5092–5104. doi:10.1007/s11356-021-15277-4
Feng, Y. C., Wang, X. H., Du, W. C., Wu, H. Y., and Wang, J. T. (2019). Effects of environmental regulation and FDI on urban innovation in China: A spatial durbin econometric analysis. J. Clean. Prod. 235, 210–224. doi:10.1016/j.jclepro.2019.06.184
Hakimi, A., and Hamdi, H. (2016). Trade liberalization, FDI inflows, environmental quality, and economic growth: A comparative analysis between Tunisia and Morocco. Renew. Sust. Energy Rev. 58, 1445–1456. doi:10.1016/j.rser.2015.12.280
Hanna, R. (2011). US environmental regulation and FDI: Evidence from a panel of US-based multinational firms. Am. Econ. J.-Appl. Econ. 2, 158–189. doi:10.1257/app.2.3.158
Jiang, H. W., Liang, Y. S., and Pan, S. Y. (2021). Foreign direct investment and regional innovation: Evidence from China. World Econ. 45, 1876–1909. doi:10.1111/twec.13205
Jiang, T. Y., Yu, Y., Jahanger, A., and Balsalobre-Lorente, D. (2022). Structural emissions reduction of China's power and heating industry under the goal of "double carbon": A perspective from input-output analysis. Sustain. Prod. Consump 31, 346–356. doi:10.1016/j.spc.2022.03.003
Khan, M. K., and Ozturk, I. (2020). Examining foreign direct investment and environmental pollution linkage in Asia. Environ. Sci. Pollut. Res. 27, 7244–7255. doi:10.1007/s11356-019-07387-x
Kim, Y., and Rhee, D. E. (2019). Do stringent environmental regulations attract foreign direct investment in developing countries? Evidence on the "race to the top" from cross-country panel data. Emerg. Mark. Financ. Trade. 55, 2796–2808. doi:10.1080/1540496x.2018.1531240
Li, X. S., Lu, Y. L., and Huang, R. (2021). Whether foreign direct investment can promote high-quality economic development under environmental regulation: Evidence from the yangtze river economic belt, China. Environ. Sci. Pollut. Res. 28, 21674–21683. doi:10.1007/s11356-020-12032-z
Liu, F. Q., Sim, J-Y., Sun, H. P., Edziah, B. K., Adom, P. K., and Song, S. F. (2023). Assessing the role of economic globalization on energy efficiency: Evidence from a global perspective. China Econ. Rev. 77 (1), 101897. doi:10.1016/j.chieco.2022.101897
Luo, Y. S., Lu, Z. N., Salman, M., and Song, S. F. (2022). Impacts of heterogenous technological innovations on green productivity: An empirical study from 261 cities in China. J. Clean. Prod. 334 (5), 1130241. doi:10.1016/j.jclepro.2021.130241
Mert, M., and Caglar, A. E. (2020). Testing pollution haven and pollution halo hypotheses for Turkey: A new perspective. Environ. Sci. Pollut. Res. 27, 32933–32943. doi:10.1007/s11356-020-09469-7
Millimet, D. L., and Roy, J. (2015). Empirical tests of the pollution haven hypothesis when environmental regulation is endogenous. J. Appl. Econom. 31, 652–677. doi:10.1002/jae.2451
Muller, D., Judd, C. M., and Yzerbyt, V. Y. (2005). When moderation is mediated and mediation is moderated. J. Pers. Soc. Psychol. 89, 852–863. doi:10.1037/0022-3514.89.6.852
Naqvi, A., and Stockhammer, E. (2018). Directed technological change in a postKeynesian ecological macromodel. Ecol. Econ. 154, 168–188. doi:10.1016/j.ecolecon.2018.07.008
Naughton, H. T. (2014). To shut down or to shift: Multinationals and environmental regulation. Ecol. Econ. 102, 113–117. doi:10.1016/j.ecolecon.2014.03.013
Pan, X. F., Guo, S. C., Han, C. C., Wang, M. Y., Song, J. B., and Liao, X. C. (2020). Influence of FDI quality on energy efficiency in China based on seemingly unrelated regression method. Energy. 192, 116463. doi:10.1016/j.energy.2019.116463
Porter, M. E. (1991). Towards a dynamic theory of strategy. Strateg. Manage. J. 12, 95–117. doi:10.1002/smj.4250121008
Porter, M. E., and Van Der Linder, C. (1995). Toward a new conception of the environment-competitiveness relationship. J. Econ. Perspect. 9, 97–118. doi:10.1257/jep.9.4.97
Rehman, A., Ma, H., Ozturk, I., Murshed, M., and Dagar, V. (2021). The dynamic impacts of CO2 emissions from different sources on Pakistan’s economic progress: A roadmap to sustainable development. Environ. Dev. Sustain 23, 17857–17880. doi:10.1007/s10668-021-01418-9
Ren, K., Kong, Y. S., Zhang, T. J., Sun, H. P., Zhu, N. P., and Liu, F. Q. (2022). The impact of the pollution permits system on green innovation: Evidence from the county-level data in China. J. Clean. Prod. 344 (5), 130896. doi:10.1016/j.jclepro.2022.130896
Salim, R., Yao, Y., Chen, G., and Zhang, L. (2017). Can foreign direct investment harness energy consumption in China? A time series investigation. Energy Econ. 66, 43–53. doi:10.1016/j.eneco.2017.05.026
Shahbaz, M., Mallick, H., Mahalik, M. K., and Hammoudeh, S. (2018a). Is globalization detrimental to financial development? Further evidence from a very large emerging economy with significant orientation towards policies. Appl. Econ. 50, 574–595. doi:10.1080/00036846.2017.1324615
Shahbaz, M., Nasir, M. A., and Roubaud, D. (2018b). Environmental degradation in France: The effects of FDI, financial development, and energy innovations. Energy Econ. 74, 843–857. doi:10.1016/j.eneco.2018.07.020
Tan, Z. X., Koondhar, M. A., Nawaz, K., Malik, M. N., Khan, Z. A., and Koondhar, M. A. (2021). Foreign direct investment, financial development, energy consumption, and air quality: A way for carbon neutrality in China. J. Environ. Manage 299, 113572. doi:10.1016/j.jenvman.2021.113572
Tawiah, V., Zakari, A., and Adedoyin, F. F. (2021). Determinants of green growth in developed and developing countries. Environ. Sci. Pollut. Res. 28, 39227–39242. doi:10.1007/s11356-021-13429-0
Vo, D. T. (2020). Dependency on FDI inflows and stock market linkages. Financ. Res. Lett. 38, 101463. doi:10.1016/j.frl.2020.101463
Walter, I., and Ugeloe, J. L. (1979). Environmental policies in developing countries. Ambio 8, 102–109. doi:10.2307/4312437
Wang, H., Dong, C. G., and Liu, Y. (2019). Beijing direct investment to its neighbors: A pollution haven or pollution halo effect? J. Clean. Prod. 239, 118062. doi:10.1016/j.jclepro.2019.118062
Xu, S. C., Li, Y. F., Zhang, J. N., Wang, Y., Ma, X. X., Liu, H. Y., et al. (2021). Do foreign direct investment and environmental regulation improve green technology innovation? An empirical analysis based on panel data from the Chinese manufacturing industry. Environ. Sci. Pollut. Res. 28, 55302–55314. doi:10.1007/s11356-021-14648-1
Yang, Q. Y., and Song, D. Y. (2019). How does environmental regulation break the resource curse: Theoretical and empirical study on China. Resour. Policy. 64, 101480. doi:10.1016/j.resourpol.2019.101480
Yu, X., and Li, Y. (2020). Effect of environmental regulation policy tools on the quality of foreign direct investment: An empirical study of China. J. Clean. Prod. 270, 122346. doi:10.1016/j.jclepro.2020.122346
Yu, Y., and Xu, W. (2019). Impact of FDI and R&D on China's industrial CO2 emissions reduction and trend prediction. Atmos. Pollut. Res. 10, 1627–1635. doi:10.1016/j.apr.2019.06.003
Yuan, Y., and MacKinnon, D. P. (2009). Bayesian mediation analysis. Psychol. Methods 14, 301–322. doi:10.1037/a0016972
Zeng, S. H., and Zhou, Y. (2021). Foreign direct investment's impact on China's economic growth, technological innovation and pollution. Int. J. Environ. Res. Public Health 18, 2839. doi:10.3390/ijerph18062839
Zhang, D. Y., and Kong, Q. X. (2021). How does energy policy affect firms' outward foreign direct investment: An explanation based on investment motivation and firms' performance. Energy Policy 158, 112548. doi:10.1016/j.enpol.2021.112548
Zhang, W. G., Li, X., Uddin, M. K., and Guo, S. C. (2020). Environmental regulation, foreign investment behavior, and carbon emissions for 30 provinces in China. J. Clean. Prod. 248, 119208. doi:10.1016/j.jclepro.2019.119208
Keywords: China’s environmental “Fee-to-Tax”, FDI, pollution halo, Porter hypothesis, intensity difference-in-differences
Citation: Huang J and Li Y (2023) China’s environmental “fee-to-tax” and foreign direct investment—An empirical study based on intensity difference-in-differences. Front. Environ. Sci. 11:978388. doi: 10.3389/fenvs.2023.978388
Received: 26 June 2022; Accepted: 21 February 2023;
Published: 15 March 2023.
Edited by:
Mark Amo-Boateng, University of Energy and Natural Resources, GhanaReviewed by:
Daniel Balsalobre-Lorente, University of Castilla-La Mancha, SpainSyed Anees Haider Zaidi, COMSATS University Islamabad, Pakistan
Huaping Sun, Jiangsu University, China
Copyright © 2023 Huang and Li. This is an open-access article distributed under the terms of the Creative Commons Attribution License (CC BY). The use, distribution or reproduction in other forums is permitted, provided the original author(s) and the copyright owner(s) are credited and that the original publication in this journal is cited, in accordance with accepted academic practice. No use, distribution or reproduction is permitted which does not comply with these terms.
*Correspondence: Yanfeng Li, bGl5YW5mZW5nQGh1ZmUuZWR1LmNu