 Jiaming Wang
95% of researchers rate our articles as excellent or good
Learn more about the work of our research integrity team to safeguard the quality of each article we publish.
Find out more
ORIGINAL RESEARCH article
Front. Environ. Sci. , 24 April 2023
Sec. Environmental Economics and Management
Volume 11 - 2023 | https://doi.org/10.3389/fenvs.2023.972980
This article is part of the Research Topic Socioeconomic Transition and Environmental Footprints View all 5 articles
The green development quality of the construction industry has vital environmental and economic effects. To explore regional differences and convergence, and further provide a reference for the government. Based on the panel data of construction industry development in 31 provinces from 2006 to 2020, this study measured the green development quality of the construction industry in two-dimensional space-time, focuses on the regional differences, the dynamic evolution trend and the convergence of distribution. The findings supported the fact that the green development quality of construction industry was fluctuating upward trend, the overall difference decreased, and the regional difference showed heterogeneity. The convergence rate in the central region was higher than that in the western region, and there was an obvious “catch-up effect.” The green development quality of the construction industry in the national, central region and western region has absolute β convergence. The green development quality of the construction industry in the national, the eastern region and the central region has conditional β convergence. The influence of control variables shows heterogeneity. Based on the conclusions of this study, policy recommendations are put forward from the aspects of science and technology investment, human capital investment and green construction mode.
With its long industrial chain, the construction industry’s multi-industry composite advantages have led to the rapid development of building materials, bidding, chemicals, decoration and other related industries, promoting the process of urbanization and modernization (Ghaleb et al., 2022). With the rapid development of economy and the rapid advance of industrialization and urbanization, the construction industry has a high development speed and vitality. However, with the transformation of the economy from the “extensive” to the “refined,” the construction industry not only promotes the growth of the national economy but also consumes considerable energy and resources, which has a negative impact on the ecological environment, such as greenhouse gas emissions, dust pollution and noise pollution (Wang et al., 2022). Additionally, the problems of extensive management mode, shortage of labor resources have reduced its efficiency and quality. These problems seriously restrict the transformation and upgrading of the construction industry. It is urgent to realize the transformation of the construction industry from rapid development to green high-quality development (Chen and Lin, 2021).
To solve the problems of environmental pollution and inefficient development in the construction industry, scholars have produced many achievements green construction, new building industrialization (Wang et al., 2021), building information models (Solla et al., 2022) and green construction technology (Juan and Lee, 2022). However, as an important pillar industry in the economy, the green development quality needs to be solved from the whole, including the differences in development level, sources and influencing factors. Existing scholars have measured the total factor productivity from the input–output index. Based on this, the research achievements from the index system, model and experience reference are formed (Nazarko and Chodakowska, 2015). Subsequently, some scholars studied the influencing factors, such as the combination of the OLS parameter estimation method (Fitrianto and Musakkal, 2016), the spatial Durbin model (Zhao et al., 2020), the spatial variable coefficient model and the σ convergence test method.
Strict environmental regulation will increase the production cost of enterprises, reduce competitiveness, further offset the positive effects of environmental policies, and then have a negative effect (Arthur, 2021). However, with the further deepening of theoretical research, the role of environmental policies should tend to be consistent from the perspective of short-term and long-term comprehensive evaluation (Aldieri et al., 2022). Environmental regulation in the short term will increase production costs, reduce efficiency, and further inhibit the short-term progress of enterprises. However, in the medium and long term, environmental regulation can force the technological innovation to obtain comparative advantages and promote the transformation, upgrading and high-quality development of enterprises (Zhang et al., 2021). Most Scholars focus on how to measure the total factor productivity and explore the influencing factors (Wang et al., 2020).
Combing the relevant research of existing experts, it can be seen that the research on the quality of green development of construction industry is the focus of controversy among experts and scholars. On the one hand, some experts and scholars believe that through the construction of index system to measure the green development quality of construction industry (Liu et al., 2022). On the other hand, some experts build input-output model to measure total factor productivity (Wang et al., 2020). After obtaining the green development quality of the construction industry, some scholars have explored its differences and development trends through a variety of spatial analysis models. Other experts and scholars believe that it is necessary to construct Dagum Gini coefficient (Miao et al., 2021) and convergence model (Lv et al., 2021) to analyze its regional differences and further explore its influencing factors.
However, under the guidance of high-quality economic development, the existing research on green building quality measurement and influencing factors mostly ignores environmental problems. Additionally, due to regional differences in natural endowments and construction volume, there are also regional differences in environmental problems (Wang et al., 2022). The green development quality of the construction industry and regional differences under the consideration of undesirable outputs have received little attention. Based on this finding, this study puts forward the following research questions.
1) How to introduce undesirable output indicators to consider the quality of green development in construction?
2) Are there any differences in the quality of the green development in construction in different regions?
3) Is there convergence of the green development quality in the construction industry among different regions, and what are the influencing factors?
Based on this, this study considered the development status of 31 provinces from 2006 to 2020 as the research sample (excluding Hong Kong, Macao, and Taiwan), and constructed the DEA model to clarify the green development quality status of the construction industry. The Dagum Gini coefficient and de-composition method were used to calculate the regional differences of the green development quality in the construction industry in each province. The kernel density estimation method was further used to analyze the distribution dynamics and characteristics of the green development quality of the construction industry at the national level and three regional levels. Finally, the σ convergence characteristics of the evolution of green development quality differences in the construction industry are discussed. Additionally, the existence of β convergence was verified through empirical tests, and the influence of control variables was further compared and analyzed. The research contribution of this study can be carried out from two aspects. First, combing undesirable output indicators as environmental factors for the development of construction industry, and introduced into the measurement model to provide reference and supplement for the research of experts and scholars in the same field. Second, after measuring the green development quality of the construction industry, this study conducts in-depth comparative analysis from the aspects of regional differences and sources, distribution dynamics and convergence characteristics, which can provide accurate guidance for the green and high-quality development of the construction industry, and provide reference for the development decisions of relevant departments and industry enterprises.
The structure of this study is as follows: Section 2 is the literature review. Section 3 gives the methods and data interpretation used in this study. Section 4 shows the results of the study, in-depth analysis and recommendations. Section 5 summarizes the full text.
The existing research on the quality of green development of the construction industry mostly exists the policy, such as various regions developing their own construction industry green development quality improvement related to technological progress policy recommendations (Yu et al., 2022). However, the measurement of the green development quality of the construction industry can be roughly carried out from three aspects: high-quality development, green development and sustainable development (Zhang et al., 2022).
From the perspective of research objects, it can be carried out from the regional level and the enterprise level. The research of regional level can be carried out the international level (Liu et al., 2018), national level (Sandberg et al., 2021), and provincial level (Chancellor and Lu, 2016). Research at the enterprise level mostly uses the micro data of construction enterprises for analysis, including construction quality (Rouzmehr et al., 2021), management level (Imran et al., 2022), scale efficiency and building energy consumption (Wang et al., 2022). In addition, some experts and scholars have studied the aspects of construction land, environmental pollution (Wang et al., 2021) and carbon emissions in the construction industry (Zhu et al., 2022).
From the perspective of research methods, it can be developed from two aspects of level and efficiency. The idea of level measurement is generally to construct the index system and measurement model of the construction industry for empirical evaluation. Most of the early studies started from the labor productivity and found that the lack of materials and the low level of labor skills would have a negative impact (Enshassi et al., 2007). However, when labor productivity is used to measure the productivity, the role of materials in productivity improvement is ignored. Therefore, some scholars use TFP to comprehensively measure the production efficiency (Wing and Walker, 1988). The level measurement is greatly affected by input variables. The idea of efficiency measurement is generally to use DEA and related expansion models to study the input–output efficiency of the construction industry, which represents its development quality. For example, technical progress, labor quality, raw material quality, capital, machinery and equipment are chosen as input indicators, and the construction industry output value (Li and Liu, 2010), turnover (Nazarko and Chodakowska, 2015) are chosen as output indicators.
By sorting out, it is found that personnel and equipment are two input indicators generally recognized by academic circles, the gross output value of the construction industry is generally used as the output index (Luo et al., 2021). For example, the three-stage DEA (Zhang et al., 2018), DEA-Malmquist index (Chen et al., 2018), SBM-DEA (Liu and Lin, 2016), and SE-DEA (Yuan et al., 2020). Additionally, some experts and scholars construct the MRIO method to measure the energy consumption (Hong et al., 2016) and use evolutionary game theory and collaborative theory analysis tools to conduct research on the systematic development of green buildings (Qiao et al., 2022). In view of the fact that efficiency can reflect the ratio of investment to output and can better solve the problem of level difference caused by excessive investment difference in level measurement, there are many studies on the input–output efficiency of the construction industry to measure its development quality and gradually reach a consensus. This study also uses the green total factor productivity (GTFP) of construction industry to measure its green development quality.
Based on the measurement of the green development quality, the existing research has carried out further in-depth research on the influencing factors (Liu et al., 2021) and policy recommendations (Zhang et al., 2019). However, it is worth noting that there is little in-depth analysis of the comparison and sources of regional/enterprise differences in existing research, and the differences and sources are an important basis for further comparison and reference of the regional construction industry.
The study of economic convergence can be traced back to the long-term economic growth model of the classical economy, which satisfies the diminishing marginal returns and the constant economies of scale (Solow, 1956). By taking the population growth rate and savings rate as exogenous variables, it is concluded that the birth rate and savings rate are the decisive factors affecting the convergence trend of the economy. Less developed regions can “catch up” over time by learning from the experience of developed regions and introducing advanced equipment and technology. The convergence of economic growth gradually became the focus of scholars in the 1980s, and σ convergence and β convergence are usually used for analysis (Barro, 1992). Subsequently, scholars have found that the basic hypothesis of neoclassical economic growth has certain limitations. The gap between rich countries and poor countries will not be narrowed but will show the ‘Matthew Effect’. Neoclassical economic growth scholars use conditional β convergence to replace absolute β convergence or propose ‘club convergence’ to carry out international economic convergence research (Quah, 1996). The existing studies on regional difference and convergence analysis are mostly after the measurement results, that is, the regional difference, its source and convergence of the measurement results are studied (Chivu et al., 2020). Regional differences and source analysis are essential steps in empirical analysis and play an important role in clarifying the status quo of different regions and identifying gaps. Most of the studies focus on the location conditions (Li et al., 2021), the degree of regional market development, regional economic structure and the difference in regional production factor input (Braun and Weber, 2021). Most studies on regional differences and their sources use the Dagum Gini coefficient (Lv et al., 2021), Theil index (Cui et al., 2022), impulse response function (Zhu and Zhang, 2021), data-driven clustering algorithm (Chen and Lin, 2021), and exploratory spatial data analysis (Wang et al., 2021). Most of them analyze differences according to regional and type classification standards and further explore the sources of differences (Schneider et al., 2013).
There are differences in natural endowment and technical level in the development of construction industry in the eastern, central and western regions of China. Combined with the existing research on regional differences, the research hypotheses are proposed as follows.
H1: There are obvious regional differences of the green development quality in the construction industry.
In view of this study, the research on regional differences of green development quality of the construction industry is carried out from the overall differences, intra-regional difference and inter-regional difference. Therefore, H1 is subdivided into three sub-hypotheses.
H1.1: There are obvious overall differences of the green development quality in the construction industry.
H1.2: There are obvious intra-regional difference of the green development quality in the construction industry.
H1.3: There are obvious inter-regional difference of the green development quality in the construction industry among the eastern, central and western regions.
The convergence theory of economic growth holds that if the economy of an economy satisfies the convergence process, the marginal output of the backward regions is relatively high, and the economic growth rate will be faster so that the backward regions will eventually catch up with the developed regions. Finally, the inter-regional differences will gradually shrink into a stable state. Scholars who studied spatial econometric models earlier constructed a spatial autoregressive model for research and then expanded it to a panel data model. In this field, scholars have studied the spatial component error from the spatial dependence of panel data, the spatial effect of random components and perturbations (Kapoor et al., 2007). Then, Mutl and Pfaffermayr. (2011) propose the Hausman type specification test (Mutl and Pfaffermayr, 2011). Spatial panel data model is widely used in carbon emission (Wang et al., 2022), industrial resource allocation and agricultural production (Wang et al., 2021). Existing studies on spatial convergence analysis mostly use spatial econometric models, such as the spatial dynamic panel data model (Xu and Li, 2020), absolute β-convergence (Hao and Peng, 2017), and the SAR Tobit model (Liu et al., 2022). Most of them analyze the spatial evolution trend, which plays an important role in different regions of gap evolution analysis.
Based on the existing research on spatial convergence, this study selects the combination of σ convergence and β convergence for study. β convergence is further divided into absolute β convergence and conditional β convergence. Most of the existing studies have selected industrial structure, human capital, investment in science and technology, openness, urbanization and other related indicators as control variables. Since this paper studies the green development quality of construction industry, environmental regulation indicators are essential (Liu et al., 2022). Most of the existing studies regarding environmental regulation as a control variable measure it by the amount of investment in environmental pollution. However, as the key point in the process of urbanization and industrialization, it is obviously not enough to measure environmental regulation only by the amount of investment in environmental pollution. Therefore, this study innovatively divides the environmental regulation indicators into three categories: command-based environmental regulation (Tang et al., 2020), market-based environmental regulation (Peng et al., 2021) and voluntary-based environmental regulation (Bu et al., 2020). It synthesizes the three categories of indicators from the three subjects of government, market and stakeholders, and uses the sequential global principal component analysis to comprehensively measure environmental regulation. Command-based environmental regulation mainly considers the investment in environmental pollution control. Market-based environmental regulation mainly considers the investment in green innovation incentive policy and environmental protection tax. Voluntary-based environmental regulation mainly considers the number of environmental petition cases.
In recent years, China has continuously introduced regional coordinated development strategies such as the Western Development and the Rise of Central China, which has an important impact on the regional differences and convergence of the green development in the construction industry. Combined with the existing research on regional convergence, the research hypotheses are proposed as follows.
H2: There are obvious convergence characteristics of the green development quality in the construction industry.
In view of this study, the convergence characteristics of green development quality in the construction industry is carried out from the national region, the eastern region, the central region and the western region. Therefore, H1 is subdivided into four sub-hypotheses.
H2.1: There are obvious convergence characteristics of the green development quality in the construction industry in the national region.
H2.2: There are obvious convergence characteristics of the green development quality in the construction industry in the eastern region.
H2.3: There are obvious convergence characteristics of the green development quality in the construction industry in the central region.
H2.4: There are obvious convergence characteristics of the green development quality in the construction industry in the western region.
As mentioned above, the existing measurement of development quality can be roughly carried out from two aspects. The first is to construct the index system and mathematical model to measure, the second is through the input-output model to measure. The input-output model is measured by efficiency, which avoids the problem of difference in results caused by large differences in input of different samples. This study analyzes the regional differences and convergence of green development quality of construction industry, it is obvious that the input-output model is more appropriate (Yang et al., 2022). Therefore, this study selected GTFP to measure the green development quality of the construction industry, constructed the DEA model (Liu et al., 2016) and measured 31 provinces from 2006 to 2020. The classical DEA model can only measure the input-output efficiency. This study aims to introduce undesirable outputs to measure the green development quality of the construction industry, that is, the input-output efficiency of green development, this is also one of the innovations of this study. Therefore, on the basis of previous studies, this study expands the classical DEA model to the DEA-Malmquist index model (Nazarko and Chodakowska, 2015), and takes the GTFP as an indicator to measure the green development quality of the construction industry. Since this model has developed relatively well, only key steps are listed, such as Formula 1:
Where Sx and Sy represent inputs and outputs, respectively, and Sb is a slack variable for expected outputs.
This study draws on previous studies and used the Dagum Gini coefficient to analyze the differences of the green development quality in the construction industry among different regions. This is defined as Formula 2.
Where G represents the overall Gini coefficient, k is the number of regions divided (eastern, central and western regions), n is the number of all provinces, nj (nk) is the number of provinces in region j (h), and yji (jkr) is the green development quality level of the i(r) province in region j (h), where
The total Gini coefficient G can be divided into three parts: intra-regional difference contribution Gω, inter-regional difference contribution Gnb and super variable density Gt. The four parts meet the following relationship:
Where Gjj is the Gini coefficient of region j, Gjh is the Gini coefficient between region j and region h, and Djh indicates the mutual influence of the green development quality of the construction industry between region j and region h.
To analyze the dynamic evolution trend of the green development quality of the construction industry, this study used the kernel density estimation method (Lv et al., 2021) to study its distribution trend, distribution ductility and polarization trend. Suppose the density function of random variable X, such as Formula 11.
Among them, Xi for independent and identically distributed sample data, x is the mean value, N is the number of observations, h is the bandwidth, and K(*) is the kernel function, where
In this study, σ convergence (Eva et al., 2022) and β convergence (Próchniak and Witkowski, 2013) are used to study the spatial and temporal convergence of the green development quality of the construction industry, where β convergence is divided into absolute β convergence and conditional β convergence.
1 σ convergence test method. σ convergence reflects the decreasing trend of the deviation from the overall level of green development quality of the construction industry in different regions over time. In this study, the coefficient of variation method was used for calculation.
Where Qij represents the green development quality of the construction industry in region j.
2 β convergence test method. β convergence means that with the passage of time, the areas with a low level of green development quality will gradually catch up with the developed areas because of its higher growth rate, and the gap between the two will gradually narrow and eventually reach a consistent steady level. Absolute β convergence refers to the convergence trend of changes in the level of green development quality among regions over time without considering the influence of a series of factors, such as industrial structure, human capital, investment in science and technology, openness, urbanization, and environmental regulation among regions, while conditional β convergence refers to the convergence phenomenon among regions after considering these factors. Absolute β convergence measurement model such as Formula 14.
Where
Due to the differences in industrial structure, human capital, technology investment, opening level, urbanization, environmental regulation, etc., in different regions, to make the convergence results more realistic and strengthen the scientific nature of the analysis, this study adds these parameters to the absolute β convergence test model. Control variables and construct a conditional β convergence test model such as Formula 15.
Where λ is the parameter to be estimated for the control variable, Control is the control variable, j represents the control variable, and n is the number of control variables.
This study selected the panel data of 31 provinces from 2006 to 2020 as the research sample to measure the green development quality of the construction industry. The specific indicators are as follows:
1 Indicators for measuring the green development quality are shown in Table 1.
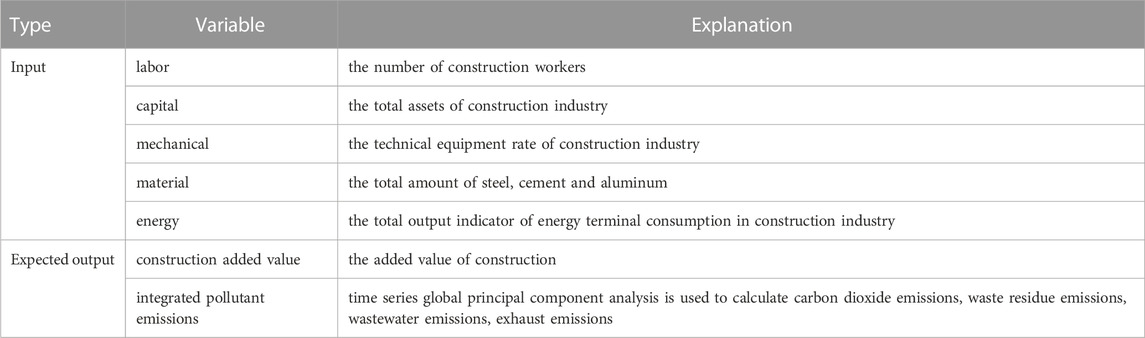
TABLE 1. Indicators for measuring the green development quality of the construction industry.
Control variable of conditional β convergence: industrial structure (GDP of construction industry/regional GDP) (Du et al., 2022), human capital (average wage of construction industry) (Xu and Li, 2020), investment in science and technology (investment in science and technology of construction industry/fiscal expenditure) (Li et al., 2022), opening level (total import and export/GDP) (Peng, 2020), urbanization (total urban population/total population) (Xu and Wang, 2020), environmental regulation (command-based environmental regulation, market-based environmental regulation, voluntary-based environmental regulation) (Zou and Zhang, 2022).
The above raw data come from the China Statistical Yearbook, China Construction Industry Statistical Yearbook, statistical yearbooks of other provinces and cities, and various statistical bulletins from 2006 to 2020. However, the relevant statistical indicators in some minority areas have not been published. In this study, through the difference method, linear regression and other methods, the average value of surrounding areas is converted to supplement the missing data.
The existing research on the green development quality of the construction industry has rarely carried out standard research and has not formed a unified gradient division standard. Therefore, based on the measurement results, the interval of 1.9999 is divided into four gradients (Table 2).
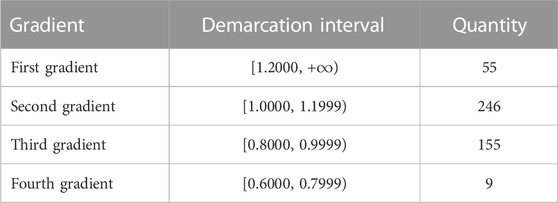
TABLE 2. Green development quality gradient distribution table of the construction industry.
The number of a column in Table 2 represents the total number of provinces with green development quality of construction industry in the corresponding gradient from 2006 to 2020. The green development quality in the second gradient was the largest, followed by the third gradient, the first gradient and the fourth gradient. 86 percent of the green development quality of construction in 31 provinces in 2006–2020 was at a medium level. However, the number of prefecture-level cities in the first and fourth gradients shows a cliff-like distribution, and the quality gap of green development is large.
In order to show the spatial and temporal evolution trend of green development quality in the construction industry more intuitively, this study selects the measurement results of 2006, 2010, 2015, and 2020 to draw a spatial and temporal evolution trend map of green development quality in the construction industry (Figure 1). We found that the green development quality in each province shows a fluctuating upward trend. Among them, Hainan, Beijing and Shanghai ranks at the top and was much higher than that in other provinces. Xinjiang, Shanxi and Inner Mongolia are relatively backward. From 2006 to 2020, the top five in the order of growth rate were Jilin, Qinghai, Shanxi, Heilongjiang and Tibet. In 2020, the top five green development qualities of the construction industry are Beijing, Qinghai, Fujian, Shanghai, and Tibet. The reason may be that Beijing takes the proportion of urban green building area to new buildings as an index in the field of construction into the green development index system to characterize the percentage of urban green building area to urban new building area. The relevant departments further promote the green innovation in the field of construction, increase the incentive policy of prefabricated buildings, improve the incentive management of green ecological demonstration zones, and continuously promote the development of green innovation in the field of construction in Beijing. As one of the important regions in the northwest, Qinghai attaches great importance to energy conservation and actively promotes the development of green buildings. Under the guidance of policies, Qinghai comprehensively implements green building standards, effectively strengthens the management of the construction process, and clarifies the responsibility of green building work. Fujian Province has issued regulations on the planning, design and construction, operation and transformation, technology and application, guidance and incentive of green buildings. Shanghai accelerates the development of green buildings and improves the regional green ecological livable performance. In particular, Tibet, due to its low level of development in the construction industry and undesirable industry output is low, so the green development of the construction industry quality is higher, and the ranking is relatively advanced. The subsidies for renewable energy expansion will drive the growth of related industries and even the total output (Zhang et al., 2021), thereby forcing the transformation and upgrading of the traditional construction industry, optimizing the structure and quality of energy input, and thus boosting the development of the green construction industry. From 2019 to 2020, COVID-19 pandemic also inhibited the green development speed and improved the quality of the construction industry in some areas, For example, the use of low-carbon raw materials, the transformation of ventilation technology, and the improvement of intelligence.
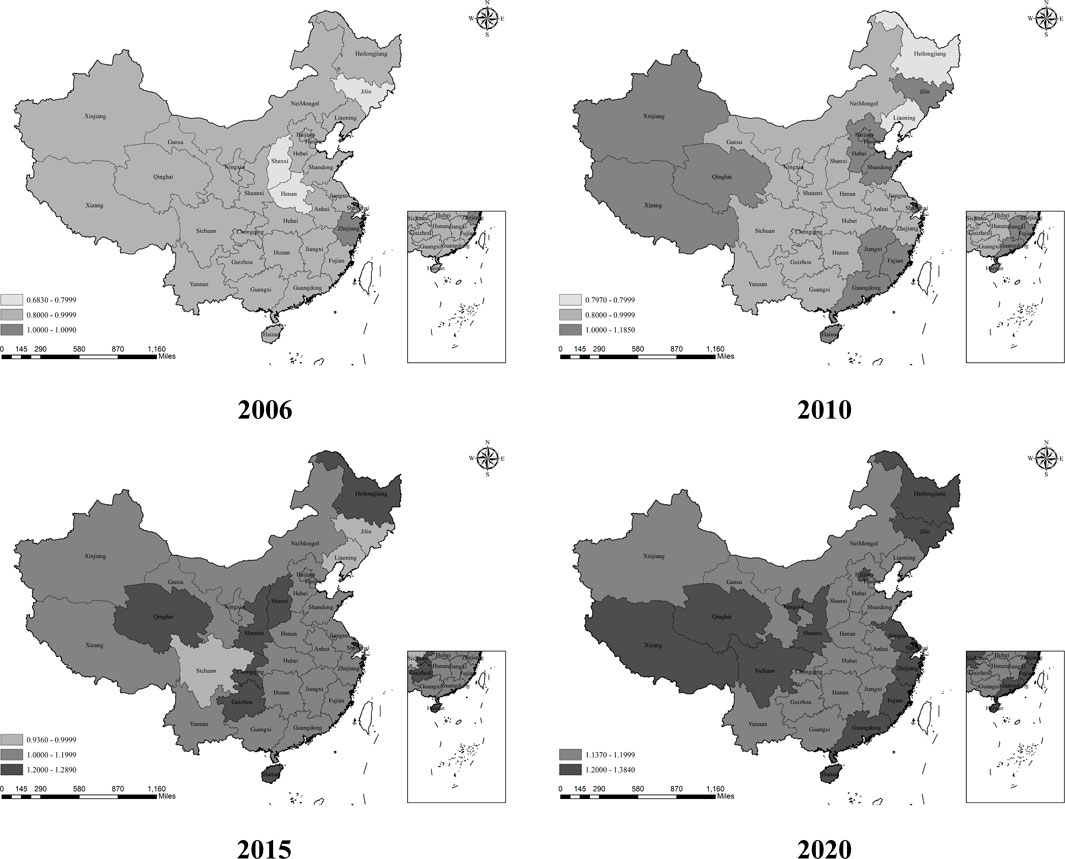
FIGURE 1. Time-space evolution trend diagram of green development quality in the construction industry.
In this study, the Dagum Gini coefficient is used to measure the regional differences and contribution rate of the green development quality of the construction industry in the eastern, central and western regions. The results are shown in Table 3.
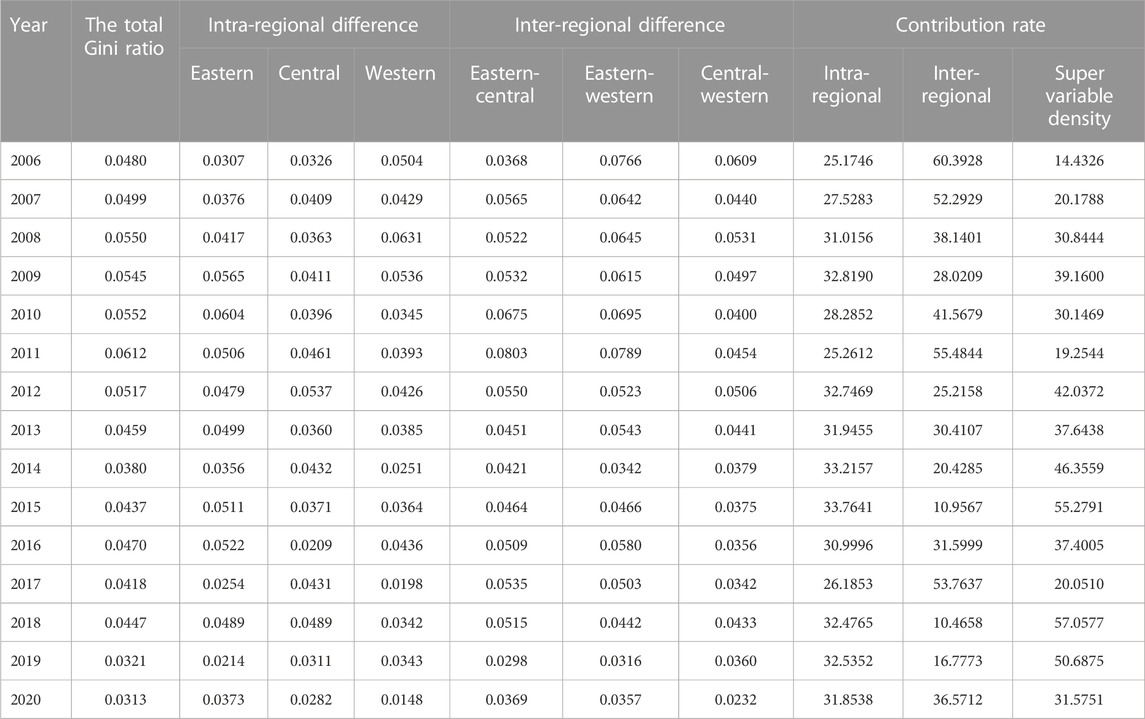
TABLE 3. Regional difference and contribution rate of green development quality in the construction industry.
Combined with table 3, the overall difference line chart of the green development quality of the construction industry is drawn (Figure 2).
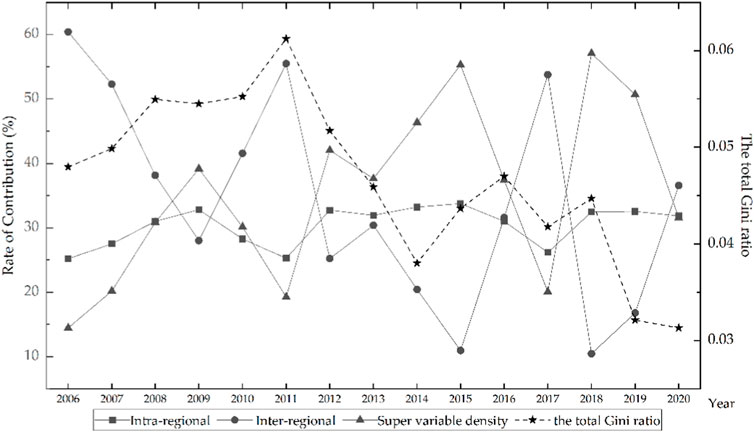
FIGURE 2. Overall difference and contribution rate of green development quality in the construction industry.
Figure 2 shows that the overall regional difference has a fluctuating downward trend. From 2006 to 2011, the regional difference has a fluctuating upward trend. The overall Gini coefficient of the green development quality in 2011 was the maximum (0.0612) in the sample period. The regional difference has a downward trend in 2011–2014, a slow upward trend in 2014–2016, and a fluctuating downward trend and a small decline in 2016–2020. The overall Gini coefficient of the green development quality in 2020 was the minimum in the sample period (0.313). The overall regional difference in the early stage of the sample period is large, and the middle and late stages gradually decrease.
The contribution rate of intra-regional differences generally shows a slight upward trend in fluctuations. The contribution rate in 2006 was 25.17%, and it increased to 31.85% in 2020. Compared with 2006, it increased slightly by 6.68%, with an increase of approximately 26.53%, and the fluctuation in the sample period was large. The contribution rate of regional differences is generally irregular and relatively intense. In 2006, the contribution rate of inter-regional differences was 60.39%, and it dropped to 36.57% in 2020, which was 23.82% lower than that in 2006, with a decrease of approximately 39.44%, and the sample period fluctuated greatly. During the sample period, its contribution rate showed a fluctuation trend opposite to the regional difference. In 2006, the contribution rate of hypervariable density was 14.43%, and in 2020, its contribution rate increased by nearly 17.14% compared with that in 2006. Overall, the contribution rate of regional differences is mainly dominated by regional differences with large fluctuations, and it has increased year by year in recent years.
A regional difference line chart of green development quality in the construction industry is shown in Table 3 (Figure 3).
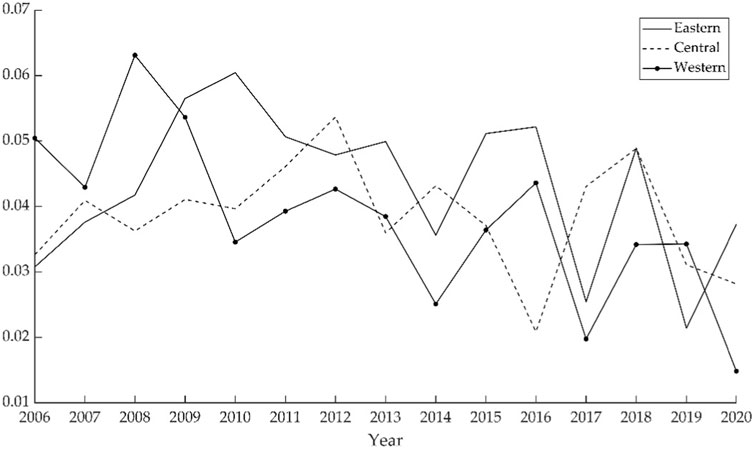
FIGURE 3. Regional difference line map of green development quality in the construction industry.
Figure 3 shows that the eastern region in 2006–2010 showed a sharp upward trend. In 2010, it reached the maximum in the sample period, then showed a ‘rising-decreasing’ fluctuation trend, and continued to 2020. It is worth noting that intra-regional differences in the eastern region have also increased by 0.0065, an increase of approximately 21.25%. The central region showed an upward trend in 2006–2012, a downward trend in 2012–2016, and a sharp upward trend after 2016, followed by a downward trend in 2018. The intra-regional difference in the central region decreased by 0.0044, with a decrease of approximately 13.63%. The intra-regional differences in the western region fluctuated violently. The intra-regional differences in the western region decreased significantly by 0.0356, a decrease of approximately 70.59%.
The differences in the eastern region show an expanding trend in fluctuations, and the western region shows a significant narrowing trend, while the central region shows a weak downward trend. The differences in the eastern region were greater than those in the central and western regions, with mean values of 0.0432, 0.0386, and 0.0382, respectively. In recent years, the internal differences in the eastern region have shown an expanding trend. The provinces in the eastern region have a more complete system in the construction industry level, environmental protection awareness and high-tech. The overall green development quality of the construction industry is significantly higher, and the relatively developed cities have accelerated their development. However, the improvement of the provincial and municipal levels of the green development quality of the construction industry lags behind, which has widened the regional differences. The gap of green development quality between provinces and cities in the central region is relatively small, and the performance is relatively more balanced, which is related to promoting building energy efficiency to promote green development and exploring renewable energy building application technology measures. The central region is roughly close, so the regional difference is relatively small. The provinces and cities with relatively backward green development quality in the western region actively explore new models, gradually improve the development of energy management and green construction, and gradually narrow the regional differences. Tracing the deeper reasons, it depends on the comprehensive influence of economic strength, population density, construction industry development level and other factors of the provinces of three regions.
The Inter-regional Difference Line Diagram of Green Development Quality in the Construction Industry Combined with Table 3 is shown in Figure 4.
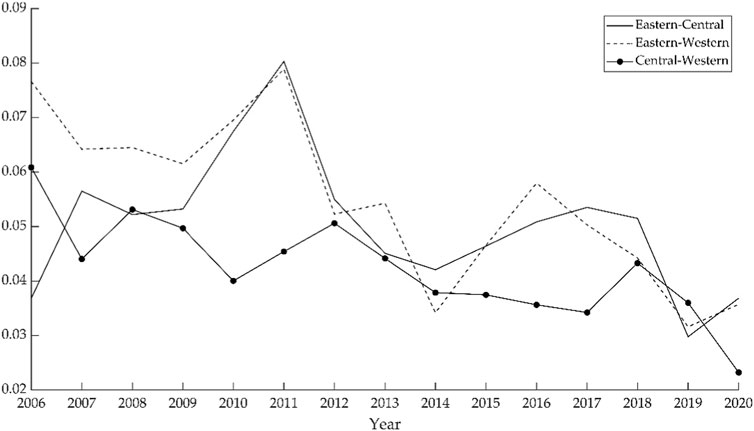
FIGURE 4. Inter-regional difference line chart of the green development quality of the construction industry.
Figure 4 shows that the difference between the eastern and central regions fluctuates greatly along the mean value. During the sample period, it only decreases by 0.0001, and the decrease is minimal, but the fluctuation is relatively severe. The inter-regional differences between the eastern and western regions generally show a downward trend in the fluctuation. Although there is a certain upward trend in some years, it has no significant impact on the overall downward trend. The inter-regional Gini coefficient declined by 0.0409, approximately 53.4%. The differences between the central and western regions generally show a downward trend in fluctuation, but the downward trend is relatively slow compared with the central region. Although there is a certain range of fluctuations in the sample period, it does not affect the overall downward trend. The Gini coefficient between the central and western regions decreased by 0.0376, a decrease of approximately 61.8%.
From the perspective of numerical differences, the average value of the green development quality is sorted from large to small as eastern-western, eastern-central and central-western. The possible reason for this situation is that the eastern coastal area not only has a superior geographical position but also in its development process, government investment, construction development, the development of high-tech enterprises and policy support and other favorable conditions have laid a favorable green development environment for the construction industry in the eastern region, providing all-round support. However, although the central and western regions have resource endowment advantages, the green development concept is relatively weak, which leads to the relatively backward development of the central and western regions and thus makes the green development quality of the construction industry in these two regions relatively low.
Through the above in-depth comparative analysis of the overall differences, intra-regional differences, inter-regional differences of green development quality in the construction industry, it is confirmed that the above mentioned H1.1, H1.2, and H1.3. There are obvious overall differences, intra-regional differences and inter-regional differences of green development quality in the construction industry, and regional differences are heterogeneous.
In order to better explain the distribution dynamics and evolution law of the green development quality of the construction industry, this study constructed the kernel density estimation method to analyze its distribution, situation, ductility (Figures 5–8).
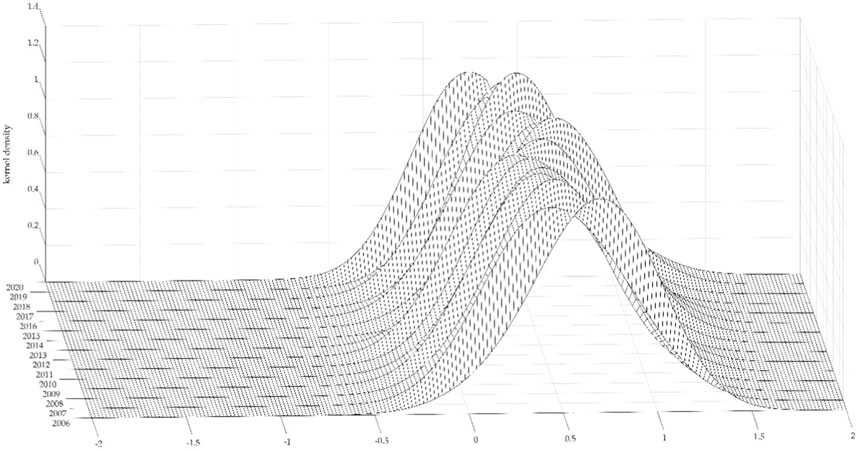
FIGURE 5. Dynamic evolution at the national level.
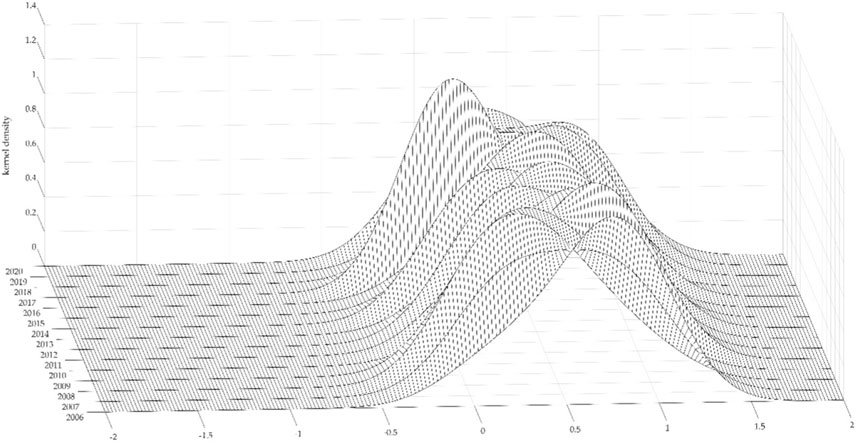
FIGURE 6. Dynamic evolution at the eastern region.
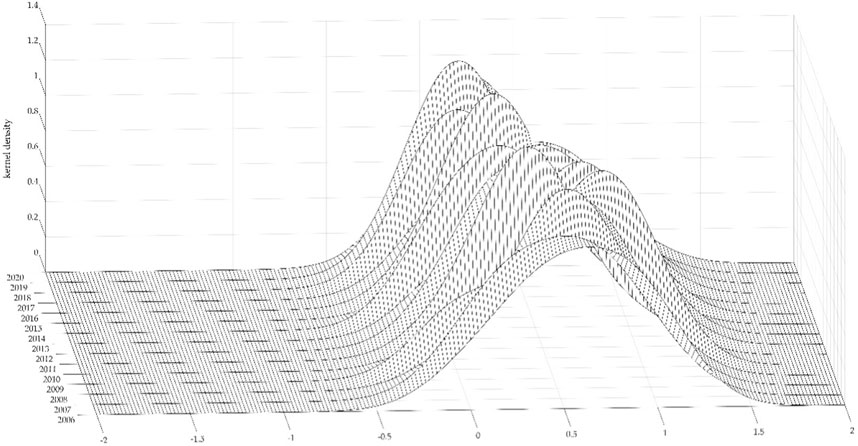
FIGURE 7. Dynamic evolution at the central region.
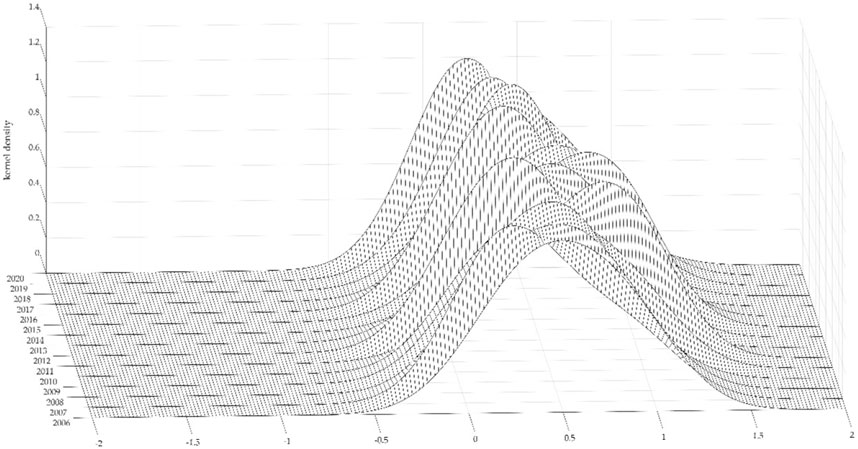
FIGURE 8. Dynamic evolution at the central region.
Figure 5 shows that there is only one main peak at the national level, indicating that there is no polarization. Specifically, from 2006 to 2012, the peak value of the kernel density estimation curve decreased slightly, and the center of the density function shifted left, indicating that the overall green development quality showed a downward trend. The function width was widened, indicating that the regional difference had a certain degree of expansion trend. From 2012 to 2014, the peak value increased year by year, and the center of the density function shifted right, indicating that the overall level was improved. From 2014 to 2016, it decreased again, and the center of the density function moved left. From 2016 to 2017, after the peak value rebounded, it showed a slight downward trend by 2020. The function width narrowed, indicating that the regional differences decreased year by year.
Figure 6 shows that from the evolution of the peaks, the main peak position of the distribution curve of the green development quality of the construction industry in the eastern region moves to the right, and the height of the main peak increases slightly, indicating that the overall green development quality of the construction industry in the eastern region has improved but is not obvious. The width of the main peak shape decreased year by year, and two main peaks appeared in some years (2019). The position of the main peak and the side peak expanded, indicating that the polarization trend in the eastern region was increasingly obvious. However, the height of the lateral peak decreases, and the width broadens, indicating that the eastern region has regional differences but absolute differences tend to shrink.
Figure 7 shows that the trend of distribution curve in the central region moves to the right. In addition to the rise of the main peak in 2016–2017, the overall peak change is ‘up-down-up’, and the width of the main peak is shrinking, indicating that the central region is generally improving, and the regional differences have a narrowing trend. In particular, the distribution curves of 2012 and 2018 were right-tailed and extended, with side peaks, indicating that the central region had a polarization trend during the 2 years.
Figure 8 shows that the distribution curve in the western region generally shifts to the right. In 2010 and 2018, the height of the main peak decreases slightly, but there is always a main peak, and there is no regional polarization. This shows that the western region is improving on the whole, but the regional differences are expanding.
It can be seen from Section 4.1 and Section 4.2 that the green development quality of the construction industry has obvious differences between regions and provinces. To explore whether this difference has convergence and a “catch-up effect,” this study reveals the convergence characteristics of the green development quality of the construction industry by σ convergence and conditional β convergence (Figure 9).
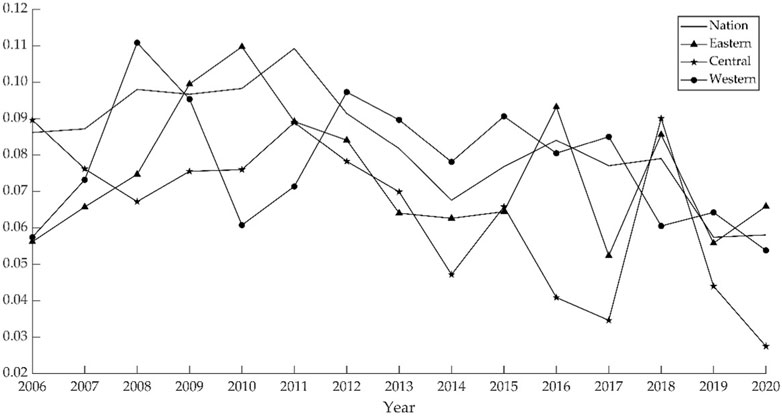
FIGURE 9. Evolution trend of the variation coefficient of green development quality in the construction industry.
Figure 9 shows that the national level generally showed a downward trend of fluctuation. The coefficient of variation in 2020 decreased by nearly 0.0282 compared with that in 2006, with a decrease of 32.66%. The eastern region generally showed a trend of “steady rise—slowing down—lifting staggered—rebound,” and the steady rise stage mainly occurred in 2006–2010. The coefficient of variation increased by 0.0097 in 2020 compared with 2006, an increase of approximately 14.31%. In the sample period of the central region, there was a downward trend of fluctuation on the whole, the obvious decline occurred in the period of 2006–2008, and there was an upward trend of fluctuation from 2008 to 2011. Compared with 2006, it decreased by 0.0621 in 2020, a decrease of 69.31%. In general, the western region shows a continuous downward trend, its coefficient of variation in 2020 is reduced by nearly 0.0036 compared with 2006, with a decrease of 6.28%. The σ convergence coefficient at the national, central and western regions shows a downward trend. The evolution trend of regional differences in the eastern region has not shown an obvious convergence phenomenon. Moreover, the convergence rate of the central region is significantly higher than the western region, and the “catch-up effect” exists.
After σ convergence, this study conducts the absolute β convergence test and conditional β convergence test of the green development quality of the construction industry (Table 4).
1 Absolute β convergence analysis
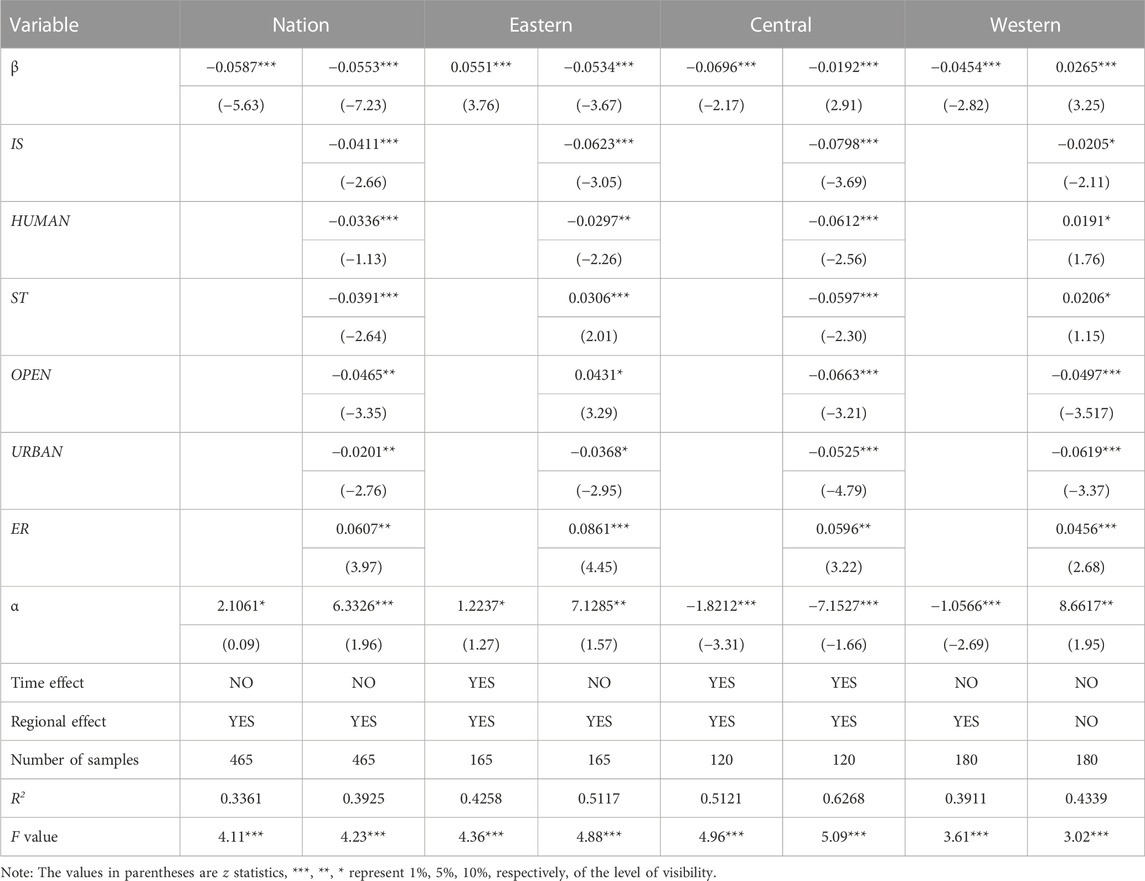
TABLE 4. Test results of absolute β convergence and conditional β convergence.
The β coefficients in the national, central and western regions were all less than 0, and all passed the 1% level of visibility test. The green development quality of the construction industry in the national, central and western regions has absolute β convergence. In the case of a similar industrial structure, human capital, science and technology investment, opening level, urbanization, environmental regulation and other influencing factors, the green development quality of each province will eventually converge to the same steady level over time, and the eastern region doesn’t show an absolute β convergence trend. Compared with the provinces with higher quality of green development in the construction industry, the provinces with lower quality of green development in the construction industry have a faster growth rate, and the regional gap has gradually decreased. The convergence rates of the central region and the western region are 0.2629 and 0.0721, respectively. The central region has a faster convergence rate, while the western region has a slower convergence rate. It is particularly noted that the above tests for absolute β convergence are estimated and judged under the similar circumstances of industrial structure, human capital, science and technology investment, opening level, urbanization and environmental regulation in various provinces and cities, but in practice, different regions have great heterogeneity in these factors, so it is necessary to further test its convergence, that is, the conditional β convergence test.
2 Conditional β convergence analysis
The convergence coefficient β at the national, eastern and central region was negative, and all passed the 1% aboriginality level test. The convergence coefficient β in the western region was positive. Under the condition of considering other heterogeneous influencing factors except the initial value, the green development quality of the construction industry at the national, eastern and central region has conditional convergence. At the national level, the green development quality of the construction industry in the eastern and central region is developing toward its steady-state level. The conditional β convergence rates in the eastern and central regions are 0.0982 and 0.2223. The convergence rate in the central region is greater than that in the eastern region. After considering the regional industrial structure, human capital, science and technology investment, opening level, urbanization, and environmental regulation factors, the convergence rate also changed. In particular, the eastern region does not show a convergence trend in absolute β convergence analysis and shows a convergence trend in conditional β convergence analysis. The western region shows a convergence trend in the absolute β convergence analysis and does not show a convergence trend in the conditional β convergence analysis.
The convergence rates at the national, eastern and central region are 0.1065, 0.0982 and 0.2223. The provinces and cities with low green development quality have a catch-up effect on higher provinces and cities. By analyzing the regression results of the control variables, the coefficients and the levels of dominance of each control variable are different.
The regression coefficient of industrial structure is significantly negative. The optimization of the industrial structure contributes to the spatial convergence of the green development quality of the construction industry and can promote the narrowing of regional differences. In addition, the industrial structure represented by the tertiary industry studied by other scholars is not consistent, and the positive effect is transferred from the east to the middle (Du et al., 2022).
The regression coefficient of human capital is significantly negative in the national, eastern and central regions, while it is significantly positive in the western part. Investment in human capital helps to narrow the development gap of construction industry in central and western regions, and education plays an important role in the cultivation of human capital (Altaf et al., 2022). The improvement of human capital contributes to spatial convergence at the national, eastern and central regions and to narrowing regional differences. However, although improving human capital in the western region helps to promote the quality of green development of the western construction industry, it has an inhibitory effect on narrowing regional differences.
The regression coefficient of science and technology input is negative in the national and central regions and positive in the eastern and western regions. Green technology innovation behavior of construction enterprises is a kind of technology innovation behavior which is beneficial to their own economic development and environmental protection, and helps to achieve the goal of green development (Li et al., 2022). Increasing investment in science and technology is conducive to narrowing regional differences. Scientific and technological innovation is the basis for the green development of the construction industry. Talent training is an important factor in scientific and technological investment, an important carrier to support the research, promotion and application of technology in the construction industry, and it is crucial to improve the ability of independent innovation. The healthy and sustainable development of green buildings in the central region largely depends on the support of science and technology investment, so the conclusion is consistent with this paper (Wang et al., 2021).
The regression coefficient of openness was negative at the national, central and western regions, and positive in the eastern region. The improvement has a promoting effect on the improvement of the green development quality at the national, central and western regions. Since the reform and opening up, the openness factor has been reflected in FDI in economic modernization (Sukhadolets et al., 2021). For the central and western regions, foreign capital and technology are more conducive to narrowing the difference in green development of construction industry (Babatunde et al., 2018). However, the narrowing of regional differences in the eastern region has an inhibitory effect.
The regression coefficient of the urbanization level is significantly negative. The improvement of the urbanization level is conducive to the improvement of the green development quality of the construction industry, and helps to reduce regional differences.
The regression coefficient of environmental regulation is significantly positive. In terms of environmental regulation, we find that consistent with the conclusions of other scholars, mandatory policies and incentive policies are conducive to the development of green buildings, and mandatory policies are more effective in encouraging green building construction (Song et al., 2021). Strengthening environmental regulation can promote the spatial convergence of the green development quality of the construction industry, but it has an inhibitory effect on the reduction in regional differences.
Through the above σ convergence test and β convergence test of green development quality in the construction industry, it is found that there are obvious convergence characteristics at the national region, the central region and the western region, and there is no obvious convergence characteristics in the eastern region. Therefore, this study confirms that the above mentioned H2.2, H2.3, H2.4, and falsifies H2.1.
First, after considering undesirable outputs, the overall quality of green development in the construction industry is high, but there is still room for improvement. During the sample period, the green development quality in each province fluctuated upward, and the growth rate was roughly similar. The green development quality in Hainan, Beijing and Shanghai was in the forefront and far higher than that in other provinces, and Xinjiang, Shanxi and Inner Mongolia were relatively backward. The green development transformation of the construction industry has achieved certain results.
Second, the regional difference of the green development quality in the construction industry is reduced. During the sample period, the overall regional differences of the green development quality in the construction industry showed a fluctuating downward trend. Regional differences from large to small in turn for the eastern, central and western region. The differences between the eastern and central regions fluctuated greatly, and the differences between the eastern and western regions, between the central and western regions decreased in fluctuation. The regional differences showed heterogeneity. The contribution rate of regional differences mainly comes from the fluctuating regional differences.
Third, the deviation of the green development quality at the national, central and western regions tends to decrease over time, and the σ convergence coefficient shows a downward trend. There is no obvious indigenous convergence in the evolution trend of the green development quality of the construction industry in the eastern region. The convergence rate in the central region is obviously higher than that in the western region, and there is a significant “catch-up effect.”
Fourth, the green development quality of the construction industry in the central and western regions shows a “catch-up effect,” and there is absolute β convergence. After considering a series of control variables, the green development quality of the construction industry at the national, eastern and central region has conditional β convergence, and the influence of control variables is heterogeneous.
Based on the conclusions and the actual of green development of construction industry in China, targeted policy recommendations are as follows.
First, increase investment in construction technology, accelerate the coordinated development of intelligent construction and new building industrialization. Continuously improve the intelligent construction policy and industrial system, integrate the industrial chain to create an advantage platform. The provinces in the central region, especially with the driving role of science and technology investment. On the one hand, improve the quality of green development of construction industry. On the other hand, narrow the regional gap to promote the overall rise of central China.
Second, increase human capital investment in green construction industry, cultivate new construction personnel. Human capital contributes to the spatial convergence of construction across the country, eastern and central regions. Therefore, on the one hand, it is necessary to increase human capital investment. On the other hand, it is necessary to strengthen the orderly allocation of human resources in the eastern, central and western regions, improve the system and mechanism of talent flow, and further promote the green development of the construction industry.
Third, comprehensively promote green construction. Environmental regulation can reduce regional differences in the whole country, eastern region, central region and western region. Therefore, it is necessary to continuously deepen the pilot work of green construction, cultivate the innovation center of green construction, and explore the establishment of green construction industry with integrated and coordinated whole industrial chain.
As can be seen from the full text, this study makes an in-depth comparative analysis of the green development quality of construction industry from the aspects of regional differences and sources, distribution dynamics and convergence characteristics. However, due to the availability of data, this study doesn’t conduct a detailed study on the internal division of provinces, and doesn’t further explore the threshold effect of different control variables, which is also the direction and trend of future research in this field. Further research can provide more accurate and detailed practical guidance for the green development quality of construction industry.
The original contributions presented in the study are included in the article/supplementary material, further inquiries can be directed to the corresponding author.
The following work was done independently by JW, including conceptualization, methodology, software, validation, formal analysis, investigation, resources, data curation, writing—original draft preparation, writing—review and editing, visualization, supervision, project administration, funding acquisition. The author have read and agreed to the published version of the manuscript.
This study was supported by the Natural Science Foundation of Shandong Province (ZR2020QG042), the Education Science Planning Project of Shandong Province (2021ZC049).
The author declares that the research was conducted in the absence of any commercial or financial relationships that could be construed as a potential conflict of interest.
All claims expressed in this article are solely those of the authors and do not necessarily represent those of their affiliated organizations, or those of the publisher, the editors and the reviewers. Any product that may be evaluated in this article, or claim that may be made by its manufacturer, is not guaranteed or endorsed by the publisher.
Aldieri, L., Makkonen, T., and Vinci, C. P. (2022). Do research and development and environmental knowledge spillovers facilitate meeting sustainable development goals for resource efficiency? Resour. Policy 76, 102603. doi:10.1016/j.resourpol.2022.102603
Altaf, M., Alalaoul, W. S., Musarat, M. A., Hussain, A., Saad, S., Rabbani, M. B. A., et al. (2022). Evaluating the awareness and implementation level of LCCA in the construction industry of Malaysia. Ain Shams Eng. J. 13, 101686. doi:10.1016/j.asej.2021.101686
Arthur, W. B. (2021). Foundations of complexity economics. Nat. Rev. Phys. 3, 136–145. doi:10.1038/s42254-020-00273-3
Babatunde, S. O., Awodele, O. A., and Adeniyi, O. (2018). Opportunities and challenges of foreign direct investment utilisation and its impact on construction sector in developing countries. JFMPC 23, 239–256. doi:10.1108/JFMPC-07-2017-0025
Braun, S. T., and Weber, H. (2021). How do regional labor markets adjust to immigration? A dynamic analysis for post-war Germany. J. Int. Econ. 129, 103416. doi:10.1016/j.jinteco.2020.103416
Bu, M., Qiao, Z., and Liu, B. (2020). Voluntary environmental regulation and firm innovation in China. Econ. Model. 89, 10–18. doi:10.1016/j.econmod.2019.12.020
Chancellor, W., and Lu, W. (2016). A regional and provincial productivity analysis of the Chinese construction industry: 1995 to 2012. J. Constr. Eng. Manage. 142, 05016013. doi:10.1061/(ASCE)CO.1943-7862.0001177
Chen, Y., and Lin, B. (2021). Understanding the green total factor energy efficiency gap between regional manufacturing—Insight from infrastructure development. Energy 237, 121553. doi:10.1016/j.energy.2021.121553
Chen, Y., Liu, B., Shen, Y., and Wang, X. (2018). Spatial analysis of change trend and influencing factors of total factor productivity in China’s regional construction industry. Appl. Econ. 50, 2824–2843. doi:10.1080/00036846.2017.1409421
Chivu, L., Andrei, J. V., Zaharia, M., and Gogonea, R. M. (2020). A regional agricultural efficiency convergence assessment in Romania – appraising differences and understanding potentials. Land Use Policy 99, 104838. doi:10.1016/j.landusepol.2020.104838
Cui, Y., Khan, S. U., Deng, Y., and Zhao, M. (2022). Spatiotemporal heterogeneity, convergence and its impact factors: Perspective of carbon emission intensity and carbon emission per capita considering carbon sink effect. Environ. Impact Assess. Rev. 92, 106699. doi:10.1016/j.eiar.2021.106699
Du, Z., Liu, Y., and Zhang, Z. (2022). Spatiotemporal analysis of influencing factors of carbon emission in public buildings in China. Buildings 12, 424. doi:10.3390/buildings12040424
Enshassi, A., Mohamed, S., Mustafa, Z. A., and Mayer, P. E. (2007). Factors affecting labour productivity in building projects in the Gaza strip. J. Civ. Eng. Manag. 11, 245–254. doi:10.3846/13923730.2007.9636444
Eva, M., Cehan, A., Corodescu-Roșca, E., and Bourdin, S. (2022). Spatial patterns of regional inequalities: Empirical evidence from a large panel of countries. Appl. Geogr. 140, 102638. doi:10.1016/j.apgeog.2022.102638
Fitrianto, A., and Musakkal, N. F. K. (2016). Panel data analysis for sabah construction industries: Choosing the best model. Procedia Econ. Finance 35, 241–248. doi:10.1016/S2212-5671(16)00030-7
Ghaleb, H., Alhajlah, H. H., Bin Abdullah, A. A., Kassem, M. A., and Al-Sharafi, M. A. (2022). A scientometric analysis and systematic literature review for construction project complexity. Buildings 12, 482. doi:10.3390/buildings12040482
Hao, Y., and Peng, H. (2017). On the convergence in China’s provincial per capita energy consumption: New evidence from a spatial econometric analysis. Energy Econ. 68, 31–43. doi:10.1016/j.eneco.2017.09.008
Hong, J., Shen, G. Q., Guo, S., Xue, F., and Zheng, W. (2016). Energy use embodied in China׳s construction industry: A multi-regional input–output analysis. Renew. Sustain. Energy Rev. 53, 1303–1312. doi:10.1016/j.rser.2015.09.068
Imran, D., Iqbal, N., and Kim, D. H. (2022). IoT task management mechanism based on predictive optimization for efficient energy consumption in smart residential buildings. Energy Build. 257, 111762. doi:10.1016/j.enbuild.2021.111762
Juan, Y. K., and Lee, P. H. (2022). Applying data mining techniques to explore technology adoptions, grades and costs of green building projects. J. Build. Eng. 45, 103669. doi:10.1016/j.jobe.2021.103669
Kapoor, M., Kelejian, H. H., and Prucha, I. R. (2007). Panel data models with spatially correlated error components. J. Econ. 140, 97–130. doi:10.1016/j.jeconom.2006.09.004
Li, D., Yang, Y., Du, G., and Huang, S. (2021). Understanding the contradiction between rural poverty and rich cultivated land resources: A case study of Heilongjiang province in northeast China. Land Use Policy 108, 105673. doi:10.1016/j.landusepol.2021.105673
Li, X., Huang, Y., Li, J., Liu, X., He, J., and Dai, J. (2022). The mechanism of influencing green technology innovation behavior: Evidence from Chinese construction enterprises. Buildings 12, 237. doi:10.3390/buildings12020237
Li, Y., and Liu, C. (2010). Malmquist indices of total factor productivity changes in the Australian construction industry. Constr. Manag. Econ. 28, 933–945. doi:10.1080/01446191003762231
Liu, B., Chen, Y., Wang, R., Shen, Y., and Shen, Q. (2016). Different interaction mechanisms of market structure in the construction industry TFP from the spatial perspective: A case study in China. KSCE J. Civ. Eng. 20, 23–33. doi:10.1007/s12205-015-0444-7
Liu, B., Wang, D., Xu, Y., Liu, C., and Luther, M. (2018). Embodied energy consumption of the construction industry and its international trade using multi-regional input–output analysis. Energy Build. 173, 489–501. doi:10.1016/j.enbuild.2018.05.040
Liu, B., Wang, J., Li, R. Y. M., Peng, L., and Mi, L. (2022a). Achieving carbon neutrality – the role of heterogeneous environmental regulations on urban green innovation. Front. Ecol. Evol. 10, 923354. doi:10.3389/fevo.2022.923354
Liu, H., and Lin, B. (2016). Ecological indicators for green building construction. Ecol. Indic. 67, 68–77. doi:10.1016/j.ecolind.2016.02.024
Liu, L. Q., Liu, K. L., Zhang, T., Mao, K., Lin, C. Q., Gao, Y. F., et al. (2021). Spatial characteristics and factors that influence the environmental efficiency of public buildings in China. J. Clean. Prod. 322, 128842. doi:10.1016/j.jclepro.2021.128842
Liu, T., Xu, X., and Lee, L. (2022b). Consistency without compactness of the parameter space in spatial econometrics. Econ. Lett. 210, 110224. doi:10.1016/j.econlet.2021.110224
Liu, W., He, Z., Chen, H., and Lin, C. (2022c). Comparative analysis Chinese green buildings’ of input–output effect based on data envelope analysis. Buildings 12, 659. doi:10.3390/buildings12050659
Luo, M., Fan, H., and Liu, G. (2021). A target-oriented DEA model for regional construction productive efficiency improvement in China. Adv. Eng. Inf. 47, 101208. doi:10.1016/j.aei.2020.101208
Lv, C., Bian, B., Lee, C. C., and He, Z. (2021). Regional gap and the trend of green finance development in China. Energy Econ. 102, 105476. doi:10.1016/j.eneco.2021.105476
Miao, Z., Chen, X., and Baležentis, T. (2021). Improving energy use and mitigating pollutant emissions across “three regions and ten urban agglomerations”: A city-level productivity growth decomposition. Appl. Energy 283, 116296. doi:10.1016/j.apenergy.2020.116296
Mutl, J., and Pfaffermayr, M. (2011). The Hausman test in a Cliff and Ord panel model. Econ. J. 14, 48–76. doi:10.1111/j.1368-423X.2010.00325.x
Nazarko, J., and Chodakowska, E. (2015). Measuring productivity of construction industry in europe with data envelopment analysis. Procedia Eng. 122, 204–212. doi:10.1016/j.proeng.2015.10.026
Peng, J., Xie, R., Ma, C., and Fu, Y. (2021). Market-based environmental regulation and total factor productivity: Evidence from Chinese enterprises. Econ. Model. 95, 394–407. doi:10.1016/j.econmod.2020.03.006
Peng, X. (2020). Strategic interaction of environmental regulation and green productivity growth in China: Green innovation or pollution refuge? Sci. Total Environ. 732, 139200. doi:10.1016/j.scitotenv.2020.139200
Próchniak, M., and Witkowski, B. (2013). Time stability of the beta convergence among EU countries: Bayesian model averaging perspective. Econ. Model. 30, 322–333. doi:10.1016/j.econmod.2012.08.031
Qiao, W., Dong, P., and Ju, Y. (2022). Synergistic development of green building market under government guidance: A case study of tianjin, China. J. Clean. Prod. 340, 130540. doi:10.1016/j.jclepro.2022.130540
Quah, D. (1996). Twin peaks: Growth and convergence in models of distribution dynamics. Econ. J. 106, 1045–1055. doi:10.2307/2235377
Rouzmehr, F., Choi, P., Nam, J. H., and Won, M. (2021). Improvements of quality assurance testing program for subgrade and base layer construction. Constr. Build. Mater. 310, 125157. doi:10.1016/j.conbuildmat.2021.125157
Sandberg, N. H., Næss, J. S., Brattebø, H., Andresen, I., and Gustavsen, A. (2021). Large potentials for energy saving and greenhouse gas emission reductions from large-scale deployment of zero emission building technologies in a national building stock. Energy Policy 152, 112114. doi:10.1016/j.enpol.2020.112114
Schneider, C. O., Bremen, P., Schönsleben, P., and Alard, R. (2013). Transaction cost economics in global sourcing: Assessing regional differences and implications for performance. Int. J. Prod. Econ. 141, 243–254. doi:10.1016/j.ijpe.2011.02.025
Solla, M., Elmesh, A., Memon, Z. A., Ismail, L. H., Kazee, M. F. A., Latif, Q. B. I., et al. (2022). Analysis of BIM-based digitising of green building index (GBI): Assessment method. Buildings 12, 429. doi:10.3390/buildings12040429
Solow, R. M. (1956). A contribution to the theory of economic growth. Q. J. Econ. 70, 65–94. doi:10.2307/1884513
Song, Y., Li, C., Zhou, L., Huang, X., Chen, Y., and Zhang, H. (2021). Factors affecting green building development at the municipal level: A cross-sectional study in China. Energy Build. 231, 110560. doi:10.1016/j.enbuild.2020.110560
Sukhadolets, T., Stupnikova, E., Fomenko, N., Kapustina, N., and Kuznetsov, Y. (2021). Foreign direct investment (FDI), investment in construction and poverty in economic crises (Denmark, Italy, Germany, Romania, China, India and Russia). Economies 9, 152. doi:10.3390/economies9040152
Tang, M., Li, X., Zhang, Y., Wu, Y., and Wu, B. (2020). From command-and-control to market-based environmental policies: Optimal transition timing and China’s heterogeneous environmental effectiveness. Econ. Model. 90, 1–10. doi:10.1016/j.econmod.2020.04.021
Wang, B., Yu, M., Zhu, Y., and Bao, P. (2021a). Unveiling the driving factors of carbon emissions from industrial resource allocation in China: A spatial econometric perspective. Energy Policy 158, 112557. doi:10.1016/j.enpol.2021.112557
Wang, H., Xia, S., Zhang, Q., and Zhang, P. (2022a). Has China’s construction waste change been decoupled from economic growth? Buildings 12, 147. doi:10.3390/buildings12020147
Wang, K., Li, G., and Liu, H. (2021b). Porter effect test for construction land reduction. Land Use Policy 103, 105310. doi:10.1016/j.landusepol.2021.105310
Wang, L., Song, X., and Song, X. (2021c). Research on the measurement and spatial-temporal difference analysis of energy efficiency in China’s construction industry based on a game cross-efficiency model. J. Clean. Prod. 278, 123918. doi:10.1016/j.jclepro.2020.123918
Wang, T., Wang, X., Wang, L., Au-Yong, C. P., and Ali, A. S. (2021d). Assessment of the development level of regional industrialized building based on cloud model: A case study in guangzhou, China. J. Build. Eng. 44, 102547. doi:10.1016/j.jobe.2021.102547
Wang, W., Tian, Z., Xi, W., Tan, Y. R., and Deng, Y. (2021e). The influencing factors of China’s green building development: An analysis using RBF-WINGS method. Build. Environ. 188, 107425. doi:10.1016/j.buildenv.2020.107425
Wang, X., Wang, X., Ren, X., and Wen, F. (2022b). Can digital financial inclusion affect CO2 emissions of China at the prefecture level? Evidence from a spatial econometric approach. Energy Econ. 109, 105966. doi:10.1016/j.eneco.2022.105966
Wang, Y., Ye, G., Zhang, Y., Mu, P., and Wang, H. (2020). Is the Chinese construction industry moving towards a knowledge- and technology-intensive industry? J. Clean. Prod. 259, 120964. doi:10.1016/j.jclepro.2020.120964
Wang, Z., Liu, Q., and Zhang, B. (2022c). What kinds of building energy-saving retrofit projects should be preferred? Efficiency evaluation with three-stage data envelopment analysis (DEA). Renew. Sustain. Energy Rev. 161, 112392. doi:10.1016/j.rser.2022.112392
Wing, C. K., and Walker, A. (1988). The measurement of total factor productivity of the Hong Kong construction industry. Constr. Manag. Econ. 6, 209–224. doi:10.1080/01446198800000019
Xu, G., and Wang, W. (2020). China’s energy consumption in construction and building sectors: An outlook to 2100. Energy 195, 117045. doi:10.1016/j.energy.2020.117045
Xu, Y., and Li, A. (2020). The relationship between innovative human capital and interprovincial economic growth based on panel data model and spatial econometrics. J. Comput. Appl. Math. 365, 112381. doi:10.1016/j.cam.2019.112381
Yang, J., Li, L., Liang, Y., Wu, J., Wang, Z., Zhong, Q., et al. (2022). Sustainability performance of global chemical industry based on green total factor productivity. Sci. Total Environ. 830, 154787. doi:10.1016/j.scitotenv.2022.154787
Yu, Y., Junjan, V., Yazan, D. M., and Iacob, M. E. (2022). A systematic literature review on circular economy implementation in the construction industry: A policy-making perspective. Resour. Conservation Recycl. 183, 106359. doi:10.1016/j.resconrec.2022.106359
Yuan, F., Tang, M., and Hong, J. (2020). Efficiency estimation and reduction potential of the Chinese construction industry via SE-DEA and artificial neural network. ECAM 27, 1533–1552. doi:10.1108/ECAM-10-2019-0564
Zhang, J., Li, H., Xia, B., and Skitmore, M. (2018). Impact of environment regulation on the efficiency of regional construction industry: A 3-stage data envelopment analysis (DEA). J. Clean. Prod. 200, 770–780. doi:10.1016/j.jclepro.2018.07.189
Zhang, S., Wang, Y., Hao, Y., and Liu, Z. (2021a). Shooting two hawks with one arrow: Could China’s emission trading scheme promote green development efficiency and regional carbon equality? Energy Econ. 101, 105412. doi:10.1016/j.eneco.2021.105412
Zhang, T., Ma, Y., and Li, A. (2021b). Scenario analysis and assessment of China’s nuclear power policy based on the paris agreement: A dynamic cge model. Energy 228, 120541. doi:10.1016/j.energy.2021.120541
Zhang, T., Qu, Y., and He, G. (2022). Pricing strategy for green products based on disparities in energy consumption. IEEE Trans. Eng. Manag. 69, 616–627. doi:10.1109/TEM.2019.2907872
Zhang, Y., Wang, H., Gao, W., Wang, F., Zhou, N., Kammen, D. M., et al. (2019). A survey of the status and challenges of green building development in various countries. Sustainability 11, 5385. doi:10.3390/su11195385
Zhao, P., Zeng, L., Lu, H., Zhou, Y., Hu, H., and Wei, X. Y. (2020). Green economic efficiency and its influencing factors in China from 2008 to 2017: Based on the super-SBM model with undesirable outputs and spatial Dubin model. Sci. Total Environ. 741, 140026. doi:10.1016/j.scitotenv.2020.140026
Zhu, C., Chang, Y., Li, X., and Shan, M. (2022). Factors influencing embodied carbon emissions of China’s building sector: An analysis based on extended STIRPAT modeling. Energy Build. 255, 111607. doi:10.1016/j.enbuild.2021.111607
Zhu, L., and Zhang, H. (2021). Analysis of the diffusion effect of urban housing prices in China based on the spatial-temporal model. Cities 109, 103015. doi:10.1016/j.cities.2020.103015
Keywords: construction industry, green development quality, Dagum Gini coefficient, convergence analysis, kernel density estimation
Citation: Wang J (2023) Study on regional differences and convergence of the green development quality of the construction industry: evidence from China. Front. Environ. Sci. 11:972980. doi: 10.3389/fenvs.2023.972980
Received: 19 June 2022; Accepted: 11 April 2023;
Published: 24 April 2023.
Edited by:
Kai Huang, Beijing Forestry University, ChinaReviewed by:
Rita Yi Man Li, Hong Kong Shue Yan University, ChinaCopyright © 2023 Wang. This is an open-access article distributed under the terms of the Creative Commons Attribution License (CC BY). The use, distribution or reproduction in other forums is permitted, provided the original author(s) and the copyright owner(s) are credited and that the original publication in this journal is cited, in accordance with accepted academic practice. No use, distribution or reproduction is permitted which does not comply with these terms.
*Correspondence: Jiaming Wang, dXBjamd5eHdqbUAxNjMuY29t
Disclaimer: All claims expressed in this article are solely those of the authors and do not necessarily represent those of their affiliated organizations, or those of the publisher, the editors and the reviewers. Any product that may be evaluated in this article or claim that may be made by its manufacturer is not guaranteed or endorsed by the publisher.
Research integrity at Frontiers
Learn more about the work of our research integrity team to safeguard the quality of each article we publish.