
94% of researchers rate our articles as excellent or good
Learn more about the work of our research integrity team to safeguard the quality of each article we publish.
Find out more
ORIGINAL RESEARCH article
Front. Environ. Sci., 20 March 2023
Sec. Water and Wastewater Management
Volume 11 - 2023 | https://doi.org/10.3389/fenvs.2023.945884
This article is part of the Research TopicSustainable Treatment Methods for Wastewater and BiosolidsView all 10 articles
 Yuanzhu Wang1,2
 Chenglin Wang2Chunmei Zhang1Jiangkui Liang3Wujuan Mi1Gaofei Song1Yuxuan Zhu1Shulei Wang3Yuming Shang3
 Yonghong Bi1*
The South-to-North Water Division Middle Route Project (MRP) is currently the longest inter-basin water diversion project in the world. It benefits a large population and its water quality has attracted much attention. In this study, seasonal investigations on 11 sampling sites along the MRP were conducted from 2018 to 2019; water temperature, pH, turbidity, transparency, CODMn, dissolved oxygen, total phosphorus, phosphate, total nitrogen, ammonia, nitrate, and chlorophyll a were determined synchronously. Single leakage distance clustering analysis identified the spatio-seasonal heterogeneity of physiochemical parameters. The trophic level index (TLI) and the water quality status were assessed: TLI increased and WQI decreased from south to north; TLI and WQI had seasonal differences (p < 0.001), the best water quality was observed in autumn, and the lowest TLI was observed in winter. The trophic level was “oligotrophic to mesotrophic”; water quality status was “good.” The multiple linear stepwise regression analysis confirmed that total nitrogen (TN), Chl a, and CODMn were the driving factors in water quality. These factors were applied to build the simplified WQI model, which was confirmed as a reliable method of water quality assessment for the MRP and a fitting substitute for TLI and WQI. The results provided support for the water quality evaluation of the MRP.
Adequate amounts of sustainable freshwater resources are important to guarantee ecological integrity and the survival of human society (Wu et al., 2018). However, with rapid social and economic development and continuous accretion of the population (Barakat et al., 2016), the increasing consumption of water resources has led to freshwater reserve scarcity. China is facing serious uneven distribution and shortage of water resources, especially in the northern area (Xin et al., 2015). In addition to this, because of multifaceted effects, such as hydraulic alteration (Nazeer et al., 2018), land use change (Giri et al., 2016), and inputs of toxic chemicals and nutrients (Ding et al., 2019), water quality deterioration has also become severe, which has resulted in some water bodies being abandoned as they could not be used as drinking water resources anymore. Thus, water quality determines the ecological service function of water bodies. On this account, monitoring and assessing water quality is necessary to safeguard freshwater resources (Pesce et al., 2000), which could help us instantly understand the status of water quality.
There are multiple statistical approaches to assessing water quality. The simplest index is the single factor index, which is easily compared between different water bodies (Sánchez et al., 2007). Conventional water quality evaluation was based on the comparison of measured water quality parameters with existing standards for kinds of water bodies (Pesce et al., 2000; Chang et al., 2020). Such assessments might not provide a fully accurate water quality evaluation method (Tziritis et al., 2014). Hence, systematic methods, including multi-parameters, must be used to acquire a rational description of the water quality status. A water quality index (WQI) has been widely used as one of the most effective approaches, integrating multiple measured water quality parameters to yield a single dimensionless number formula to perform water quality assessment (Horton et al., 1965). The minimum WQI model (WQImin) applies several key parameters that can express water quality directly and easily to evaluate water quality (Akkoyunlu et al., 2012). Mostly, the parameters chosen for a WQImin calculation ought to represent other unselected environmental parameters and must be easy and quick to measure (Pesce et al., 2000). Furthermore, the trophic level could also indicate water quality conditions and provide information on the structure and function of an ecosystem (Wang et al., 2019). The Carlson method evolved into the trophic level index (TLI) method, which has been established based on Chl a and other parameters by desirable, correlation-generated consequences (Burns et al., 2005; Wang et al., 2019). The trophic index has been broadly applied to the eutrophication assessment of surface water, such as the Suez Canal (El-Serehy et al., 2018) and Lake Taihu (Wang et al., 2019). Though there were many assessment methods for water quality, the integrated methods of trophic level and water quality are still needed.
China has built the longest inter-basin water diversion project in the world, the South-to-North Water Division Middle Route Project (MRP) (Wang, et al., 2021), which is a man-made concrete channel with a total length of 1,432 km (including 155 km of Tianjin division) (Huang et al., 2021) that aims to solve the serious water shortage in the northern districts of China. As the MRP has been running, it has alleviated the supply and demand issues of water resources in districts along the MRP, alleviated the groundwater over-exploitation in the water-receiving area, and played a vital role in society by creating economical and ecological benefits. At present, some studies have revealed the spatial and temporal dynamics of the bacterioplankton community structure in the MRP (Luo et al., 2019), eutrophication of water supplied to lakes, heavy-metal pollution (Guo et al., 2020a), fish community structure (Guo et al., 2020b), and physical and chemical statuses of some sections of the MRP (Nong et al., 2019; Nong et al., 2020). However, a comprehensive water quality assessment in the MRP is still lacking. It is necessary to carry out constant water quality monitoring and assessment in the MRP.
The main aims of this study were 1) to illustrate the spatio-temporal variations of parameters in the MRP, 2) to assess the trophic level, and water quality status of the MRP based on TLI and WQI methods, and 3) to address the key factors to establish a fast and cost-effective water quality model. This study was conducted to establish a simple WQImin model for the assessment of water quality after the utilization of the MRP; the WQImin model proved to be the most valuable and reliable evaluation method for long-distance water diversion projects worldwide.
The middle route of the South-to-North Water Diversion Project is located between 32.68°N–39.99°N and 111.72°E–116.27°E, which spans eight latitudes and three temperature zones (subtropical zone, warm temperate zone, and temperate zone) from south to north (Luo et al., 2018), with a length of 1,432 km; it needs 2 weeks to divert water from the original reservoir to terminal water bodies. The MRP originates from Danjiangkou Reservoir, which crosses two provinces—Henan (HN) and Hebei (HB), and arrives at Beijing (BJ), the capital of China, and Tianjin (TJ). Water flows aided by gravity along the channel from Danjiangkou Reservoir (whose storage has been expanded) through the intake gate of the Taocha headwater. Along the middle route, canals pass the west Tangbai River region, the watershed between the Yangtze River basin and the Huaihe River–Fangcheng Pass, run across the Yellow River Basin, and finally arrive in BJ. This inter-basin project solves the problem of water shortage and provides clean water for production, living, industry, and agriculture for at least 20 large- and medium-sized cities along the route (Wang, et al., 2021). The MRP canal was closed and separated from the land, so the local catchment cannot influence the water quality, but the rainwater and dry/wet settlement from the air to the channel could affect the water quality. By December 2020, the MRP supplied a total of 34.8 billion cubic meters of water transported northward, benefiting 69 million people (Office of the South-to-North Water Diversion Project Construction Committee, State Council, PRC).
There were 11 monitoring sites chosen to represent the MRP, covering four main provinces including the headstream and terminal places (as shown in Figure 1). The 11 sampling sites were set almost at equal distances; the regional aspect was also considered in the sample site design. S1 (Taocha) was located in the Henan Province, which is the source of headwater. S2 (Shahe), S3 (Lushan), S4 (Chuanhuang South), and S5 (Chuanhuang North) were all located in the HN Province. S6 (Zhanghe North), S7 (Guyunhe), and S8 (Xiheishan) were located in the HB Province. Xiheishan was an intersection site where the main channel divides into two branches: one flows to S9 (Waihuanhe) in TJ and the other flows to S10 (Huinanzhuang station) and S11 (Tuanchenghu) in BJ; the detailed sampling information is given in Supplementary Table S1.
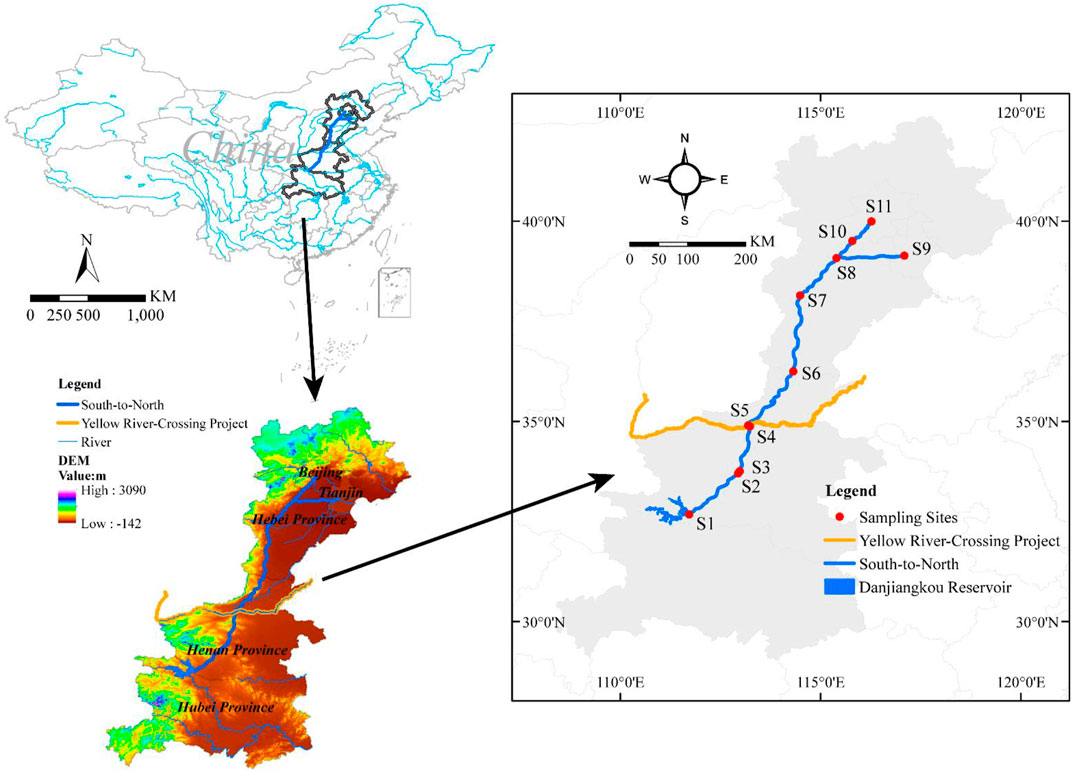
FIGURE 1. Locations of eleven sampling sites for the middle route of the South-to-North Water Diversion Project, China.
The investigation was conducted every quarter. Parameters including WT, DO, and pH were obtained using a water quality analyzer (YSI, proplus, United States). Velocity and discharge were recorded using a flowmeter (Flowatch, Switzerland). The turbidity was determined using a turbidimeter (WGZ-200S, China). A Secchi disc tool measured SD. The water samples (from a surface depth of 0 cm–50 cm) were collected in 550 mL acid-cleaned plastic bottles and rinsed with surface water before sampling (three replications in each monitoring site). The samples needed to be stored in an icebox and were transferred to the lab to be determined as soon as possible. Samples used for the measurement of PO4-P, NO3-N, and NH4-N were filtered using a GF/C membrane (Whatman GF/C), and then the membrane filters were soaked in 10 mL, 90% acetone solution to extract Chl a. Furthermore, TN and TP were digested at 120°C for 30 min and tested using a UV-spectrophotometer (UV-1780), and chemical oxygen demand (CODMn) was determined; the aforementioned parameters were determined following the standard methods for the examination of water and wastewater (APHA., 2017).
To understand the trophic condition of MRP, TLI values were used, which were given a weighting sum based on the correlation between TP, TN, CODMn, SD, and Chl a (China Environmental Monitoring Station., 2001). These parameters were applied for calculating the TLI, and the qualification formulas of five parameters were established, which was the calculation result of the investigation of 26 major lakes (reservoirs) in China (Jin et al., 1995).
The TLI has a scale from 0 to 100, with a high value indicating a high trophic level, and was used to assess the eutrophication level of monitoring sites of the MRP. The trophic level is classified into five classes according to the score of TLI (∑): the oligotrophic level (TLI (∑) < 30), mesotrophic level (30 ≤ TLI (∑) ≤ 50), light eutrophic level (50 < TLI (∑) ≤ 60), middle eutrophic level (60 < TLI (∑) ≤ 70), and hyper eutrophic level (TLI (∑) > 70) (Wang et al., 2019).
The water quality index (WQI) is a widely used method to evaluate water quality and reflect the comprehensive impact of different environmental parameters, as well as obtain an objective assessment of the comprehensive water quality without neglecting the overall water quality status because of the deviation of individual factors that were put forward by Pesce et al. (2000). The WQI has been widely used as one of the most effective approaches to performing water quality assessments, integrating multiple measured water quality parameters. In this study, 15 physicochemical parameters collected from eleven sampling sites were selected as evaluation objects to form a 15 × 11 matrix. The principal component formula was deduced by calculating the eigenvalues and the coefficient matrix to quantify the factors. Then, stepwise multiple linear regression analyses were carried out to figure out the key factors affecting WQI and then develop the WQImin model, which helps to select the influencing key factors.
According to the results of factor analysis and correlation analysis, 11 environmental parameters were selected and weighted. Every single parameter was assigned a weight based on its potential effect on the water quality (Wu et al., 2018). T, DO, pH, CODMn, Tur, Chl a, TP, PO4-P, TN, NH4-N, and NO3-N were used to compute the WQI. The formula used was as follows:
where n is the amount of the selected parameters, Ci is the normalized value of parameter I, Pi is the weight of parameter I, the minimum value of Pi was one, and the maximum weight allocated to parameters that influenced the water quality most was four (Supplementary Table S2). These values have been demonstrated in published studies (Koçer et al., 2014; Sun et al., 2016; Tian et al., 2019). The WQI has a scale from 0 to 100, with high values predicting good water quality conditions of each monitoring site of the MRP. Based on the grade of the WQI, the water quality was categorized into five grades: excellent (100–90), good (90–70), medium (70–50), bad (50–25), and very bad (25–0) (Tian et al., 2019).
In order to assess the water quality of the MRP in an easy and effective way, a WQImin model built during a previous research study was used (Pesce et al., 2000). This model usually uses 3–5 important parameters to evaluate the water quality, per the following formula:
Here, n is the total number of parameters included in the study; Ci is the normalized value of parameter i (Supplementary Table S2). The selected parameters were introduced into WQImin on the basis of the results of linear regression analysis. All samples collected from the four seasons were applied for calculating the selected environmental parameters and the relation between WQI with TLI and WQImin.
Although the water velocity could influence the water quality significantly, spatio-temporal differences in the water velocity of the MRP were not significant, so the water velocity was not used to compute the WQI.
All data analyses were conducted with SPSS 22.0 (IBM SPSS statistical), PAST 3.0 (Paleontological Statistics), and R (Corrplot). Considering the heterogeneous distribution of sampling sites, inverse distance weighting (IDW) interpolation was applied to reveal the spatial variation of physicochemical parameters. ArcGIS 10.2 (Esri Inc., US) was used for the spatial data treatment. The Kruskal–Wallis method was used to evaluate significant differences between the mean of parameters at the spatial and temporal scales. The variations of environmental parameters in the seasonal changes were found using the Kendall test. For grouping the sampling sites, cluster analysis was carried out using single-linkage distance and square-root data transformation. A Spearman correlation analysis was conducted to study the relationship and dependence between environmental factors. Principal component analysis (PCA) is a quantitative analysis of multi-dimensional factors in the system, which can compress multiple variables into individual comprehensive variables that reflect the problem (Tripathi et al., 2019). Stepwise multiple linear regression analyses were carried out to find the key factors affecting TLI and WQI and to develop the WQImin model, which helps to select the influencing key factors. Based on the Pearson correlation analysis between WQI, TLI, and WQImin, the slope has explanatory significance.
The average water temperature (WT) was 18.79°C ± 8.78°C, the maximum value was 30.36°C in summer, and the lowest was 6.79°C in winter (Figure 2A). The Kruskal–Wallis test showed significant differences between seasons in WT (p < 0.001). The pH ranged from 7.34 to 9.16, and the mean value was 8.56 ± 0.30 (Figure 2B). The average turbidity was 4.32 ± 5.17 NTU, and the maximum was 7.58 NTU in spring (Figure 2C). In addition, SD ranged from 0.40 m to 6.00 m, and the mean value was 3.19 ± 1.68 m (Figure 2D). The Pearson analysis found that the turbidity and SD had a negative relationship (R2 = −0.79) (Supplementary Figure S1).
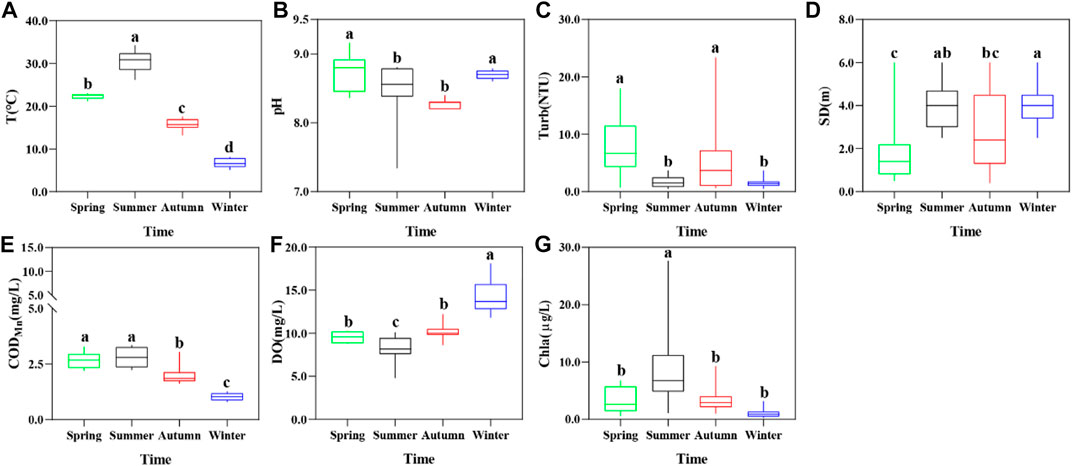
FIGURE 2. Box plots of seasonal variations of environmental parameters in the middle route of South-to-North Water Diversion Project. (A) Box plot of T; (B) box plot of pH; (C) box plot of Turb; (D) box plot of SD; (E) box plot of CODMn; (F) box plot of DO; (G) box plot of Chl a.
CODMn was in the range of 0.80 mg·L−1–3.34 mg·L−1, the mean value was 2.15 ± 0.80 mg·L−1, and the lowest value was 1.02 mg·L−1 in winter (Figure 2E). The Kruskal–Wallis test showed that CODMn in summer had differences in autumn and winter (p < 0.01). There were significant differences between values in spring and winter (p < 0.01). Pearson correlation analysis illustrated that there was a positive correlation between CODMn and Chl a (R2 = 0.57) (Supplementary Figure S1). DO ranged from 4.76 mg·L−1 to 18.10 mg·L−1 (Figure 2F). Pearson correlation analysis showed a negative correlation between DO and CODMn (R2 = −0.69) and WT (R2 = −0.83) (Supplementary Figure S1). The content of Chl a was in the range of 0.260 μg·L−1–27.681 μg·L−1, with an average of 4.079 ± 4.760 μg·L−1 (Figure 2G); it first increased and then decreased from south to north. The order of Chl a concentration by season was summer > spring > autumn > winter (p < 0.05). The maximum value of Chl a was 27.681 μg·L−1 at Chuanhuang North in summer. It could be seen that Chl a had notable spatial differences in spring, summer, and autumn (p < 0.05).
TP varied from 0.001 mg·L−1 to 0.077 mg·L−1, with a quarterly value of 0.025 ± 0.024 mg·L−1 (Figure 3A). TP increased significantly from south to north in spring, with an average of 0.063 ± 0.006 mg·L−1, while it was stable in the other three seasons, with an average value of 0.012 ± 0.010 mg·L−1. The Kruskal–Wallis test showed significant differences between spring and the other three seasons (p < 0.01). The concentration of PO4-P was 0.001 mg·L−1–0.143 mg·L−1, with a quarterly mean value of 0.024 ± 0.028 mg·L−1 (Figure 3B), and the maximum was 0.055 ± 0.007 mg·L−1 at Lushan in spring.
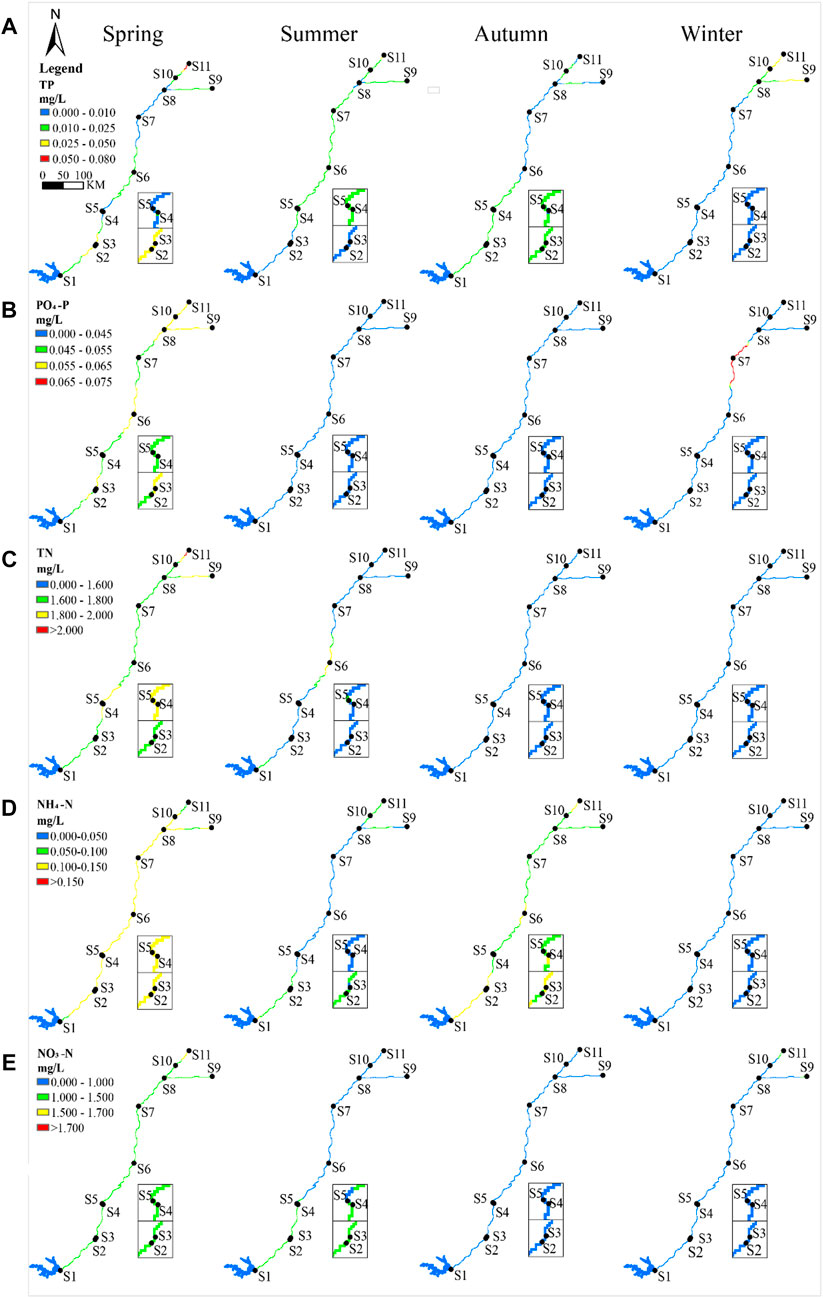
FIGURE 3. Spatio-temporal distribution of phosphorus and nitrogen in the middle route of South-to-North Water Diversion Project. (A) Spatio-temporal distribution of TP; (B) spatio-temporal distribution of PO4-P; (C) spatio-temporal distribution of TN; (D) spatio-temporal distribution of NH4-N; (E) spatio-temporal distribution of NO3-N.
The maximum value of TN was 2.216 mg·L−1, measured at Tuanchenghu during spring. The average TN was 1.786 ± 0.124 mg·L−1 in spring, which was higher than that in summer (1.493 ± 0.190 mg·L−1) (Figure 3C). Meanwhile, TN in the channel showed an increasing variation in spring from south to north (Supplementary Table S3). The range of NH4-N was 0.001 mg·L−1–0.143 mg·L−1, and the average was 0.068 ± 0.042 mg·L−1. Ammonia (NH4-N) accounted for 5% of TN (Figure 3D), and there was a notable difference between spring and summer (p < 0.01) as well as in the relationship between autumn and winter (p < 0.01). NO3-N occupied 70% of TN, and other forms of nitrogen had a percentage of 30%. NO3-N varied from 0.155 mg·L−1 to 1.696 mg·L−1, with a seasonal average of 0.871 ± 0.457 mg·L−1 (Figure 3E). There were differences between summer, autumn, and spring (p < 0.01). In terms of spatial variation, there was a notable increase in trend along the MRP in spring (Supplementary Table S3).
Single leakage distance clustering analysis showed all samples were clustered into four groups, which reflected a clear seasonal change in the water quality. All samples were bunched into two branches in each season, which indicated notable spatial differences (Figure 4). Thus, water quality has a distinct characteristic of spatio-temporal differences.
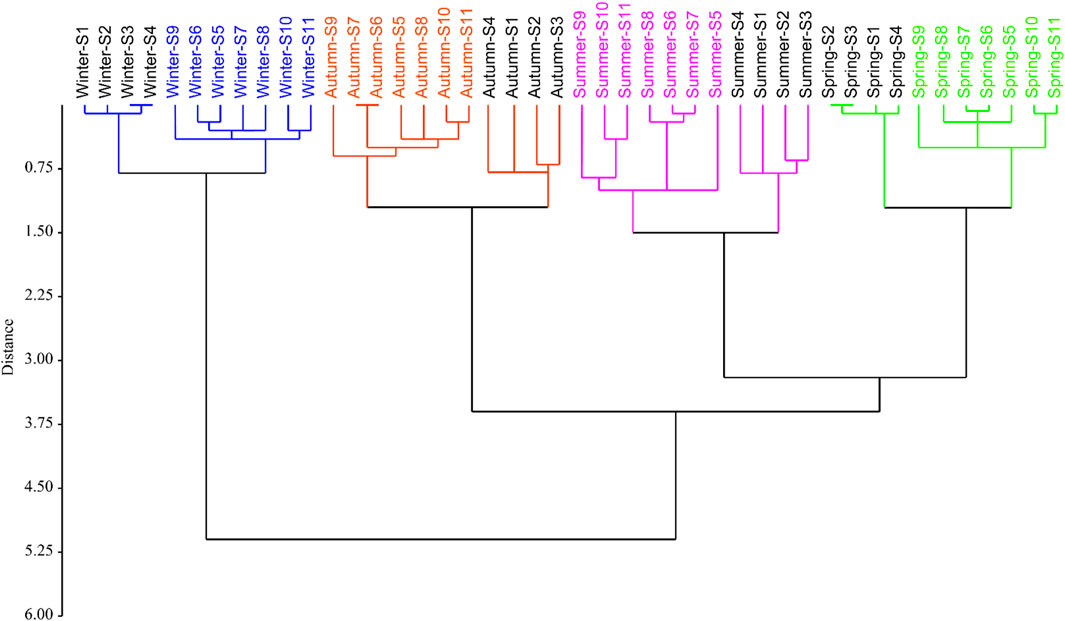
FIGURE 4. Dendrogram showing two clusters of sampling sites in four seasons using a single-linkage distance.
The average TLI was 35.00 ± 6.84, and the trophic level was “mesotrophic”. The mean value in spring was 42.82 ± 4.64, which was notably higher than that in summer (36.89 ± 4.13), autumn (32.58 ± 3.79), and winter (27.71 ± 3.23) (p < 0.01) (Figure 5A). The order of TLI by seasons was spring > summer > autumn > winter. Therefore, TLI first decreased and then slowly increased. The Kendall test results showed that TLI increased significantly in summer, autumn, and winter, except in spring (Supplementary Table S3). Among the samples, only Tuanchenghu in spring had light eutrophication, and 98% of the samples were at the level of “oligotrophic to mesotrophic.”
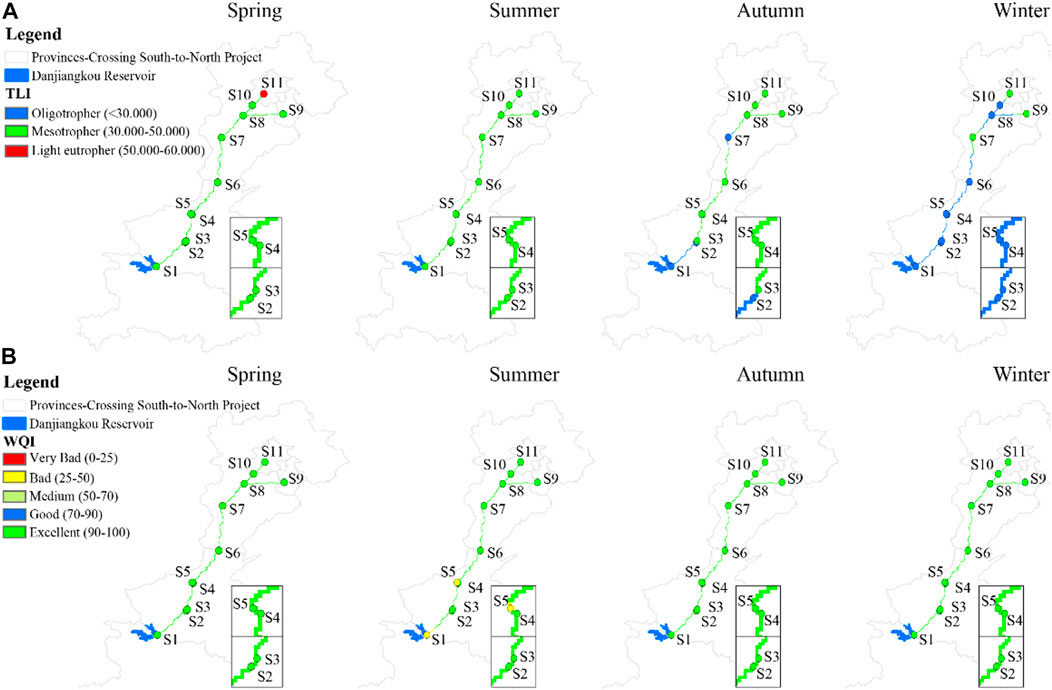
FIGURE 5. Spatio-temporal distribution of TLI and WQI in the middle route of South-to-North Water Diversion Project. (A) Spatio-temporal distribution of TLI; (B) spatio-temporal distribution of WQI.
There were 11 parameters selected to calculate the WQI. The results showed that the WQI ranged from 66.67 to 89.58, the quarterly average value was 79.53 ± 5.49, and the water quality grade was “good.” Among all samples, 93% showed good water quality, 7% of the samples showed medium water quality, and the minimum WQI appeared at Taocha in summer. The order of TLI by season was autumn (86.55 ± 1.87) > winter (83.22 ± 0.99) > summer (74.24 ± 3.62) > spring (74.09 ± 2.12) (Figure 5B). The water quality showed seasonal heterogeneity. In this study, Pearson correlation analysis results showed that TN (R2 = −0.92) and WT (R2 = −0.69) had a significant negative correlation with the WQI.
PCA showed that the two main axes of the principal components explained were 51.74% and 31.40%, respectively (Figure 6A). According to the matrix table, the first principal component (PC1) consisted of TN, WT, Chl a, DO, and CODMn. The second principal component (PC2) described TP, PO4-P, NO3-N, NH4-N, pH, Tur, and SD. It demonstrated that PC1 mostly explained the variation of the environmental parameters among seasons in the MRP.
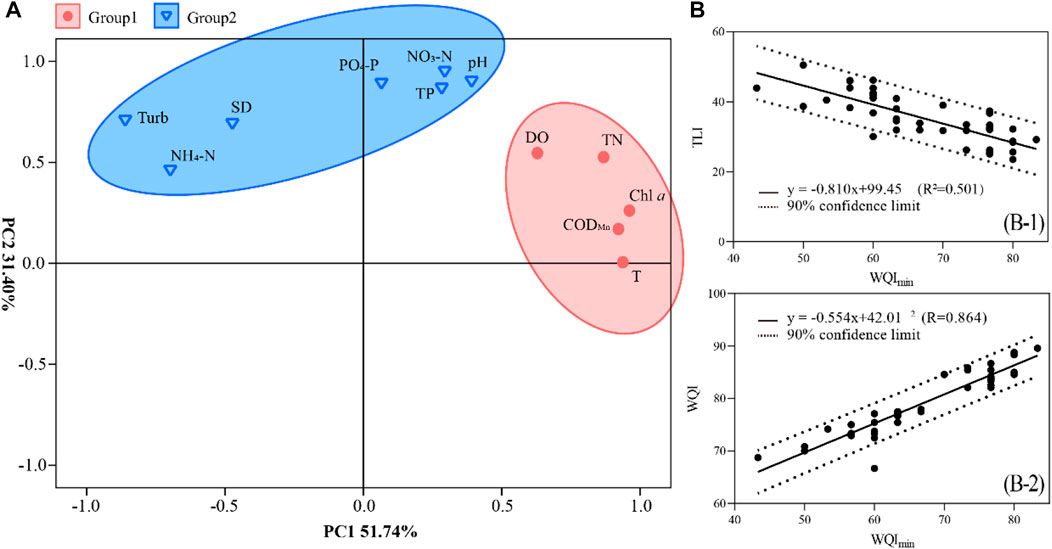
FIGURE 6. Principal component analysis and the relationship between WQI, TLI, and WQImin based on the environmental parameters. (A) Principal component analysis; (B) linear regression between TLI, WQI, and WQImin: (B-1) TLI with WQImin; (B-2) WQI with WQImin.
The multiple stepwise linear regression model was applied to screen the key factors affecting WQI (Table 1). The results showed that TN was the first chosen parameter in the model and contributed the most to WQI in the training (R2 = 0.841, p < 0.001). TN values showed an increasing trend. Then, Chl a was introduced into the model and increased R2. CODMn is an indicator of organic and inorganic oxidizable substances, having the third-highest explanatory power with regard to WQI in the MRP. Therefore, TN, Chl a, and CODMn were selected to calculate the WQImin model.
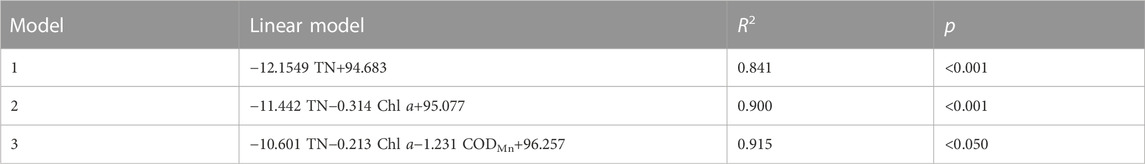
TABLE 1. Stepwise linear regression of WQI with parameters examined after normalizing.
According to regression analysis, Pearson correlation results indicated that WQImin had a negative relation with TLI (R2 = −0.501, p < 0.01) (Figure 6B-1), and the WQImin model also had a strong positive relationship with WQI (R2 = 0.864, p < 0.001) (Figure 6B-2)). It showed that the selected key environmental factors had an important impact on the WQImin model, and the results of the WQImin model were accurate.
Water quality describes the state of the aquatic environment and measures the availability and suitability of water (El-Serehy et al., 2018). The status and variations of water quality can be assessed, which is critical for identifying its spatial and temporal pattern (Wu et al., 2018). According to the TLI and WQI assessment, the trophic level index and the water quality status were classified as “mesotrophic” and “good” in the MRP, respectively. However, a study found that the water quality still had a risk of deterioration from upstream to downstream; TLI and WQI in spring were worse than those in other seasons, which indicated the spatio-temporal heterogeneity of the water quality in the MRP.
A previous study also found that spring had the lowest WQI in the MRP (Nong et al., 2019). This was consistent with our results, that the highest TLI and the lowest WQI were in spring (Figure 5), which indicated that the water quality confronted more risks in spring than in other seasons. The water quality was rated as “poor” in the dry season and as “good” in the wet season in the Aksu River (Şener et al., 2017); WQI was higher in summer than in other seasons in the Luanhe River (Tian et al., 2019); TLI in the wet season reached a lightly eutrophic level, which was higher than that in the dry season in Wuli Lake (Wang et al., 2019). The water quality in these waters exhibited a distinct seasonal variation compared to that of the MRP. A concerning result showed the trophic index and the water quality level reflecting temporal heterogeneity in the MRP, especially during spring.
In terms of spatial variation, it was verified that different regions could show distinct water quality characteristics. It was found that high pollution mainly happened at the beginning and the end of rivers, whereas less pollution occurred in the middle parts of rivers (Hajigholizadeh et al., 2017). In the upstream of the Luanhe River, the water quality was rated as “good,” which was better than that in the downstream, evaluated as “bad” (Tian et al., 2019). WQI classified the Dongjiang River as follows: upstream sites as “good” (WQI = 79.1–83.2) and downstream sites as “medium” (WQI = 63.6–64.1) (Sun et al., 2016). This spatial heterogeneity was also observed in our study. The MRP, with a length of 1,432 km, spans different latitudes and tends to form different regions with different aquatic conditions (McLean et al., 2016). TLI increased and WQI decreased from south to north; the end section (Tuanchenghu) had light eutrophication. The water quality might deteriorate from the initial headwater source (upstream) to terminal water bodies (downstream). In addition, the Chuanhuang project was divided into two parts according to the variation of environmental parameters. Previous research studies revealed that the Yellow River crossing projects as a culver tunnel with a length of 4,250 m; an internal diameter of φ7 m (Chuanhuang South to Chuanhuang North) produced a distinguished difference in the water quality before and after. The special hydraulic project might have a certain impact on the aquatic environment (Luo et al., 2019). In summary, both geographical and seasonal effects resulted in the spatio-temporal pattern of the water quality in the MRP.
WQImin simplified water quality assessment by using key parameters based on WQI and TLI, contributing to a more rapid and efficient evaluation of water quality statuses (Wu et al., 2018) and making it easy to obtain and represent the major environmental parameters (Pesce et al., 2000). The most influential parameters in the arithmetic of WQImin were N and CODMn in Lake Taihu (China) (Wu et al., 2018), which were also emphasized in the Dongjiang River (China) (Sun et al., 2016) and the Aksu River (SW-Turkey) (Şener et al., 2017). CODMn and Chl a played important parts and were included in the WQImin of the Luanhe River (China) (Tian et al., 2019). In Dianchi Lake (China), TN, Chl a, and CODMn were selected in the water quality assessment model, which made great contributions (Yang et al., 2018). It concluded that some factors such as TN, Chl a, and CODMn had been widely introduced into WQImin models because of their great impact on water quality assessment.
Comprehensive and full consideration of the weights of selected parameters improved the accuracy of WQImin, which was verified in previous studies (Koçer et al., 2014; Barakat et al., 2016; Tripathi et al., 2019). Compared to other water bodies, the proposed WQImin model in this research was composed of three vital parameters, i.e., TN, Chl a, and CODMn, and evaluated the water quality of the MRP, constructing stricter standards on the spatial and seasonal analysis of the water quality. WQImin could provide simpler measurement methods and lower analytical assumptions (Wang et al., 2019), which has a worthy application for saving testing parameter costs and improving evaluation efficiency.
Water quality in the MRP was “good” throughout the year but was worse in summer than in other seasons. The trophic level was “oligotrophic to mesotrophic”; only Tuanchenghu was in the “mesotrophic” level in spring. WQI decreased and TLI increased significantly from south to north along the MRP. TN, Chl a, and CODMn were the driving factors of the water quality and can be included to establish the reliable WQImin model for water quality assessment.
The original contributions presented in the study are included in the article/Supplementary Material; further inquiries can be directed to the corresponding author.
Conceptualization: YW, CW, and YB; Data curation: YW and CZ; Funding acquisition: YB; Investigation: YW, YZ, YB, WM, GS, SW, YS, and JL; Supervision: CW and YB; Writing—original draft: YW; Writing—review & editing: YB.
This work was partially funded by the China National Critical Project for Science and Technology on Water Pollution Prevention and Control (No. 2017ZX07108-001).
YW and CW were employed by Central Southern Safety & Environmental Technology Institute Company Limited. JL, SW, and YS were employed by the Management Bureau of the South to North Water Transfer Canal Project.
The remaining authors declare that the research was conducted in the absence of any commercial or financial relationships that could be construed as a potential conflict of interest.
All claims expressed in this article are solely those of the authors and do not necessarily represent those of their affiliated organizations, or those of the publisher, the editors, and the reviewers. Any product that may be evaluated in this article, or claim that may be made by its manufacturer, is not guaranteed or endorsed by the publisher.
The Supplementary Material for this article can be found online at: https://www.frontiersin.org/articles/10.3389/fenvs.2023.945884/full#supplementary-material
Akkoyunlu, A., and Akiner, M. E. (2012). Pollution evaluation in streams using water quality indices: A case study from turkey's sapanca lake basin. Ecol. Indic. 18, 501–511. doi:10.1016/j.ecolind.2011.12.018
APHA (2017). Standard methods for the examination of water and wastewater. 23. Washington DC: American Public Health Association.
Barakat, A., El Baghdadi, M., Rais, J., Aghezzaf, B., and Slassi, M. (2016). Assessment of spatial and seasonal water quality variation of oum Er rbia river (Morocco) using multivariate statistical techniques. Int. Soil Water Conservation Res. 4 (4), 284–292. doi:10.1016/j.iswcr.2016.11.002
Burns, N., McIntosh, J., and Scholes, P. (2005). Strategies for managing the lakes of the rotorua district, New Zealand. Lake Reserv. Manag. 21 (1), 61–72. doi:10.1080/07438140509354413
Chang, N. N., Luo, L., Wang, X. C., Song, J., Han, J. X., and Ao, D. (2020). A novel index for assessing the water quality of urban landscape lakes based on water transparency. Sci. Total Environ. 735, 139351. doi:10.1016/j.scitotenv.2020.139351
China Environmental Monitoring Station (2001). Lakes (reservoirs) eutrophication assessment methods and classification Technology requirements. Beijing, China: China Environmental Monitoring Station.
Ding, X. W., Zhu, Q., Zhai, A. F., and Liu, L. (2019). Water quality safety prediction model for drinking water source areas in Three Gorges Reservoir and its application. Ecol. Indic. 101, 734–741. doi:10.1016/j.ecolind.2019.01.068
El-Serehy, H. A., Abdallah, H. S., Al-Misned, F. A., Al-Farraj, S. A., and Al-Rasheid, K. A. (2018). Assessing water quality and classifying trophic status for scientifically based managing the water resources of the Lake Timsah, the lake with salinity stratification along the Suez Canal. Saudi J. Biol. Sci. 25 (7), 1247–1256. doi:10.1016/j.sjbs.2018.05.022
Giri, S., and Qiu, Z. Y. (2016). Understanding the relationship of land uses and water quality in twenty first century: A review. J. Environ. Manag. 173, 41–48. doi:10.1016/j.jenvman.2016.02.029
Guo, C. B., Chen, Y. S., Gozlan, R. E., Liu, H., Lu, Y., Qu, X., et al. (2020b). Patterns of fish communities and water quality in impounded lakes of China's south-to-north water diversion project. Sci. Total Environ. 713, 136515. doi:10.1016/j.scitotenv.2020.136515
Guo, C. B., Chen, Y. S., Xia, W. T., Qu, X., Yuan, H., Xie, S. G., et al. (2020a). Eutrophication and heavy metal pollution patterns in the water suppling lakes of China’s south-to-north water diversion project. Sci. Total Environ. 711, 134543. doi:10.1016/j.scitotenv.2019.134543
Hajigholizadeh, M., and Melesse, A. M. (2017). Assortment and spatiotemporal analysis of surface water quality using cluster and discriminant analyses. Catena 151, 247–258. doi:10.1016/j.catena.2016.12.018
Horton, R. K. (1965). An index-number system for rating water quality. J. Water Pollut. Control Fed. 37 (3), 300–306.
Kannel, P. R., Lee, S., Lee, Y. S., Kanel, S. R., and Khan, S. P. (2007). Application of water quality indices and dissolved oxygen as indicators for river water classification and urban impact assessment. Environ. Monit. Assess. 132 (1-3), 93–110. doi:10.1007/s10661-006-9505-1
Koçer, M. A. T., and Sevgili, H. (2014). Parameters selection for water quality index in the assessment of the environmental impacts of land-based trout farms. Ecol. Indic. 36, 672–681. doi:10.1016/j.ecolind.2013.09.034
Luo, Z. X., Li, S. J., Hou, K., and Ji, G. D. (2019). Spatial and seasonal bacterioplankton community dynamics in the main channel of the middle route of SouthSouth-to-North water diversion project. Res. Microbiol. 170 (1), 24–34. doi:10.1016/j.resmic.2018.08.004
McLean, D. L., Langlois, T. J., Newman, S. J., Holmes, T. H., Birt, M. J., Bornt, K. R., et al. (2016). Distribution, abundance, diversity and habitat associations of fishes across a bioregion experiencing rapid coastal development. Estuar. Coast. Shelf Sci. 178 (5), 36–47. doi:10.1016/j.ecss.2016.05.026
Nazeer, S., Khan, M. U., and Malik, R. N. (2018). Phytoplankton Spatio-temporal dynamics and its relation to nutrients and water retention time in multi-trophic system of Soan River, Pakistan. Environ. Technol. Innovation 9, 38–50. doi:10.1016/j.eti.2017.10.005
Nong, X., Shao, D., Xiao, Y., and Zhong, H. (2019). Spatio-temporal characterization analysis and water quality assessment of the SouthSouth-to-North water diversion project of China. Int. J. Environ. Res. Public Health 16 (12), 2227. doi:10.3390/ijerph16122227
Nong, X., Shao, D., Zhong, H., and Liang, J. (2020). Evaluation of water quality in the South-to-North Water Diversion Project of China using the water quality index (WQI) method. Water Res. 178, 115781. doi:10.1016/j.watres.2020.115781
Pesce, S. F., and Wunderlin, D. A. (2000). Use of water quality indices to verify the impact of Córdoba City (Argentina) on Suquı́a River. Water Res. 34 (11), 2915–2926. doi:10.1016/S0043-1354(00)00036-1
Sánchez, E., Colmenarejo, M. F., Vicente, J., Rubio, A., García, M. G., Travieso, L., et al. (2007). Use of the water quality index and dissolved oxygen deficit as simple indicators of watersheds pollution. Ecol. Indic. 7 (2), 315–328. doi:10.1016/j.ecolind.2006.02.005
Şener, Ş., Şener, E., and Davraz, A. (2017). Evaluation of water quality using water quality index (WQI) method and GIS in Aksu River (SW-Turkey). Sci. Total Environ. 584-585, 131–144. doi:10.1016/j.scitotenv.2017.01.102
Sun, W., Xia, C. Y., Xu, M. Y., Guo, J., and Sun, G. P. (2016). Application of modified water quality indices as indicators to assess the spatial and temporal trends of water quality in the Dongjiang River. Ecol. Indic. 66, 306–312. doi:10.1016/j.ecolind.2016.01.054
Tian, Y. L., Jiang, Y., Liu, Q., Dong, M. Y., Xu, D. X., Liu, Y., et al. (2019). Using a water quality index to assess the water quality of the upper and middle streams of the Luanhe River, northern China. Sci. Total Environ. 667, 142–151. doi:10.1016/j.scitotenv.2019.02.356
Tripathi, M., and Singal, S. K. (2019). Use of principal component analysis for parameter selection for development of a novel water quality index: A case study of river ganga India. Ecol. Indic. 96, 430–436. doi:10.1016/j.ecolind.2018.09.025
Wang, J. L., Fu, Z. S., Qiao, H. X., and Liu, F. X. (2019). Assessment of eutrophication and water quality in the estuarine area of Lake Wuli, Lake Taihu, China. Sci. Total Environ. 650, 1392–1402. doi:10.1016/j.scitotenv.2018.09.137
Wu, Z. S., Wang, X. L., Chen, Y. W., Cai, Y. J., and Deng, J. C. (2018). Assessing river water quality using water quality index in Lake Taihu Basin, China. Sci. Total Environ. 612, 914–922. doi:10.1016/j.scitotenv.2017.08.293
Xin, X. K., Li, K. F., Finlayson, B., and Yin, W. (2015). Evaluation, prediction, and protection of water quality in Danjiangkou Reservoir, China. Water Sci. Eng. 8 (1), 30–39. doi:10.1016/j.wse.2014.11.001
Keywords: South-to-North Water Division Middle Route Project, water quality, physiochemical parameters, trophic level index, heterogeneity
Citation: Wang Y, Wang C, Zhang C, Liang J, Mi W, Song G, Zhu Y, Wang S, Shang Y and Bi Y (2023) Water quality variation in the middle route of South-to-North Water Diversion Project, China. Front. Environ. Sci. 11:945884. doi: 10.3389/fenvs.2023.945884
Received: 17 May 2022; Accepted: 28 February 2023;
Published: 20 March 2023.
Edited by:
Zheng-Yang Huo, Renmin University of China, ChinaReviewed by:
Dongguo Shao, Wuhan University, ChinaCopyright © 2023 Wang, Wang, Zhang, Liang, Mi, Song, Zhu, Wang, Shang and Bi. This is an open-access article distributed under the terms of the Creative Commons Attribution License (CC BY). The use, distribution or reproduction in other forums is permitted, provided the original author(s) and the copyright owner(s) are credited and that the original publication in this journal is cited, in accordance with accepted academic practice. No use, distribution or reproduction is permitted which does not comply with these terms.
*Correspondence: Yonghong Bi, Yml5aEBpaGIuYWMuY24=
Disclaimer: All claims expressed in this article are solely those of the authors and do not necessarily represent those of their affiliated organizations, or those of the publisher, the editors and the reviewers. Any product that may be evaluated in this article or claim that may be made by its manufacturer is not guaranteed or endorsed by the publisher.
Research integrity at Frontiers
Learn more about the work of our research integrity team to safeguard the quality of each article we publish.