 Junxiang Liu
 Haicheng Hong
95% of researchers rate our articles as excellent or good
Learn more about the work of our research integrity team to safeguard the quality of each article we publish.
Find out more
ORIGINAL RESEARCH article
Front. Environ. Sci. , 08 January 2024
Sec. Big Data, AI, and the Environment
Volume 11 - 2023 | https://doi.org/10.3389/fenvs.2023.1341017
This article is part of the Research Topic Methods and Applications of Smart Water Management View all 4 articles
The research and optimization of hydrological forecasting models are among the most crucial components in the scope of water management and flood protection. Optimizing the calibration of hydrological forecasting models is crucial for forecasting performance. A rapid adaptive Shuffled Complex Evolution (SCE) method called Fast Adaptive SCE (FASCE) is proposed for calibrating model parameters. It builds upon the previously established SCE-UA, known for its effectiveness and robustness in the same calibration context. The robustness of the original SCE-UA is expanded upon, introducing a revised adaptive simplex search to bolster efficiency. Additionally, a new strategy for setting up the initial population base enhances explorative capacities. FASCE’s performance has been assessed alongside numerous methods from prior studies, demonstrating its effectiveness. Initial tests were conducted on a set of functions to assess FASCE’s efficacy. Findings revealed that FASCE could curtail the failure rate by a minimum of 80%, whereas the requirement for function evaluations fell between 30% and 60%. Two hydrological models - Support Vector Machine (SVM) and Xinanjiang rainfall-runoff model were employed to estimate the new algorithm’s performance. No failures were reported, and there was a reduction of at least 30% in function evaluations using FASCE. The outcomes from these studies affirm that FASCE can considerably reduce both the number of failures and the count of function evaluations required to reach the global maximum. Hence, FASCE emerges as a viable substitute for model parameter calibration.
The research and optimization of hydrological forecasting models are among the most crucial components in the scope of water management and flood protection. In hydrological forecasting research, a key component involves calibrating parameters of streamflow forecasting models. Accurate forecasts of streamflow are crucial as they furnish vital information for supporting reservoirs’ optimal operation and ensuring control over flood processes (Qin et al., 2010; Chen et al., 2013; 2016; Ouyang et al., 2013; Tsai et al., 2014; Yazdi et al., 2014; Li and Ouyang, 2015; Zhou et al., 2015).
Over the past several decades, scientists in the field have crafted numerous algorithms for calibration. One standout amidst these is Duan et al. (1992) Shuffled Complex Evolution Algorithm (SCE-UA). Known for its robustness and efficiency, through myriad successful applications, it has established itself as a reliable global optimization method for calibrating model parameters (Duan et al., 1992; Yapo et al., 1996; Santos et al., 2003; Ajami et al., 2004; He et al., 2007; Mcmillan et al., 2010; Liu et al., 2015; Uniyal et al., 2015; Her and Heatwole, 2016; Yang J. et al., 2017a; Gopala et al., 2019; Hallabia et al., 2021; Brunetti et al., 2022; Guo et al., 2023). Notably, SCE-UA and related derivatives also target multi-objective optimization problems, extending applications to groundwater and reservoir models (Muttil and Jayawardena, 2008; Chu et al., 2014; Yang et al., 2015; Yang T. et al., 2017b).
Past studies indicate that population diversity greatly impacts the search performance of algorithms (Bremermann et al., 1966; Galar, 1985; Fogel et al., 1998; Muttil and Liong, 2004). Yet, SCE-UA creates populations in a purely random manner. Under certain circumstances, this may inhibit SCE-UA’s convergence to the global optimum. Further constraining SCE-UA’s efficiency, it only spawns new individuals based on the poorest individual and the centroid of the remaining individuals, failing to fully harness previously obtained optimal results data.
Addressing these shortcomings, this research introduces the Fast Adaptive Shuffled Complex Evolution (FASCE), an algorithm based on SCE-UA that heightens the search efficiency through an adaptive simplex search, replacing SCE-UA’s original simplex search. The initial population’s placement strategy, as proposed by Muttil and Jayawardena (2008), is also merged to boost the algorithm’s exploratory capabilities.
FASCE’s effectiveness was validated through various benchmark functions and two daily streamflow forecasting models grounded on Support Vector Machine (SVM) and Xinanjiang model. Due to its excellent performance, SVM is extensively utilized and have been successfully implemented in the field of hydrology (Lin et al., 2006; Tripathi et al., 2006; Mohsen et al., 2009; Yoon et al., 2010; Kisi and Cimen, 2011; Yan et al., 2022; Xu et al., 2023). And the Xinanjiang model has been employed for streamflow forecasting during the last decades (Zhao, 1992; Zhao et al., 1995; Li et al., 2009; Song et al., 2012; Mao et al., 2013; Deng et al., 2015; Rahman and Lu, 2015; Jiang et al., 2023). FASCE’s performance was compared with both the original SCE-UA and the enhanced SCE-UA algorithm (SCE-MJ), as proposed by Muttil and Jayawardena (2008). Results showed FASCE outperforming both and, as such, it stands as a promising alternative for model parameter calibration.
Our study aims to present a new and expedient adaptive shuffled complex evolution (SCE) algorithm for the calibration of streamflow forecasting models based on SVM and Xinanjiang rainfall-runoff model. Multiple search strategies that build upon the original SCE-UA algorithm have been introduced in this research. These innovative strategies enhance the algorithm’s exploration capability and significantly improve its convergence speed. Our approach provides a fast and efficient solution for accurate calibration and forecasting in streamflow analysis.
The Shuffled Complex Evolution-University of Arizona (SCE-UA) algorithm is a powerful optimization method commonly used in hydrological and environmental modeling. It's based on the idea of simulating the complex behavior of nature’s evolutionary process.
By imitating the natural evolution, SCE-UA algorithm efficiently explores a wide range of solution space to find the optimal solution for complex problems such as parameter calibration, uncertainty analysis, and sensitivity analysis. It has been applied in various fields like water resources management, climate modeling, and ecosystem analysis.
And the algorithm proposed by Muttil and Jayawardena (2008), called SCE-MJ model calibrating algorithm, aims to enhance robustness and efficiency in hydrological processes. It utilizes a shuffled complex approach, which involves multiple complexes, each with a set of parameters.
The SCE-MJ algorithm dynamically shuffles the parameter sets between complexes to explore the search space more effectively. This helps in finding the optimal parameter values for calibrating hydrological models. By introducing a crossover process and parameter adaptation, the algorithm improves the efficiency of the optimization process.
The FASCE process is a refined advancement over its predecessor, the SCE-UA method. Detailed comprehension of the SCE-UA model can be acquired through references such as Duan et al., 1992, Duan and Gupta, 1993; Li et al., 2013.
A strategic method offered by Muttil and Jayawardena in 2008 is adopted for determining the initial population in our research. This is geared towards ensuring the SCE-UA algorithm does not become trapped in the local optimality within feasible spatial dimensions. The said strategy is imperative in preserving diversity within the population group. Interested parties can gain more knowledge on this strategy by referring to Muttil and Jayawardena 2008.
Moreover, to elevate the potency of the algorithm’s search capabilities, an innovative, adaptive simplex search mechanism is introduced within this study. This operator is utilized during the reflection or contraction phases to instigate the inception of a new point and shift adaptively towards the optimal point amidst the simplex.
This adaptive procedure is a significant enhancement against the standard SCE-UA method. Benefits include the ability to employ both the optimal point’s data and the information derived during the process of generation. The advent of novel points, courtesy of this adaptive simplex search operator, is dictated by Eqs 1–4.
Where Xnew denotes the new point, Xref denotes the reflected point, Xcon denotes the contracted point, Xb is the best point of the simplex,
Besides, the FASCE also uses two stopping criteria: Parameters distribution and Maximum number of function evaluation, which are the same with SCE-UA. This means that the algorithm can early stop when the parameters distribution is too narrow to search.
In the SCE-MJ algorithm, the shift coefficient must be preset in advance. And this coefficient is always determined by artificial experience. Generally, for some relatively simple test functions (such as Goldstein-Price function, Six-hump function, Griewank function, and so on), the number of local optima is small, and the shift coefficient is set bigger, the shuffle operator can make the generated new point move fast to the global optimum, and the convergence speed is enhanced significantly; and for some complicated test functions (such as Restrigin function, Rastrigin (10D) function, Rosenbrock (10D) function, and so on), the number of local optima is relatively large, and the shift coefficient is set smaller. Thus, to avoid missing the global optimum, the shuffle operator can make the generated new point move slowly to the global optimum, and then the convergence speed improvement becomes small relatively.
However, the complexity of practical problems in engineering usually is not known. Therefore, it is very difficult to set reasonable shift coefficient. Besides, it is not reasonable to set a constant shift coefficient during the whole evolutionary computation process of the algorithm.
To overcome these shortcomings, we propose a novel algorithm FASCE with an adaptive shift operator. And this adaptive shift operator has no parameter needed predefined beforehand and can set adaptive shift coefficient according to the evolutionary computation process. There are three stage in the algorithm evolution as follows:
(1) At the initial stage of evolution, the fluctuation degree of the population is usually big. Then, the adaptive shift operator adopts small shift coefficient to avoid the algorithm missing global optimum.
(2) Meanwhile, with the evolution of algorithms, the fluctuation degree of the population is getting smaller and smaller, this indicates that the algorithm may be getting close to the final global optimum. At this situation, the adaptive shift operator gets big shift coefficient to make the algorithm converge fast to the global optimum.
(3) At the end of the algorithm evolution, the fluctuation degree of the population is getting very small. At this situation, the adaptive shift operator sets small shift coefficient to improve the search accuracy of algorithm.
The differences between these three algorithms are shown in Figure 1.
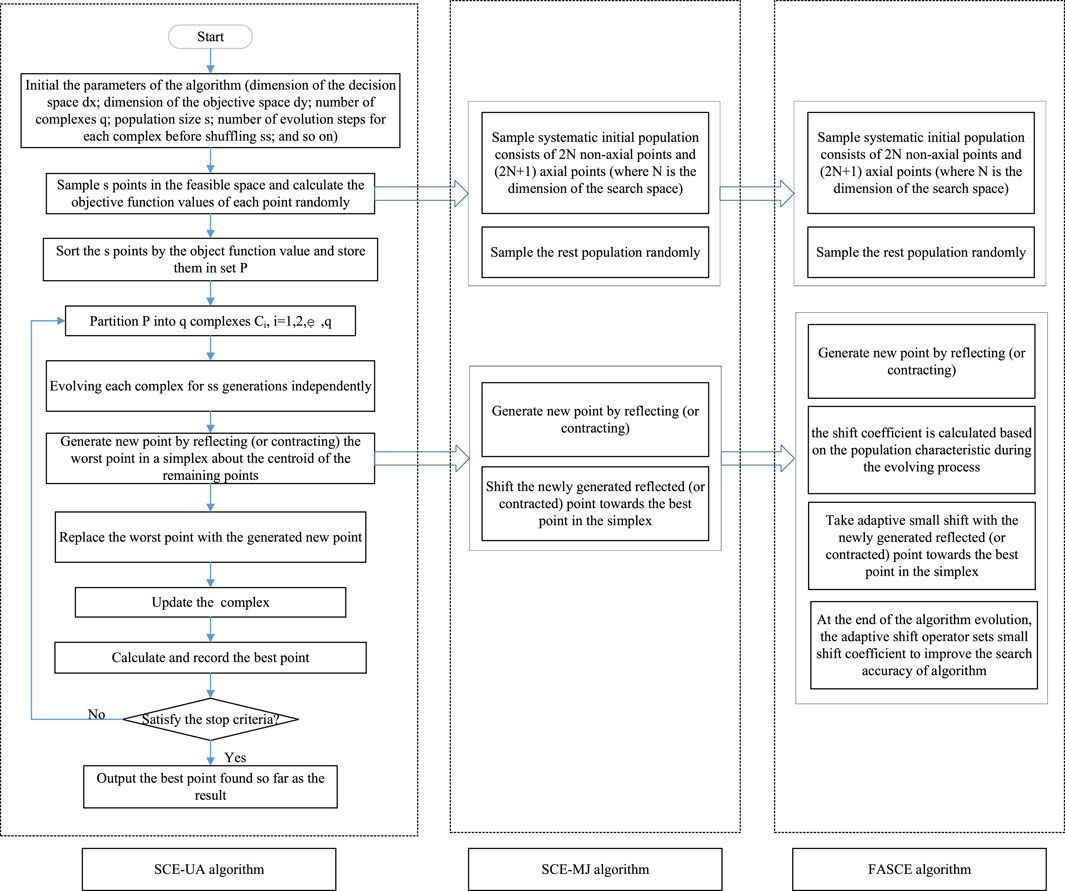
FIGURE 1. The flowchart of FASCE algorithm.
In this study, eight widely recognized benchmark functions, denoted as Eqs 5–12, are utilized to evaluate the efficacy of the FASCE algorithm. These benchmark functions serve as valuable tools in gauging the performance and capabilities of the algorithm. By employing these benchmarks, we can comprehensively assess the algorithm’s effectiveness and ascertain its potential for various applications.
(1) Restrigin function (dimension N = 2)
(2) Goldstein-Price function (dimension N = 2)
(3) Rosenbrock function (dimension N = 2)
(4) Griewank function (dimension N = 2)
(5) Six-Hump function
(6) Restrigin function (dimension N = 10)
(7) Rosenbrock function (dimension N = 10)
(8) Griewank function (dimension N = 10)
In order to assess the algorithm’s performance, we utilize two indices: (a) the number of failures (NF) out of 100 trials and (b) the average number of function evaluations (NFE) for successful trials. Smaller values for NF and NFE indicate better performance. For this analysis, the maximum number of function evaluations is set to 25,000. A trial is deemed successful if the algorithm discovers a function value below 10–3 or is considered a failure if it reaches the maximum number of function evaluations.
Table 1 provides an overview of the outcomes from the FASCE algorithm. Additionally, to facilitate comparison, the results from both the original SCE-UA algorithm and the SCE-MJ algorithm are also presented in Table 1. And the evolving processes of each algorithm on different test functions are shown in Figure 2.
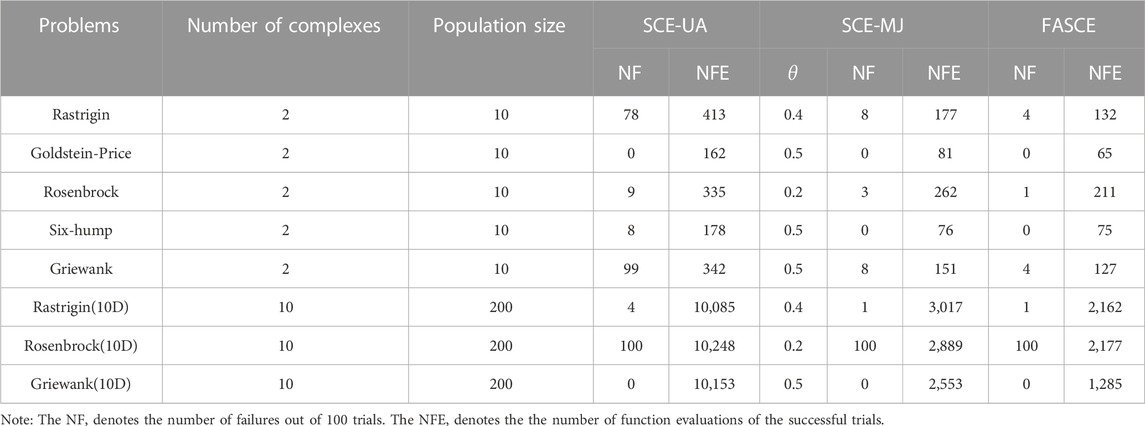
TABLE 1. Performance comparison of the three algorithms on eight benchmark test functions.
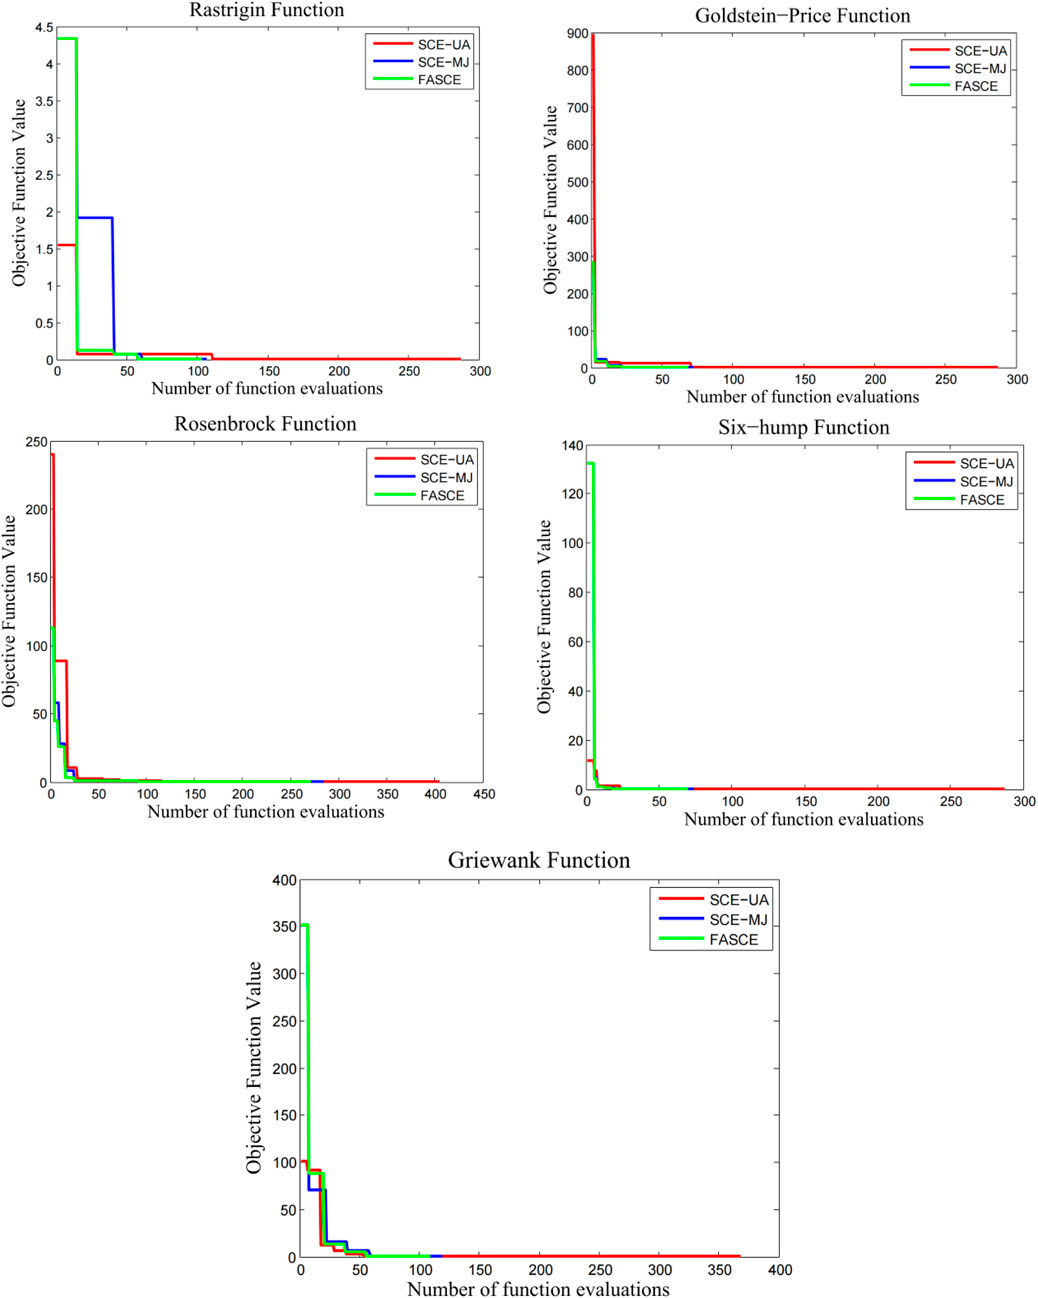
FIGURE 2. The evolving processes of each algorithm on different test functions.
The results presented in Table 1; Figure 2 align closely with previous studies conducted by Duan et al., in 1993 and Muttil and Jayawardena in 2008. It is worth noting that the FASCE algorithm demonstrates a remarkable ability to minimize failures and the number of function evaluations, particularly for the Rastrigin and Goldstein-Price functions, when compared to the original SCE-UA and SCE-MJ methods. Besides, the results show that the performance of FASCE is better than SCE-UA and SCE-MJ on two out of three 10-D functions. Although all the three algorithms cannot reach the global optimum on the 10-D Rosenbrock Function, the algorithm FASCE and SCE-MJ can significantly reduce the number functions estimations with the same search accuracy. This indicates that the FASCE gets better performance than SCE-MJ and SCE-UA.
In this paper, we conducted a study on the Changjiang (Yangtze) River basin. To calibrate and validate our model, we used the observed streamflow data from Yichang Station between 1 January 2005, and 31 December 2007. The data is divided into two sets: the first 730 streamflow data points were used for model calibration, and the remaining data points were used for model validation.
Before we could begin calibrating our model, it was crucial to select an appropriate model structure. In this study, the SVM is chosen for one-day-ahead streamflow forecasting. This means that our model focuses on predicting future streamflow. We used the streamflow data from the past few days as inputs for the model, which is a common approach in similar studies (Aqil et al., 2007; Kisi, 2009; Wang et al., 2009). To determine which previous flow values to include as inputs, we utilized autocorrelation function (ACF) and partial autocorrelation function (PACF) analyses. You can find the ACF and PACF plots of the streamflow data in Figure 3.
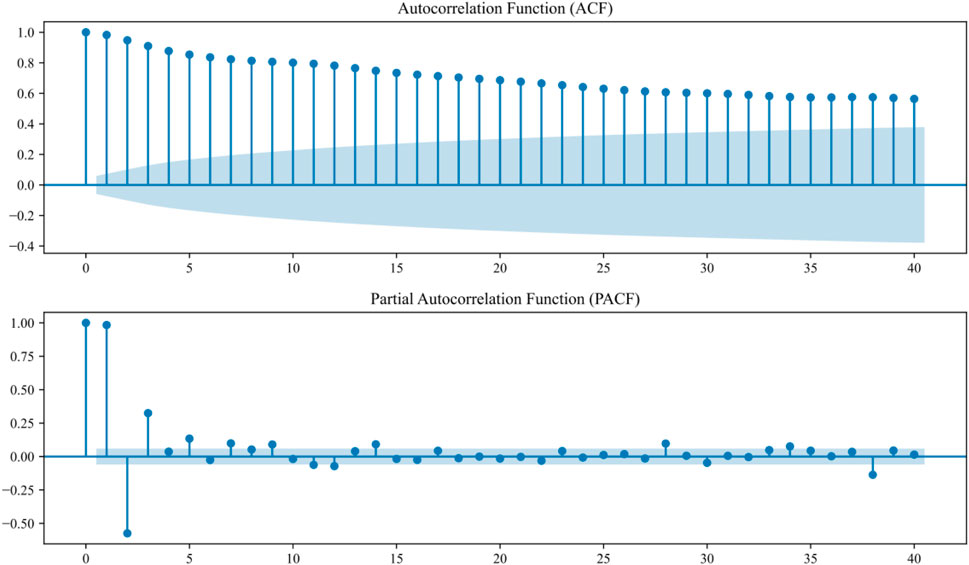
FIGURE 3. The ACF and PACF plots of the streamflow data.
Examining the results shown in Figure 3, it can be noted that:
1) The ACF exhibited a correlation coefficient higher than 0.8 at lag 5.
2) Additionally, the PACF showed significant correlation within a 95% confidence level interval for flow lags of up to 5 days.
Based on these findings, we concluded that the 5 antecedent flow values serve as suitable inputs for our daily streamflow forecasting model.
Here, the SVM algorithm is employed for streamflow forecasting. The primary objective (as Eq. 13) of using SVM is to discover a function that can accurately predict streamflow. SVM works by identifying a mathematical function that maps the input variables to the output variable, in this case, the streamflow.
By incorporating SVM into our approach, we can better forecast future streamflow levels, providing valuable insights for water resource management and planning.
Subject to:
Where the
The utilized equations clearly demonstrate that within the SVM-based model for daily streamflow prediction, there exist three specific parameters: the penalty factor C, tolerance level ε, and the kernel parameter σ. It's crucial that these parameters are accurately calibrated. Illustrating the varying ranges of parameters, Table 2 reflects the same parameter values as stipulated in the study by Gill et al., in 2006.
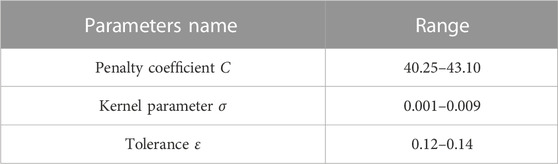
TABLE 2. The detail of the SVM parameters.
Furthermore, the model’s training objective is primarily based on the Root Mean Square Error (RMSE), a statistically significant metric devised to quantify prediction error. The mathematical expression defining RMSE is demonstrated in the equation presented as Eq. 14.
Where n denotes the length of streamflow;
A series of test trials are executed prior to initiating the actual training phase, with the primary goal of identifying the optimal success threshold. The model has undergone several iterations of preliminary testing, leading to the observation that the optimal RMSE value achieved via the FASCE algorithm is approximately 3,270 m3/s. Hence, this specific value is assigned as the success threshold determinant. In essence, a trial is considered successful if the best function value yielded by the algorithm is less than 3,270 m3/s. On the contrary, a trial is deemed a failure if it hits the maximum limit of function evaluations. To moderate the potential impact of any inherent random element within the previously discussed three algorithms, each one is operated independently 20 times. The experimental outcomes are consolidated and presented in Tables 3, 4.
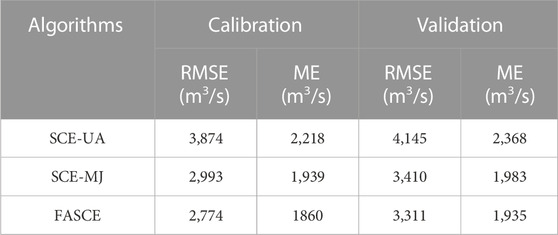
TABLE 3. The mean forecasting performance of 20 trials for each algorithm on SVM based hydrological model calibration.
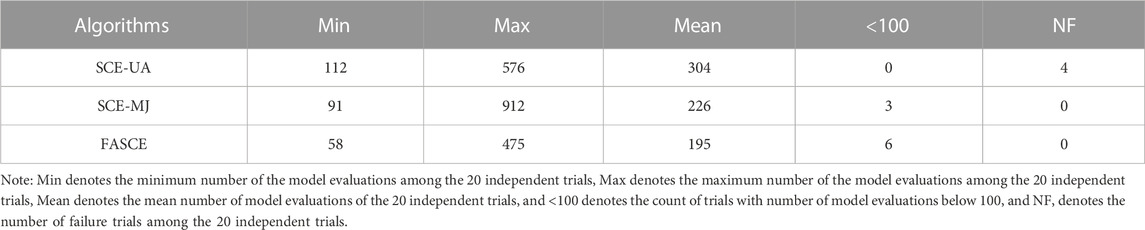
TABLE 4. The efficient performance of each algorithm on SVM based hydrological model calibration.
Within the context of this paper, two key metrics have been selected as the estimate indices for forecasting results: the Root Mean Square Error (RMSE) and Mean Error (ME). ME can be calculated by Eq. 15. The mathematical interpretation of ME is explained in the subsequent equation. Lower RMSE and ME values are indicative of superior performance.
Where n denotes the length of streamflow;
Based on the analysis shown in Table 3, it is evident that three algorithms exhibit nearly identical RMSE values, thereby indicating the suitability of the threshold value of 3,270 m3/s. To further evaluate the efficiency of these algorithms, Table 4 provides a summary of their performance. Clearly, the FASCE algorithm outperforms the other two algorithms in terms of achieving the same level of performance. Not only does FASCE demonstrate significantly faster speed compared to SCE-UA and SCE-MJ, but it also exhibits similar search accuracy when compared to SCE-MJ. One possible reason for this could be that the FASCE algorithm primarily focuses on enhancing the search speed of SCE-MJ, without modifying its local searching operator.
Figure 4 illustrates the results obtained by the FASCE algorithm during the calibration and validation period. In this figure, dots represent the observed streamflow, while lines represent the predicted streamflow. It is worth noting that the model accurately captures the characteristics of the streamflow hydrograph, although some timing errors are present. This indicates that there may be a need for further improvement in the model structure.
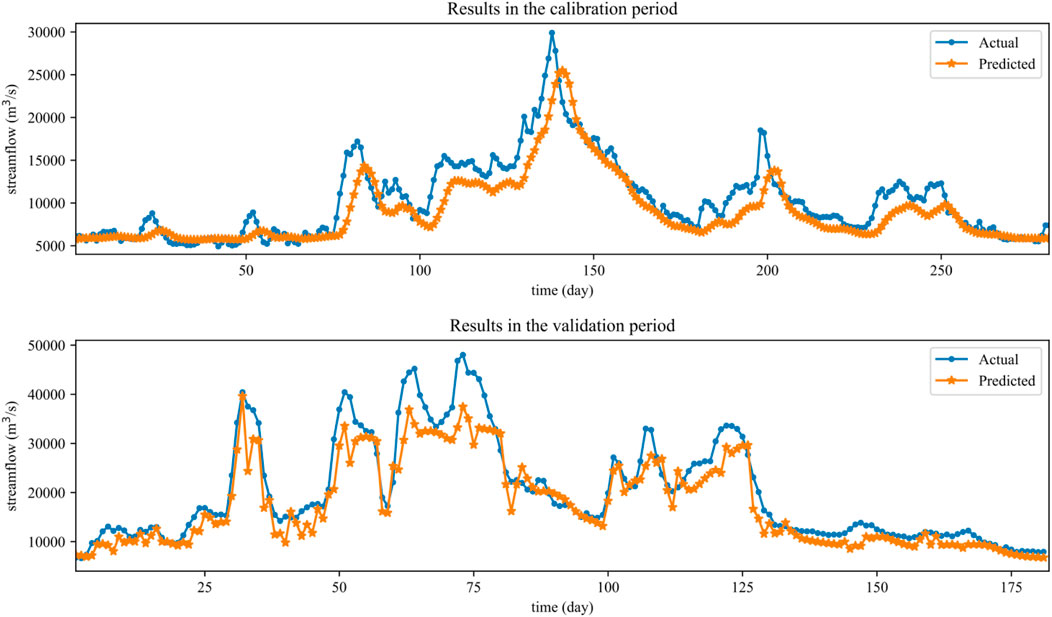
FIGURE 4. Streamflow forecasting results during calibration period and validation period with FASCE algorithm.
Xinanjiang model is first proposed by Professor Zhao Renjun in China. This model is widely used in streamflow prediction in moist and semi-humid basins. The most widely used framework is the three source Xinanjiang model. And the parameter descriptions are shown in Table 5. The basic frame and the description of the model parameters can be referred to the references (Zhao, 1992; Li et al., 2009; Song et al., 2012; Rahman and Lu, 2015).
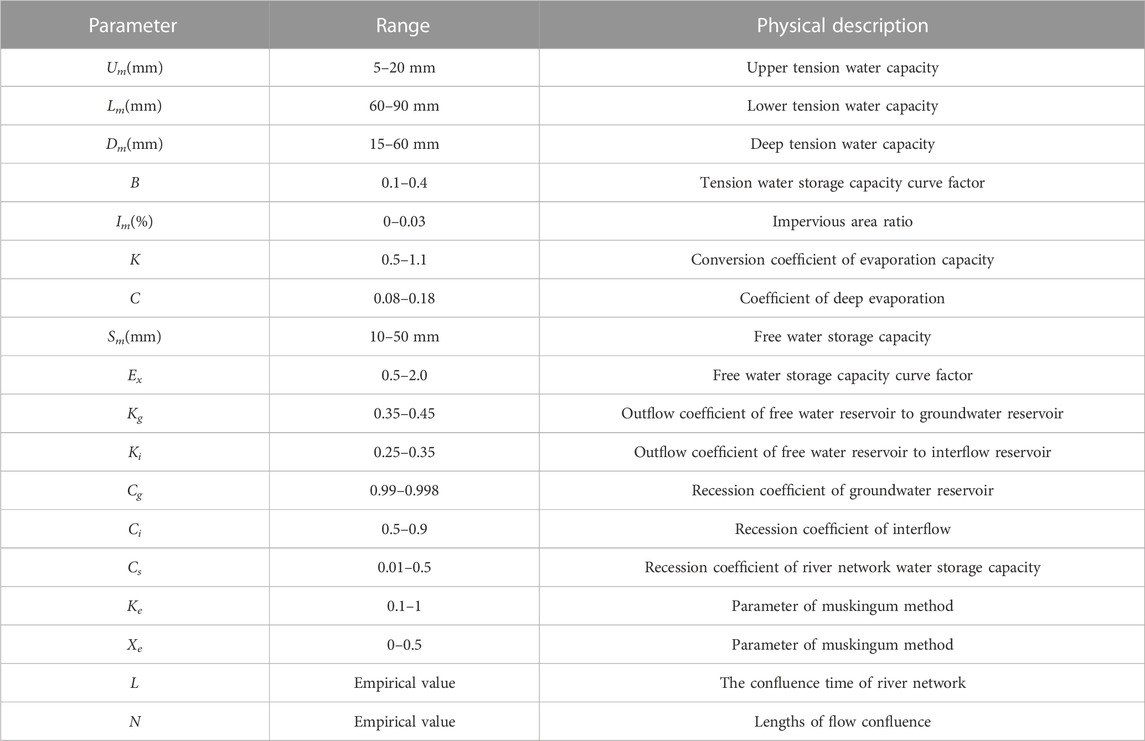
TABLE 5. The parameters of the Xinanjiang model.
In this research, the streamflow prediction of Zishui watershed is taken as the second case study. The Zishui watershed area is about 22,640 km2, and this watershed plays an important role in power generation and flood control in Hunan province. The location of the Zishui watershed is shown as Figure 5.
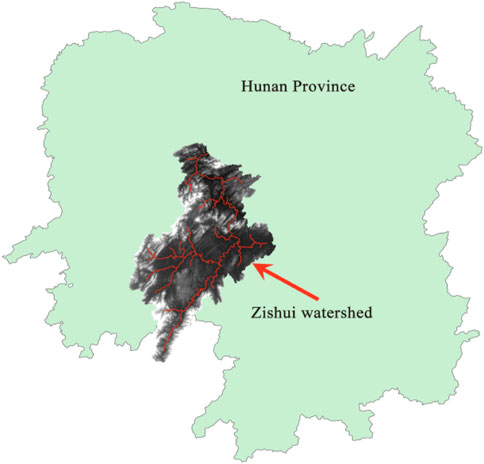
FIGURE 5. The location of the Zhexi reservoir watershed.
The Zishui watershed has 32 rainfall stations, 6 water level stations. The history of water and rainfall observation data of river basin is very complete. The observed data from the 32 rainfall stations and 6 water level stations between 2004-1-1 and 2014-12-31 is used for model calibration and validation. The observation data for the first 6 years is used for model calibration, while the rest used for model validation.
Three algorithms SCE-UA, SCE-UA-MJ and FASCE are employed for model calibration. Similar with the above case study, the Root Mean Square Error (RMSE) is selected as the training objective function. From several forwards testing of the model, we note that the best RMSE value found by FASCE algorithm is about 662 m3/s. Therefore, this value 662 m3/s is selected as a threshold to determine a trial is success or not. To reduce the influence of the random factor existed in the above mentioned three algorithms, each algorithm runs 20 times independently. The results of the experiment are summarized in Tables 6, 7.
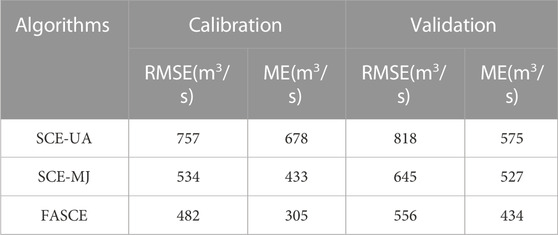
TABLE 6. The mean forecasting performance of 20 trials for each algorithm on Xinanjiang hydrological model calibration.
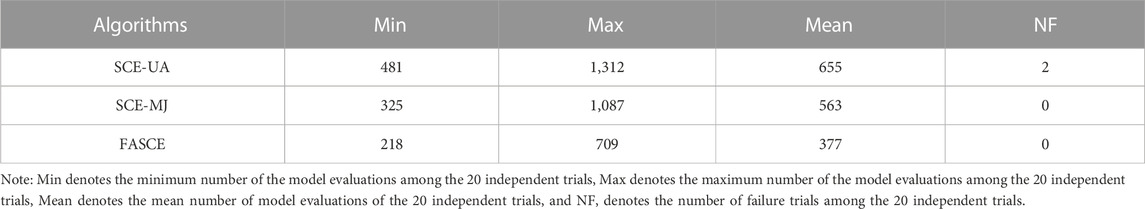
TABLE 7. The efficient performance of each algorithm on Xinanjiang hydrological model calibration.
The model parameter calibration results of the FASCE are shown in Table 8.
TABLE 8. The calibration results of the Xinanjiang model.
The results obtained by FASCE algorithm in calibration and validation period are given in Figure 6, where dots denote the observed streamflow while lines denote the predicted streamflow. It can also be indicated that the model can fit the characteristics of the streamflow hydrograph very well.
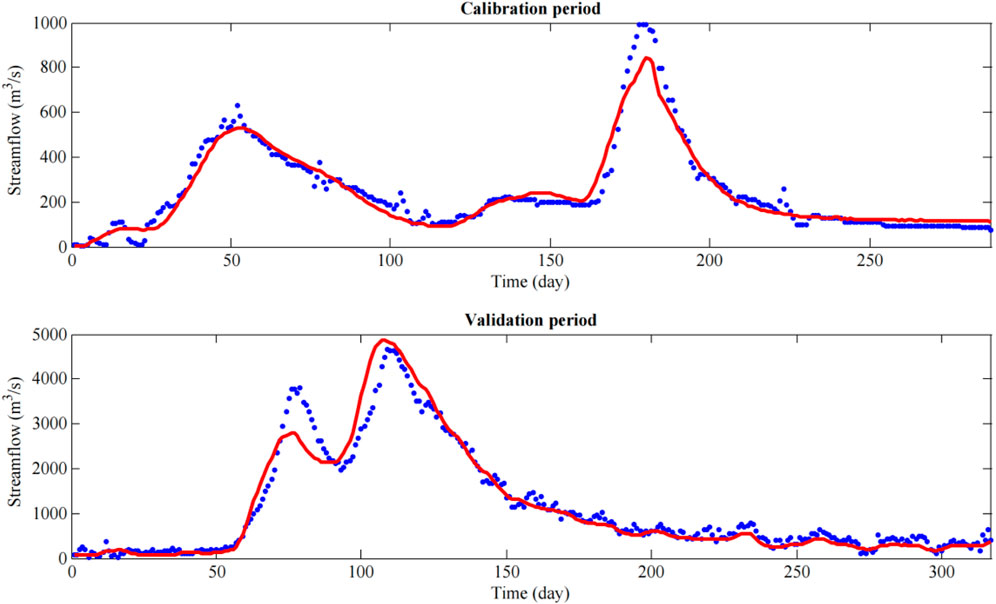
FIGURE 6. Streamflow forecasting results of the Zishui watershed during calibration period and validation period with FASCE algorithm.
From the above results, it can be noted that three algorithms can all get very good performance, and the algorithm FASCE are more efficient to arrive at the same performance than the other two algorithms. Same with the above case study, the FASCE mainly enhances the evolving speed, so the FASCE has faster converge speed but nearly same search accuracy than SCE-MJ.
In this paper, we introduce an exciting new algorithm called FASCE that aims to enhance model parameter calibration. The FASCE algorithm builds upon the foundation of the original SCE-UA algorithm by implementing a modified adaptive simplex search and incorporating a new strategy for locating the initial population. The effectiveness of the FASCE algorithm is tested on eight benchmark functions and two daily streamflow forecasting model based on SVM and Xinanjiang model. The results are then compared with those achieved using the original SCE-UA algorithm and SCE-MJ algorithm. Based on our findings, the following conclusions can be drawn:
1) The FASCE algorithm introduces an adaptive shuffle operator, which greatly improves the convergence speed of SCE-UA. By dynamically shifting the newly generated points towards the best point found so far, a significant enhancement can be noted in convergence speed across various test functions and two hydrological forecasting models.
2) Setting a proper shift coefficient in advance for the SCE-MJ algorithm is a challenging task. Additionally, using a constant shift coefficient throughout the entire evolutionary computation process seems impractical. To address these limitations, we propose the novel FASCE algorithm, which includes an adaptive shift operator. This operator does not require any predefined parameters and adjusts the shift coefficient based on the evolving population characteristics during the computation process. This innovative design overcomes the shortcomings of SCE-MJ and significantly improves the algorithm’s convergence performance.
3) Initial tests were conducted on a set of functions to assess FASCE’s efficacy. The results showed that FASCE could curtail the failure rate by a minimum of 80%, whereas the requirement for function evaluations fell between 30% and 60%. Two hydrological models - SVM and Xinanjiang rainfall-runoff model were employed to estimate the new algorithm’s performance. No failures were reported, and there was a reduction of at least 30% in function evaluations using FASCE.
4) While the FASCE algorithm demonstrates excellent performance overall, it may yield suboptimal results in specific problem scenarios. As a result, we plan to focus our future work on enhancing the algorithm’s search capability for high-dimensional problems.
The original contributions presented in the study are included in the article/Supplementary Material, further inquiries can be directed to the corresponding author.
JL: Conceptualization, Funding acquisition, Project administration, Writing–original draft, Writing–review and editing. HH: Conceptualization, Writing–review and editing. WF: Methodology, Visualization, Writing–review and editing. YC: Software, Validation, Writing–review and editing.
The author(s) declare financial support was received for the research, authorship, and/or publication of this article. This research work is support by the Science and Technology Project of China Southern Power Grid Co., Ltd., (GDKJXM20220232).
Thanks to the editorial team and the reviewers for their valuable feedback and assistance in improving our article.
Authors JL, HH, WF, and YC were employed by Guangdong Power Grid Co., Ltd.
All claims expressed in this article are solely those of the authors and do not necessarily represent those of their affiliated organizations, or those of the publisher, the editors and the reviewers. Any product that may be evaluated in this article, or claim that may be made by its manufacturer, is not guaranteed or endorsed by the publisher.
Ajami, N. K., Gupta, H., Wagener, T., and Sorooshian, S. (2004). Calibration of a semi-distributed hydrologic model for streamflow estimation along a river system. J. Hydrology 298 (1-4), 2–35. doi:10.1016/j.jhydrol.2004.03.033
Aqil, M., Kita, I., Yano, A., and Nishiyama, S. (2007). A comparative study of artificial neural networks and neuro-fuzzy in continuous modeling of the daily and hourly behaviour of runoff. J. Hydrology 337 (1-2), 22–34. doi:10.1016/j.jhydrol.2007.01.013
Bremermann, H. J., Rogson, M., and Salaff, S. (1966). in Global properties of evolutionprocesses. Natural automata and useful simulations. Editors H. H. Pattee, E. A. Edelsack, L. Feinand, and A. B. Callahan (Washington D.C.: Spartan Books), 3–41.
Brunetti, G., Stumpp, C., and Šimůnek, J. (2022). Balancing exploitation and exploration: a novel hybrid global-local optimization strategy for hydrological model calibration. Environ. Model. Softw. 150, 105341. doi:10.1016/j.envsoft.2022.105341
Chen, L., Singh, V. P., and Guo, S. (2013). Measure of correlation between river flows using the copula-entropy method. J. Hydrologic Eng. 18 (12), 1591–1606. doi:10.1061/(asce)he.1943-5584.0000714
Chen, L., Singh, V. P., Lu, W., Zhang, J., Zhou, J., and Guo, S. (2016). Streamflow forecast uncertainty evolution and its effect on real-time reservoir operation. J. Hydrology 540, 712–726. doi:10.1016/j.jhydrol.2016.06.015
Chu, W., Yang, T., and Gao, X. (2014). Comment on ‘High-dimensional posterior exploration of hydrologic models using multiple-try DREAM (ZS) and high-performance computing’ by Eric Laloy and Jasper A. Vrugt. Water Resour. Res. 50 (3), 2775–2780. doi:10.1002/2012wr013341
Deng, C., Liu, P., Liu, Y., Wu, Z., and Wang, D. (2015). Integrated hydrologic and reservoir routing model for real-time water level forecasts. J. Hydrologic Eng. 20 (9), 05014032. doi:10.1061/(asce)he.1943-5584.0001138
Duan, Q., and Gupta, V. K. (1993). Shuffled complex evolution approach for effective and efficient global minimization. J. Optim. Theory Appl. 76 (3), 501–521. doi:10.1007/bf00939380
Duan, Q., Sorooshian, S., and Gupta, V. (1992). Effective and efficient global optimization for conceptual rainfall-runoff models. Water Resour. Res. 28 (4), 1015–1031. doi:10.1029/91wr02985
Fogel, G. B., Andrews, P. C., and Fogel, D. B. (1998). On the instability of evolutionary stable strategies in small populations. Ecol. Modell. 109 (3), 283–294. doi:10.1016/S0304-3800(98)00068-4
Galar, R. (1985). Handicapped individuals in evolutionary processes. Biol. Cybern. 51 (1), 1–9. doi:10.1007/BF00355685
Gill, M. K., Kaheil, Y. H., Khalil, A., McKee, M., and Bastidas, L. (2006). Multiobjective particle swarm optimization for parameter estimation in hydrology. Water Resour. Res. 42, W07417. doi:10.1029/2005wr004528
Gopala, S. P., Kawamura, A., Amaguchi, H., Takasaki, T., and Azhikodan, G. (2019). A bootstrap approach for the parameter uncertainty of an urban-specific rainfall-runoff model. J. Hydrology 579, 124195. doi:10.1016/j.jhydrol.2019.124195
Guo, J., Liu, Y., Zou, Q., Ye, L., Zhu, S., and Zhang, H. (2023). Study on optimization and combination strategy of multiple daily runoff prediction models coupled with physical mechanism and LSTM. J. Hydrology 624, 129969. doi:10.1016/j.jhydrol.2023.129969
Hallabia, H., Hamam, H., and Ben Hamida, A. (2021). An optimal use of SCE-UA method cooperated with superpixel segmentation for pansharpening. IEEE Geoscience Remote Sens. Lett. 18, 1620–1624. doi:10.1109/lgrs.2020.3004320
He, B., Takase, K., and Wang, Y. (2007). Regional groundwater prediction model using automatic parameter calibration SCE method for a coastal plain of Seto Inland Sea. Water Resour. Manag. 21 (6), 947–959. doi:10.1007/s11269-006-9066-7
Her, Y., and Heatwole, C. (2016). Two-dimensional continuous simulation of spatiotemporally varied hydrological processes using the time-area method. Hydrol. Process. 30 (5), 751–770. doi:10.1002/hyp.10644
Jiang, C., Zhang, S., and Xie, Y. (2023). Constrained shuffled complex evolution algorithm and its application in the automatic calibration of Xinanjiang model. Front. Earth Sci. 10, 1037173. doi:10.3389/feart.2022.1037173
Kisi, O. (2009). Neural networks and wavelet conjunction model for intermittent streamflow forecasting. J. Hydrologic Eng. 14 (8), 773–782. doi:10.1061/(asce)he.1943-5584.0000053
Kisi, O., and Cimen, M. (2011). A wavelet-support vector machine conjunction model for monthly streamflow forecasting. J. Hydrology 399 (1-2), 132–140. doi:10.1016/j.jhydrol.2010.12.041
Li, H. X., Zhang, Y. Q., Chiew, F. H. S., and Xu, S. G. (2009). Predicting runoff in ungauged catchments by using Xinanjiang model with MODIS leaf area index. J. Hydrology 370 (1-4), 155–162. doi:10.1016/j.jhydrol.2009.03.003
Li, Q., and Ouyang, S. (2015). Research on multi-objective joint optimal flood control model for cascade reservoirs in river basin system. Nat. Hazards 77 (3), 2097–2115. doi:10.1007/s11069-015-1692-z
Li, Z., Xin, P., and Tang, J. (2013). Study of the Xinanjiang model parameter calibration. J. Hydrologic Eng. 18 (11), 1513–1521. doi:10.1061/(asce)he.1943-5584.0000527
Lin, J. Y., Cheng, C. T., and Chau, K. W. (2006). Using support vector machines for long-term discharge prediction. Hydrological Sci. J. 51 (4), 599–612. doi:10.1623/hysj.51.4.599
Liu, H., Zhao, W., He, Z., and Liu, J. (2015). Soil moisture dynamics across landscape types in an arid inland river basin of Northwest China. Hydrol. Process. 29 (15), 3328–3341. doi:10.1002/hyp.10444
Mao, Y., Zhang, X., and Li, Z. (2013). Coupled simulation of Xinanjiang model with MODFLOW. J. Hydrologic Eng. 18 (11), 1443–1449. doi:10.1061/(asce)he.1943-5584.0000706
Mcmillan, H., Freer, J., Pappenberger, F., Krueger, T., and Clark, M. (2010). Impacts of uncertain river flow data on rainfall-runoff model calibration and discharge predictions. Hydrol. Process. 24 (10), 1270–1284. doi:10.1002/hyp.7587
Mohsen, B., Keyvan, A., Morteza, E., and Palhang, M. (2009). Generalization performance of support vector machines and neural networks in runoff modeling. Expert Syst. Appl. 36 (4), 7624–7629. doi:10.1016/j.eswa.2008.09.053
Muttil, N., and Jayawardena, A. W. (2008). Shuffled Complex Evolution model calibrating algorithm: enhancing its robustness and efficiency. Hydrol. Process. 22 (23), 4628–4638. doi:10.1002/hyp.7082
Muttil, N., and Liong, S. Y. (2004). Superior exploration–exploitation balance in shuffled complex evolution. J. Hydrologic Eng. 130 (12), 1202–1205. doi:10.1061/(asce)0733-9429(2004)130:12(1202)
Ouyang, S., Zhou, J., Zhou, C., and Wang, H. (2013). Research on impounding dispatch for the lower cascade reservoir in Jinsha River and Three Gorges cascade. J. Hydraulic Eng. 44 (4), 435–443. doi:10.13243/j.cnki.slxb.2013.04.009
Qin, H., Zhou, J., Lu, Y., Li, Y., and Zhang, Y. (2010). Multi-objective cultured differential evolution for generating optimal trade-offs in reservoir flood control operation. Water Resour. Manag. 24 (11), 2611–2632. doi:10.1007/s11269-009-9570-7
Rahman, M. M., and Lu, M. (2015). Model spin-up behavior for wet and dry basins: a case study using the Xinanjiang model. Water 7 (8), 4256–4273. doi:10.3390/w7084256
Santos, C. A. G., Srinivasan, V. S., Suzuki, K., and Watanabe, M. (2003). Application of an optimization technique to a physically based erosion model. Hydrol. Process. 17 (5), 989–1003. doi:10.1002/hyp.1176
Song, X. M., Kong, F. Z., Zhan, C. S., and Han, J. W. (2012). Hybrid optimization rainfall-runoff simulation based on Xinanjiang model and artificial neural network. J. Hydrologic Eng. 17 (9), 1033–1041. doi:10.1061/(asce)he.1943-5584.0000548
Tripathi, S., Srinivas, V. V., and Nanjundiah, R. S. (2006). Downscaling of precipitation for climate change scenarios: a support vector machine approach. J. Hydrology 330 (3-4), 621–640. doi:10.1016/j.jhydrol.2006.04.030
Tsai, M. J., Abrahart, R. J., Mount, N. J., and Chang, F. J. (2014). Including spatial distribution in a data-driven rainfall-runoff model to improve reservoir inflow forecasting in Taiwan. Hydrol. Process. 28 (3), 1055–1070. doi:10.1002/hyp.9559
Uniyal, B., Jha, M. K., and Verma, A. K. (2015). Parameter identification and uncertainty analysis for simulating streamflow in a river basin of Eastern India. Hydrol. Process. 29 (17), 3744–3766. doi:10.1002/hyp.10446
Wang, W., Chau, K., Cheng, C., and Qiu, L. (2009). A comparison of performance of several artificial intelligence methods for forecasting monthly discharge time series. J. Hydrology 374 (3), 294–306. doi:10.1016/j.jhydrol.2009.06.019
Xu, D., Wang, X., Wang, W., Chau, K. w., and Zang, H. f. (2023). Improved monthly runoff time series prediction using the SOA–SVM model based on ICEEMDAN–WD decomposition. J. Hydroinformatics 25, 943–970. doi:10.2166/hydro.2023.172
Yan, L., Lei, Q., Jiang, C., Yan, P., Ren, Z., Liu, B., et al. (2022). Climate-informed monthly runoff prediction model using machine learning and feature importance analysis. Front. Environ. Sci. 10, 1049840. doi:10.3389/fenvs.2022.1049840
Yang, J., McMillan, H., and Zammit, C. (2017a). Modeling surface water–groundwater interaction in New Zealand: model development and application. Hydrol. Process. 31 (4), 925–934. doi:10.1002/hyp.11075
Yang, T., Gao, X., Sellars, S. L., and Sorooshian, S. (2015). Improving the multi-objective evolutionary optimization algorithm for hydropower reservoir operations in the California Oroville-Thermalito complex. Environ. Model. Softw. 69 (C), 262–279. doi:10.1016/j.envsoft.2014.11.016
Yang, T., Tao, Y., Li, J., Zhu, Q., Su, L., He, X., et al. (2017b). Multi-criterion model ensemble of CMIP5 surface air temperature over China. Theor. Appl. Climatol. 2017 (6), 1057–1072. doi:10.1007/s00704-017-2143-4
Yapo, P., Gupta, V. K., and Sorooshian, S. (1996). Automatic calibration of conceptual rainfall-runoff models: sensitivity to calibration data. J. Hydrology 181 (1-4), 23–48. doi:10.1016/0022-1694(95)02918-4
Yazdi, J., Salehi Neyshabouri, S. A. A., and Golian, S. (2014). A stochastic framework to assess the performance of flood warning systems based on rainfall-runoff modeling. Hydrol. Process. 28 (17), 4718–4731. doi:10.1002/hyp.9969
Yoon, H., Jun, S. C., Hyun, Y., Bae, G. O., and Lee, K. K. (2010). A comparative study of artificial neural networks and support vector machines for predicting groundwater levels in a coastal aquifer. J. Hydrology 36 (4), 7624–7629. doi:10.1016/j.jhydrol.2010.11.002
Zhao, R. J. (1992). The Xinanjiang model applied in China. J. Hydrology 135 (1-4), 371–381. doi:10.1016/0022-1694(92)90096-e
Zhao, R. J., Liu, X. R., and Singh, V. P. (1995). The Xinanjiang model. Proc Oxf. Symposium Hydrological Forecast. Iahs Publ 135 (1), 371–381.
Keywords: model calibration, adaptive shuffle, support vector machine, hydrological model, streamflow forcasting
Citation: Liu J, Hong H, Fan W and Chen Y (2024) A novel fast and efficient adaptive shuffled complex evolution algorithm for model parameter calibration. Front. Environ. Sci. 11:1341017. doi: 10.3389/fenvs.2023.1341017
Received: 19 November 2023; Accepted: 15 December 2023;
Published: 08 January 2024.
Edited by:
Ming Zhong, Sun Yat-sen University, ChinaReviewed by:
Changqing Meng, North China Electric Power University, ChinaCopyright © 2024 Liu, Hong, Fan and Chen. This is an open-access article distributed under the terms of the Creative Commons Attribution License (CC BY). The use, distribution or reproduction in other forums is permitted, provided the original author(s) and the copyright owner(s) are credited and that the original publication in this journal is cited, in accordance with accepted academic practice. No use, distribution or reproduction is permitted which does not comply with these terms.
*Correspondence: Junxiang Liu, angubGl1LmNzZ0Bob3RtYWlsLmNvbQ==
Disclaimer: All claims expressed in this article are solely those of the authors and do not necessarily represent those of their affiliated organizations, or those of the publisher, the editors and the reviewers. Any product that may be evaluated in this article or claim that may be made by its manufacturer is not guaranteed or endorsed by the publisher.
Research integrity at Frontiers
Learn more about the work of our research integrity team to safeguard the quality of each article we publish.