 Qimiao Nie
 Siying Chen
 Yiming Chen
 Yiguo Hu
- 1School of Economics and Management, University of Chinese Academy of Sciences, Beijing, China
- 2Research Center on Fictitious Economy and Data Science, Chinese Academy of Science, Beijing, China
Prediction of bond return is a classic problem in financial area, providing an important basis for portfolio construction and risk management. The sustainable investment attribute of green bonds has been favored by investors, so that green bonds have become an important component for major asset allocation. However, due to the specific investment focus of green bonds, investors’ return expectations are influenced not only by traditional corporate bond factors, but also by related factors such as climate change and energy transition. Against the backdrop of increasingly severe climate risks and the global energy crisis, this paper analyses the volatility characteristics of China’s green bonds at multiple time scales, and introduces exogenous variables such as returns of the alternative financial assets, climate risks and returns of energy markets for prediction. Based on the LSTM model, the volatility of green bond yield at different time scales is separately predicted using optimal exogenous variable before integration. It is found that the new integrated prediction model can significantly improve the forecasting performance compared to traditional single LSTM models and simple decomposition-integrated models. Further, both climate risks and energy markets variables have a significant improvement effect on predicting green bond in low-frequency item, while energy markets variables also have a better predictive effect on trend items. Building on the use of only LSTM model, it could be further enhanced by integrating more algorithms to select the best single model for each component, further improve the prediction accuracy and provide a more effective quantitative tool for investment decision-making and risk management in related fields.
1 Introduction
With the development of human economy and society, especially the rapid rise of the secondary industry after the Industrial Revolution, the global environmental pollution problem is becoming increasingly serious. The 1992 United Nations Framework Convention on Climate Change (UNFCCC) proposed a goal of reducing 50% global greenhouse gas emissions by the mid-21st century. However, there is a huge funding gap for global climate change mitigation related projects, and relying solely on government subsidies is insufficient to meet the demand. Social capital is urgently needed to provide stable financial support. In this context, green financial markets and related green financial innovation products have emerged in recent years. Green financial products represented by green credit and green bonds can effectively promote the market funds to support green projects and brown transformation projects, which can form stable financial support for climate change and the environmental improvement related projects. Green bonds, as fixed income securities that raise necessary funds for promoting low-carbon economy and adapting to the climate change projects, have developed rapidly over the world in recent years. According to Climate Bonds Initiative (CBI), the global issuance scale of green bonds exceeded 500 billion US dollars in 2021, an increase of over 70% compared to 2020.
The strategic framework for developing China’s green financial system was initially delineated in “General Plan for Ecological Civilization System Reform” in 2015. This general plan advocated for the evolution of green finance instruments, including green credit, green bonds, green development funds and green insurance, which can support China’s ecological civilization construction. In recent years, China’s green bond market has developed rapidly. In 2021, the issuance scale of China’s green bonds surged to $68.2 billion, propelling China from its fourth-place global position in 2020 to the world’s second-largest green bond market, trailing only the United States. As of the end of 2021, China’s cumulative green bond issuance reached $199.2 billion, also second only to the United States figure of $305.5 billion. Consequently, green bonds have become a critical tool for investment and financing in China’s sustainable development area. Simultaneously, the analysis and prediction of green bond return has emerged as urgent issues in financial asset portfolio allocation and risk management.
As a sub-class of fixed income securities, green bond return is affected by factors similar to conventional bonds, such as the market supply and demand, risk-free interest rate, and returns of other primary asset classes (Dieci et al., 2018; Albagli et al., 2019; Bessembinder et al., 2022; Duong et al., 2023). At the same time, green bonds serve as a critical climate investment and financing instrument, as well as an essential policy tool for China in pursuing its “dual carbon” goals (Peng and Xiong, 2022). Consequently, the green bond return is also influenced by unique factors compared to traditional credit bonds. As most of the investment direction of green bonds is closely related to energy transition and environmental protection, elements related to low-carbon transition and climate change, such as energy prices and carbon emissions, can shape market investors’ expectations and thus cause price fluctuations of green bonds (Tian et al., 2022; Rehman et al., 2023). In particular, the increasing frequency of extreme climate events and the intensification of global political conflicts leading to energy crises have increased the volatility of green bonds in recent years (Bouri et al., 2023). However, existing research explicitly predicting green bond return still needs to be expanded, as the few relevant studies still focus primarily on improving the forecasting algorithm without selecting suitable influencing variables based on the intrinsic characteristics of green bonds.
The innovation of this paper is reflected in three aspects. First, it builds upon traditional bond-influencing factors by incorporating elements such as major energy market prices, the uncertainty of climate policy, and climate risk awareness, to closely examine their predictive effects on green bond return. Second, considering the varying impact durations of different external factors on green bonds, the CREEMDAN decomposition is employed to analyze the characteristics across multiple time scales. Then, by selecting different external factors at each time scale, the prediction model is optimized, reflecting the diverse influences of these factors as time progresses. Thirdly, an integrated method for forecasting is put forward, prioritizing external factors, which demonstrates higher predictive accuracy both in-sample and out-of-sample compared to conventional models and those without factor optimization.
The structure of this paper is as follows. Section 2 provides a literature review; Section 3 introduces the data and methodology; Section 4 compares the prediction results; and the Section 5 presents the conclusions.
2 Literature review
The study of bond return prediction has gone through two phases, from theoretical constructs to empirical analysis. Pioneering work by Fama and French in 1993 identified five integral factors influencing bond return: overarching market elements, firm size, book-to-market ratio, time to maturity, and default risk (Fama and French, 1993). This viewpoint was later confirmed by the research of Gebhardt and Hvidkjaer, 2005, concluded that the bond return has the highest correlation with the probability of default after controlling for bond duration, credit rating, and maturity. Scholars then progressively turned their attention to the impact of the characteristics of the bonds themselves and macroeconomic trends on their returns. Pham and Huynh (2020) found that investor attention can influence green bond yields and volatility, and however, the relationship is time-varying and stronger in the short run. Baker et al. (2003) found that macroeconomic variables—such as inflation rates, actual short-term interest rates, and the term structure—could be used to predict corporate bond returns. Cochrane and Piazzesi, 2005 found that the inclusion of macro-forecasting factors does not significantly improve the predictive capability of bond returns. Bali et al. (2021) employed economic uncertainty as a state variable, delving into the pricing of bond risk and found that economic uncertainty and policy uncertainty strongly correlated with corporate bond returns. In addition to the macroeconomic indicators mentioned above, geopolitical risks and economic policy uncertainty are emerging as significant factors affecting green claims in these turbulent times (Broadstock and Cheng, 2019), Kang et al. (2014), Marques et al. (2018) and Reboredo and Ugolini (2020) reported that net price volatility in the European and United States green bond markets is primarily due to uncertainty in the equity and oil markets and that uncertainty contributes to a large extent to net price volatility shocks in the green bond markets in Europe and the United States. Tian et al.’s study in 2022 also suggests that, in addition to equity market volatility and oil volatility, climate policy uncertainty and geopolitical risks have all contributed to the heterogeneous behavior of green bond markets in the United States, Europe and China. However, no conclusive evidence exists that the green bond market is robust regarding the bond issuance.
Although research specifically focusing on the prediction of green bond yield remains relatively scarce, a series of studies have already identified correlations between green bond and other market, and related external factors (Abakah et al., 2023; Ejaz et al., 2022; Su et al., 2023; Naeem et al., 2021). Wei et al. (2023) observed positive effects of both supply-driven and demand-driven oil shocks on the green bond market. Rehman et al. (2023) found that oil shocks are reliable predictors for green bond indices, but the predictive power of oil shocks declined during the crisis period. Kocaarslan and Soytas (2023) found that compared to the impact of the conventional bond market, the stock and energy commodity markets have a more significant impact on the United States municipal green bonds. Tian et al. (2022) showed that the green bond markets in the United States, Europe and China exhibit heterogeneity facing uncertainties including climate policy uncertainty. Bouri et al. (2023) examined the directional predictability from two climate risk measures, transition risk and physical risk, to the return of global green bonds, and found that the predictability results are more pronounced for transition risk than physical risk. On account of that, some researches also studied how uncertainty indexes affect green bond yields (e.g., Le et al., 2021; Piñeiro-Chousa et al., 2021; Hussain et al., 2022; Pham and Nguyen, 2022). For example, Pham and Nguyen (2022) used a time-varying and state-dependent approach to analyse the relationship between stock market uncertainty, oil price uncertainty and green bonds, finding that the degree of connectedness between uncertainties and green bonds increases during the high uncertainty periods.
On the basis of existing research, this paper takes full account of the characteristics of green bond when forecasting the return. In addition to the return of Treasury bond and stock market, which are commonly used in traditional bond forecasting, this paper also takes the factors of crude oil market and natural gas market, as well as climate risk concerns and climate policy uncertainty as prediction variables. At the same time, in terms of prediction algorithms, this paper not only adopts the decomposition integrated prediction methodology that has been proven to have good prediction performance, but also adds the step of selecting the best component prediction model based on traditional method, further improving the prediction performance of the methodology.
3 Data and methodology
3.1 Data
The ChinaBond Green Bond Full Price Index (CGBI) is chosen to represent Chinese green bond market, utilizing daily trading data from 3 January 2017, to 30 June 2023, comprising 1,625 daily data samples. The data are sourced from the ChinaBond database. Figure 1 illustrates the trend of China’s Green Bond Index and its logarithmic returns within the sample period, revealing a general upward trajectory since 2017, punctuated by brief declines in November 2017 June 2020, and November 2022. On 17 November 2017, the introduction of new asset management regulations led to significant market volatility due to divergent interpretations of the policy, impacting the bond market and causing a dip in the green bond price index. In June 2020, expectations of new monetary policy tools replacing traditional ones and an intensified fiscal policy led to an adjustment phase in the bond market, with the green bond price index trending downwards alongside the general market. On 14 November 2022, the Central Clearing Company issued the “Corporate Standard of Green Bond Environmental Benefit Information Disclosure Indicator System,” which standardized the disclosure of information related to green bonds. However, it also raised certain questions about the existing “greenwashing” or “light green” practices in the market, leading to a downturn in the overall trend of the green bond index. Historical fluctuations in the logarithmic returns indicate a gradual narrowing of volatility, with certain clustering phenomena evident.
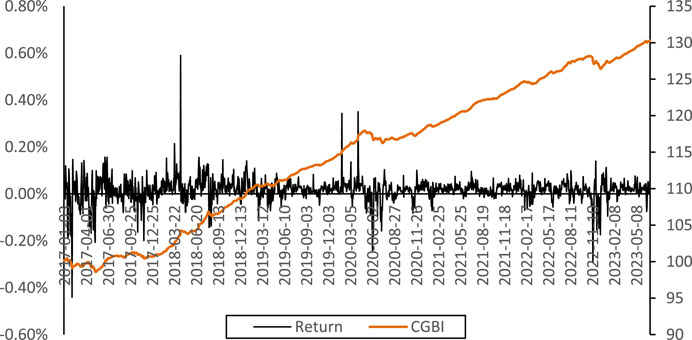
FIGURE 1. Trend of China’s green bond market.
China’s green bond return has strong autocorrelation. Therefore, it is essential to include its own historical data for prediction. In addition, it is evident that the return may also display significant periodicity and trend, while the disturbance term often experiences substantial jumps. These characteristics may be caused by exogenous policy changes or other influencing factors. Therefore, based on the analysis of the influencing factors of general bond and green bond returns, as well as considering the frequency and availability of data, external variables for predicting green bond return are selected as shown in Table 1. Among them, the 10-year Treasury bond return represented by Treasury to some extent reflects the overall risk-free interest rate level of the money market. Stock represents the return of important alternative assets OIL and GAS represent the price fluctuations of traditional energy sources. Given that a large amount of green bond raised funds are invested in the new energy sector, the price fluctuations of traditional energy sources can transmit to the new energy sector, thereby influencing the return of green bond.
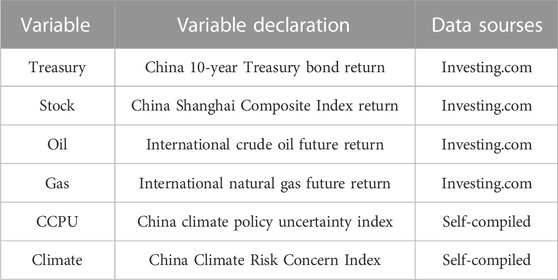
TABLE 1. Selection of exogenous variables.
CCPU and Climate are two variables that indirectly reflect climate risk. CCPU represents the uncertainty of China’s climate policy, derived from daily news text data obtained from the WiseNews database, including “People’s Daily,” “Guangming Daily,” “Economic Daily,” and “Xinhua Daily Telegraph.” The term sets for “climate,” “policy,” “uncertainty” are created and the frequency time series of climate policy uncertainty news are calculated by dividing the number of climate policy news articles by the total number of published articles, yielding the climate policy uncertainty index (Ma et al., 2023). Climate represents investors’ attention to climate risks, measured using the Baidu search index with keywords including “climate change,” “climate risk” and so on (Guo et al., 2023).
Based on the availability range of the exogenous variables listed in Table 1 (some data are only processed up to the end of 2022), data from 3 January 2017, to 31 November 2022, was selected as the training set for modeling, while the remaining data was utilized for out-of-sample testing. The trends of each indicator, as shown in Figure 2, reveal that compared to the logarithmic returns of green bonds, the volatility of crude oil prices (OIL) and climate risk attention (Climate) is more pronounced and significantly greater than the other exogenous indicators.
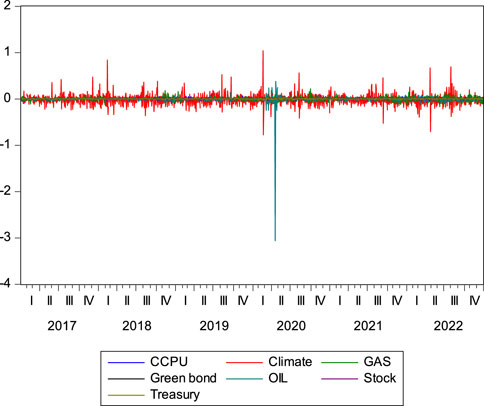
FIGURE 2. Trend of variables.
CCPU and Climate are two variables that indirectly reflect climate risk. CCPU represents the uncertainty of China’s climate policy, derived from daily news text data obtained from the WiseNews database, including “People’s Daily,” “Guangming Daily,” “Economic Daily,” and “Xinhua Daily Telegraph.” The term sets for “climate,” “policy,” “uncertainty” are created and the frequency time series of climate policy uncertainty news are calculated by dividing the number of climate policy news articles by the total number of published articles, yielding the climate policy uncertainty index (Ma et al., 2023). Climate represents investors’ attention to climate risks, measured using the Baidu search index with keywords including “climate change,” “climate risk” and so on (Guo et al., 2023).
Descriptive statistics results shown in Table 2 indicate that within the sample period, the average daily return of green bonds is positive at 0.0159%, second only to the daily return rate of natural gas prices at 0.0709%, and higher than the average daily returns of other asset prices such as the 10-year Treasury, Shanghai Stock Exchange Index, and crude oil prices. From the perspective of volatility, the Climate index exhibits the most significant fluctuations, followed by the return of oil. Among all variables, the standard deviation of green bond returns is the smallest at 0.000509, which is not only lower than oil, natural gas, and the stock market but also significantly lower than the volatility of the 10-year Treasury. This is also why many recent studies consider green bonds as an important new type of hedge asset (Guo and Zhou, 2021).
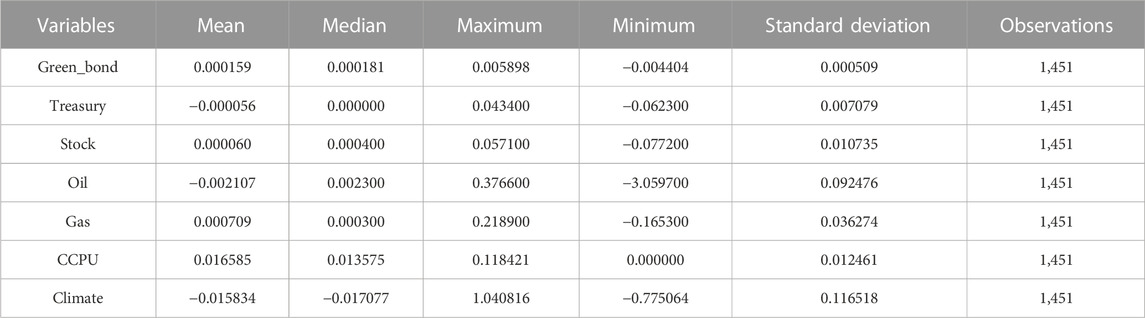
TABLE 2. Descriptive statistics.
The results of the correlation analysis are presented in Table 3. It can be observed that the correlation between green bond and 10-year Treasury bond is the highest, and significant at the 1% level, with a correlation coefficient of −0.457. When the risk-free interest rate rises, the discount rate also increases, leading to a decrease in bond prices. Additionally, the correlation coefficient between green bonds and the stock market is also significant at the 5% level, at −0.057, reflecting the substitution effect as discussed earlier. The returns of crude oil, natural gas prices, and climate policy uncertainty are not significantly correlated with the green bond return. Climate risk concern exhibits a positive correlation with the green bond return at the 10% significance level, with a correlation coefficient of 0.043. This implies that an increase in market concern regarding climate risk will to some extent enhance investors’ sustainable investment ideals and strengthen the expected returns of climate investment and financing products in some degree.
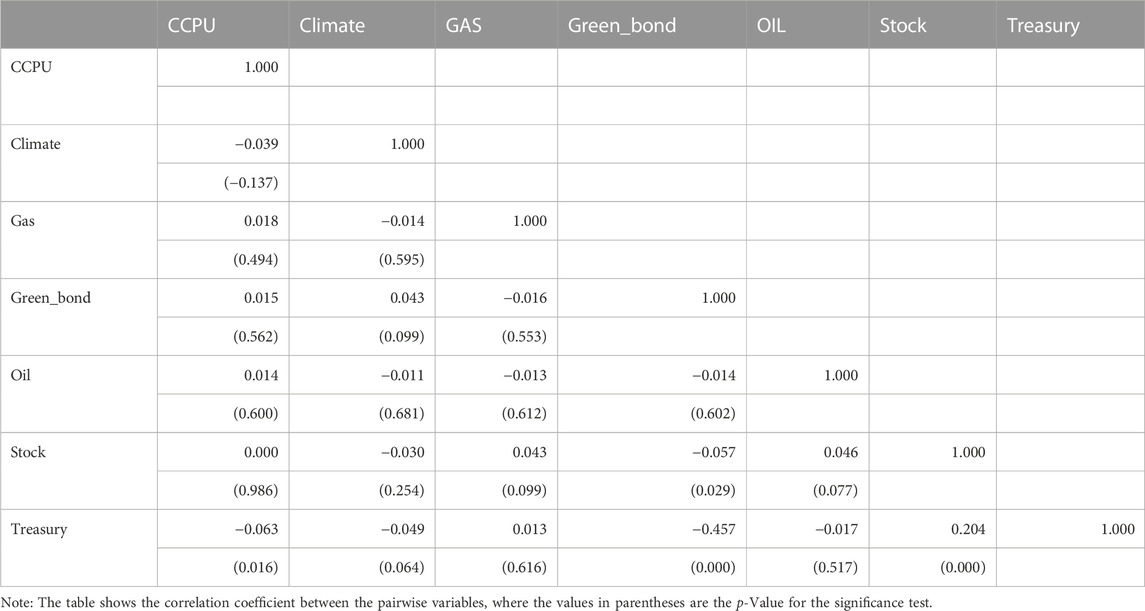
TABLE 3. Correlation analysis.
Before time series modeling, all data are guaranteed to be stable. Therefore, the ADF test is performed on all the above variables. The results are shown in Table 4, and all the time series are stable.
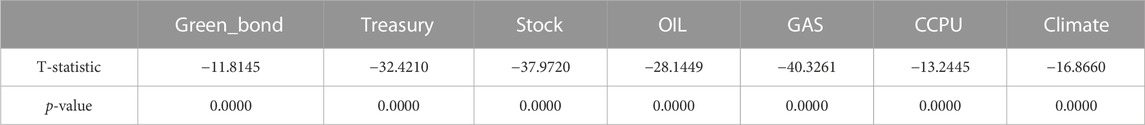
TABLE 4. ADF stationarity test.
3.2 Methodology
3.2.1 Basic LSTM model
LSTM (Long-Short-Term Memory) is a special recurrent neural network model, first proposed by Hochreiter and Schmidhuber (1997), which can overcome the gradient problems and gradient explosion problems in simple RNN, but also has high operational efficiency. It is widely used in the prediction research of financial market (Huang et al., 2021). As a special RNN, the mathematical principle of LSTM is similar. During the forward traversal of the LSTM, a memory block is calculated as follows:
The
where
Input
where
Memory cell state
Output
where the Logistic function
The
The calculation formula for the Logistic function
In order to test the predictive performance of different influencing factors, in terms of model setting, for the logarithmic return of green bonds. Initially, a prediction model is trained without the inclusion of exogenous variables (Model 1). Subsequently, various types of exogenous variables are individually integrated, which affect the green bond return to examine whether the in-sample fitting and out-of-sample prediction performance are improved. The model input variables are as follows:
Model 1. Return of green bond itself in the first 5 days (no exogenous variables);
Model 2. Return of green bond itself, Treasury, Stock in the first 5 days;
Model 3. Return of green bonds themselves, OIL, GAS in the first 5 days;
Model 4. Return of green bond itself, CCPU, Climate in the first 5 days;
Model 5. Return of green bond itself, Treasury, Stock, OIL, GAS, CCPU, Climate in the first 5 day.
3.2.2 Optimal decomposition integrated model
In addition to directly modeling the original green bond return for prediction, the components obtained from the CEEMDAN decomposition reconstruction are utilized, namely, the trend term, low-frequency component, and high-frequency component (Cao et al., 2019).
For the sequence decomposition method, Empirical Mode Decomposition (EMD) method can decompose time series data into intrinsic mode functions (IMFs). Further, the ensemble EMD (EEMD) method enhances the decomposition accuracy by introducing white noise, and the complete EEMD (CEEMD) further reduces the computational complexity and alleviates mode mixing effects through the addition of specific Gaussian white noise. The CEEMDAN algorithm then enhances convergence and provides precise and efficient data decomposition for various applications in signal processing and finance. It overcomes the limitations of the EMD method, enabling better capture of data’s fluctuation characteristics and revelation of the original data’s dynamic behavior at different time scales (Cao et al., 2019).
For the simple decomposition integrated model, using the optimal input variable combination from the modeling process of the original sequence. Prediction models are constructed for each of the three components, conducting in-sample fitting and out-of-sample prediction. As the decomposition reconstruction based on CEEMDAN satisfies additivity, it is possible to combine the fit or prediction values of the three components.
However, the simple decomposition integrated prediction does not select the optimal model based on its features for each component’s prediction. Therefore, this paper proposed an optimal decomposition integrated methodology, which adds the process of model selection to the prediction of each component. For each component, different combinations of input variables are attempted to be added, respectively, and the optimal input variables and model form are determined based on their prediction effects in and out of the sample. This approach can not only improve the prediction performance, but also fully explore the different fluctuation characteristics and key influencing factors of components at different time scales.
4 Empirical results
4.1 Multi-time scale characteristics of green bond return
The CEEMDAN decomposition results of the logarithmic return of the green bond price index are shown in Figure 3. It can be found that the green bond return fluctuates violently and can be decomposed into eight IMFs and a residual sequence. The residual sequence shows that the logarithmic return of green bond had a downward trend. IMF5 to IMF8 reflects the large cycle of green bond return, while IMF1 to IMF4 reflect short-term or high-frequency fluctuations.
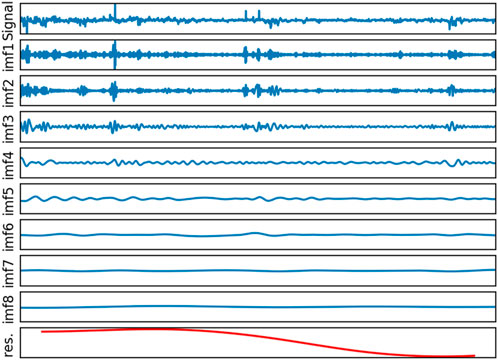
FIGURE 3. CEEMDAN decomposition of China’s green bond returns.
In order to clearly examine the characteristics at different time scales, the decomposed IMF is further reconstructed based on the frequency similarity. The high-frequency component is obtained by summing IMF1 to IMF4, and the low-frequency component is obtained by merging IMF5 to IMF8. The residual term is the trend term, as shown in Figure 4. It can be found that the trend item shows a downward trend, but remains in a relatively stable state after entering 2023. The low-frequency component has certain periodic fluctuation characteristics, while the high-frequency component has the largest correlation coefficient with the original series, showing more frequent fluctuations and significant volatility aggregation.
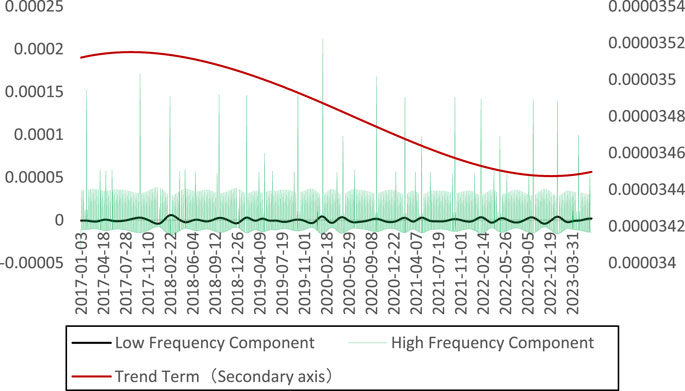
FIGURE 4. Reconstruction of China’s green bond returns.
4.2 Comparison of prediction models
In order to discuss the prediction effects of different models, the RMSE and MAE of each model are compared. RMSE is the root mean square error of the model, and MAE is the mean absolute error of the model. The calculation formulas are as shown in Formula 14 and Formula 15 respectively. The smaller the RMSE and MAE, the better model performs.
The in-sample and out-of-sample results of the single models, the simple decomposition ensemble models and our optimal decomposition integrated model are all shown in Table 5. It can be found that our new optimal decomposition integrated model has the best comprehensive in-sample and out-of-sample prediction performance.
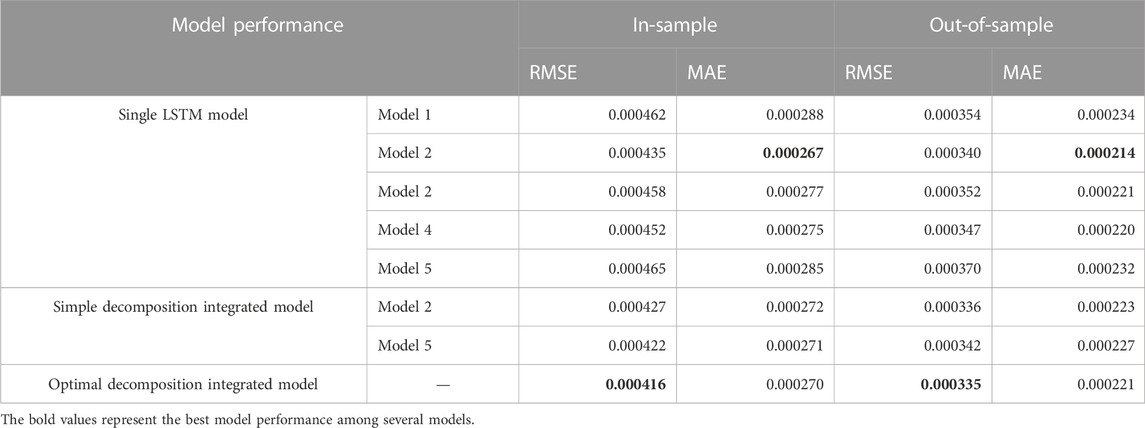
TABLE 5. Comparison of model prediction results.
Specifically, the in-sample and out-of-sample prediction effects of the five single LSTM models show that Model 2 has the best overall performance, that is, the Treasury bond return and the stock market return, that have an alternative effect on green bond, have a greater role in improving the prediction effect (compared with model 1). Followed by Model 3 and Model 4, that is, adding energy market returns and climate risks factors, respectively, will also improve the prediction effect, but when all factors are used as input variables (Model 5), the prediction effect has declined due to the over-fitting phenomenon.
For the simple decomposition integrated model, input variables setting of Model 2 and Model 5 are still selected for prediction of each component at different time scales. It can be found that the out-of-sample prediction effect has not improved. It is because that despite considering the green bond return at different time scales, but the same input variables are still used for each component.
The optimal decomposition integrated model performs model optimization for each component at different time scales. The selection of the optimal input for each component is shown in Table 6. It can be found that for the trend term, the crude oil return and natural gas return are included. The energy markets will play a key role in the long-term trend of green bond return. For the low-frequency component, it can be seen that model 5, which incorporates all exogenous variables is optimal. That is, for low-frequency cyclical fluctuations, other asset returns, energy markets, and climate risks will all have a significant impact. For high-frequency components, similar to the results of the single models, Model 2, which incorporates alternative assets has the best prediction effect. This is also because the high-frequency component has the highest correlation with the original series.
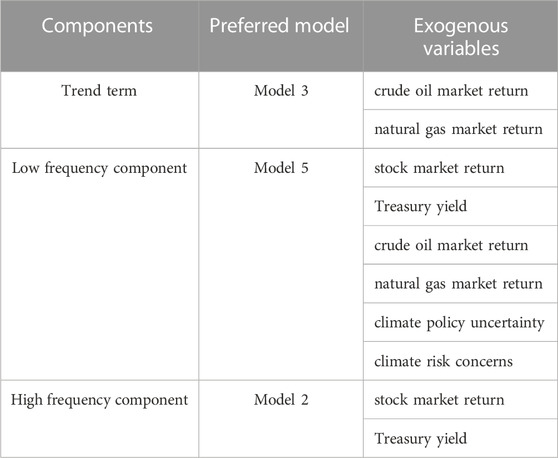
TABLE 6. Model selection results at different time scales.
The prediction effects of the three components and the original series based on our new optimal decomposition ensemble model are shown in Figure 5. The in-sample and out-of-sample performance of the model is relatively good, better than other models. Because it can not only capture the impact of changes in low-frequency and trend impact, but also fit the fluctuations of high-frequency items to the greatest extent, it can better fit changes in green bond return, except for extreme outliers. Furthermore, the optimal decomposition integrated model, which considers the influencing factors of different components, performs differential modeling on the decomposed components, making the model perform better and be more robust.
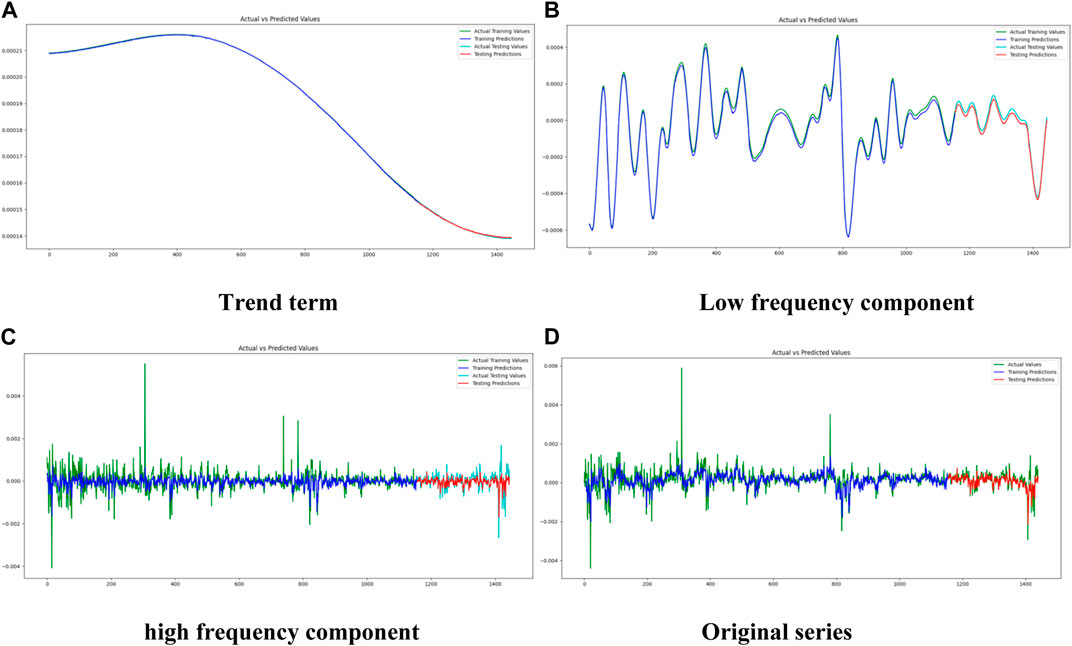
FIGURE 5. In-sample and out-sample prediction. (A) Trend term, (B) Low frequency component, (C) high frequency component, (D) Original series.
4.3 Further discussion on carbon market
Carbon market is increasingly playing a vital role globally as economies grapple with the transition to a low-carbon future. The pricing of green bonds, theoretically, should also be influenced by the fluctuations in carbon market prices. To empirically test this relationship, the returns of carbon price in both China’s national carbon emissions trading market and EU carbon futures market are used. Given that China’s national carbon market was established on 16 July 2021, we used the value of zero to represent the return before its inception. The data is sourced from the Wind database.
Incorporating carbon markets into our model, it can be observed an enhancement in the performance of low-frequency predictions. Table 7 shows that the in-sample RMSE decreased from 0.000019 to 0.000008, and the in-sample MAE reduced from 0.000018 to 0.000006. While there was no significant change in the out-of-sample model performance. Consequently, returns of carbon price should be integrated as a variable when constructing the optimal decomposition integrated model. Table 8 shows that the in-sample forecast effectiveness improved, with the RMSE decreasing from 0.000427 to 0.000416 and the MAE from 0.000271 to 0.000270. The lack of improvement out-of-sample could potentially be attributed to the relatively short existence of the carbon market in China.
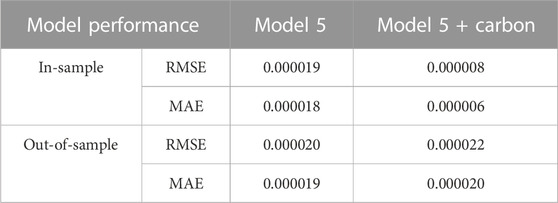
TABLE 7. Model performance for low-frequency component.
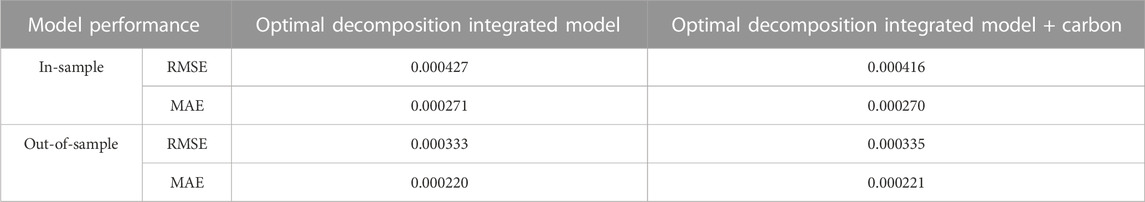
TABLE 8. Model performance for overall green bond price.
5 Conclusion
With the rapid development of green bond over the world, the scale of investment in green bonds is also increasing. It has become a new and important asset type for the asset allocation. Further, it is considered an emerging safe-haven asset that can maintain low volatility under extreme shocks. Therefore, the accurate prediction of green bond return has become an important research issue. However, although bond return prediction is a classic problem, and many scholars have analyzed the factors affecting green bond return, few scholars have built prediction models specifically for green bond return. Especially in the selection of input variables of the prediction model, only the factors that affect traditional bond return are basically chosen, the sustainable investment attribute of green bond is ignored. Therefore, based on existing research, we innovatively select alternative asset variables, energy market variables as well as climate risk variables for green bond return prediction. By employing a new optimal decomposition integrated model, it can also examine the prediction effects of various variables on the overall green bond return as well as components at different time scales. The results show that for the overall and high-frequency component of green bonds, the returns of other financial assets have high predictive ability. For the trend item, energy market variables have a high predictive ability. For low-frequency component, climate risk factors will have the effect of improving prediction accuracy. At the same time, the new optimal decomposition integrated model based on input variables selection constructed in this paper can achieve better prediction results than the single LSTM model and the simple decomposition integrated model.
The research is of great significance for understanding the characteristics of green bond return and their influencing factors at different time scales. At the same time, the optimal decomposition integrated prediction model proposed in this paper can also further use other variable selection methods to expand the methodology. In our further discussion about carbon markets, it can be found that the inclusion of carbon returns can substantially enhance in-sample forecasting performance. Yet, this enhancement does not translate to an improved out-of-sample forecast, which may be due to the relatively recent establishment of carbon market in China. Building on the use of only LSTM model, it could be further enhanced by integrating more algorithms to select the best single model for each component, further improve the prediction accuracy and provide a more effective quantitative tool for investment decision-making and risk management in related fields. This also represents a direction for future research.
Data availability statement
The original contributions presented in the study are included in the article/Supplementary Material, further inquiries can be directed to the corresponding author.
Author contributions
QN: Data curation, Formal Analysis, Investigation, Methodology, Writing–original draft. SC: Data curation, Formal Analysis, Methodology, Software, Validation, Writing–review and editing. YC: Conceptualization, Formal Analysis, Writing–review and editing. YH: Conceptualization, Investigation, Resources, Validation, Writing–review and editing.
Funding
The author(s) declare financial support was received for the research, authorship, and/or publication of this article. This research was funded by the University of Chinese Academy of Sciences, the Fundamental Research Funds for the Central Universities.
Conflict of interest
The authors declare that the research was conducted in the absence of any commercial or financial relationships that could be construed as a potential conflict of interest.
Publisher’s note
All claims expressed in this article are solely those of the authors and do not necessarily represent those of their affiliated organizations, or those of the publisher, the editors and the reviewers. Any product that may be evaluated in this article, or claim that may be made by its manufacturer, is not guaranteed or endorsed by the publisher.
References
Abakah, E. J. A., Tiwari, A. K., Adekoya, O. B., and Oteng-Abayie, E. F. (2023). An analysis of the time-varying causality and dynamic correlation between green bonds and US gas prices. Technol. Forecast. Soc. Change 186, 122134. doi:10.1016/j.techfore.2022.122134
Albagli, E., Ceballos, L., Claro, S., and Romero, D. (2019). Channels of US monetary policy spillovers to international bond markets. J. Financ. Econ. 134 (2), 447–473. doi:10.1016/j.jfineco.2019.04.007
Baker, M., Greenwood, R., and Wurgler, J. (2003). The maturity of debt issues and predictable variation in bond returns. J. Financ. Econ. 70 (2), 261–291. doi:10.1016/S0304-405X(03)00147-8
Bali, T. G., Subrahmanyam, A., and Wen, Q. (2021). The macroeconomic uncertainty premium in the corporate bond market. J. Financ. Quant. Anal. 56, 1653–1678. doi:10.1017/S0022109020000538
Bessembinder, H., Jacobsen, S., Maxwell, W., and Venkataraman, K. (2022). Overallocation and secondary market outcomes in corporate bond offerings. J. Financ. Econ. 146 (2), 444–474. doi:10.1016/j.jfineco.2022.08.001
Bouri, E., Rognone, L., Sokhanvar, A., and Wang, Z. (2023). From climate risk to the returns and volatility of energy assets and green bonds: a predictability analysis under various conditions. Technol. Forecast. Soc. Change 194, 122682. doi:10.1016/j.techfore.2023.122682
Broadstock, D. C., and Cheng, L. T. (2019). Time-varying relation between black and green bond price benchmarks: macroeconomic determinants for the first decade. Financ. Res. Lett. 29, 17–22. doi:10.1016/j.frl.2019.02.006
Cao, J., Li, Z., and Li, J. (2019). Financial time series forecasting model based on CEEMDAN and LSTM. Phys. A 519, 127–139. doi:10.1016/j.physa.2018.11.061
Cochrane, J. H., and Piazzesi, M. (2005). Bond risk premia. Am. Econ. Rev. 95 (1), 138–160. doi:10.1257/0002828053828581
Dieci, R., Schmitt, N., and Westerhoff, F. (2018). Interactions between stock, bond and housing markets. J. Econ. Dyn. Control 91, 43–70. doi:10.1016/j.jedc.2018.05.001
Duong, H. N., Kalev, P. S., and Tian, X. (2023). Short selling, divergence of opinion and volatility in the corporate bond market. J. Econ. Dyn. Control 147, 104592. doi:10.1016/j.jedc.2022.104592
Ejaz, R., Ashraf, S., Hassan, A., and Gupta, A. (2022). An empirical investigation of market risk, dependence structure, and portfolio management between green bonds and international financial markets. J. Clean. Prod. 365, 132666. doi:10.1016/j.jclepro.2022.132666
Fama, E., and French, K. (1993). Common risk factors in the returns on stocks and bonds. J. Financ. Econ. 33 (1), 3–56. doi:10.1016/0304-405X(93)90023-5
Gebhardt, W. R., Hvidkjaer, S., and Swaminathan, B. (2005). The cross sectional of expected corporate bond returns: betas or characteristics. J. Financ. Econ. 75, 85–114. doi:10.1016/j.jfineco.2004.04.002
Guo, D., and Zhou, P. (2021). Green bonds as hedging assets before and after COVID: a comparative study between the US and China. Energy Econ. 104, 105696. doi:10.1016/j.eneco.2021.105696
Guo, K., Li, Y., Zhang, Y., Ji, Q., and Zhao, W. (2023). How are climate risk shocks connected to agricultural markets? J. Commod. Mark. 32, 100367. doi:10.1016/j.jcomm.2023.100367
Hochreiter, S., and Schmidhuber, J. (1997). Long short-term memory. Neural. comput. 9 (8), 1735–1780. doi:10.1162/neco.1997.9.8.1735
Huang, Y., Gao, Y., Gan, Y., and Ye, M. (2021). A new financial data forecasting model using genetic algorithm and long short-term memory network. Neurocomputing 425, 207–218. doi:10.1016/j.neucom.2020.04.086
Hussain, J., Lee, C. C., and Chen, Y. (2022). Optimal green technology investment and emission reduction in emissions generating companies under the support of green bond and subsidy. Technol. Forecast. Soc. Change 183, 121952. doi:10.1016/j.techfore.2022.121952
Kang, W., Ratti, R. A., and Yoon, K. H. (2014). The impact of oil price shocks on US bond market returns. Energy Econ. 44, 248–258. doi:10.1016/j.eneco.2014.04.009
Kocaarslan, B., and Soytas, U. (2023). The role of major markets in predicting the U.S. municipal green bond market performance: new evidence from machine learning models. Technol. Forecast. Soc. Change 196, 122820. doi:10.1016/j.techfore.2023.122820
Le, T. L., Abakah, E. J. A., and Tiwari, A. K. (2021). Time and frequency domain connectedness and spill-over among fintech, green bonds and cryptocurrencies in the age of the fourth industrial revolution. Technol. Forecast. Soc. Change 162, 120382. doi:10.1016/j.techfore.2020.120382
Ma, D., Zhang, Y., Ji, Q., Zhao, W. L., and Zhai, P. (2023). Heterogeneous impacts of climate change news on China's financial markets. Int. Rev. Financ. Anal. 91, 103007. doi:10.1016/j.irfa.2023.103007
Marques, A. C., Fuinhas, J. A., and Pereira, D. A. (2018). Have fossil fuels been substituted by renewables? An empirical assessment for 10 European countries. Energy Policy 116, 257–265. doi:10.1016/j.enpol.2018.02.021
Naeem, M. A., Bouri, E., Costa, M. D., Naifar, N., and Shahzad, S. J. H. (2021). Energy markets and green bonds: a tail dependence analysis with time-varying optimal copulas and portfolio implications. Resour. Policy 74, 102418. doi:10.1016/j.resourpol.2021.102418
Peng, W., and Xiong, L. (2022). Managing financing costs and fostering green transition: the role of green financial policy in China. Econ. Anal. Policy 76, 820–836. doi:10.1016/j.eap.2022.09.014
Pham, L., and Huynh, T. L. D. (2020). How does investor attention influence the green bond market? Financ. Res. Lett. 35, 101533. doi:10.1016/j.frl.2020.101533
Pham, L., and Nguyen, C. P. (2022). How do stock, oil, and economic policy uncertainty influence the green bond market? Financ. Res. Lett. 45, 102128. doi:10.1016/j.frl.2021.102128
Piñeiro-Chousa, J., López-Cabarcos, M. Á., Caby, J., and Šević, A. (2021). The influence of investor sentiment on the green bond market. Technol. Forecast. Soc. Change 162, 120351. doi:10.1016/j.techfore.2020.120351
Reboredo, J. C., and Ugolini, A. (2020). Price connectedness between green bond and financial markets. Econ. Model 88, 25–38. doi:10.1016/j.econmod.2019.09.004
Rehman, M. U., Raheem, I. D., Zeitun, R., Vo, X. V., and Ahmad, N. (2023). Do oil shocks affect the green bond market? Energy Econ. 117, 106429. doi:10.1016/j.eneco.2022.106429
Su, Y. H., Rizvi, S. K. A., Umar, M., and Chang, H. (2023). Unveiling the relationship between oil and green bonds: spillover dynamics and implications. Energy Econ. 127, 107043. doi:10.1016/j.eneco.2023.107043
Tian, H., Long, S., and Li, Z. (2022). Asymmetric effects of climate policy uncertainty, infectious diseases-related uncertainty, crude oil volatility, and geopolitical risks on green bond prices. Financ. Res. Lett. 48, 103008. doi:10.1016/j.frl.2022.103008
Keywords: green bond, integrated prediction, LSTM, climate risk, energy market
Citation: Nie Q, Chen S, Chen Y and Hu Y (2023) Integrated prediction of green bond return under the dual risks of climate change and energy crisis. Front. Environ. Sci. 11:1336867. doi: 10.3389/fenvs.2023.1336867
Received: 11 November 2023; Accepted: 01 December 2023;
Published: 18 December 2023.
Edited by:
Qiang Ji, Chinese Academy of Sciences (CAS), ChinaReviewed by:
Daping Zhao, Capital University of Economics and Business, ChinaQuanying Lu, Beijing University of Technology, China
Copyright © 2023 Nie, Chen, Chen and Hu. This is an open-access article distributed under the terms of the Creative Commons Attribution License (CC BY). The use, distribution or reproduction in other forums is permitted, provided the original author(s) and the copyright owner(s) are credited and that the original publication in this journal is cited, in accordance with accepted academic practice. No use, distribution or reproduction is permitted which does not comply with these terms.
*Correspondence: Yiguo Hu, MTM4MDc0MDYzOTdAMTYzLmNvbQ==