 Kaifang Shi1
 Jing-Cheng Han
95% of researchers rate our articles as excellent or good
Learn more about the work of our research integrity team to safeguard the quality of each article we publish.
Find out more
ORIGINAL RESEARCH article
Front. Environ. Sci. , 05 January 2024
Sec. Freshwater Science
Volume 11 - 2023 | https://doi.org/10.3389/fenvs.2023.1335725
Lake Surface Water Temperature (LSWT) is essential for understanding and regulating various processes in lake ecosystems. Remote sensing for large-scale aquatic monitoring offers valuable insights, but its limitations call for a dynamic LSWT monitoring model. This study developed multiple machine learning models for LSWT retrieval of four representative freshwater lakes in the Yangtze River Basin using Himawari-8 (H8) remote sensing imagery and in-situ data. Based on the in situ monitoring dataset in Lake Chaohu, the dynamic LSWT retrieval models were effectively configured and validated to perform H8-based remote sensing inversion. The test results showed that six models provided satisfactory LSWT retrievals, with the Back Propagation (BP) neural network model achieving the highest accuracy with an R-squared (R2) value of 0.907, a Root Mean Square Error (RMSE) of 2.52°C, and a Mean Absolute Error (MAE) of 1.68°C. Furthermore, this model exhibited universality, performing well in other lakes within the Yangtze River Basin, including Taihu, Datonghu and Dongtinghu. The ability to derive robust LSWT estimates confirms the feasibility of real-time LSWT retrieval using synchronous satellites, offering a more efficient and accurate approach for LSWT monitoring in the Yangtze River Basin. Thus, this proposed model would serve as a valuable tool to support the implementation of more informed policies for aquatic environmental conservation and sustainable water resource management, addressing challenges such as climate change, water pollution, and ecosystem restoration.
Lake Surface Water Temperature (LSWT) refers to the temperature of the water surface within 0–1 m of a lake, and it is one of the key parameters for characterizing lake water temperature. LSWT plays a pivotal role in regulating physical, chemical, and biological processes, and is of paramount importance for the overall health of lake ecosystems (Sharma et al., 2015; Shi et al., 2021). The variation in LSWT is influenced by various factors, primarily by meteorological factors such as air temperature. In addition to significantly positive correlation with air temperature, LSWT was also found to be impacted by relative humidity, wind speed, and other factors, with higher humidity and stronger winds typically resulting in higher water temperatures (Sun et al., 2022). Furthermore, changes in LSWT have implications for various water quality parameters in lakes. In recent years, global warming has led to rising water temperatures, exacerbating lake eutrophication. As algal densities increase, intense photosynthesis processes deplete a significant amount of dissolved oxygen in the water, lowering carbon dioxide levels and increasing water pH. This, in turn, enhances the release of oxygen, elevating dissolved oxygen levels in the water (Yang et al., 2018).
In the context of global climate change, the elevated LSWT of lakes has become an imperative issue for sustainable development. According to satellite observations, warm season water temperatures in lakes have increased at a rate of 0.24°C ± 0.01°C per decade between 1995 and 2021 (Blunden, 2022). This trend is not only a potential threat to lake ecosystems, but also has implications for sustainability in several areas. First, lake ecosystems are directly impacted by rising water temperatures, and the elevated LSWT may lead to loss of habitat for aquatic organisms, potentially triggering ecological disasters (Till et al., 2019). Second, lakes are an important source of drinking water supply, especially in China, occupying 40.6% of the drinking water supply (Zhang et al., 2022). Elevated water temperatures in lakes may affect water quality, increase water treatment costs, and pose a threat to drinking water safety. Therefore, safeguarding the water quality and ecological health of lakes is crucial. Thus, an in-depth study of LSWT trends and future predictions are essential for the sustainable development of lake ecosystems.
The traditional methods for monitoring water temperature primarily involve in-situ observations, which can provide the most authentic reflection of the lake’s condition. However, this method can only obtain data at specific points within the lake and requires significant human and material resources for installing temperature sensors at various locations. With continuous advancements in satellite thermal infrared sensors in terms of spatial resolution and radiometric precision, thermal infrared remote sensing technology has been increasingly employed to obtain spatially continuous water temperature data, and it has been used for the retrieval of water temperatures in large bodies of water such as oceans and lakes. Compared to traditional monitoring methods, thermal infrared remote sensing technology offers significant advantages in acquiring water temperature data. Firstly, it is a non-contact method, which avoids interference with the distribution of water temperature. Secondly, thermal infrared remote sensing provides high spatial and temporal resolution data, making it suitable for widespread aquatic environment monitoring, including large lakes, rivers, and oceans. Thirdly, various remote sensing platforms such as satellites and unmanned aerial vehicles can offer extensive coverage, including remote areas (Torgersen et al., 2001).
In previous studies, polar-orbiting remote sensing satellites were commonly used, but they had lower revisit frequencies at the same location. For example, MODIS had a revisit period of 1 day (Liu et al., 2015), while Landsat-8 had a revisit period of up to 16 days (Shi et al., 2022). Note that it generally required several years of data accumulation to establish effective retrieval models. In contrast, the synchronous satellite Sunflower-8 (Himawari-8, H8), with a temporal resolution of 10 min/time and a spatial resolution of 2 km, is one of the most advanced meteorological satellites to the authors’ knowledge. Kurihara et al. (2016) developed a quasi-physical algorithm to calculate the sea surface temperature (SST) by using the H8 data, and the root-mean-square (RMS) difference compared with the measured data was about 0.59 K, and the deviation was about 0.16 K. Yamamoto and Ishikawa (2018) developed a nonlinear three-band algorithm (NTB) to estimate land surface temperature (LST) using H8 data, and the algorithm was evaluated using in-situ data from the Tibetan Plateau, confirming its effectiveness. Therefore, the estimation of LSWT using H8 data would be potential alternative for near real-time retrieval.
At present, the mainstream thermal infrared remote sensing techniques for water temperature retrieval include single-channel universal algorithms, radiative transfer modeling, single-window algorithms, and machine learning methods, etc. Using HJ-1B/IRS thermal infrared data, Gong et al. (2016) compared the accuracy of single-channel universal algorithms, radiative transfer modeling, and single-window algorithms in retrieving water temperature in the Lake Taihu. Their results showed that the single-channel universal algorithm tended to overestimate water temperature, while radiative transfer modeling and single-window algorithms would make underestimations. Based on Landsat series satellite data, Shi et al. (2021) developed atmospheric radiative transfer models to retrieve water surface temperatures at two characteristic stations, Ku Shoumiao and Ku Wei Cuntan in the Three Gorges Reservoir. They verified that using rectangular boxes resulted in lower errors compared to single-pixel methods.
As well known, traditional approaches require extensive prior knowledge and complex physical models when dealing with complex water temperature retrieval problems. In contrast, machine learning methods can automatically learn and extract features from data, reducing the reliance on complex physical models. Furthermore, machine learning methods can handle large-scale data, improving the efficiency and accuracy of retrieval. Jiang (2018) utilized MODIS remote sensing imagery data and buoy measurements to establish a deep learning retrieval model for sea surface temperature and achieved high accuracy, with the majority of results having retrieval errors of less than 1°C. Yang et al. (2018) constructed a hybrid water temperature prediction model using Support Vector Regression (SVR), Principal Component Analysis (PCA), and Back Propagation Artificial Neural Networks (BPANN), and found that LSWT is the fundamental factor affecting the occurrence of cyanobacteria.
Taking the potential of machine learning techniques and H8 satellite imagery to achieve near real time LSWT retrieval, thus, this study aims at developing robust learning models for high-frequency LSWT inversion to realize the wide-range continuous dynamic monitoring of LSWT, to improve the efficiency of water environment monitoring, to reduce the waste of resources, and to promote environmental protection and sustainable water resources management.
Launched and placed in orbit on 7 October 2014, the H8 satellite’s primary mission is to monitor and provide meteorological information in the Pacific region, including weather, climate and natural disaster monitoring. The H8 satellite is in a geosynchronous orbit, usually at an altitude of approximately 35,786 km above the equator. This position allows the satellite to continuously monitor the same area at a fixed angle synchronized with the speed of the Earth’s rotation, primarily covering the western Pacific region, including East Asia, Oceania and Australia. Himawari-8 takes pictures at a rate of every 10 min and updates regional pictures at a rate of every 2.5 min, indicating that the satellite provides real-time meteorological data at a high spatial and temporal resolution. Hence, the H8 would help to monitor rapid changes in the weather phenomena (Han et al., 2023). The channels of H8 are shown in Supplementary Table S1. In this paper, channels from 7 to 16 are used mainly for water temperature retrieval (Shi et al., 2023b).
Atmospheric corrections was employed for the H8 satellite using the Py6s model (Niu et al., 2019). Based on the findings of Chen et al. (2022), atmospheric correction is applied to the Remote Sensing Reflectance (Rrs) data for Solar Zenith Angles (SOZ) less than 60°, assuming them as valid data. According to Ge et al. (2018), all the image elements within the window are determined to be cloud image elements and considered as invalid data when Rrst’ ≥ 0.25 (Eq. 1), and otherwise, they are valid data.
In which,
The measured LSWT data for Lakes Chaohu, Taihu, Dongtinghu, and Datonghu were obtained from 2019 to 2021. The water quality station information for the acquired data is shown in Figure 1 and Supplementary Table S2.
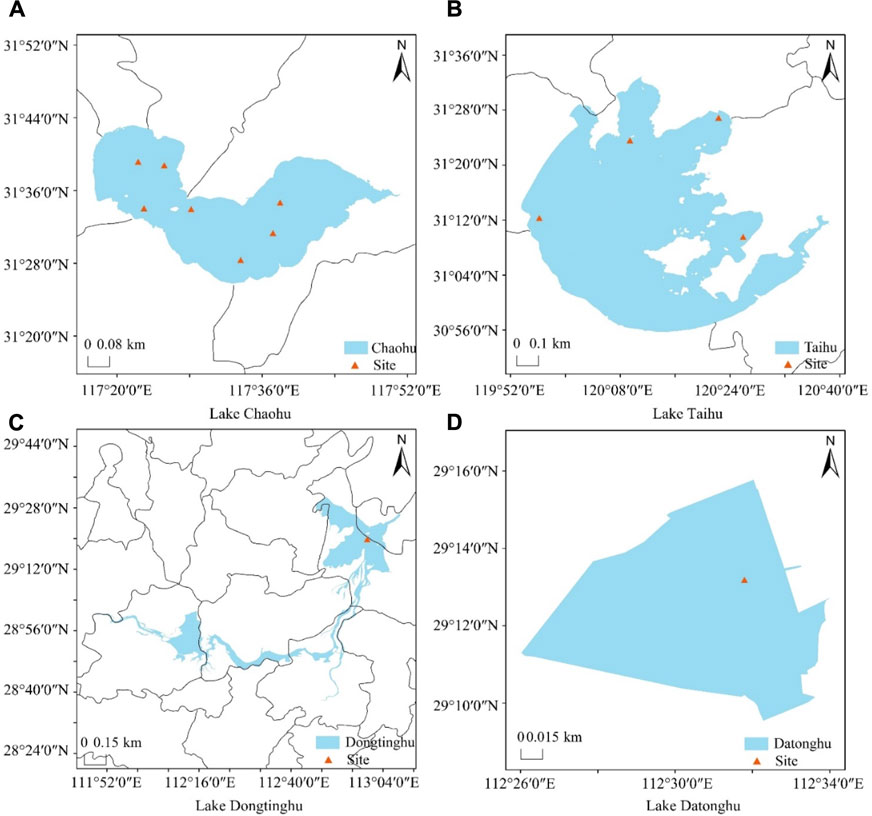
FIGURE 1. Geographical distribution of monitoring sections in various lakes: (A) Chaohu; (B) Taihu; (C) Dongtihu; (D) Datonghu.
Lake Chaohu, located in the central part of Anhui Province, China, is the fifth largest freshwater lake in China, with a total area of about 800 square kilometers and a depth of about 15 m at its deepest point. It is connected to the Yangtze River in its lower reaches and is an important part of the Yangtze River Basin. The outlet of Lake Chaohu is in Wuhu City, which is connected to the Yangtze River through the Qingyi River, which makes Lake Chaohu one of the most important lakes in the Yangtze River Basin. Due to long-term human activities and industrial development, the water quality of this lake was very poor (Shi et al., 2023b; Gao et al., 2023).
Lake Taihu is the third-largest freshwater lake in China, situated in the southern part of Jiangsu Province, at the heart of the Yangtze River Delta economic core area. It provides irrigation, domestic water supply, transportation, and other daily water needs for the surrounding population. Lake Taihu has an area of 2,427.8 km2, a water area of 2,338.11 km2, a total shoreline length of 393.2 km, an average depth of 1.9 m, and a maximum depth of 2.6 m. During the last decades, the region around Lake Tai has experienced serious pollution from urban and rural sources, frequent algal blooms, and is consistently in a state of mild eutrophication (Lyu et al., 2015; Shi et al., 2023a).
Lake Dongtinghu is the largest inland freshwater lake in Hunan Province, covering an area of 82.67 km2. It has an average depth of 2.5 m and a triangular shape, with dimensions of 15.75 km from east to west and 13.7 km from north to south. The lake boasts rich biological resources, and agriculture and fishing are relatively well-developed. However, since 2016, the water quality of Lake Dongtinghu has been classified as Grade V (the lowest class), characterized by mild eutrophication, serious deterioration of water quality, a fragile aquatic ecosystem, and a significant impact on the living environment of surrounding residents (Dai et al., 2022).
Lake Datonghu is the second-largest freshwater lake in China, covering an area of 2,579.2 km2. It has a total capacity of 22 billion m³ and receives water from the Yangtze River’s three inflows, the Songzi, Taiping, and Ouchi rivers in the north, and the Xiangjiang, Zijiang, Yuanjiang, and Lishui rivers in the south. It serves as an important flood storage and retention area and freshwater resource reservoir in the Yangtze River Basin. It has multiple functions, including biodiversity conservation and ensuring the water ecological security of the Yangtze River Basin (Zhu et al., 2023; Zhu et al., 2023).
Firstly, a spatiotemporal fusion of H8-corrected data and observed LSWT data from various section locations was conducted. The spatiotemporal monitoring frequency for remote sensing data is 10 min per observation, while water quality data is obtained every hour. To achieve spatiotemporal fusion of water quality and remote sensing data, the same latitude and longitude coordinates were used to merge the observed LSWT data at monitoring stations and the information from H8-derived channels and spectral indices. In terms of time, the image acquisition time of H8 was synchronized with the time of observed LSWT data, based on the lower-frequency monitoring rate of water quality data (1 h per observation), to ensure consistent temporal scales. To develop an LSWT inversion model suitable for the entire Yangtze River Basin, the study combined data from seven effective monitoring stations in Lake Chaohu. Given the abundance of Lake Chaohu data and its good data quality, Lake Chaohu was chosen as the training dataset, resulting in a total of 117, 779 valid data points (N = 117, 779). Stations data from Lakes Taihu, Dongtinghu, and Datonghu were used for validation, resulting in a total of 95, 349 valid data points (N = 95, 349). Due to the influence of H8 satellite spatial resolution and the location of water quality measurement stations, only these three lakes were selected for model validation. LSWT serves as the output data for the model, and to maximize the use of remote sensing data, this study used infrared bands 7–16 as the model’s input data. In machine learning, the proper division of a dataset can enhance training efficiency. Therefore, the Lake Chaohu water quality inversion dataset was divided, with 80% of the data randomly assigned for model training and 20% of the data used for model test. The training dataset was normalized before being used in the model.
In this study, a Back Propagation (BP) Neural Network model was configured and developed, and also, the other five machine learning algorithms were introduced for model comparisons, including the Multiple Linear Regression (MLR) (Hu et al., 2023), SVR (Wang et al., 2022), Random Forest (RF) (Liu et al., 2021), eXtreme Gradient Boosting tree (XGBoost) (Dai et al., 2022), and LightGBM. The same dataset splitting method was applied for all the algorithms, and the relative optimal hyperparameters for each model were selected using grid search (GridSearchCV).
BP neural network is an artificial neural network model used to solve various machine learning tasks. It consists of multiple neurons distributed across different layers, typically including input, hidden, and output layers. Neural networks compute the propagation of input data through the network using forward propagation. Each neuron receives inputs from the previous layer, performs a weighted summation, and then processes the result through an activation function, passing it to the next layer. Back Propagation is a crucial step in BP neural networks, as it uses gradient descent to adjust the weights and biases in the network to minimize the loss function. In summary, the BP neural network is a powerful machine learning model capable of learning complex nonlinear relationships. However, it also requires a substantial amount of training data and appropriate hyperparameter settings to achieve optimal performance. The BP neural network developed in this study has the following structure. The input layer consists of 10 neurons, corresponding to the 10 feature dimensions of the input data. Both the first and second hidden layers are composed of a linear layer (nn.Linear) with 128 and 64 neurons, respectively. Each hidden layer is followed by a Rectified Linear Unit (ReLU) activation function, which introduces nonlinearity to enable the network to learn complex data representations. The output layer contains a single neuron representing LSWT. For model optimization, Mean Squared Error Loss (MSELoss) was used as the optimization parameter (Eq. 2), and the Adaptive Moment Estimation (Adam) optimizer was employed for gradient descent.
Where
To comprehensively assess the model performance, this study employs three evaluation metrics: the coefficient of determination (R2), root mean square error (RMSE), and mean absolute error (MAE). R2 measures the degree of agreement between simulated values and observed values in a multivariable context. RMSE quantifies the deviation between model predictions and measurements, providing a direct measure of the dispersion between predicted and observed values. MAE indirectly assesses the model’s accuracy, with lower values indicating higher model accuracy. The formulas for calculating these evaluation metrics, their respective value ranges, and optimal values are shown in Supplementary Table S3.
In this study, six machine learning techniques were initially employed to construct retrieval models for Lake Chaohu using training data. Subsequently, we compared the model performance criteria on the test dataset to identify the most suitable model. The selected model was then applied to conduct LSWT retrieval for other lakes. By assessing the model’s performance through evaluation metrics, we analyzed and discussed its applicability for near real-time LSWT retrieval in the Yangtze River Basin.
The monthly average LSWT values presents an apparent seasonal change for the period from 2019 to 2021 (Supplementary Figure S1). Especially in the summer, the LSWT values are relatively higher than other seasons (Supplementary Figure S2). In addition, it is evident that the LSWT in the four lakes exhibits distinct temporal variations (Table 1). Regarding the four seasons in a year, we generated time series data from observations made during different seasons spanning the yeas 2019 to 2021, and subsequently, the Mann-Kendall (MK) test was applied to identify trend change. Based on the test results, the LSWT shows a significant decreasing trend (p < 0.01) in spring (March to May) and an increasing trend (p < 0.01) in autumn (September to November). Besides, LSWT is generally higher in summer (June to August) than in winter (December to February), with varying trends between different years, resulting in significant seasonal differences. The standard deviation of LSWT is higher in autumn, indicating larger variations, and lower in summer, suggesting less variability.
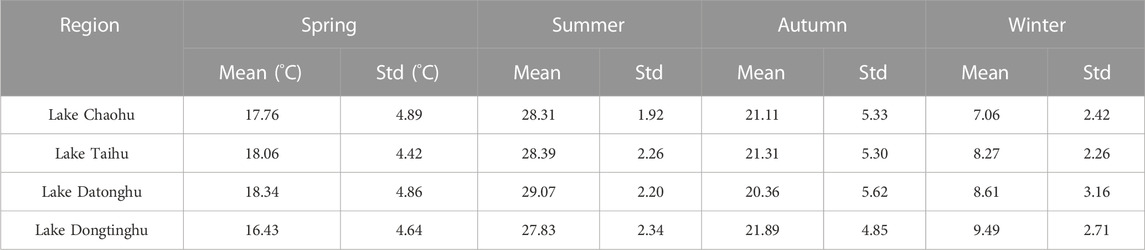
TABLE 1. Mean and standard deviation of LSWT for each geographic region and season.
In terms of spatial variations, as shown in Table 1, Lake Datonghu demonstrates a higher 3-year average LSWT value at 19.25°C, whereas Lake Chaohu records a slightly lower value at 18.49 °C. Specially, Lake Datonghu mainly exhibits elevated LSWT during the summer season (29.07°C ± 2.20°C), while Lake Chaohu primarily shows lower LSWT values in winter (7.06°C ± 2.42°C) (Supplementary Figures S1 and S2). However, the overall differences in LSWT among the four regions are not significant, with seasonal differences lower than 2°C.
Table 2 presents the Pearson correlation coefficients between each remotely sensed feature and the LSWT measurements. Note that ten bands from tbb_07 to tbb_16 were employed, and they correspond to the brightness temperature data from the 7th to 16th bands of Himawari-8 satellite data, respectively. From the table, it can be observed that tbb_07 and tbb_10–16 bands are significantly positively correlated with LSWT (p < 0.01), while tbb_08 and tbb_09 bands are significantly negatively correlated with LSWT (p < 0.01). The highest correlation with LSWT is found in tbb_07, followed by tbb_12 and tbb_13. Tbb_7 band refers to the seventh channel of the infrared radiance sensor on H8, typically used for measuring surface temperatures. Infrared radiance sensors can measure the infrared radiation emitted by objects, which are directly proportional to the temperature of the objects. Objects with higher temperatures emit more infrared radiation. Therefore, using the data from the infrared bands is feasible for LSWT inversion.
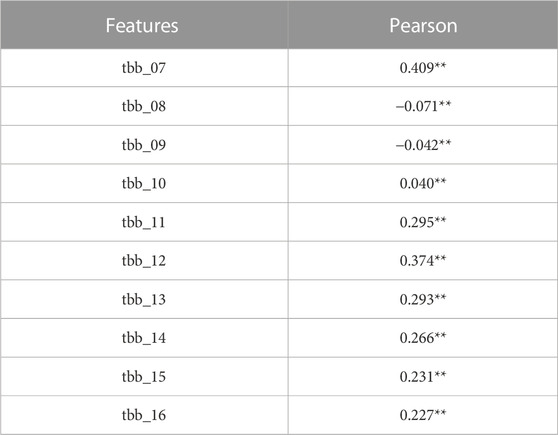
TABLE 2. Correlation between various remote sensing features and LSWT.
The models’ performance was assessed using the test set within the Lake Chaohu region. The input variables consisted of the remote sensing features listed in Table 3, and the output variable was the ground-truth data for LSWT. Table 3 presents a summary of the results for the six models, and Figure 2 provides a visual representation of these results. Note that all the models were run on the platform of Python 3.7, and model configurations as well as hyperparameters are given in Supplementary Table S5. Among these models, the BP model demonstrated the most exceptional performance in LSWT inversion, boasting an impressive R2 value of 0.907, along with notably low RMSE and MAE values of 2.522 °C and 1.682°C, respectively. These results underscore the BP model’s capability to accurately predict LSWT. The RF model with an R2 of 0.861, RMSE of 3.090°C, MAE of 1.972°C, along with XGBoost model, which achieved an R2 of 0.840, RMSE of 3.312°C, MAE of 2.289°C, also delivered commendable performance. Meanwhile, the LightGBM model exhibited moderate accuracy, achieving an R2 score of 0.835, coupled with relatively lower RMSE and MAE values. In contrast, the MLR and SVR models exhibited the least favorable predictive performance, as evidenced by their relatively low R2 scores of only 0.553 and 0.646, and higher RMSE and MAE values. Notably, the BP model outperformed all other models, showcasing a remarkable 21% increase in the average R2, a substantial 37% reduction in RMSE, and an impressive 42% reduction in MAE. These results highlight the superior performance of the BP model in the context of LSWT inversion.
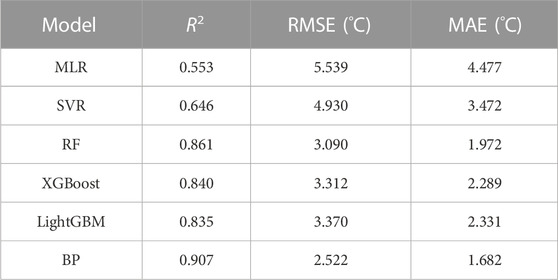
TABLE 3. Performance metrics for different algorithm models for Lake Chaohu.

FIGURE 2. Model performance of six machine learning algorithms for Lake Chaohu.
To develop an LSWT model suitable for the Yangtze River Basin, the well-trained BP neural model was further applied to Lakes Taihu, Datonghu, and Dongtinghu. The model results are shown in Figure 3, Figure 4 and Figure 5. As for Lake Taihu, the performance of the BP neural network model for the four sites combined had an R2 of 0.918, RMSE of 2.369°C, and MAE of 1.586°C. For Lake Datonghu, one site had an R2 of 0.858, RMSE of 3.079°C, and MAE of 2.096°C, and for Lake Dongtinghu, one site had an R2 of 0.864, RMSE of 2.937°C, and MAE of 2.189°C. The BP neural network model performed better in the Lake Taihu compared to the other two regions. This might be attributed to the consistent data quality as the Lake Taihu is closer to Chaohu. Lakes Datonghu and Dongtinghu have a relatively long distance from the Chaohu, resulting in a slightly lower model performance. However, all the three regions had R2 values above 0.85, indicating that this model is applicable to the entire Yangtze River Basin.
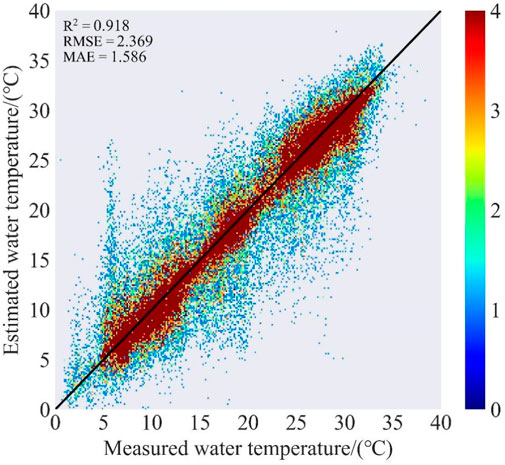
FIGURE 3. Comparison of estimated water temperature with observations in Lake Taihu.
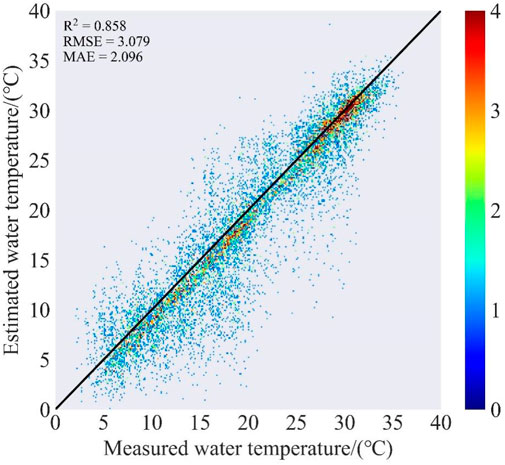
FIGURE 4. Comparison of estimated water temperature with observations in Lake Datonghu.
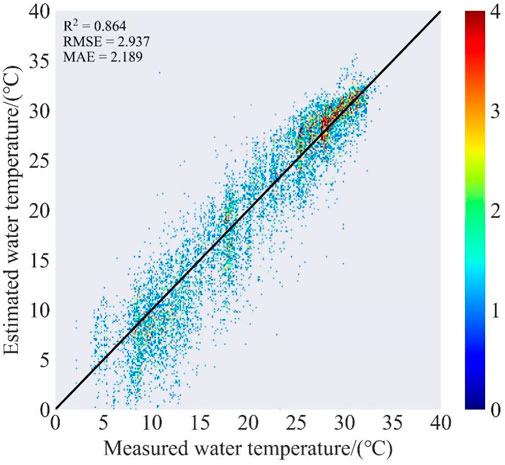
FIGURE 5. Comparison of estimated water temperature with observations in Lake Dongtinghu.
To evaluate the practical application of the model, this study employed H8 satellite image data captured on 16 May 2022. These images, along with the pre-trained BP neural network model, were utilized to conduct hourly retrievals of LSWT for the four designated study areas. Results for 9:00, 11:00, and 13:00 are presented in Figure 6, Figure 7, Figure 8, Figure 9. The model exhibited good performance, with LSWT increasing as time progressed in all four regions, and the temperature range remained between 10°C and 25°C. Furthermore, it can be observed from the figures that the model predicted relatively higher LSWT values in the coastal areas compared to the interior of the lakes. This phenomenon may be attributed to the fact that the lake’s coastal areas are more exposed to direct solar radiation, especially during daytime. This suggests that the water surfaces in coastal regions receive more solar energy absorption and, therefore, have higher temperatures. When sunlight penetrates the water surface, it is absorbed and scattered, leading to an increase in LSWT. Additionally, the shallow water areas near the lake’s coast are more susceptible to solar heat influence, as the same amount of solar energy is dispersed over a smaller water body, causing an increase in LSWT. In summary, the model demonstrated favorable performance in the Yangtze River Basin and is suitable for LSWT retrieval in lakes across the region.
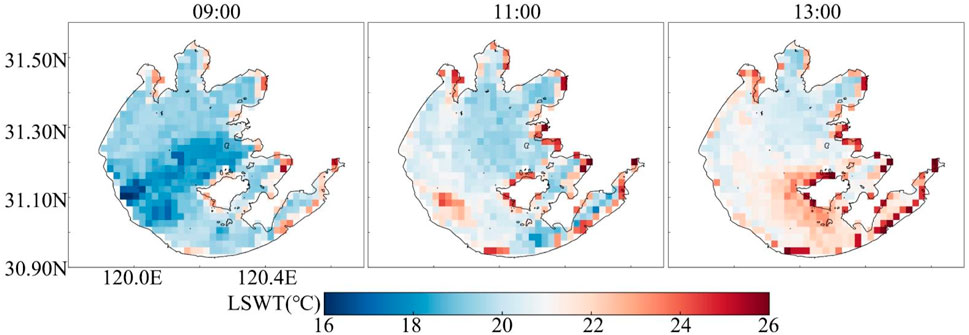
FIGURE 6. LSWT retrieval results for Lake Taihu.

FIGURE 7. LSWT retrieval results for Lake Chaohu.
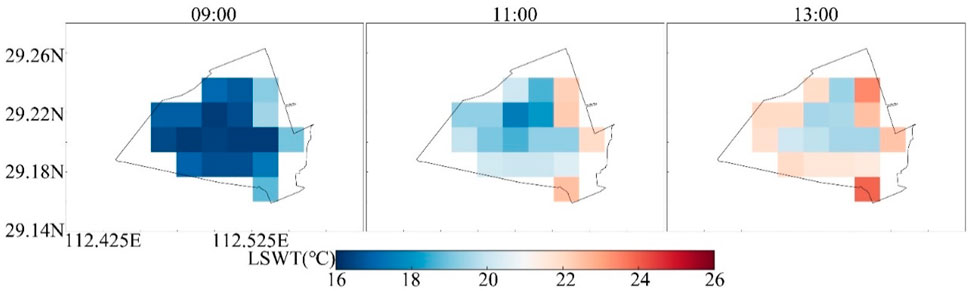
FIGURE 8. LSWT retrieval results for Lake Datonghu.
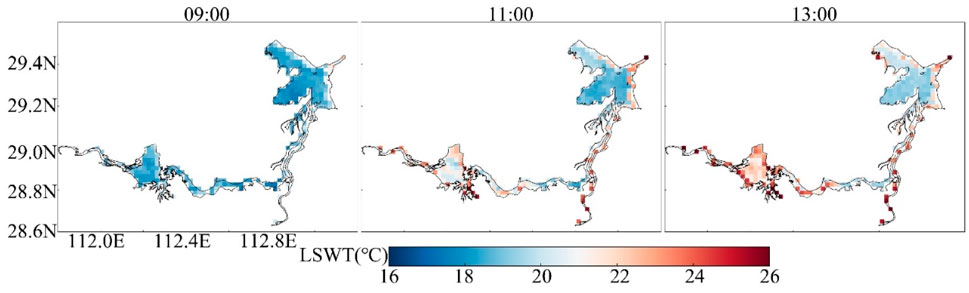
FIGURE 9. LSWT retrieval results for Lake Dongtinghu.
The results of this paper verified the operability of near real-time inversion of LSWT using synchronous satellites, which might provide a more efficient means of near real-time monitoring of LSWT in the Yangtze River Basin, and have a certain practical application potential for improving the efficiency and accuracy of water environment monitoring. However, the output results of the model developed in this paper have certain uncertainties associated with the actual values, which might be due to multiple reasons. On the one hand, the water quality parameters were collected from automatic monitoring stations, with relatively low spatial resolution of H8 satellite data (2 km). Also, there existed other interfering factors within the same remote sensing image, so it would be difficult to achieve the state of complete matching. On the other hand, the LSWT outputs from the LSWT inversion model were the average temperature values within the remotely sensed image element, which cannot accurately correspond to the temperature level measured at the automatic monitoring sites. The closer to the lakeshore area, the worse the inversion was under the influence of land proximity effect. Besides, automated monitoring sites might be affected by unforeseen events such as changes in the sensor environment, network failures, or the passage of fish from boats when making real water quality measurements. Last but not the least, remote sensing satellites are unable to monitor the vertical profile of the waters and there are large individual differences in the optical properties of different water bodies. All these factors would generate some deviations in water quality inversion and prediction.
The model exhibited a specific geographic applicability range. When applied to the Qinghai Lake area in Northwest China, as depicted in Figure 10, the performance (R2 < 0.6) is notably lower compared to its performance in the Yangtze River Basin. This discrepancy suggests that there would be variations in the accuracy when applying the model to regions with substantial differences in latitude and longitude.
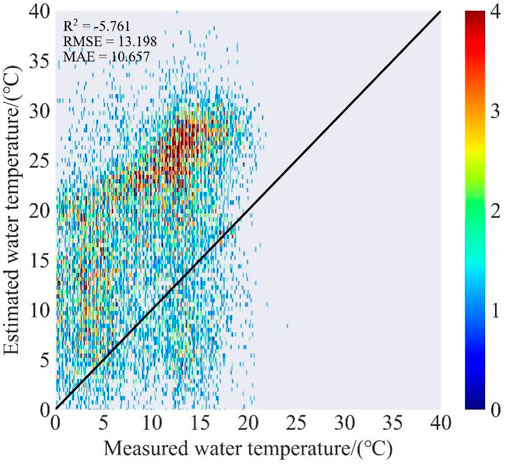
FIGURE 10. Model performance for Lake Qinghaihu.
Traditional models for estimating LSWT primarily rely on regression and numerical models (Torgersen et al., 2001). In contrast, this study introduced a novel LSWT estimation model based on machine learning algorithms, and the results demonstrated its high accuracy, minimal error, and superior performance. Another noteworthy aspect of this study would be the use of data from all the bright temperature bands of the H8 satellite, which allows for the comprehensive utilization of remote sensing bands, surpassing the capabilities of single-channel pervasive algorithms, radiative transfer modeling methods, and single-window algorithms. While the model’s accuracy may be slightly lower, it presents a valuable trade-off in terms of data utilization. Furthermore, the choice of the H8 satellite in this study, a synchronous satellite, provided a higher temporal resolution, with the ability to capture data at intervals as short as 10 min per survey. However, it is worth noting that the resulting outcomes were at the expense of lower spatial resolution, limiting its suitability for LSWT inversion in the context of larger lakes (Shi et al., 2022).
The model developed in this study was initially trained using retrieval data from Lake Chaohu area and subsequently tested on Lakes Taihu, Dongtinghu, and Datonghu. Given the potential presence of some degree of randomness in the model, an assessment of its generalization ability was conducted. To achieve this, data from all these lakes—Chaohu, Taihu, Dongtinghu, and Datonghu—were merged and combined. The dataset was then divided into a new training set (80%) and a testing set (20%). With consistent model parameters, the BP neural network model was retrained, and the results, as shown in Figure 11, reveal an R2 value of 0.902, a RMSE of 2.637°C, and a MAE of 1.761°C. These results indicate that the model trained with Chaohu data for validation is comparable to the model trained using the merged data, with the Chaohu-trained model exhibiting slightly better performance. Thus, this would suggest that the model trained with Chaohu data possesses a reasonable level of generality within the Yangtze River basin.
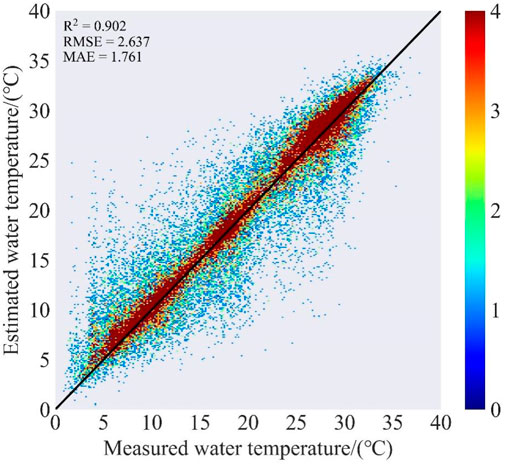
FIGURE 11. Combined fitting results for four lakes.
To evaluate the stability of the model structure, this study further conducted comparative experiments to assess the influence of different model configurations on the model performance. Three sets of comparative experiments were carried out, wherein the number of hidden layers in the BP neural network model was adjusted to 1 layer, 2 layers, and 3 layers while keeping other parameters constant. The impact on the model performance was analyzed through these comparative experiments. The parameters for the comparative experiments are detailed in Table 4.
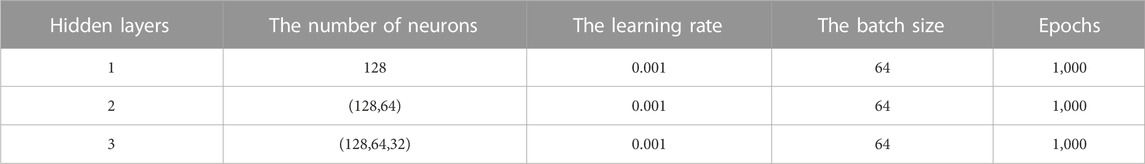
TABLE 4. Comparative experiment parameters.
The results, as presented in Supplementary Table S4, offer valuable insights. When the model was configured with only 1 hidden layer, it was relatively simple with fewer parameters. It tended to converge quickly during training but may encounter a performance bottleneck. This can lead to underfitting issues on the test set, making it challenging to capture intricate data features and ultimately resulting in lower accuracy. Conversely, when the model employed 3 hidden layers, it gained a higher level of model complexity and thus possesses a potent representation capability. This configuration has the potential to learn highly complex features during training. However, it is more prone to overfitting on the test set and requires additional data and regularization techniques to ensure stable training. It is worth mentioning that training deep neural networks with multiple hidden layers should demand more time and computational resources.
When the model had 2 hidden layers, it would achieve a balance between performance and complexity. It had relatively stronger representation capability compared to shallow neural networks and could better capture data features. It exhibited good performance on both the training and test sets. Therefore, this study chose the model structure with 2 hidden layers as it captured a balance between complexity and performance.
This study adopted a substantial historical dataset of LSWT measurements, integrated it with H8 satellite remote sensing data, and utilized a BP neural network model to achieve enhanced and more frequent monitoring of LSWT. This method conferred several advantages, including extensive coverage and swift monitoring, thereby offering an effective approach to enhance water environment monitoring capabilities. This is of particular significance in the context of safeguarding lake water quality. The principal conclusions derived from this study are outlined as follows.
(1) Based on H8 data and in-situ LSWT measurements, a machine learning approach was used to build an LSWT retrieval model suitable for the Yangtze River Basin. The results showed that all six models performed well in LSWT retrieval for the Yangtze River Basin. Among them, the BP neural network model outperformed other baseline models with an average performance increase of 21% in R2, a 37% reduction in RMSE, and a 42% decrease in MAE.
(2) The applicability of the BP neural network model in other areas of the Yangtze River Basin was verified. In Lake Taihu, the combined results from four sites yielded an impressive R2 of 0.918, a RMSE of 2.369°C, and a MAE of 1.586 °C when employing the BP neural network model. For a single site in Lake Datonghu, the model achieved an R2 of 0.858, a RMSE of 3.079°C, and a MAE of 2.096 °C. In the case of a single site in Lake Dongtinghu, the model exhibited a performance with an R2 of 0.864, a RMSE of 2.937°C, and a MAE of 2.189°C. These results strongly indicated that the trained BP neural network model would be also applicable and effective in other areas within the Yangtze River Basin.
The data analyzed in this study is subject to the following licenses/restrictions: The datasets analyzed for this study are available on request from the corresponding author. The data are not publicly available due to the continuation of a follow-up study by the authors. Requests to access these datasets should be directed to hanjc@szu.edu.cn.
KS: Conceptualization, Formal Analysis, Funding acquisition, Methodology, Validation, Writing–original draft. J-CH: Formal Analysis, Supervision, Writing–review and editing. PW: Methodology, Writing–original draft.
The author(s) declare financial support was received for the research, authorship, and/or publication of this article. This research was funded by the China National Key R&D Program (No. 2022YFC3201803), Demonstration Zone Construction Project for Carbon Peak and Carbon Neutrality in Qinghai Province (No. 2021-SF-A7-1-3), National Natural Science Foundation of China (No. 52109092), Chinese Polar Environment Comprehensive Investigation and Assessment Program (No. 2021YFC310170504), fundamental Research Funds of the Shenzhen Science and Technology Innovation Committee (No. 20220807162217001) and Shenzhen University Talent Fund.
The authors declare that the research was conducted in the absence of any commercial or financial relationships that could be construed as a potential conflict of interest.
All claims expressed in this article are solely those of the authors and do not necessarily represent those of their affiliated organizations, or those of the publisher, the editors and the reviewers. Any product that may be evaluated in this article, or claim that may be made by its manufacturer, is not guaranteed or endorsed by the publisher.
The Supplementary Material for this article can be found online at: https://www.frontiersin.org/articles/10.3389/fenvs.2023.1335725/full#supplementary-material
Blunden, J., and Boyer, T. (2022). State of the climate in 2021. Bull. Am. Meteorological Soc. 103, S1–S465. doi:10.1175/2022bamsstateoftheclimate.1
Chen, J., Zheng, W., Wu, S., Liu, C., and Yan, H. (2022). Fire monitoring algorithm and its application on the geo-kompsat-2A geostationary meteorological satellite. Remote Sens. 14, 2655. doi:10.3390/rs14112655
Dai, W., Ye, C., Li, C., Wei, W., Zheng, X., and Hu, W. (2022). Analysis of temporal and spatial characteristics of water quality and the impact factors in Datong Lake area. Environ. Eng. 40, 34–41. doi:10.13205/j.hjgc.202202006
Gao, R., Zhang, L., Wang, Z. D., Qian, Y., and Qian, H. (2023). Comprehensive evaluation of the health status of Chaohu Lake from 2017 to 2020. J. Chifeng Univ. Nat. Sci. Ed. 39, 6–11. doi:10.3969/j.issn.1673-260X.2023.08.003
Ge, B. Y., Yang, L. K., Chen, X. F., Li, Z. Q., Mei, X. D., and Liu, L. (2018). Aerosol inversion of Himawari-8 geostationary satellite data by the dark target method. J. Remote Sens. 22, 38–50. doi:10.11834/jrs.20187033
Gong, S., Lu, P., Sun, D., Li, Y., and Wu, P. (2016). Comparison of water surface temperature retrieval algorithms from HJ-1B/IRS thermal infrared data over Lake Taihu, China. Lake Sci. 28, 645–653. doi:10.18307/2016.0321
Han, C., Yang, Q., He, X., Mei, Y., Ding, M., Li, Y., et al. (2023). Research on fire SPOT detection algorithm based on the new generation of geostationary meteorological satellite. Remote Sens. Technol. Appl. 38, 173–181. doi:10.11873/j.issn.1004-0323.2023.1.0173
Hu, Q., Song, J., Huang, D., Ding, L., Lin, Z., and Hu, J. (2023). Research on water quality parameters inversion in mulan river based on remote sensing images. Environ. Monit. China 39, 206–214. doi:10.19316/j.issn.1002-6002.2023.03.24
Jiang, Y. (2018). Remote sensing inversion models of sea surface temperature based on deep learning method. Shandong: Shandong University of Science and Technology.
Kurihara, Y., Murakami, H., and Kachi, M. (2016). Sea surface temperature from the new Japanese geostationary meteorological Himawari-8 satellite. Geophys. Res. Lett. 43, 1234–1240. doi:10.1002/2015gl067159
Liu, G., Ou, W., Zhang, Y., Wu, T., Zhu, G., Shi, K., et al. (2015). Validating and mapping surface water temperatures in Lake Taihu: results from MODIS land surface temperature products. Ieee J. Sel. Top. Appl. Earth Observations Remote Sens. 8, 1230–1244. doi:10.1109/jstars.2014.2386333
Liu, H., Yu, T., Hu, B., Hou, X., Zhang, Z., Liu, X., et al. (2021). UAV-borne hyperspectral imaging remote sensing system based on acousto-optic tunable filter for water quality monitoring. Remote Sens. 13, 4069. doi:10.3390/rs13204069
Lyu, H., Zhang, J., Zha, G., Wang, Q., and Li, Y. (2015). Developing a two-step retrieval method for estimating total suspended solid concentration in Chinese turbid inland lakes using Geostationary Ocean Colour Imager (GOCI) imagery. Int. J. Remote Sens. 36, 1385–1405. doi:10.1080/01431161.2015.1009654
Niu, X., Tang, J., Zhang, Z., Cui, L., Xing, W., and Song, Y. (2019). The method of aerosol retrieval using Himawari-8 satellite data and its application in monitoring haze process. J. Univ. Chin. Acad. Sci. 36, 671–681. doi:10.7523/j.issn.2095-6134.2019.05.013
Sharma, S., Gray, D. K., Read, J. S., O'reilly, C. M., Schneider, P., Qudrat, A., et al. (2015). A global database of lake surface temperatures collected by in situ and satellite methods from 1985-2009. Sci. Data 2, 150008. doi:10.1038/sdata.2015.8
Shi, K., Lang, Q., Wang, P., Yang, W., Chen, G., Yin, H., et al. (2023a). Dissolved oxygen concentration inversion based on Himawari-8 data and deep learning: a case study of lake Taihu. Front. Environ. Sci. 11. doi:10.3389/fenvs.2023.1230778
Shi, K., Wang, P., Yin, H., Lang, Q., Wang, H., and Chen, G. (2023b). Dissolved oxygen inversion based on himawari-8 imagery and machine learning: a case study of Lake Chaohu. Water 15, 3081. doi:10.3390/w15173081
Shi, X., Sun, J., and Shi, L. (2021). Derivation of river surface temperature from Landsat thermal infrared data. J. Hydroelectr. Eng. 40, 121–130. doi:10.11660/slfdxb.20210212
Shi, X., Xia, J., and Sun, J. (2022). Comparison of methods to derive river water temperature using thermal infrared imagery:A case study of the upper Yangtze River catchment. J. Lake Sci. 34, 307–319. doi:10.18307/2022.0125
Sun, J., Wang, M., Huang, Z., Li, J., and Tong, Y. (2022). Characteristic of long-term water temperature variation in typical shallow lake and correlation analysis with climate factors. Environ. Pollut. Control 44, 979–985. doi:10.15985/j.cnki.1001-3865.2022.08.001
Till, A., Rypel, A. L., Bray, A., and Fey, S. B. (2019). Fish die-offs are concurrent with thermal extremes in north temperate lakes. Nat. Clim. Change 9, 637–641. doi:10.1038/s41558-019-0520-y
Torgersen, C. E., Faux, R. N., Mcintosh, B. A., Poage, N. J., and Norton, D. J. (2001). Airborne thermal remote sensing for water temperature assessment in rivers and streams. Remote Sens. Environ. 76, 386–398. doi:10.1016/s0034-4257(01)00186-9
Wang, Z., Lian, Y. Q., Li, X. N., Wang, X., Fang, Y., and Xu, X. H. (2022). Remote sensing inversion study of water quality parameters of Chanba River based on machine learning. Yangtze River 53, 13–18. doi:10.16232/j.cnki.1001-4179.2022.09.003
Yamamoto, Y., and Ishikawa, H. (2018). Thermal land surface emissivity for retrieving land surface temperature from himawari-8. J. Meteorological Soc. Jpn. 96B, 43–58. doi:10.2151/jmsj.2018-004
Yang, K., Yu, Z., Luo, Y., Yang, Y., Zhao, L., and Zhou, X. (2018). Spatial and temporal variations in the relationship between lake water surface temperatures and water quality - a case study of Dianchi Lake. Sci. Total Environ. 624, 859–871. doi:10.1016/j.scitotenv.2017.12.119
Zhang, Y. L., Qin, B. Q., Zhu, G. W., Song, C. Q., Deng, J. M., Xue, B., et al. (2022). Importance and main ecological and environmental problems of lakes in China. China Sci. Mag. 67, 3503–3519. doi:10.1360/tb-2022-0178
Zhu, D. D., Chen, Z. Q., Li, Z. Q., Peng, G. Z., and Liu, N. (2023). Analysis of water pollution in dongting lake and its countermeasures. J. Hunan Inst. Sci. Technol. Nat. Sci. 36, 56–60. doi:10.16740/j.cnki.cn43-1421/n.2023.02.008
Keywords: water quality, remote sensing retrieval, synchronous Satellite, LSWT, machine learning
Citation: Shi K, Han J-C and Wang P (2024) Near real-time retrieval of lake surface water temperature using Himawari-8 satellite imagery and machine learning techniques: a case study in the Yangtze River Basin. Front. Environ. Sci. 11:1335725. doi: 10.3389/fenvs.2023.1335725
Received: 14 November 2023; Accepted: 11 December 2023;
Published: 05 January 2024.
Edited by:
Jinxin Zhu, Sun Yat-sen University, ChinaReviewed by:
Yurui Fan, Brunel University London, United KingdomCopyright © 2024 Shi, Han and Wang. This is an open-access article distributed under the terms of the Creative Commons Attribution License (CC BY). The use, distribution or reproduction in other forums is permitted, provided the original author(s) and the copyright owner(s) are credited and that the original publication in this journal is cited, in accordance with accepted academic practice. No use, distribution or reproduction is permitted which does not comply with these terms.
*Correspondence: Jing-Cheng Han, aGFuamNAc3p1LmVkdS5jbg==
Disclaimer: All claims expressed in this article are solely those of the authors and do not necessarily represent those of their affiliated organizations, or those of the publisher, the editors and the reviewers. Any product that may be evaluated in this article or claim that may be made by its manufacturer is not guaranteed or endorsed by the publisher.
Research integrity at Frontiers
Learn more about the work of our research integrity team to safeguard the quality of each article we publish.