 Xuanhua Huang
 Youping Xie2*
95% of researchers rate our articles as excellent or good
Learn more about the work of our research integrity team to safeguard the quality of each article we publish.
Find out more
ORIGINAL RESEARCH article
Front. Environ. Sci. , 05 January 2024
Sec. Environmental Informatics and Remote Sensing
Volume 11 - 2023 | https://doi.org/10.3389/fenvs.2023.1334458
This article is part of the Research Topic Territorial Spatial Evolution Process and its Ecological Resilience View all 15 articles
Introduction: It is of great significance to strengthen the evaluation research and driving force analysis of ecosystem services value for the rational utilization and protection of the ecological environment of Changsha-Zhuzhou-Xiangtan (CZT) urban agglomeration and the promotion of the integration of urban agglomeration.
Methods: Based on the remote sensing image data, the spatial and temporal evolution characteristics and influencing factors of the ecosystem services value of CZT urban agglomeration were analyzed by the methods of ArcGIS10.2, Geoda, value equivalent and spatial statistics.
Results: The results showed that: 1) From 2000 to 2020, the total value of ecosystem service in the CZT urban agglomeration decreased gradually, with an overall decrease of 4,381.07 × 106 yuan. In the past 20 years, the ecosystem service Value (ESV) of cultivated land, forest land and grassland had declined, but the ESV of water area and unused land had fluctuated, and the single ESV had declined. 2) From 2000 to 2020, the spatial distribution of ESV in the CZT urban agglomeration showed an obvious pattern of “low in the middle and high in the surrounding areas”, and the changes were quite different in different periods. 3) The spatial correlation between ESV and distance from county government, distance from railway, proportion of construction land, NDVI, population density, economic density, slope and precipitation were significant. The spatial distribution of the distance from the county government, the distance from the railway, NDVI and ESV were similar; the population density and economic density were consistent with the spatial distribution of ESV; and the spatial distribution of construction land proportion, slope, precipitation and ESV were different.
Discussion: The results of the study can provide some reference for the further development of ecological protection policies and related planning in urban agglomerations.
Ecosystem services (ESs) refer to the environmental conditions and utilities provided by ecosystems to support human survival and development (Daily, 1997). Ecosystem service Value (ESV) is a monetary evaluation of ESs that can partially indicate the quality of the regional ecological environment (Zhao et al., 2014). Natural and social forces both have an impact on changes in ESV. Investigating the spatial and temporal changes in ESV and the spatial correlation between the drivers and ESV can aid in understanding the spatial and temporal variations of the drivers, and offer valuable insights for developing effective ecological management plans, enhancing ecological construction, and improving human wellbeing in the region.
Existing academic research on ESs has yielded significant findings, primarily focused on various aspects including the assessment of ESV, spatio-temporal characteristics, and influencing factors (Liu and Lv, 2009; Wei and Guo, 2015; Deng et al., 2019). For example, Rui et al. (2019), Liu et al. (2016), and Rao et al. (2013) conducted assessments on overall ecosystems, individual ecosystems, and specific ecosystem service, analyzing their functional values and corresponding driving factors. Studies were conducted at different spatial scales, such as natural areas (Sun et al., 2017; Nan et al., 2018), economic zones (Zhao et al., 2017), and administrative regions (Xue and Luo, 2015; Gao et al., 2016). Li. (2019) examined the spatial and temporal changes in the loss of ESV in karst mountainous areas, while Li (2014) explored the dynamics of ESV and its driving forces in the Guanzhong-Tianshui Economic Zone. Additionally, Li. (2019b), Mao and Chen (2010), and Lin (2019) evaluated the ESV in the Yangtze River Economic Zone, Jiangsu Province, and Guangzhou City, respectively. Traditional research methods primarily involve principal component analysis (Zhang et al., 2017), multiple regression (Qiao et al., 2015), and correlation analysis (Yang, 2018). However, with advancements in geographic information systems and remote sensing, newer statistical approaches like geoprospectors (Huang et al., 2019; Huang and Yang, 2019), spatial autocorrelation (Yang et al., 2012; Yao et al., 2015), the STIRPAT model (Sun et al., 2009; Ran et al., 2018), and geographically weighted regressions (Chen et al., 2014) have gained popularity. SU (2018) employed the InVEST and CASA models to evaluate the ecosystem service functions of sediment interception, water production, net primary productivity (NPP), carbon sequestration, oxygen release, and food production in the Upper Fen River Basin. Additionally, Tang et al. (2016) utilized the STIRPAT model and the GWR model to examine the drivers of ESV in Beijing. Previous studies have provided some guidance for quantitatively analyzing the driving factors of ESV. However, there are several deficiencies. Firstly, research areas were mainly selected at medium and large scales, such as national, provincial, prefectural, municipal, and watershed levels. Less attention was paid to changes at smaller scales, such as grids, which ignore the scale-dependence of geographic element distribution. Secondly, the selection of influencing factors mainly focused on natural and socio-economic aspects and the analysis of quantitative relationships, with less consideration of the influence of spatial location factors, thus resulting in a relatively weak analysis of relevant spatial characteristics. Furthermore, research methods were mainly traditional quantitative methods like correlation and principal components, which are difficult to reflect the spatially relevant characteristics of the influencing factors, although they can be better for the evaluation of the global effects of the influencing factors.
The “Three Trunks and One Track” project of the western loop of the CZT Railway, the accelerated construction of Changsha’s southern new city and Zhuzhou’s Yunlong Demonstration Zone, as well as the rapid transformation of Furong Avenue, Dongzhu Road, and Tanzhou Avenue in the CZT urban agglomeration, have all contributed to the integration of the three cities of the CZT. The population and economic activity between cities will increasingly rise as a result of this quickly developing integration process, having a substantial impact on the structure, operation, and function of ecosystem service. The urban ecological environment is likely to face increasing pressure, which might ultimately affect human wellbeing. We estimated the ESV in the CZT urban agglomeration area using remote sensing photos from 2005 to 2020, together with tools like GIS, SPSS, Geoda, and others, to better understand this phenomenon. We looked at the spatial and temporal evolution patterns of the ESs and their spatial interactions with the drivers using the methodologies of value equivalence, multiple regression, and bivariate spatial statistics. Our purpose was to offer better solutions for the urbanization of CZT and to improve the ESs. Moreover, we aimed to: quantify the ecosystem services change trends in CZT, and explore the effects of different driving forces on the ecosystem services, intending to provide guidance for ecological management and ecological construction in the CZT urban agglomeration area.
The CZT urban agglomeration, which is situated in Hunan Province’s central and eastern region, is a significant component of the urban agglomeration in the middle reaches of the Yangtze River and serves as the province’s focal point for economic and social growth as it gradually transforms into one of the driving forces behind the “Rise of Central China.” CZT’s three cities are located in the middle reaches of the Xiangjiang River. Along the Xiangjiang River was “Pin” shape distribution, two and two less than 40 km apart, in the middle of the ecological green heart of the natural isolation, but also has dense high-speed, urban railroad network connectivity, the urban agglomeration of the overall strength of the significant increase (Figure 1). The CZT urban agglomeration is located in the subtropical monsoon humid climate zone, with sufficient heat and abundant rainfall. Basin and hills are interlaced, urban areas and villages are intertwined, and the spatial combination is unique; a good combination of mountains, waters, and green heart form a unique ecological background, and the regional ecological environment is superior (Zhang et al., 2020). Referring to the studies of He and Zhou (2007) and Ouyang et al. (2019), the metropolitan area of the urban agglomeration was selected as the study area of this research, including the urban areas of Changsha, Zhuzhou, and Xiangtan (Zhuzhou County was changed to Bryan Kou District in 2018), as well as Changsha County and Xiangtan County. By the end of 2018, the CZT metropolitan area had a resident population of 9,041,600 people, with an average urbanization level of 80.46%, a gross regional product of 1,164,966 million yuan, accounting for about 73.43% of the CZT urban agglomeration, and a retail sales volume of all consumer goods of 534,823 million yuan.
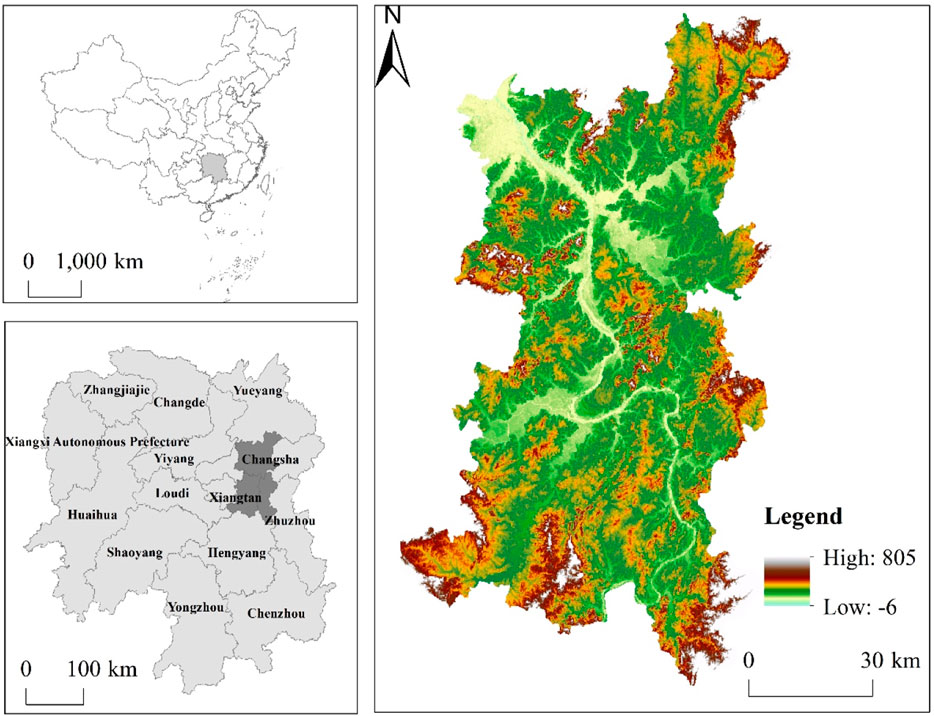
FIGURE 1. Location of the study area.
The Landsat TM/ETM remote sensing images of the CZT urban agglomeration from 2005, 2010, 2015, and 2020 were acquired from the Resource and Environment Science Data Center, Chinese Academy of Sciences (http://www.resdc.cn). The land use types were classified into six categories based on the national standard classification of land use and the study conducted by Liu et al. (2014): arable land, forest land, grassland, watershed, construction land, and unutilized land.
Changes in ecosystem services impact ecological health, affecting economic and social development and human wellbeing. Therefore, based on existing research results (Jiang, 2010; Ouyang et al., 2020), this study selected relevant influencing factors of ESV from three aspects: natural environment, socio-economy, and spatial location.
For the natural environment, five factors are chosen: Normalized Difference Vegetation Index (NDVI), air temperature, precipitation, elevation, and slope. NDVI reflects surface biomass and ESV (Chen et al., 2014). Temperature and precipitation influence ES functions like evapotranspiration and climate regulation. Higher elevations and slopes are associated with less human activity impact and more stable ESV. The NDVI, temperature, precipitation, and Digital Elevation Model (DEM) data were obtained from the Resource and Environment Science Data Center, Chinese Academy of Sciences (http://www.resdc.cn), while the slope was extracted from the DEM using the Slope Analysis module in ArcGIS.
In socio-economic aspects, three factors are selected: proportion of construction land, population density, and economic density (GDP density). Increasing population and economic densities exert pressure on ESs (Zuo and Ma, 2012). Proportion of construction land reflects spatial expansion of human activities (Xing, 2018). The proportion of construction land is obtained using the Attribution Select tool in ArcGIS, while population density and economic density are derived from the Resource and Environment Science Data Center, Chinese Academy of Sciences (http://www.resdc.cn).
Spatial location factors include distance to rivers, highways, county government, and railways. Rivers have two main effects on human activities: providing sufficient water for production and life, and offering convenient shipping conditions (Xie et al., 2003). The distance from highways, county government, and railways also reflects human influence on the ecological environment (Wartenberg, 1985). Vector data for rivers, highways, county government, and railways in the CZT metropolitan area were obtained from Urban Data Pie (https://www.udparty.com//). The distances were calculated using the Euclidean Distance tool in ArcGIS 10.2. The projected coordinates of all influencing factors were unified, and the values of each influencing factor in each grid were calculated using the Zonal Statistics as Table module in ArcGIS 10.2.
The functional value method and the equivalent value method are the two main categories of assessment methods that have been developed thus far, but there is currently a lack of a comprehensive, unified, and scientific set of methods for accounting or assessing the ESV both domestically and internationally. In this work, we utilize the coefficients of ESV of CZT urban agglomeration of Ouyang Xiao et al. (Ouyang et al., 2019) for computation, referring to the equivalent ESV per unit area of Chinese terrestrial ecosystems as developed by Xie et al. (2003) (Eqs 1, 2). Since the ESV of construction land is zero, it is not listed in Table 1, and the ESV coefficients and calculation formulas for the CZT urban agglomeration are as follows:
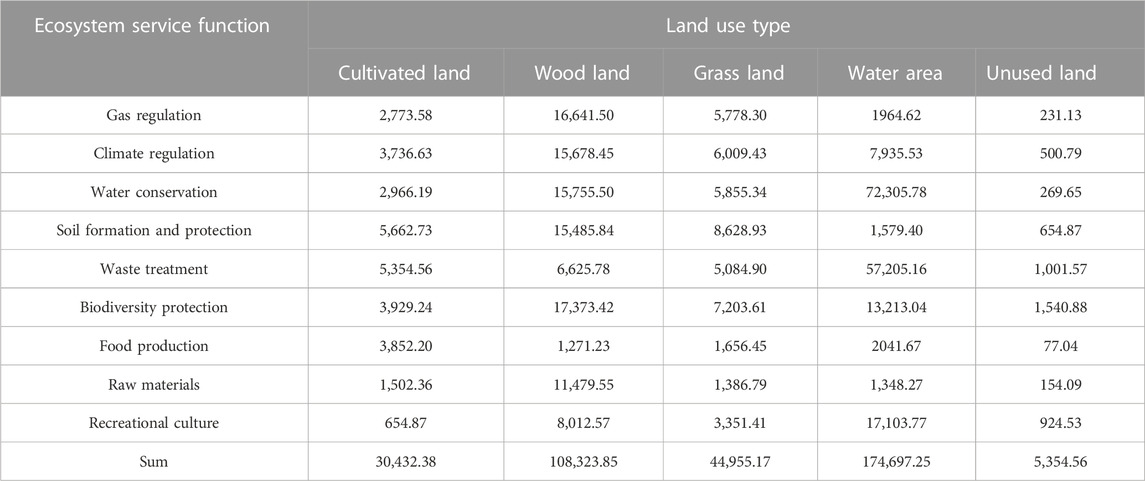
TABLE 1. Coefficient of ESV per unit area (yuan·hm-2·a−1).
Where:
(1) Variance Inflation Factor (VIF)
The VIF is a method of the degree of multicollinearity between predictor variables. A VIF value > 10 is generally considered to provide evidence of multicollinearity (Luo et al., 2020), and no predictor variables had collinearity with the other variables.
(2) Spatial autocorrelation
Spatial autocorrelation offers significant advantages in analyzing the effects of spatial locational factors and relevant spatial features. By identifying patterns of similarity or dissimilarity and recognizing the spatial dependency between neighboring locations, it helps improve the accuracy of statistical models. By recognizing and incorporating the spatial relationships between neighboring locations, the model can better capture the underlying spatial structure of the data. The bivariate global autocorrelation and local autocorrelation are extended to show the correlation of the spatial distribution of various factors, with reference to the research of associated researchers (Eq. 3). The following is the formula (Gao et al., 2019):
Where:
According to the change in total value, the CZT Urban Agglomeration’s ESV decreased gradually between 2000 and 2020, falling from 64,955.87 × 106 yuan in 2000–60,574.80 × 106 yuan in 2020, a decrease of 4,381.07 × 106 yuan or 6.74% (Table 2). In the periods 2000–2005, 2005–2010, 2010–2015 and 2015–2020, it fell by 1.04%, 0.62%, 3.7% and 1.57%, respectively. From the perspective of each land use type, the ecological service value of cultivated land, wood land and grass land also showed a decreasing trend during the 20-year period, decreasing by 1,252.73 × 106 yuan, 3,103.95 × 106 yuan and 8.29 × 10⁶ yuan from 2000 to 2020, with a decrease rate of 12.3%, 6.29%, and 5.62%, respectively. However, the ecological service value of water area and unused land is volatile, with the ecological service value of waters experiencing a fluctuating process of first decrease, then growth and then decrease, decreasing by a total of 17.2 × 10⁶ yuan, with a decrease rate of 0.33%.
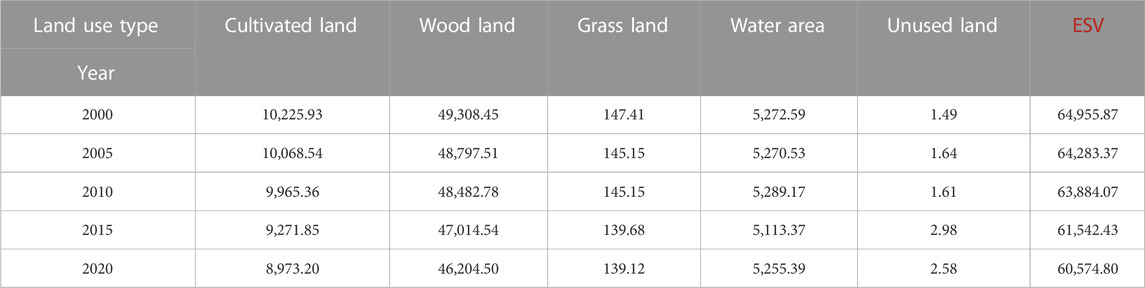
TABLE 2. Change of ESV of individual land use types (106yuan).
In terms of the value of individual ecosystem service, the value of all nine ecosystem service functions in the study area from 2005 to 2020 showed the same trend of change, i.e., a decreasing trend. As can be seen from Figure 2, ESs in the CZT urban agglomeration area are mainly dominated by the three functions of water conservation, biodiversity protection, and soil formation and protection, with three ESVs accounting for 16.05%, 14.86%, and 13.84% of the total value in 2020 in that order, followed by the functions of gas exchange and climate regulation, with the total share of gas exchange and climate regulation accounting for 26.55%; Food production is the weakest function, with only 2.91%. Meanwhile, waste treatment and raw materials accounted for 10.07% and 8.91%, respectively, which were much higher than that of food production. Due to the extensive distribution of the Xiangjiang River and its tributaries and lakes in the study area, the regional water conservation function is more prominent. Coupled with the increasingly strict ecological protection of the CZT ecological green center, the region provides a good ecological background for biodiversity conservation and soil formation and protection functions.
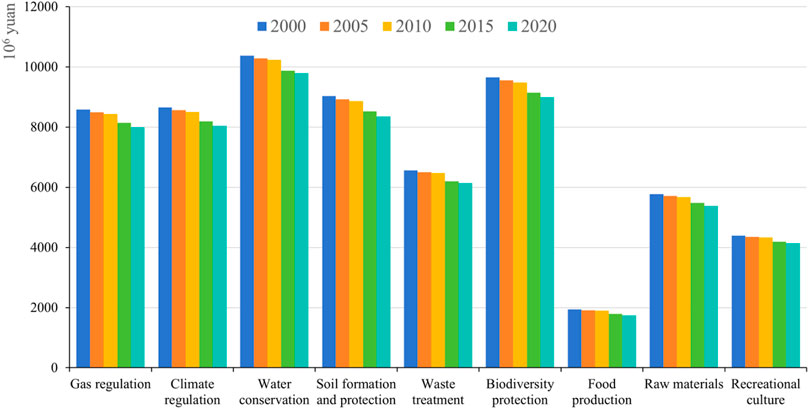
FIGURE 2. Change of individual ESV in 2000–2020.
As can be seen in Figure 3, the spatial distribution of ESV in the CZT urban agglomeration from 2000 to 2020 shows an obvious pattern of “low in the middle and high in the surroundings”, and the changes in different periods of time vary greatly, primarily in Changsha City and Xiangtan City but also concentrated in Tianyuan District. This decrease was largely driven by the rapid pace of CZT integration and “melting city” constructions, resulting in an accelerated expansion of construction land areas and significant declines in the ESV of the three urban areas. Overall, the ESV of the study area from 2005 to 2020 has decreased in a large area, spreading in a piecemeal fashion, with a significant decrease in the urban areas of CZT and an increase in the value of ecosystem service in the periphery of the urban areas. During the past 20 years, the urbanization level of CZT urban agglomeration and the integration construction of the three cities have increased the population density and the scale of economic activities in the region, which has intensified the squeeze and encroachment of urban land on arable land and ecological land and consequently led to a significant reduction of the ESV.
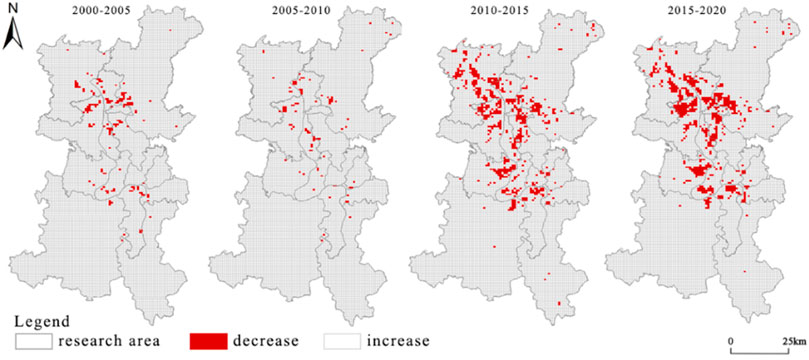
FIGURE 3. The spatial distribution of changes of ESV in 2000–2020 (106 yuan).
Using SPSS23.0 to carry out the covariance test of the influence factors, it can be seen from Table 3 that among the 12 factors, only the inflated variance inflation factor (VIF) of population density is 10.13 > 10, and the VIF values of the rest of the factors are relatively small, which indicates that the level of covariance among the factors is low, and because population density is an important factor affecting the ESV, it is retained here. Through multiple stepwise regression of 12 factors, an adjusted R2 of 0.60 was obtained, and the regression results passed the test of probability <0.05, and the factors affecting the ESV of CZT urban agglomeration were finally screened out to mainly include the factors of distance from district and county governments and distance from railways in terms of the locational conditions, the factors of NDVI, slope and precipitation in terms of the natural environment, as well as the proportion of construction land in terms of the socio-economic aspects, population density and economic density factors.
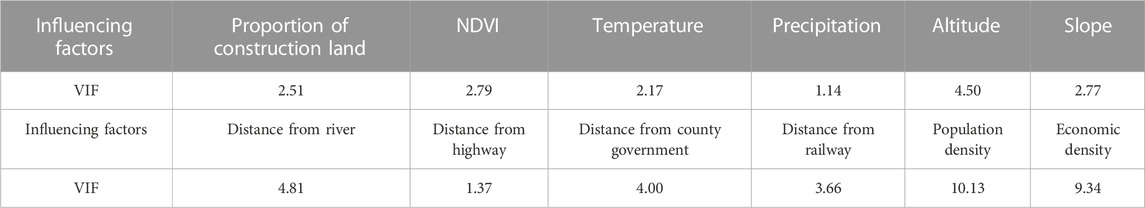
TABLE 3. Test of the influence factors.
In order to investigate the relationship between the spatial distribution of the above eight major factors and the ESV in the study area, a bivariate spatial autocorrelation test was conducted using Geoda, and the results are shown in Table 4, the global Moran’s I index of distance from Distance from county government, Distance from railway, Proportion of construction land, NDVI, Population density, Economic density, Slope and Precipitation with ESV were 0.23, 0.12, −0.45, 0.34, −0.33, −0.32, 0.26, and 0.05, respectively, while all these eight factors passed the 1% significance level test, indicating that their spatial correlation with ESV was significant. Among them, the proportion of construction land, population density and economic density are negatively correlated with the spatial distribution of ESV, and the spatial agglomeration of dissimilar values is significant. Besides, the remaining five factors have positive correlations with ESV in spatial distribution, and the similar values are spatially agglomeration significantly.
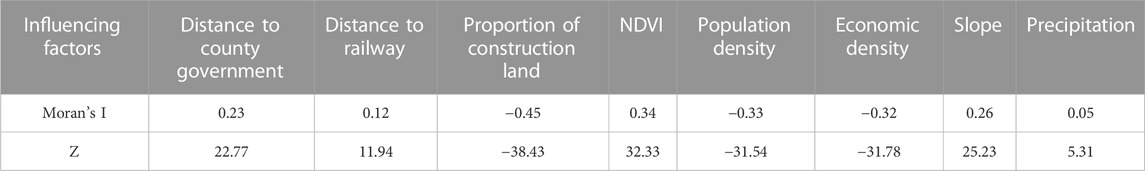
TABLE 4. Spatial auto-correlation test of influencing factors.
In Figures 4A, B, D, the spatial relationship between the three factors, distance from county governments, distance from railway, and NDVI, and ESV are similar, and the low-low concentration is dispersed throughout CZT’s core urban areas. To be more precise, it is primarily concentrated in Yuelu District’s northern portion, Kaifu District’s southern portion, Furong District, Tianxin District’s eastern and southern portions, Yuhua District’s northern portion, the southwest portion of Changsha County, Yuhu District, Yetang District, Shifeng District, Hetang District, and portions of Tianyuan District. The southwest, Hetang, Yutang, Shifeng, Yuhu, and a portion of Tianyuan districts. High-high agglomeration areas are concentrated in the northeastern part of the study area (Changsha County), the southern part (Xiangtan County, Zhuzhou County) and the ecological green heart, and other areas with lush vegetation cover, whose ecological environments are well protected due to their good vegetation cover, resulting in high ESV. The low-high value areas are mainly distributed along the Xiangjiang River and lakes, which are generally highly developed and utilised, resulting in a lower ESV; the high-low value areas are scattered in the peripheral areas of the urban area, which is mainly related to the planning of transport routes. The high and low ESV areas in Figure 4C are primarily found in Changsha City, Xiangtan City, Xiangtan County, and Shifeng, Hetang, and Tianyuan Districts in Zhuzhou City. These areas are concentrated in urban areas due to population density and economic activity, rising levels of urbanization, and rising land demand, which causes land to expand quickly for construction, significantly lowering the ESV of the area. Value of the area’s services. The low-low agglomeration area is located in the southwestern part of Changsha County, the northwestern part of Wangcheng District, and the periphery of Yuhu District and Xiangtan County, which is far away from the urban area, sparsely populated, economically inactive, and mostly farmable land with a low ESV in general. The high - high agglomeration is mainly along the Xiangjiang River, with a high proportion of construction land, but the ESV is also relatively high due to the proximity of the Xiangjiang River and lakes and wetlands.
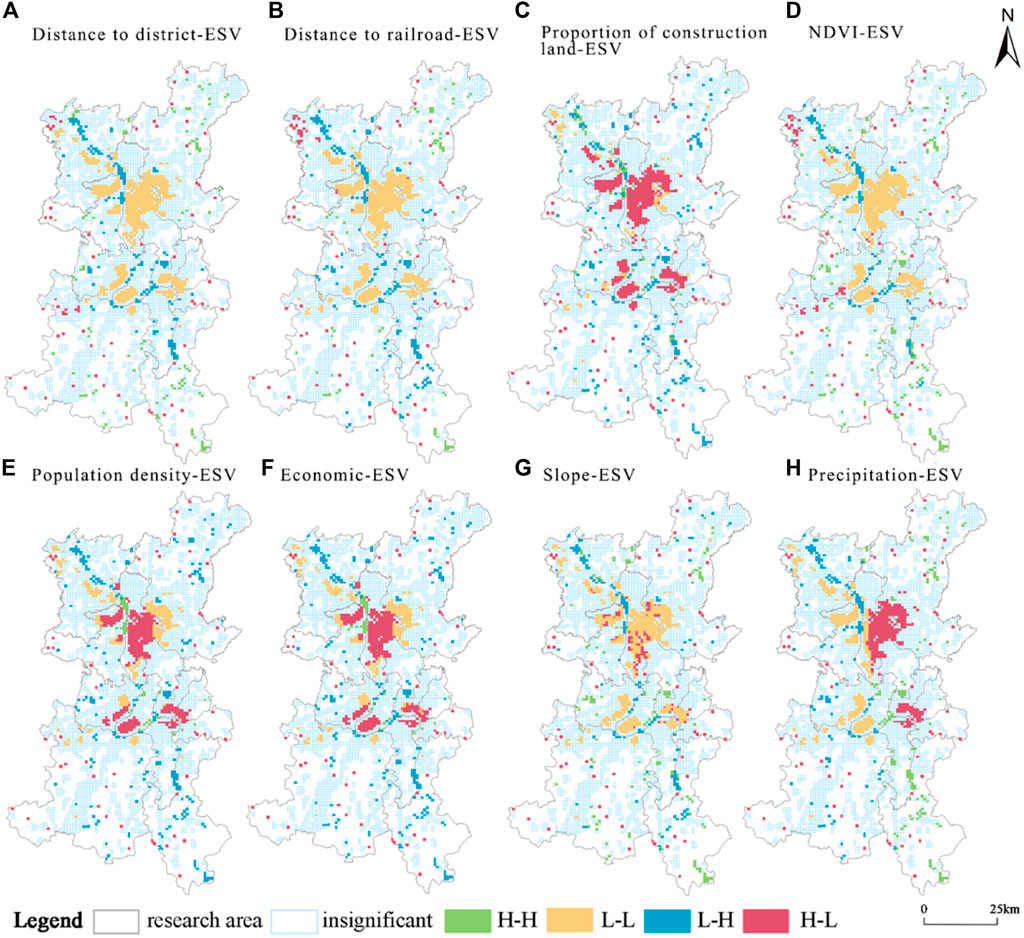
FIGURE 4. (A–H) Local spatial agglomeration graph of influencing factors and ESV.
In Figures 4E, F, the spatial distribution of population and economic densities and ESV is consistent, i.e., the high-low ESV areas are mainly distributed in the inner five districts of Changsha, Yuhu and Yutang districts of Xiangtan, and Shifeng, Tianyuan and Hetang districts of Zhuzhou. In comparison to the neighboring counties and districts, these districts have a higher population density, more economic activity, and a higher demand for ESs from human civilization. As a result, the ecological environment is under more stress and has a lower value. However, Changsha County, Wangcheng District, Xiangtan County, and other towns and cities with lower population and economic densities are primarily found on the periphery of the low-low agglomeration. The low-low agglomeration is primarily concentrated in the urban regions of Changsha, Xiangtan and its surrounding counties and towns, as well as Shifeng, Tianyuan, and Hetang districts of Zhuzhou. The spatial distribution of slope and ESV in Figure 4G displays variability. Meanwhile, the high - low anomalies are also intertwined and distributed in these areas. In the spatial distribution of precipitation and ESV in Figure 4H, the low-low agglomeration area is mainly distributed in the central and western parts of CZT urban agglomeration, while the high-low anomaly area is mainly distributed in the central-eastern part of the study area, including Furong, Tianxin, Yuhua, and southwestern Changsha counties, and Shifeng, Hetang, and Tianyuan districts. The high - high agglomeration is mainly concentrated in the northeastern part of Changsha County and the southeastern part of Zhuzhou County, due to the rich vegetation, sloping topography, and more abundant precipitation, thus making the value of ecosystem service higher than that of the urban areas.
Taking CZT urban agglomeration as the study area, based on the remote sensing image data and multifactor raster data from 2000 to 2020, using the value equivalent method, multivariate regression and bivariate spatial statistical methods, we analyzed the temporal and spatial change characteristics and driving factors of ESV in the study area, and obtained the following main conclusions: The total ESV in CZT urban agglomeration shows a changing trend of decrease. The ESV of different land use type were declining trends. The ESs in the CZT urban agglomeration area are mainly dominated by the three functions of water conservation, biodiversity conservation and soil formation and protection, followed by gas exchange and climate regulation functions, and the weakest food production function. The spatial distribution of ESV in the CZT urban agglomeration shows an obvious pattern of “low in the middle and high in the surroundings”. The spatial correlation between distance from the county government, distance from the railway, Proportion of construction land, NDVI, population density, economic density, slope, precipitation, and ESV are significant.
This study utilizes grid analysis to quantify the spatial and temporal changes in the value of ESs in the CZT urban agglomeration from 2005 to 2020, and finds that it shows a decreasing trend in time, with an obvious decreasing trend; the spatial distribution shows an obvious “low in the middle, high in the periphery” pattern, which is consistent with Ouyang et al. This is basically consistent with the conclusion of (Ouyang et al., 2019) that “ESs in the CZT urban agglomeration in 2015 showed a spatial pattern of “center-periphery” distribution, and showed a spatial distribution trend of outward increase”. It is basically consistent. Unlike most of the previous studies at the scale of administrative division, economic division and natural division, the grid can avoid the influence of artificial division boundaries to a certain extent, and can more accurately reflect and portray the micro-scale spatial changes of ESV and its influencing factors.
The sharp decline in the ESV is primarily caused by the rapid urbanization of urban agglomerations since 2005, the rapid migration of rural residents to cities and towns, the conversion of significant amounts of Cultivated land into construction land and industrial land, mining, and transportation purposes, and the growing intensity of economic activities. Industrialization has exacerbated environmental pollution and ecological damage, thus changing the structure, function and development process of ecosystems, and bringing about a decline in ecological environment quality. The decline in ecological environment quality is manifested in the reduction of ESV, which affects the sustainable survival and development of human beings. In urban areas with a high level of economic development, the population density and economic activity levels are high, and human demand for ESs is high. This combination creates an ecological crisis caused by a lack of regional ESs, which limits the scale of economic development and has an adverse impact on the improvement of people’s quality of life. While in the periphery of urban agglomerations with a lower level of economic development, the area of ecological land is large, and with the low intensity of economic activities, the ESV is high per capita, but the ESV is low. The ESV is high, but the economic development of the peripheral areas is slow and the development gap with the core urban areas is large. It can be seen that the spatial imbalance of ESs will constrain the coordinated integration and sustainable development between the core and peripheral areas to a greater extent. The result the consistent with Jiang. (2010) “the result of key area was contrary to the whole study area”.
In addition to the natural and socio-economic factors like climate, topography, population, and economic and social factors, the spatial location of each grid was also taken into account when choosing the influencing factors (Figure 5). Four influencing factors, such as distance to rivers, distance to different transportation roads, and distance to county government were chosen, based on the studies of Jiang. (2010) and Xing. (2018). In general, the direction of changes in the value of ecosystem service is determined by the amount to which human activities have an impact on different spatial regions’ ecosystems. The closer the distance from rivers, highways, county government and railway, and the more intensive the human activities, the more the ESs are affected by human society, and the value of ecosystem service tends to decrease. The spatial distribution correlation between ESV and the influencing factors in CZT urban agglomeration is presented visually using SPSS 23.0 to screen the pertinent influencing factors, and Geoda and ArcGIS 10.2 software. This is of great importance for the urban agglomeration to harmonize the ecological environment, adjust the ecological management, and advance the experiment of reforming the “two-type” society in the future. This will help to coordinate ecological management in the urban agglomeration in the future and will support the reform experiment of a “two types” society. However, since it is difficult to identify the local anomalies of the influencing factors, more accurate spatial heterogeneity detection model should be applied in future studies. Moreover, with the improvement of transportation conditions and information networks, the linkage between urban agglomerations will also affect the value of ecosystem service, and the spatial interactions between cities should be quantified in the future. Meanwhile, the assessment and analysis of multi-scale grids will be strengthened in the future in order to more accurately recognize the scale effect.
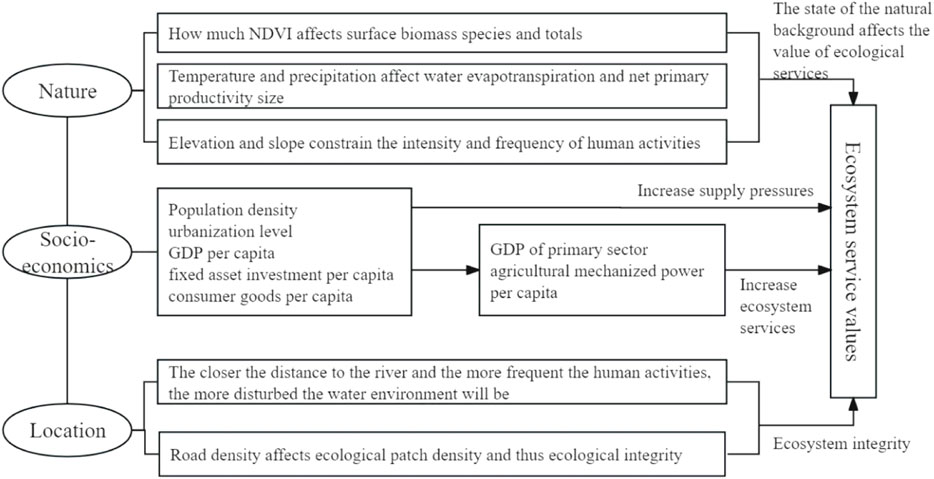
FIGURE 5. The relationship between each influencing factor and ESV.
In view of the declining trend of the total ESV and the value of individual services in the CZT urban agglomeration, under the background of accelerated urbanization and integrated urban development, there are the following suggestions for the planning and ecological construction of the urban agglomeration in the future: First, appropriately promote the urbanization of CZT cities, reasonably regulate the scale and speed of construction land expansion, advocate saving and intensive use of construction land, and improve the efficiency of land use; reasonably evacuate the population in areas with high population and economic density and poor ecosystem service function. Second, adhere to the red line of basic farmland protection, encourage farming where farming is appropriate, strengthen the efficient and modernized production of basic farmland, increase the food production per unit area of farmland, and enhance the capacity and security of regional food supply. Third, strengthen the protection of ecological land in urban agglomerations, plan and utilize the natural ecological environment in the peripheral areas of urban agglomerations and green heart areas, and rationally deploy ecosystem service to create an ecological environment in urban agglomerations that is pleasant to live in, pleasant to work in, and pleasant to visit.
The original contributions presented in the study are included in the article/Supplementary Material, further inquiries can be directed to the corresponding authors.
XH: Conceptualization, Formal Analysis, Methodology, Software, Supervision, Writing–original draft, Writing–review and editing. YX: Formal Analysis, Methodology, Writing–original draft. FL: Data curation, Methodology, Software, Writing–original draft. LC: Data curation, Investigation, Resources, Visualization, Writing–original draft. HZ: Data curation, Formal Analysis, Software, Writing–original draft.
The author(s) declare financial support was received for the research, authorship, and/or publication of this article. The Open Topic of Key Laboratory of Natural Resources Monitoring and Supervision in Southern Hilly Region, Ministry of Natural Resources (NRMSSHR 2022Z06).
The authors declare that the research was conducted in the absence of any commercial or financial relationships that could be construed as a potential conflict of interest.
All claims expressed in this article are solely those of the authors and do not necessarily represent those of their affiliated organizations, or those of the publisher, the editors and the reviewers. Any product that may be evaluated in this article, or claim that may be made by its manufacturer, is not guaranteed or endorsed by the publisher.
Chen, F., Liu, Y., and Liu, Q. (2014). Spatial downscaling of TRMM 3B43 precipitation considering spatial heterogeneity. Int. J. Remote Sens. 35 (9-10), 3074–3093. doi:10.1080/01431161.2014.902550
Daily, G. C. (Editors) (1997). Nature’s Service: Societal Dependence on Natural Ecosystems. Washington: Island Press.
Deng, C., Zhong, X., Xie, B., Wan, Y., and Song, X. (2019). Spatial and temporal changes of land ecosystem service value in Dongting Lake area in 1995-2015. Geogr. Res. 12, 4. doi:10.11821/dlyj020170999
Gao, H., Han, H., Luo, X., Yu, H., and Han, M. (2016). Spatial correlation of socioeconomic factors and ecosystem service values in guizhou province. Res. Soil Water Conservation 23, 5. doi:10.13869/j.cnki.rswc.2016.02.048
Gao, J., Yu, Z., Wang, L., and Vejre, H. (2019). Suitability of regional development based on ecosystem service benefits and losses: a case study of the Yangtze River Delta urban agglomeration, China. Ecol. Indic. 107, 105579. doi:10.1016/j.ecolind.2019.105579
He, Y., and Zhou, G.-h. (2007). Delimitation of the changsha-zhuzhou-xiangtan city-and-town concentrated area. Trop. Geogr. 27, 6.
Huang, L., Yang, P., Wang, L. J., and Zhang, X. L. (2019). Spatio-temporal evolution characteristics and influencing factors of LandEcological security in the Yangtze River Economic belt. Resour. Environ. Yangtze Basin 71, 11–21. doi:10.11870/cjlyzyyhj201908003
Huang, M., Fang, B., Yue, W., and Feng, S. (2019). Spatial differentiation of ecosystem service values and its geographical detection in Chaohu Basin during 1995-2017. Geogr. Res. 38, 14. doi:10.11821/dlyj020181075
Jiang, T. (2010). Change of farmland ecosystem services values and its driving forces in northwestern arid area: a case study on minqin county. Lanzhou: Lanzhou University.
Li, D. (2019a). Time and space evolution and driving forces ofFarmland ecosystem service value loss in karst areas: a case study ofLibo county. Guizhou: Guizhou Normal University.
Li, H. (2014). Study on changes in the value of ecological services in guanzhong-tianshui economic zone and its driving factors. Shaanxi: Shaanxi Normal University.
Li, X. (2019b). A study on the measurement and influence factors of Ecosystem service value in the Yangtze River Economic belt. Jiangxi: Jiangxi University of Finance and Economics.
Lin, H. (2019). Spatio-temporal evolution of ecosystem Service Value and its driving mechanism in Guangzhou. Guangzhou: Guangzhou University.
Liu, J., Kuang, W., Zhang, Z., Xu, X., Qin, Y., Ning, J., et al. (2014). Spatiotemporal characteristics, patterns and causes of land use changes in China since the late 1980s. Acta Geogr. Sin. 69, 12. doi:10.11821/dlxb201401001
Liu, M., Zeng, S., Sun, F., and Liu, Y. (2016). Analysis on the evolution law and driving force of water ecosystem services in beijing-tianjin-hebei region. Environ. Impact Assess. 38, 5. doi:10.14068/j.ceia.2016.06.010
Liu, X., and Lv, X. (2009). Driving forces analysis of wetland ecosystem services change. J. Arid Land Resour. Environ. 5, 1.
Luo, Y., Lü, Y., Liu, L., Liang, H., Li, T., and Ren, Y. (2020). Spatiotemporal scale and integrative methods matter for quantifying the driving forces of land cover change. Sci. Total Environ. 739, 139622. doi:10.1016/j.scitotenv.2020.139622
Mao, C., and Chen, Y. (2010). The driving force and prediction of the evolution of land use and ecosystem services value——a case study of Jiangsu province. Res. Soil Water Conservation 17, 7.
Nan, B., Yang, Z., Bi, X., Fu, Q., and Li, B. (2018). Spatial-temporal correlation analysis of ecosystem services value and human activities——a case study of Huayang lakes area in the middle reaches of Yangtze Rive. China Environ. Sci. 38, 11. doi:10.19674/j.cnki.issn1000-6923.2018.0382
Ouyang, X., He, Q., and Zhu, X. (2020). Simulation of lmpacts of urban agglomeration land use change on Ecosystem services value under multi-scenarios: case study in changsha-zhuzhou-xiangtan urban agglomeration. Econ. Geogr. 10, 1. doi:10.15957/j.cnki.jjdl.2020.01.011
Ouyang, X., Zhu, X., and He, Q. (2019). Spatial interaction between urbanisation and ecosystem services: a casestudy in Changsha-Zhuzhou-Xiangtan urban agglomeration, China. J. Ecol. 39, 7502–7513. doi:10.5846/stxb201809081922
Qiao, X., Gu, Y., Tang, H., and Yang, Y. (2015). Service values change of farmland ecosystem and its influence factors analysis in Weigan River Basin. Agric. Res. Arid Areas 000, 237–245. doi:10.16302/j.cnki.1000-7601.2015.02.039
Ran, F., Luo, Z., Cao, L., Zhao, J., and Zhao, Y. (2018). Analysis on the change of ecological service value and its driving factors in nanchang. Res. Soil Water Conservation 25, 7. doi:10.13869/j.cnki.rswc.2018.03.025
Rao, E., Xiao, Y., Ouyang, Z., and Zheng, H. (2013). Spatial characteristics of soil conservation service and its impact factors in Hainan Island. Acta Ecol. Sin. 33, 10. doi:10.5846/stxb201203240400
Rui, H., Sun, S., Guo, L., and Chen, Y. (2019). Evolution of ecosystem service value and analysis of driving forces in the east region of sichuan province, China. J. Ecol. Rural Environ. 35, 8. doi:10.19741/j.issn.1673-4831.2018.0596
Su, C. W. (2018). Yalu. Evolution of ecosystem services and its driving factors in the upper reaches of the Fenhe River watershed, China. Acta Ecol. Sin. 38 (22), 7886–7898. doi:10.5846/stxb201711061986
Sun, H., Yang, G., Wan, R., and Wu, Y. (2009). According analysis of the change of ecosystem service value and the differentiation of the driving factors in kunshan. Resour. Environ. Yangtze Basin 18, 6.
Sun, X., Guo, H., Lian, L., Liu, F., and Li, B. (2017). The spatial pattern of water yield and its driving factors in nansi lake basin. J. Nat. Resour. 32, 11. doi:10.11849/zrzyxb.20160460
Tang, X., Hao, X., Liu, Y., Pan, Y., and Li, H. (2016). Driving factors and spatial heterogeneity analysis of ecosystem services value. Trans. Chin. Soc. Agric. Mach. 47, 7.
Wartenberg, D. (1985). Multivariate spatial correlation: a method for exploratory geographical analysis. Geogr. Anal. 17, 263–283. doi:10.1111/j.1538-4632.1985.tb00849.x
Wei, H., and Guo, D. (2015). Dynamic change and its driving forces of alpine meadow ecosystem in Maqu, Gansu, China. J. Desert Res. 8, 33.
Xie, G., Lu, C., Leng, Y., Zheng, D., and Li, S. (2003). Ecological assets valuation of the Tibetan Plateau. J. Nat. Resour. (02), 189–196. doi:10.11849/zrzyxb.2003.02.010
Xing, L. (2018). Study on the spatio-temporal impacts of urbanization on the ecosystem services value and ecological sustainability assessment. Huazhong: Huazhong University of Science and Technology.
Xue, M., and Luo, Y. (2015). Dynamic variations in ecosystem service value and sustainability of urban system: a case study for Tianjin city, China. Cities 46, 85–93. doi:10.1016/j.cities.2015.05.007
Yang, C. (2018). Study on spatial-temporal differentiation of land ecosystem service value and driving factors in central plains urban agglomeration. Hebei: Hebei University of Economics and Business.
Yang, L., Yang, G., Yao, S., and Yuan, S. (2012). A study on the spatial heterogeneity of grain yield per hectare and driving factors based on ESDA-GWR. Econ. Geogr. 32, 7.
Yao, X., Zeng, J., and Li, W. (2015). Spatial correlation characteristics of urbanization and land ecosystem service value in Wuhan Urban Agglomeration. Trans. Chin. Soc. Agric. Eng. 31, 8.
Zhang, H., Wang, S., and Liu, Y. (2017). Research on spatial differentiation of land ecological quality and main controlling factors identification based on city scale:——a case study of Jiaozuo City. Agric. Res. Arid Areas 35, 9.
Zhang, P., Zhu, Y., Shi, Y., and Hu, Y. (2020). Chang-zhu-tan urban agglomeration regional plan (2008-2020) (2014 revision).
Zhao, Z., Wang, K., and Xie, X. (2014). Assessment on ecosystem services value of foothills county——taking taoyuan county of hunan province as an example. Hubei Agric. Sci. 53, 6. doi:10.14088/j.cnki.issn0439-8114.2014.06.068
Zhao, Z., Yu, D., Han, C., and Wang, K. (2017). Ecosystem services value prediction and driving forces in the Poyang Lake Ecoeconomic Zone. Acta Ecol. Sin. 37, 11. doi:10.5846/stxb201612042489
Keywords: ecosystem service, spatio-temporal evolution, influencing factors, spatial statistics, Changsha-Zhuzhou-Xiangtan urban agglomeration
Citation: Huang X, Xie Y, Lei F, Cao L and Zeng H (2024) Analysis on spatio-temporal evolution and influencing factors of ecosystem service in the Changsha-Zhuzhou-Xiangtan urban agglomeration, China. Front. Environ. Sci. 11:1334458. doi: 10.3389/fenvs.2023.1334458
Received: 07 November 2023; Accepted: 12 December 2023;
Published: 05 January 2024.
Edited by:
Xiao Ouyang, Hunan University of Finance and Economics, ChinaReviewed by:
Qimeng Ning, Hunan City University, ChinaCopyright © 2024 Huang, Xie, Lei, Cao and Zeng. This is an open-access article distributed under the terms of the Creative Commons Attribution License (CC BY). The use, distribution or reproduction in other forums is permitted, provided the original author(s) and the copyright owner(s) are credited and that the original publication in this journal is cited, in accordance with accepted academic practice. No use, distribution or reproduction is permitted which does not comply with these terms.
*Correspondence: Youping Xie, eHlwQGltZy5uZXQ=
Disclaimer: All claims expressed in this article are solely those of the authors and do not necessarily represent those of their affiliated organizations, or those of the publisher, the editors and the reviewers. Any product that may be evaluated in this article or claim that may be made by its manufacturer is not guaranteed or endorsed by the publisher.
Research integrity at Frontiers
Learn more about the work of our research integrity team to safeguard the quality of each article we publish.