 Rui Peng1
 Dan Wu
- 1School of Environmental Science and Engineering, Changzhou University, Changzhou, China
- 2Upper and Middle Yellow River Bureau, Yellow River Conservancy Commission, Xi’an, China
- 3Institute of Urban and Rural Mining Research, Changzhou University, Changzhou, China
In China, county-level regions play a pivotal role in achieving dual carbon goals. In this study, we analyzed the spatiotemporal characteristics of carbon balance coefficients for counties in Jiangsu Province from 2000 to 2021. The logarithmic mean Divisia index decomposition method explored the factors influencing county-level carbon balance. The findings indicated that CO2 emissions in Jiangsu Province increased from 192 million tons in 2001 to 637 million tons in 2011 and exhibited a small fluctuation from 2012 to 2021. A “higher in the south, lower in the north” distribution pattern emerged, with high CO2 emission areas concentrated in the economically developed south. Vegetative carbon sequestration increased from 142 million tons in 2000 to 171 million tons in 2021 with a “higher boundary and lower at the center” distribution pattern. High carbon sequestration areas were mainly in regions with abundant natural resources and vegetation. The number of counties experiencing carbon imbalance rose from 63 in 2000 to 95 in 2021, with a spatial distribution similar to high carbon emissions. Economic development and urbanization accelerated carbon imbalance, whereas technological advancement and reduced regional carbon fixation pressure effectively alleviated it. Pursuing of dual carbon goals can be supported by reducing emissions and increasing carbon sinks.
1 Introduction
Given the notable increase in frequency and intensity of extreme weather events over the past 4 decades, the international community has gradually reached a consensus on countering climate change through emission reduction and carbon mitigation (Senshaw and Kim, 2018; Mei et al., 2020; Cao et al., 2021). This consensus has led to the establishment of institutional arrangements and action plans, including the United Nations Framework Convention on Climate Change, the Kyoto Protocol, and the Paris Agreement (Chan et al., 2018). Against this backdrop, in September 2020, China proposed its strategic objectives for achieving carbon peaking by 2030 and carbon neutrality by 2060 (hereinafter referred to as the dual carbon goals). Jiangsu Province is a key region of rapid development in the Yangtze River Delta region. While high-carbon industry contributes to economic development, it also brings a lot of energy consumption and carbon emission pollution. As a province with a significant economic scale and quality, it bears a crucial responsibility demonstrate the implementation of the dual carbon goals strategy. County-level regions serve as fundamental administrative units for economic development and industrial transition (Hu et al., 2019; Liu and Xue, 2021). Some regions constitute a significant component of China’s carbon emissions and play a major role in carbon sink functions. Moreover, they are key administrative units for implementing the dual carbon goals and relevant policies. Exploring the pathways for achieving dual carbon goals at the county level is profoundly significant for comprehensive green transformation during economic and social development (Zhang et al., 2015; Li et al., 2022).
As human energy consumption intensifies, the impact of land use changes and anthropogenic carbon emissions on regional carbon balance has increased (Fu et al., 2012; Li et al., 2019). Accounting for the regional carbon emissions and sequestration is the foundation for carbon balance analysis. Scholars worldwide have conducted carbon emission accounting at different scales and scopes. Commonly used methods include carbon emission coefficient (Shan et al., 2016), material balance, and direct measurement (Liu et al., 2014). With the increasing availability of remote sensing data, the simulation and estimation of carbon emissions using nighttime light data have become one of the prevailing methods for estimating multi-scale carbon emissions (Shi et al., 2016; Sun et al., 2020; Wang et al., 2022). Scholars have widely adopted this approach to estimate carbon emissions in energy consumption. Methods for assessing carbon sequestration primarily include ground surveys (Beets et al., 2014), flux monitoring (Beers et al., 2013), and modeling simulations (Tao et al., 2005). Despite variations in the size of carbon sinks reported in different studies, most suggest that terrestrial ecosystems serve as significant carbon sinks (Yang et al., 2022). The net primary productivity of vegetation is a key indicator for assessing vegetation recovery and degradation. It is essential in regulating ecological environment, mitigating greenhouse effects, and balancing carbon cycling (Song et al., 2018). Carbon emission and sequestration accounting can assess energy consumption and regional carbon sink conditions. Comprehensively evaluating and balancing the relationship between carbon emissions and sinks is necessary to achieve a low-carbon sustainable development model for carbon neutrality. In this context, scholars have proposed analyses such as carbon footprints, budgets, and offsetting to explore the spatiotemporal evolution characteristics between regional carbon emissions and sequestration (Chuai et al., 2012; Zhao et al., 2014; Wang et al., 2017). Based on these analyses, they have employed evaluation methods, such as the carbon emission Gini coefficient (Chen et al., 2016), carbon emission economic contribution coefficient, carbon emission ecological carrying capacity coefficient (Lu et al., 2012), and standard revealed comparative advantage index, in conjunction with land spatial optimization, land use changes, functional zoning, and carbon trading, to present zonal schemes, emissions reduction and carbon sink enhancement suggestions for different regions.
Regarding methods for selecting influencing and driving factors, earlier studies focused primarily on the relationship between economic development and environmental pollution. Many research results validated the existence of the Environmental Kuznets Curve phenomenon. Subsequently, various methodologies such as the Kaya model, logarithmic mean Divisia index (LMDI) decomposition, stochastic impacts by regression on population, affluence and technology model (STIRPAT), least squares regression, spatiotemporal geographic weighted regression model. Furthermore, geographic detectors have expanded the scope of driving factors to the socioeconomic and institutional domains (Li et al., 2012; Wang et al., 2018; Yang et al., 2019; Hu et al., 2020; Xu et al., 2022). Factors considered include population density, urbanization level, industrial structure, energy structure, degree of opening-up, technological level, land use, environmental regulations, and government intervention. LMDI decomposition is unaffected by period and duration. It offers the advantage of eliminating residual terms and intuitive results (Li et al., 2020). Therefore, this approach has been widely applied for carbon emission factor decomposition.
In summary, previous research outcomes hold significant reference value for carbon balance studies, providing important perspectives and methodological inspirations for regional carbon balance analysis. Because of the incomplete statistical data at the county level and the difficulty in obtaining most indicator data, current research tends to focus on large-scale, short-term studies of CO2 emissions or fixation. Fewer studies have analyzed the long-term spatiotemporal characteristics of CO2 emissions and fixation. Besides, literature addressing zonal strategies for emissions reduction and carbon sink enhancement within the context of carbon balance across regions is relatively limited. To fill these gaps, this study focuses on individual districts and counties within Jiangsu Province. Publicly available long-term nighttime light data and net primary productivity data of vegetation were employed to estimate county-level CO2 emissions and sequestration. Therefore, in this study, the characteristics of carbon emissions, carbon sequestration, and spatiotemporal evolution of carbon balance in Jiangsu Province from 2000 to 2021 were systematically analyzed at the county level. LMDI decomposition was used to examine the main factors influencing carbon balance over different periods. Based on carbon balance zoning, regional characteristics, such as ecological environment, economic development, and resource utilization were fully considered to propose differentiated low-carbon optimization strategies to provide theoretical foundations for formulating targeted and actionable measures and recommendations for emissions reduction and carbon sink enhancement at the county level. The aim of this study was to provide decision-making references for enhancing emissions reduction paths and formulating zonal low-carbon development policies.
2 Data and methods
2.1 Study area
Jiangsu Province is situated in the central part of China’s eastern coastal region, adjacent to the Yellow Sea. It spans from 30°45′ to 35°08′ north and 116°21′ to 121°56′ east. The province borders Shandong to the north, Anhui to the west, and Shanghai and Zhejiang to the southeast. Jiangsu is a vital component of the Yangtze River Delta region. Covering an area of 107,200 km2, the province comprises 13 prefecture-level cities and 95 county-level regions, including 19 counties, 21 county-level cities, and 55 municipal districts. The province is divided into three parts: Southern Jiangsu (Nanjing, Wuxi, Changzhou, Suzhou, Zhenjiang), Central Jiangsu (Nantong, Yangzhou, Taizhou), and Northern Jiangsu (Xuzhou, Lianyungang, Huai’an, Yancheng, Suqian). As of the end of 2022, the province had a resident population of 85.15 million people, 74.4% of whom live in urban areas, and its gross regional domestic product reached an RMB of 12,287.6 billion yuan.
2.2 Data sources
Provincial-level CO2 emission data for energy consumption of Jiangsu Province from 2000 to 2021 were sourced from Carbon Emission Accounts & Datasets (www.ceads.net), which boast continuity, uniformity, and completeness. Concurrently, improved time-series DMSP-OLS-like data in China by integrating DMSP-OLS and SNPP-VIIRS spanning 2000–2021 were collected from Dataverse (https://dataverse.harvard.edu). The gridded yearly net primary productivity (NPP) MOD17A3 products (2000–2021) were obtained from NASA EOS DATA (https://modis.gsfc.nasa.gov/data/). Socioeconomic data were collected from Jiangsu Statistical Yearbooks and statistical yearbooks of various prefecture-level cities released during the study period.
2.3 Methods
2.3.1 Carbon balance accounting
Carbon emissions of this paper refer to CO2 emissions. The idea of total allocation is adopted to fully consider the dynamic changes in the relationship between nighttime light data and carbon emissions. The nighttime light dataset is employed to allocate provincial carbon emissions to the 95 county-level regions based on the proportion of nighttime light values relative to the entire province. The model is as follows:
where Cit represents carbon emissions of the i-th county in the t-th year, Ct represents carbon emissions of Jiangsu Province in the t-th year, DNit represents nighttime light value of the i-th county in the t-th year.
Carbon sequestration is the process of capturing and storing carbon dioxide by terrestrial vegetation from the atmosphere. Forests, for example, act as natural carbon sinks by absorbing carbon dioxide through photosynthesis and storing it in the biomass and soil. Each gram of dry matter can fix 1.62 g of carbon dioxide, and the carbon content in dry matter accounts for approximately 45% of the total NPP. Based on the NPP data products, county-level carbon sequestration by vegetation is estimated using the conversion coefficient of vegetation biomass to CO2 absorption (Chen et al., 2020), which can be expressed as follows:
where Nit represents the carbon sequestration of vegetation of the i-th county in the t-th year, and NPPit represents the net primary productivity of the i-th county in the t-th year.
The carbon balance coefficient (Q) refers to the ratio between regional annual carbon emissions (C) and vegetative carbon sequestration (N). This indicator synthetically measures the relationship between carbon emissions and carbon sequestration and assesses the equilibrium between carbon emissions resulting from human activities and carbon absorption by natural ecosystems over a specific period. When the carbon balance coefficient exceeds 1, carbon emissions within the region surpass vegetative carbon sequestration. A coefficient of 1 signifies a balanced state between carbon emissions and vegetative carbon sequestration, which is ideal. A coefficient below 1 implies that the carbon dioxide emissions within the region are entirely absorbed by terrestrial vegetation. Analyzing the carbon balance coefficient across spatiotemporal scales provides foundational references for regional low-carbon sustainable development, spatial planning, and environmental assessment systems.
2.3.2 Influencing factors decomposition
The basic idea of LMDI is to decompose the contribution of each factor by using logarithmic transformation and mean logarithmic difference. LMDI decomposition is a method unaffected by period, eliminates residual terms, and provides intuitive decomposition results (Cansino et al., 2015), which has been widely used in the fields of energy and environmental economics, sustainable development research. The spatiotemporal evolution of carbon balance is a complex process influenced by factors such as economy, policies, technological development, and environmental regulations. Combined with the previous research and availability of indicator data, in this study, a carbon balance influencing factor decomposition model for the Jiangsu Province was constructed based on four factors, namely, technological advancement, economic development level, urbanization level, and regional carbon fixation pressure. The model is formulated as follows:
where i is a county-level region, C is carbon emissions in energy consumption, G is gross domestic product (GDP), P is population size, S is regional area, and N is vegetative carbon sequestration. In accordance with the LMDI method’s additive decomposition formula, the detailed decomposition is as follows:
where △Q is the variation of the carbon balance coefficient, and Qt and Q0 are the carbon balance coefficients for year t and the baseline year, respectively. △CI, △R, △I, and △M are the effects of technological advancement, economic development level, urbanization level, and regional carbon fixation pressure on carbon balance, respectively.
2.3.3 Economy contributive coefficient and ecological support coefficient
The economy contributive coefficient (ECC) of carbon emissions evaluates the differentiation of regional carbon emissions from an economic perspective to reflect the amount of carbon productivity of the region (Lu et al., 2012). The model is as follows:
where Gi and Ci are the GDP and carbon emissions at a county-level region in Jiangsu, respectively, and G and C are the GDP and total carbon emissions of Jiangsu Province, respectively. An ECC greater than 1 indicates that a region’s economic contribution rate surpasses its carbon emission contribution rate, indicating relatively high carbon productivity and energy utilization efficiency. The inverse is also true.
The ecological support coefficient (ESC) reflects the carbon sequestration capability of a region. It is the carbon absorption of a region proportionate to that of the entire province, divided by the carbon emissions of that region proportionate to that of the entire province (Lu et al., 2012). The model is as follows:
where Ni and Ci are the carbon sequestration and carbon emissions for a county-level region in Jiangsu Province, respectively. N and C are the province’s total carbon sequestration and total carbon emissions, respectively. An ESC greater than 1 signifies that a region’s carbon absorption contribution rate surpasses its carbon emissions contribution rate, indicating relatively high carbon compensation efficiency. The inverse is also true.
3 Results
3.1 Spatiotemporal analysis of county-level carbon emissions
The carbon emissions at the county level in Jiangsu Province exhibited a spatial distribution pattern of “higher in the south and lower in the north” (Figure 1). Regions with high carbon emissions were mainly concentrated in southern Jiangsu, including areas such as Changshu and Kunshan in Suzhou, Jiangyin in Wuxi, Jiangning District in Nanjing, and Wujin District in Changzhou. Sporadic high-emission regions in certain central and northern Jiangsu county-level regions were also observed. The distribution of high-emission regions correlated significantly with population size, economic development, and industrial structure. Low-emission regions were primarily located in urban areas and counties/districts dominated by agriculture or tourism, such as Gusu District in Suzhou, Liangxi District in Wuxi, Gulou District in Nanjing, Tianning District in Changzhou, Quanshan and Gulou Districts in Xuzhou, Hongze District, Xuyi and Jinhu County in Huai’an, and Dongtai County in Yancheng. Carbon emissions in these regions exhibited relatively minor fluctuations from 2000 to 2021. The spatial distribution pattern of county-level carbon emissions in Jiangsu Province has gradually stabilized over time, with an increasing spatial clustering trend. Carbon emission distribution has changed only minimally in southern Jiangsu since 2010. However, increased economic development has led to higher energy consumption in central and northern Jiangsu, resulting in a shift of high-emission regions from south to north.
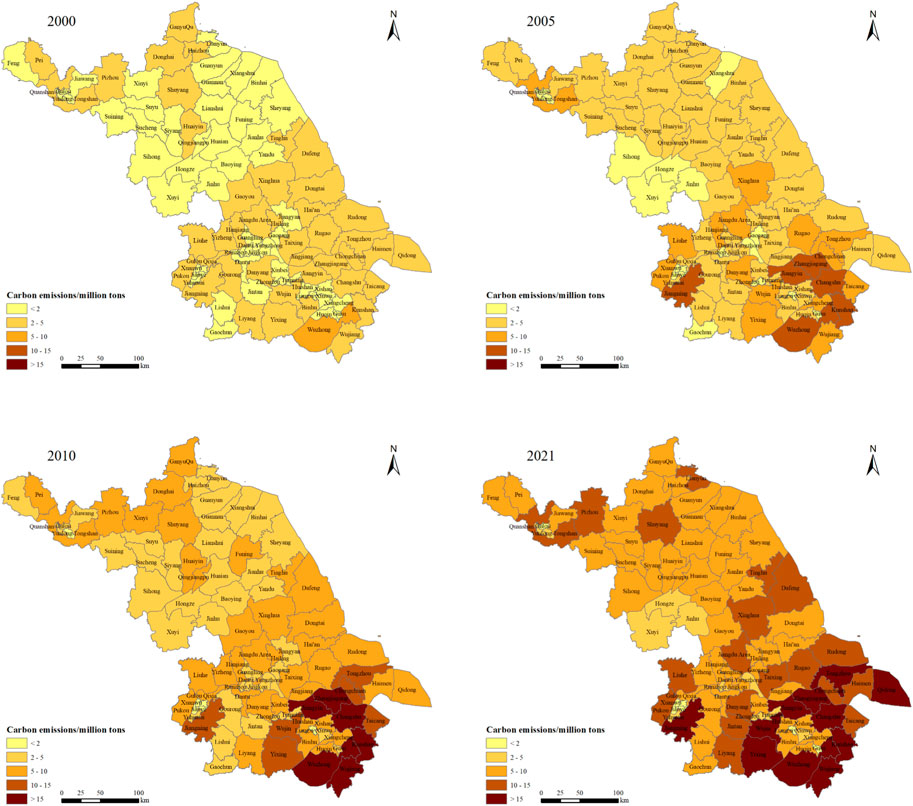
FIGURE 1. Spatial distribution of county-level carbon emissions in Jiangsu Province from 2000 to 2021.
When considering the changes in per capita carbon emissions, a general increasing trend was observed across counties in Jiangsu Province, with noticeable north-south spatial disparities. However, the carbon emission intensity varied. From 2000 to 2021, the average per capita carbon emissions in county-level regions of Jiangsu Province increased from 3.3 tons in 2000 to 10.8 tons in 2021. This is reflected in a growth rate of 166.2% from 2000 to 2010 and a growth rate of 23.6% from 2010 to 2021. In contrast, the average carbon emission intensity exhibited a decreasing trend from 9.7 tons/RMB ten thousand yuan in 2000 to 0.9 tons/RMB ten thousand yuan in 2021, with intermediate values in 2005 (5.6 tons/RMB ten thousand yuan) and 2010 (3.2 ton/RMB ten thousand yuan). A notable relationship was detected between carbon emissions and population, economic development, and industrial structure. Despite the relatively high carbon emissions in southern Jiangsu, this economically developed region demonstrated a gradual reduction in carbon emission intensity because of the optimization of industrial structure and technological advancement.
3.2 Spatiotemporal analysis of county-level vegetative carbon sequestration
At the county level in Jiangsu Province, the spatial distribution of vegetative carbon sequestration displayed a characteristic pattern of “higher around the periphery and lower towards the center,” which remained relatively stable over the study period (Figure 2). High carbon sink zones were centered around eastern regions such as Dafeng District, Sheyang County, and Dongtai City in Yancheng, as well as Rudong County in Nantong (3.62–4.89 million tons). Western high carbon sink areas (2.95–4.43 million tons) included Sihong County in Suqian and Xuyi County in Huai’an. Northern high carbon sink areas (3.37–4.43 million tons) radiated from Muyang County in Suqian. Southern high carbon sink areas (2.05–3.23 million tons) were primarily situated in Yixing in Wuxi and Liyang in Changzhou. On average, Dafeng District, Dongtai City and Sheyang County in Yancheng fixed more than 4 million tons of carbon each year. This is attributed to their significant natural conservation areas and good ecological resources, which lead to relatively high vegetative carbon fixation capacities. Conversely, regions with low vegetative carbon sequestration were concentrated in urban areas such as Gulou District in Nanjing, Liangxi District in Wuxi, and Gusu District in Suzhou. Despite minor spatial variations in the distribution of vegetative carbon sequestration, considerable differences in annual growth rates were evident among county-level regions.
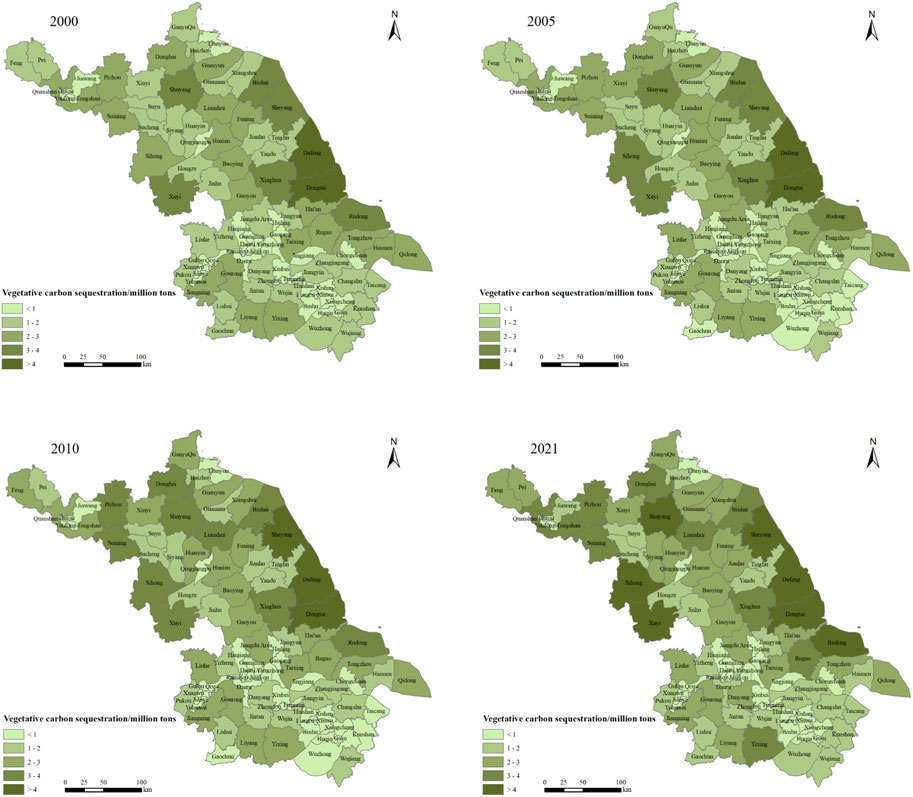
FIGURE 2. Spatial distribution of county-level vegetative carbon sequestration in Jiangsu Province from 2000 to 2021.
Regarding vegetative carbon sequestration, the number of county-level regions with carbon sequestration less than 100 million tons or within the range of 100–200 million tons decreased annually. In particular, the number of regions within the 100–200 million tons range decreased profoundly from 33 in 2000 to 24 in 2021. Conversely, the number of county-level regions with carbon sequestration exceeding 200 million tons has consistently increased from 29 in 2000 to 40 in 2021. These results indicated that vegetative carbon sequestration is primarily realized by forests, followed by agricultural land and shrubs. The carbon sequestration in county-level regions of Jiangsu Province was closely related to vegetation coverage and types. Counties that fixed more carbon tended to have greater forest coverage or larger proportions of agricultural and wetland areas.
3.3 Spatiotemporal analysis of county-level carbon balance
From 2000 to 2021, the overall carbon emissions in Jiangsu Province displayed an upward trend, increasing from 199 million tons in 2000 to 847 million tons in 2021, representing a growth rate of approximately 325.63%. A peak of 847 million tons was reached in 2021 (Figure 3). The period from 2001 to 2011 witnessed rapid growth in carbon emissions, aligning with a phase of rapid and extensive economic development. Subsequently, from 2012 to 2021, carbon emissions experienced a noticeable deceleration, with an average annual growth rate of 2.87%. This shift can be attributed to policies such as the ecological civilization concept, high-quality development, and the Beautiful Jiangsu Construction, which effectively promoted the transition to a low-carbon industrial structure, synergistic pollution control and carbon reduction, and higher industrial efficiency. The total vegetative carbon sequestration in Jiangsu Province fluctuated from 142 million tons in 2000 to 171 million tons in 2021, representing an increase of approximately 20.42% and an average annual growth rate of 0.89%. The overall changes were not significant.
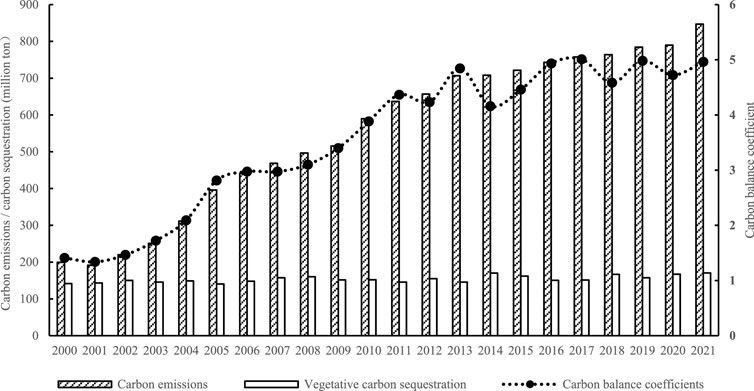
FIGURE 3. Changes in carbon emissions, vegetative carbon sequestration, and carbon balance coefficients in Jiangsu Province from 2000 to 2021.
From 2000 to 2021, county-level carbon balance coefficients varied considerably with an average annual growth rate of 6.18%. From 2001 to 2011, a swift ascent of nearly 226% in carbon balance coefficients occurred, increasing from 1.34 to 4.37. The average annual growth rate stood at 12.55%. After 2011, carbon balance coefficients remained stable within the range of 4.23–5.01, with an average annual growth rate of 1.29%. This suggests that Jiangsu Province has achieved success in low-carbon development since 2011. However, carbon emissions resulting from energy consumption far outweighed the vegetation carbon sequestration. Thus, further developing resource-efficient and environmentally protective industrial structures, production methods, and lifestyles is necessary to achieve the dual carbon goals on schedule. A transition toward ecologically conscious, green, and low-carbon high-quality development is urgently needed.
From 2000 to 2021, the carbon imbalance among prefecture-level cities in Jiangsu Province worsened annually (Figure 4). In southern Jiangsu, the average annual growth rate of carbon balance coefficients was 6.3%, with 6.5% in central Jiangsu and 6.0% in northern Jiangsu. Among these cities, Nantong exhibited the highest average annual growth rate of carbon balance coefficients at 7.36%, followed by Suzhou (6.96%) and Yancheng (6.88%). The lowest growth rate was observed in Yangzhou (5.02%).
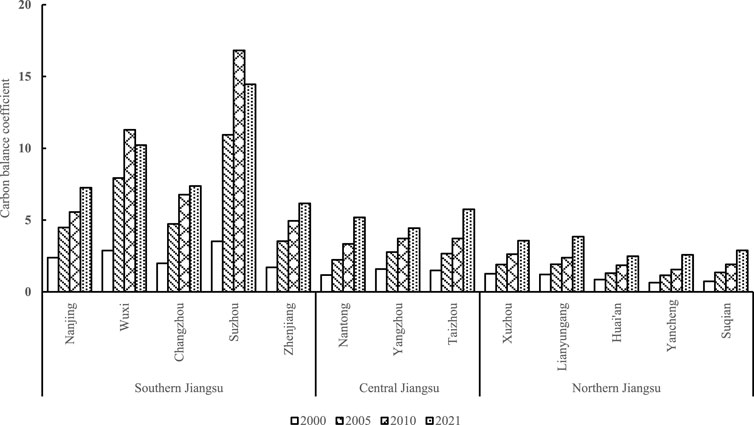
FIGURE 4. Changes in carbon balance coefficients among prefecture-level cities in Jiangsu Province from 2000 to 2021.
The spatial and temporal variations in county-level carbon balance coefficients in Jiangsu Province provide insight into the severity of carbon imbalance across various regions (Figure 5). From 2000 to 2021, the six county-level regions with the most severe carbon imbalances were Gulou and Qinhuai Districts in Nanjing, Gusu District in Suzhou, Liangxi District in Wuxi, and Gulou and Quanshan Districts in Xuzhou. Counties maintaining a favorable carbon balance include Xuyi County in Huai’an, Sihong County in Suqian, Sheyang County and Dongtai City in Yancheng. Although the carbon imbalance in Quanshan District in Xuzhou was among the most severe in northern Jiangsu, it boasted the lowest average annual growth rate of carbon balance coefficients (0.66%) among the northern counties. In central Jiangsu, Jiangdu District in Yangzhou realized the lowest average annual growth rate of carbon balance coefficients (4.6%). Notably, Gulou District in Nanjing had the lowest average annual growth rate of carbon balance coefficients at −1.96% in the province.
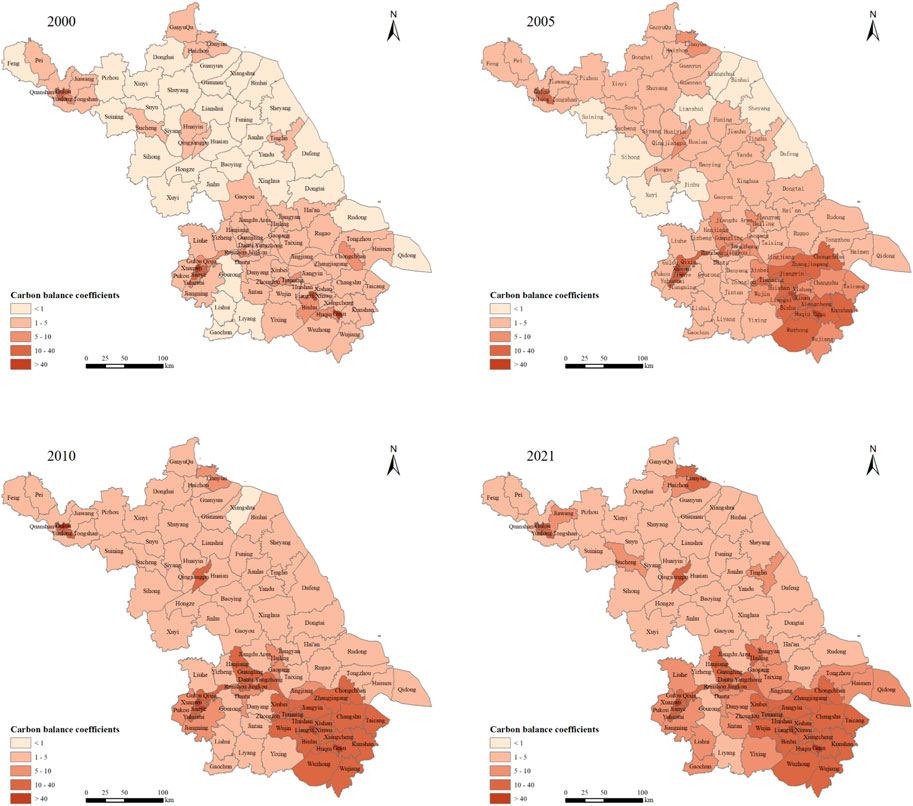
FIGURE 5. Spatial distribution of county-level carbon balance coefficients in Jiangsu Province from 2000 to 2021.
Overall, changes in the levels of carbon balance coefficients in county-level regions of Jiangsu Province predominantly occurred in the ranges of less than 1 and 10–40. The regions with carbon balance coefficients less than 1 decreased from 32 in 2000 to 0 in 2021. In contrast, the number of regions within the 10–40 range increased from 5 in 2000 to 34 in 2021. Evidently, the number of severely carbon-imbalanced regions in Jiangsu Province has increased over the years with rapid socioeconomic development, exacerbating the carbon imbalance issue.
4 Discussion
4.1 Analysis of factors influencing county-level carbon balance
Utilizing the LMDI model, the driving factors behind carbon balance in Jiangsu Province were decomposed. Based on the preceding formulas, the driving effects of various factors on carbon balance in different county-level regions of Jiangsu Province during the years 2000–2021 were calculated. The impact of different influencing factors on carbon balance in the periods 2000–2010 and 2011–2021 were compared (Figure 6). The inhibitory effect of technological advancement intensified, whereas the promoting effect of economic development level showed fluctuations. The urbanization level exhibited an overall promoting trend, with sporadic inhibitory effects observed in certain regions. The strength of the effects varied over the study period. Among the four influencing factors, urbanization level contributed the least to carbon balance. Notably, the regional carbon fixation pressure gradually diminished. Its influence on carbon balance transitioned from positive to negative, and strengthened. The contribution of regional carbon fixation to carbon balance surpassed that of the urbanization level.
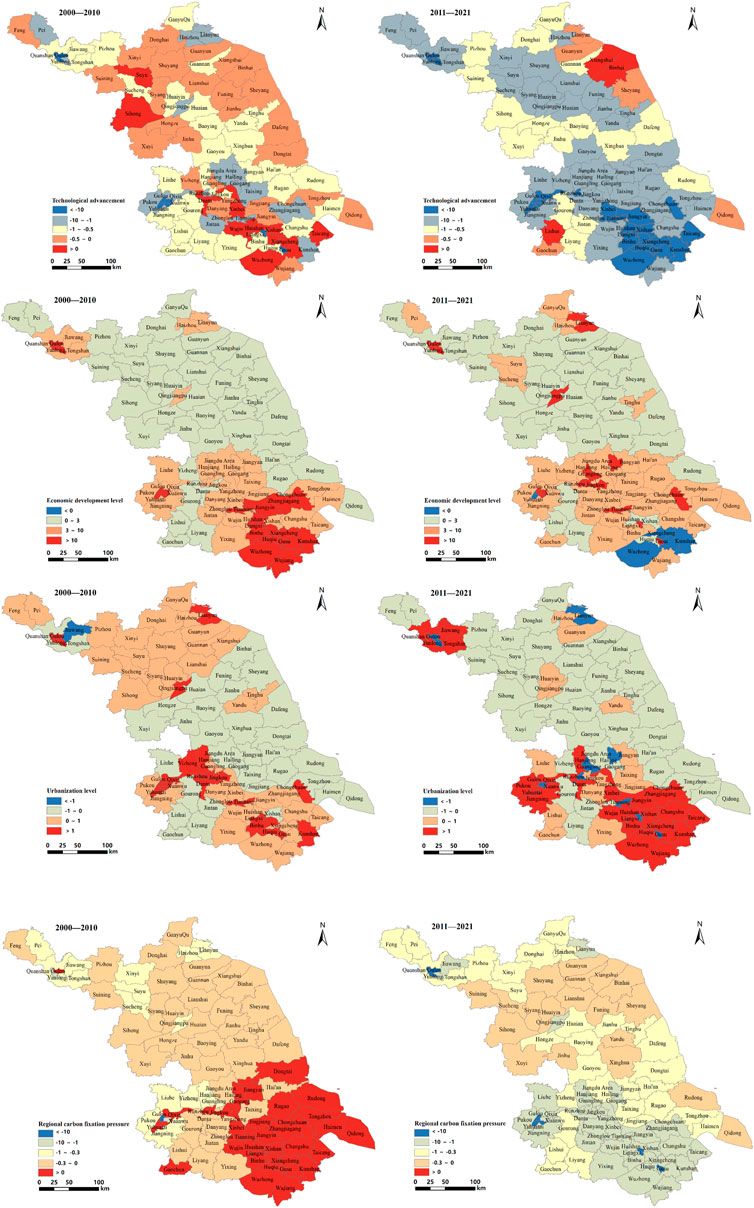
FIGURE 6. Decomposition effects of carbon balance coefficients in Jiangsu Province from 2000 to 2010 and 2011 to 2021.
From 2000 to 2021, carbon balance coefficients fluctuated in various county-level regions, albeit by varying degrees. The inhibitory effect of technological advancement continued to strengthen, leading to the accumulation of county-level regions exhibiting significant reductions in carbon emission intensity. Southern Jiangsu experienced the most rapid technological progress. To accelerate integration with southern Jiangsu, central Jiangsu adjusted its economic structure and fostered innovative industrial development models. Consequently, the technological advancement effect in this region ranked second only to southern Jiangsu. In contrast, northern Jiangsu faced an economic lag and relatively weaker radiation from the technologically advanced southern Jiangsu, leading to limited technological innovation capacity and slow improvement in technological levels within certain county-level regions.
The increasing economic development level increased the carbon balance coefficients, particularly in southern Jiangsu, from which the increasing trend extended to central Jiangsu. This promoting effect initially escalated before diminishing and was driven by the slowing economic development in southern Jiangsu and its successful transition to greener industries, leading to a gradual reduction in the promoting effect of economic growth on carbon imbalance. The migration of high-energy-consuming industries to central and northern Jiangsu accelerated their economic development and industrial upgrading.
The urbanization level exhibited differing effects across county-level regions in Jiangsu Province. Urbanization promoted the carbon imbalance in densely populated areas, whereas in sparsely populated regions, the effect was the opposite. In terms of regional distribution, urbanization mainly promoted carbon imbalance in southern Jiangsu, exhibited relatively stable and inhibitory effects in central Jiangsu, and demonstrated an initial stimulating effect followed by inhibition in most of northern Jiangsu, except Xuzhou and some districts/counties in Lianyungang. This disparity indicated that the urbanization process in southern Jiangsu, driven by rapid population and labor force growth, expanded resource consumption and consequent carbon emissions. In contrast, the urbanization process in central and northern Jiangsu initially suppressed carbon imbalance by inducing significant population outflows toward economically developed cities. As urbanization continued to advance, certain cities with robust development attracted a substantial influx of migrants, leading to a carbon imbalance. Overall, the impact of urbanization level on carbon balance remained relatively unstable, evolving with changes in time and space.
The impact of regional carbon fixation pressure exhibited inhibitory effects across various county-level regions with a gradually expanding range of influence. Regarding spatial distribution, southeastern counties and districts in Jiangsu Province experienced substantial variations in the effect of carbon fixation pressure, transitioning from promoting to strong inhibiting effects. Other counties and districts exhibited sustained inhibitory effects. This difference is primarily because county-level regions with higher urbanization levels have continuously enhanced green space ecosystem quality and vegetation coverage in urban areas. Conversely, regions with predominant agricultural focus exhibited minimal changes in greening projects and vegetation coverage. Afforestation and intensified agricultural management contributed to reducing regional carbon fixation pressure, giving play to the inhibitory effects of vegetative carbon fixation. In later stages, the inhibitory effects became significant, emerging as a pivotal factor in mitigating carbon imbalance.
4.2 County-level carbon balance zoning and low-carbon optimization strategies
By integrating indicators such as carbon emissions, carbon sequestration, and economic contributive coefficient and ecological support coefficient (Zhao et al., 2014), Jiangsu Province’s county-level regions were categorized into four zones: high carbon control zone, high carbon optimization zone, low carbon development zone, and low carbon economic zone (Table 1; Figure 7).
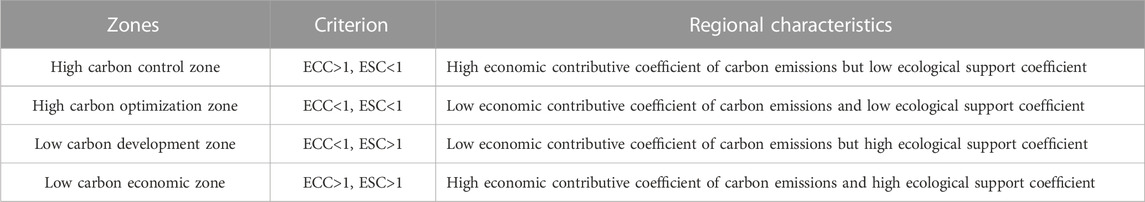
TABLE 1. Criteria for carbon balance zoning.
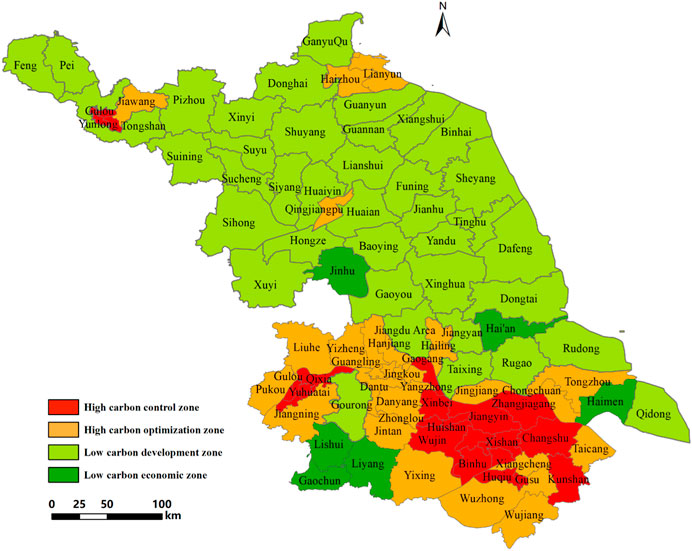
FIGURE 7. County-level carbon balance zoning in Jiangsu Province.
Carbon balance zoning optimizes coordinated emission reduction and low-carbon development of Jiangsu Province. Tailored low carbon optimization strategies are proposed considering the carbon balance influencing factors and the unique development characteristics of each county-level region.
In counties and districts falling within the high carbon control zone, carbon emissions contribute significantly to the economy but insignificantly to ecology because of their low carbon fixation capacity, leading to severe carbon imbalances. Spatially, these areas are mainly situated in counties/districts with highly developed economy and industry in southern Jiangsu. Overall, these counties/districts boast well-established economic foundations, and their industrial structure predominantly comprises secondary and tertiary industries. To address carbon imbalance, these regions should gradually transition their industries towards low-carbon sectors such as advanced technology, new materials, and renewable energy. By leveraging their economic influence and radiance, they can stimulate economic and industrial upgrades in surrounding regions, fostering regional sustainable low-carbon development. Additionally, while preserving existing natural resources, these counties/districts should enhance urban forestation, green spaces, scenic waterways, rooftop greening, and vertical landscaping to expand green ecological areas and bolster carbon fixation capabilities.
In counties/districts within the high carbon optimization zone category, carbon emissions contribute insignificantly to the economy and ecology. These counties/districts face higher carbon emission intensity than the high carbon control zone. Concentrated in scattered locations within central and northern Jiangsu, these counties/districts are predominantly distributed around the high carbon control zone in southern Jiangsu. To address carbon imbalance, high-pollution enterprises should be gradually phased out, particularly those contributing to high carbon emission intensity. This would change the energy consumption structure and enhance energy utilization efficiency. Next, developing innovative economies and transitioning towards sustainable growth models should be prioritized. This can be achieved through heightened investment in technology, cultivation of low-carbon technologies, and active promotion of strategic emerging industries. These efforts lead to a high-tech, economically beneficial, resource-efficient, low-pollution, and human-resource-optimized innovative economic development trajectory. Finally, economic development should be coordinated with ecological protection by reinforcing and enhancing the carbon sink capacity of the local ecosystem, including expanding forest and grassland carbon sinks and increasing investment in ecological environmental protection.
The low carbon development zone involves counties/districts where carbon emissions contribute insignificantly to economy. However, the ecological contribution of carbon emissions is rather high because these counties/districts possess abundant natural resources. These areas play a pivotal role in guaranteeing the high-quality low-carbon development of the entire province. On the premise of stabilizing carbon sink sources and alleviating the provincial carbon balance pressure, northern Jiangsu should emphasize green agriculture and develop new service sectors such as ecological tourism, rehabilitation, health, and leisure. Central Jiangsu, leveraging its regional advantages and radiation from the technologically advanced southern Jiangsu, should foster advanced industries, encourage industrial upgrading, and reduce carbon emission intensity. Moreover, these counties/districts could explore low-carbon energy sources, such as solar, wind, and biomass, to steer energy consumption towards low-carbon alternatives. In future development, the protection of natural reserves, scenic spots, forests, parks, and other eco-friendly areas should be prioritized, minimizing the impact of economic development on the environment to ensure balanced regional economic and environmental growth.
Counties and districts within the low carbon economic zone display relatively high economic and ecological contribution rates of carbon emissions, reflecting a balanced development between economy and ecology. They demonstrate lower carbon emission intensity than the low carbon development zone. In addition to maintaining carbon sink capabilities, these counties/regions should customize their low-carbon industries based on local conditions. Developing eco-friendly tourism, modern agriculture, and other low-carbon industries can establish them as exemplars of province-wide carbon reduction efforts.
4.3 Sustainable implementation path in achieving the dual carbon goals
At the provincial level, Jiangsu Province ranked third in China regarding carbon emissions per unit area in 2021 and had a moderate position in vegetative carbon sequestration per unit area nationwide. The carbon balance coefficient ranked fourth nationally, surpassing economically developed provinces such as Guangdong and Zhejiang. From a temporal perspective, although carbon emissions of Jiangsu Province have stabilized in recent years, carbon reduction faced significant challenges regarding energy consumption and carbon emissions, owing to the prolonged dominance of heavy industries in terms of economic benefits. Counties and districts with high carbon emissions are crucial for carbon reduction and potential transformation. Promoting tailored green and low-carbon industrial transformations, continuously optimizing industrial structures and layouts, comprehensively enhancing energy and resource utilization efficiency, pursuing breakthroughs of key technologies, and reducing carbon emissions at the very source are highly recommended. In addition, a comprehensive system for enhancing and consolidating ecological carbon sinks should be established, reinforced by rigorous land and space planning and usage control. Adhering to ecological protection redlines, while ensuring the stability of existing carbon-fixing elements such as forests and wetlands, is imperative. Simultaneously, significant ecological protection and restoration projects should be implemented. This involves integrated protection and restoration of mountains, waters, forests, farmlands, lakes, and grasslands. These changes will enhance the increment of the ecosystem’s carbon sink, advancing the process of achieving the dual carbon goals through both carbon reduction and carbon sink enhancement.
5 Conclusion
Through establishing carbon balance coefficients and analyzing spatiotemporal variations in carbon balance from 2000 to 2021, this study provides insights into the carbon balance characteristics of Jiangsu Province. The LMDI decomposition was adopted to examine the primary factors influencing carbon imbalance. Based on this, a county-level carbon balance zoning scheme was proposed for the 95 county-level regions in Jiangsu Province. Considering local ecological environments, economic development, and resource utilization, tailored low-carbon optimization strategies were formulated for each zone. The main conclusions are as follows.
(1) The carbon emission levels in Jiangsu Province exhibited a “higher in the south and lower in the north” distribution pattern, with increasing spatial concentration. The regions represented by Nanjing urban area, certain county-level regions in the Suzhou-Wuxi-Changzhou metropolitan area, and the central area of northern Jiangsu are high carbon emission zones in Jiangsu Province with considerable potential for emission reduction. High carbon sink areas were mainly distributed in the eastern coastal counties and districts such as Yancheng (Sheyang County, Dafeng District, and Dongtai City) and Rudong County in Nantong, and in western regions dominated by agriculture, such as Suqian’s Sihong County and Xuyi County in Huai’an.
(2) The fluctuation and changes in county-level carbon balance coefficients from 2000 to 2021 were similar to those of carbon emissions. The carbon imbalance levels of some county-level regions changed over time. Spatially, the number of carbon-imbalanced county-level regions in Jiangsu Province increased from 63 in 2000 to 95 in 2021. The ecosystem’s carbon sink capacity can no longer bear the pressure generated by carbon emissions.
(3) Economic development and urbanization levels accelerated the formation of carbon imbalance. The improvement in technological advancement and the reduction of regional carbon fixation pressure effectively mitigated this process, but the extent of their influence varied over time and space.
Data availability statement
Publicly available datasets were analyzed in this study. This data can be found here: Carbon Emission Accounts & Datasets (https://www.ceads.net.cn/), Harvard Dataverse (https://dataverse.harvard.edu), and NASA EOS DATA (https://modis.gsfc.nasa.gov/data/).
Author contributions
RP: Methodology, Resources, Writing–original draft. XT: Methodology, Resources, Writing–review and editing. DW: Conceptualization, Methodology, Writing–review and editing.
Funding
The author(s) declare financial support was received for the research, authorship, and/or publication of this article. This research was funded by the Strategic research and consulting project of the Chinese Academy of Engineering (2022-PP-03-06, 2022-JB-05-04) and Changzhou Key Laboratory of Biomass Green, Safe and High Value Utilization Technology (CM20223011).
Acknowledgments
The authors are grateful to the reviewers and editor for the positive and constructive comments and suggestions for this paper.
Conflict of interest
The authors declare that the research was conducted in the absence of any commercial or financial relationships that could be construed as a potential conflict of interest.
Publisher’s note
All claims expressed in this article are solely those of the authors and do not necessarily represent those of their affiliated organizations, or those of the publisher, the editors and the reviewers. Any product that may be evaluated in this article, or claim that may be made by its manufacturer, is not guaranteed or endorsed by the publisher.
References
Beers, L., Byrd, K. B., Windham-Meyers, L., and Kelly, M. (2013). Accounting for non-photosynthetic vegetation in remote-sensing-based estimates of carbon flux in wetlands. Remote Sens. Lett. 4, 542–551. doi:10.1080/2150704x.2013.766372
Beets, P. N., Kimberley, M. O., Oliver, G. R., and Pearce, S. H. (2014). The application of stem analysis methods to estimate carbon sequestration in arboreal shrubs from a single measurement of field plots. Forests 5, 919–935. doi:10.3390/f5050919
Cansino, J. M., Sánchez-Braza, A., and Rodríguez-Arévalo, M. L. (2015). Driving forces of Spain׳s CO2 emissions: a LMDI decomposition approach. Renew. Sust. Energ Rev. 48, 749–759. doi:10.1016/j.rser.2015.04.011
Cao, R., Huang, G. H., Chen, J. P., and Li, Y. P. (2021). A fractional multi-stage simulation-optimization energy model for carbon emission management of urban agglomeration. Sci. Total Environ. 774, 144963. doi:10.1016/j.scitotenv.2021.144963
Chan, G., Stavins, R., and Ji, Z. (2018). International climate change policy. Annu. Rev. Resour. Econ. 10, 335–360. doi:10.1146/annurev-resource-100517-023321
Chen, J. D., Cheng, S. L., Song, M. L., and Wang, J. (2016). Interregional differences of coal carbon dioxide emissions in China. Energ Policy 96, 1–13. doi:10.1016/j.enpol.2016.05.015
Chen, J. D., Fan, W., Li, D., Liu, X., and Song, M. L. (2020). Driving factors of global carbon footprint pressure: based on vegetation carbon sequestration. Appl. Energ 267, 114914. doi:10.1016/j.apenergy.2020.114914
Chuai, X. W., Lai, L., Huang, X. J., Zhao, R. Q., Wang, W. J., and Chen, Z. G. (2012). Temporospatial changes of carbon footprint based on energy consumption in China. J. Geogr. Sci. 22, 110–124. doi:10.1007/s11442-012-0915-4
Fu, C., Yu, G. R., Fang, H. J., and Wang, Q. F. (2012). Effects of land use and cover change on terrestrial carbon balance of China. Prog. Geog 31, 88–96. doi:10.11820/dlkxjz.2012.01.012
Hu, M. J., Li, R. Z., You, W. H., Liu, Y. B., and Lee, C. C. (2020). Spatiotemporal evolution of decoupling and driving forces of CO2 emissions on economic growth along the Belt and Road. J. Clean. Prod. 277, 123272. doi:10.1016/j.jclepro.2020.123272
Hu, X. Y., Zhang, Z. L., Chen, X. P., and Wang, Y. J. (2019). Geographic detection of spatial-temporal difference and its influencing factors on county economic development: a case study of Gansu province. Geogr. Res. 38, 772–783.
Li, H., Zhao, Y. H., Wang, S., and Liu, Y. (2020). Spatial-temporal characteristics and drivers of the regional residential CO2 emissions in China during 2000-2017. J. Clean. Prod. 276, 124116. doi:10.1016/j.jclepro.2020.124116
Li, H. N., Mu, H. L., Zhang, M., and Gui, S. S. (2012). Analysis of regional difference on impact factors of China's energy-Related CO2 emissions. Energy 39, 319–326. doi:10.1016/j.energy.2012.01.008
Li, W. L., Yang, G. F., and Li, X. N. (2019). Modeling the evolutionary nexus between carbon dioxide emissions and economic growth. J. Clean. Prod. 215, 1191–1202. doi:10.1016/j.jclepro.2019.01.100
Li, Z., Cai, Y. P., and Lin, G. (2022). Pathways for sustainable municipal energy systems transition: a case study of Tangshan, a resource-based city in China. J. Clean. Prod. 330, 129835. doi:10.1016/j.jclepro.2021.129835
Liu, M. D., Meng, J. J., and Liu, B. H. (2014). Progress in the studies of carbon emission estimation. Trop. Geogr. 34, 248–258. doi:10.13284/j.cnki.rddl.002502
Liu, S., and Xue, L. (2021). The spatio-temporal heterogeneity of county-level economic development and primary drivers across the Loess Plateau, China. J. Geogr. Sci. 31, 423–436. doi:10.1007/s11442-021-1851-y
Lu, J. Y., Huang, X. J., Liang, D., Chen, Z. G., and Li, Y. (2012). Spatio-temporal scale analysis on the equality of energy consumption carbon emission distribution in China. J. Nat. Resour. 27, 2006–2017.
Mei, H., Li, Y. P., Suo, C., Ma, Y., and Lv, J. (2020). Analyzing the impact of climate change on energy-economy-carbon nexus system in China. Energy 262, 114568. doi:10.1016/j.apenergy.2020.114568
Senshaw, D. A., and Kim, J. W. (2018). Meeting conditional targets in nationally determined contributions of developing countries: renewable energy targets and required investment of GGGI member and partner countries. Energ Policy 116, 433–443. doi:10.1016/j.enpol.2018.02.017
Shan, Y. L., Liu, J. H., Liu, Z., Xu, X., Shao, S., Wang, P., et al. (2016). New provincial CO2 emission inventories in China based on apparent energy consumption data and updated emission factors. Appl. Energ 184, 742–750. doi:10.1016/j.apenergy.2016.03.073
Shi, K. F., Chen, Y., Yu, B. L., Xu, T. B., Chen, Z. Q., Liu, R., et al. (2016). Modeling spatiotemporal CO2 emission dynamics in China from DMSP-OLS nighttime stable light data using panel data analysis. Appl. Energ 168, 523–533. doi:10.1016/j.apenergy.2015.11.055
Song, C., Dodds, W. K., Rüegg, J., Argerich, A., Baker, C. L., Bowden, W. B., et al. (2018). Continental-scale decrease in net primary productivity in streams due to climate warming. Nat. Geosci. 11, 415–420. doi:10.1038/s41561-018-0125-5
Sun, Y., Zheng, S., Wu, Y. Z., Schlink, U., and Singh, R. P. (2020). Spatiotemporal variations of city-level carbon emissions in China during 2000-2017 using nighttime light data. Remote Sens. 12, 2916. doi:10.3390/rs12182916
Tao, F. L., Yokozawa, M., Zhang, Z., Xu, Y. L., and Hayashi, Y. (2005). Remote sensing of crop production in China by production efficiency models: models comparisons, estimates and uncertainties. Ecol. Model 183, 385–396. doi:10.1016/j.ecolmodel.2004.08.023
Wang, J., Lv, K. J., Bian, Y. W., and Chen, Y. (2017). Energy efficiency and marginal carbon dioxide emission abatement cost in urban China. Energ Policy 105, 246–255. doi:10.1016/j.enpol.2017.02.039
Wang, Q., Huang, J. J., Zhou, H., Sun, J. Q., and Yao, M. K. (2022). Carbon emission inversion model from provincial to municipal scale based on nighttime light remote sensing and improved STIRPAT. Sustainability 14, 6813. doi:10.3390/su14116813
Wang, Y., Xiao, W. H., Wang, Y. C., Hou, B. D., Yang, H., Zhang, X. L., et al. (2018). Exploring city development modes under the dual control of water resources and energy-related CO2 emissions: the case of Beijing, China. Sustainability 10, 3155. doi:10.3390/su10093155
Xu, J., Liu, H. J., Li, B. L., Gao, X. Z., Nie, P. J., Sun, C., et al. (2022). Identifying factors that affect environmental air quality using geographical detectors in the NKEFAs of China. Front. Earth Sci. 16, 499–512. doi:10.1007/s11707-021-0882-0
Yang, J., Cai, W., Ma, M. D., Li, L., Liu, C. H., Ma, X., et al. (2019). Driving forces of China's CO2 emissions from energy consumption based on Kaya-LMDI methods. Sci. Total Environ. 711, 134569. doi:10.1016/j.scitotenv.2019.134569
Yang, Y. H., Shi, Y., Sun, W. J., Chang, J. F., Zhu, J. X., Chen, L. Y., et al. (2022). Terrestrial carbon sinks in China and around the world and their contribution to carbon neutrality. Sci. China 52, 534–574. doi:10.1360/ssv-2021-0362
Zhang, X. P., Zhang, Y. X., Rao, R., and Shi, Z. P. (2015). Exploring the drivers to energy-related carbon emissions changes at China’s provincial levels. Energ Effic. 8, 699–712. doi:10.1007/s12053-014-9318-y
Keywords: carbon emission, carbon sequestration, carbon balance, county scale, Jiangsu Province
Citation: Peng R, Tian X and Wu D (2023) Spatiotemporal characteristics and zonal analysis of carbon balance in county-level regions: case study of Jiangsu Province. Front. Environ. Sci. 11:1330587. doi: 10.3389/fenvs.2023.1330587
Received: 31 October 2023; Accepted: 30 November 2023;
Published: 12 December 2023.
Edited by:
Changchun Huang, Nanjing Normal University, ChinaCopyright © 2023 Peng, Tian and Wu. This is an open-access article distributed under the terms of the Creative Commons Attribution License (CC BY). The use, distribution or reproduction in other forums is permitted, provided the original author(s) and the copyright owner(s) are credited and that the original publication in this journal is cited, in accordance with accepted academic practice. No use, distribution or reproduction is permitted which does not comply with these terms.
*Correspondence: Dan Wu, Y3VtdHd1ZGFuQDE2My5jb20=