 Na Zhang1†
 Jinqian Deng
95% of researchers rate our articles as excellent or good
Learn more about the work of our research integrity team to safeguard the quality of each article we publish.
Find out more
ORIGINAL RESEARCH article
Front. Environ. Sci. , 14 December 2023
Sec. Environmental Economics and Management
Volume 11 - 2023 | https://doi.org/10.3389/fenvs.2023.1326393
High-tech industries represent a country’s advanced productivity, technological level and innovation ability, they carry the characteristics of green industries in terms of resource-saving and being environmentally friendly, and their agglomeration has a significant impact on the development of green economy. The marketization process, as an important macroenvironment for the development of high-tech industries, not only relates to the motivation of high-tech industry agglomeration but also affects the effectiveness of the agglomeration effect. It is unclear whether marketization plays a role in the relationship between high-tech industry agglomeration and green economy efficiency and whether this role has heterogeneity. Taking China’s provincial panel data from 2001 to 2020, this paper constructs a panel threshold econometric model, and examines the threshold effect of the high-tech industry agglomeration impact on green economic efficiency under different marketization levels. 1) The high-tech industry agglomeration impact on green economic efficiency has a double-threshold effect due to the marketization level, with threshold values of 5.862 and 8.938, and the promotion effect is the highest in the second threshold range. 2) Under the influence of the government-market relationship, non-state economic development, market intermediary organization development and legal environment, the impact of high-tech industry agglomeration on green economic efficiency has a single-threshold effect, with threshold values of 7.4950, 12.1960 and 11.6100. After crossing the threshold values, the impact changes from negative to positive. Factor market development has a double-threshold effect, with threshold values 10.3100 and 14.9210, and the impact changes from negative to positive and gradually increases. 3) Among the major industries, the pharmaceutical manufacturing industry (3.978 and 9.639) and the computer and office equipment manufacturing industry (3.359 and 9.639) have a double-threshold effect due to the marketization level, and the medical equipment and instrumentation manufacturing industry (9.494) has a single-threshold effect. This study is of great significance for China as it would help optimize the market environment and stimulate the green economy effect of high-tech industry agglomeration; moreover, it would provide a reference for other developing countries and transition economies.
China’s economy has experienced more than 40 years of rapid growth relying on “factor inputs,” creating the “China miracle” as a historical landmark in world economic growth. However, due to this rapid growth, ecological deterioration, environmental pollution and other problems have become issues that cannot be ignored. From the point of view of China’s major pollutant emissions, industrial solid waste generation amounted to 487 million tonnes in 1980, exceeded 1 billion tonnes for the first time in 2003, and reached 3.675 billion tonnes in 2020. In 2020, examining pollutant emissions such as chemical oxygen demand, ammonia nitrogen, sulfur dioxide, and nitrogen oxides, chemical oxygen demand and ammonia nitrogen emissions from wastewater amounted to 25,647,600 tons and 984,000 million tons, respectively, and the emissions of sulfur dioxide, nitrogen oxides and particulate matter in waste gas were 3,182,200 tons, 11,816,500 tons and 6,135,000 tons, respectively. According to the 2020 Global Environmental Performance Index (EPI) Report, China ranked 120th out of 180 countries and regions, indicating that China’s ecological and environmental conditions are not optimistic. The Report of the 20th CPC National Congress emphasizes the need to “accelerate the transition to a model of green development,” which shows that the development of the green economy is not only an important means of balancing environmental protection and economic growth but also an inevitable choice for the sustainable development of the Chinese nation.
The term “green economy” first appeared in the British environmental economist Pierce’s Blueprint for a Green Economy, meaning a sustainable economy (Pierce, 1996). At present, the meaning of the green economy is widely recognized by the United Nations Environment Programme (UNEP): “Green economy is an economy that enhances human wellbeing and social equity while reducing environmental risks and ecological scarcities” (UNEP, 2014). The first issue that must be addressed in the study of the green economy is the measurement of the green economy, and in this regard the literature focuses on two perspectives: level and efficiency. Measurement of the green economy from the level perspective focuses on the evaluation of the development level of the green economy, which is relatively inclusive and is usually measured by constructing a system of indicators that includes the economic system, the environmental system, and the social system (Talberth and Bohara, 2006). The efficiency approach to the measurement of the green economy relies on the perspective of input and output, seeking to minimize pollution emissions and maximize economic output under resource and environmental constraints, and is mainly based on the SBM-DEA model that includes undesired outputs in the choice of methods (Zhang and Choi, 2013; Hu et al., 2018a). Based on measurement, scholars began to pay attention to the influencing factors of the green economy, hence environmental regulation became the focus of discussion, and the research conclusions basically affirmed the positive role of environmental regulation in enhancing the efficiency of the green economy (Brunnermeier and Cohen, 2003; Horbach, 2008; Zhao et al., 2022). As research deepened, some scholars have found that the impact of environmental regulation on green economic efficiency not only depends on the intensity of environmental regulation but is also closely related to different types of environmental regulation (Fan and Sun, 2020). Jahanger et al. (2022) argue that higher natural resource consumption will generate more carbon dioxide emissions. Although joining the North American Free Trade Agreement will contribute to economic prosperity, but it is not conducive to the sustainable development of member countries’ environment. Chen et al. (2022) used panel data from the top ten polluting countries from 1990 to 2019 to study and found that natural resource rent and green technology have a positive impact on ecological efficiency, while there is a bidirectional causal relationship between financial development and ecological efficiency. Taking five emerging economies in the BRICS countries as the object of study, Zhao and Rasoulinezhad (2023) found that natural resource utilization efficiency drives green economic growth in the BRICS countries. In addition, there is literature on industrial agglomeration (Yang et al., 2022), urbanization (Martínez and Maruotti, 2011), factor inputs (Rashidi and Saen, 2015), entrepreneurial practices (Gregori and Holzmann, 2022) and other perspectives.
There is a direct logical correlation between green economic development, industrial structure and industrial layout. High-tech industries represent a country’s advanced productivity, technological level and innovation ability, and thus they carry the characteristics of green industries in terms of resource-saving and being environmentally friendly. Their agglomeration will bring a series of externalities and diffuse them to other industries through interenterprise competition and co-operation, product sales, and marketable application of technology, and hence will have an important impact on regional industrial structure. It also has an important impact on regional industrial structure, energy use, and pollution reduction (Tanaka and Managi, 2021; Yang et al., 2022; Hossain, et al., 2023). In recent years, given the increasing environmental pollution, the environmental externalities of high-tech industry agglomeration have received attention from scholars. Chen (2019) argued that high-tech industry agglomeration can help promote green technology innovation, which in turn alleviates environmental problems. Li et al. (2019), based on provincial-level panel data in China, found that there is a spatial dependence between the development of high-tech industries and carbon emissions, and such dependence plays an important role in the development of a low-carbon economy. Lou et al. (2021) found that high-tech industry agglomeration can significantly reduce local and neighbouring sulfur dioxide emissions. However, green economic development emphasizes not only pollution reduction but also economic growth. Hu et al. (2018b) found that the impact of high-tech industry agglomeration on green economic efficiency is a “U"-shaped path, and Deng and Ren (2021) found that when high-tech industry agglomeration reaches a certain level, it can significantly promote the green transformation of the industry. In general, the literature basically affirms the positive effect of high-tech industry agglomeration on the development of the green economy.
The process of China’s economic system reform is manifested in deepening the market-oriented reform. The allocation of resources has changed from the complete exclusion of the market before the reform and allowing the decisive role of the market in the allocation of resources to take hold after the reform. The market environment is increasingly improving, and the level of marketization is constantly upgrading; moreover, the process of marketization, as an important macroenvironment for the development of high-tech industries, not only relates to the motivation of the agglomeration of high-tech industries but also affects the effectiveness of the agglomeration effect. Academic discussions on China’s market-oriented reform have mainly focused on its relationship with economic growth, basically affirming the economic growth effect of market-oriented reform (Hsieh and Klenow, 2009; Fan, 2019; Nguyen and Adomako, 2021); these discussions focused on the increasingly serious environmental pollution and the United Nations sustainable development goals, and moving forward through the market mechanism to improve energy efficiency, reduce pollution emissions and thus promote green development (Fan et al., 2007; Guo and Zhang, 2020). However, Yue et al. (2015) found that marketization is an important moderating variable of industrial agglomeration affecting green economic efficiency and that an increase in the level of marketization can significantly enhance the promotion of industrial agglomeration on green economic efficiency. Liu and Meng (2020) took high-tech industries as the research object and found that the innovation performance of high-tech industry agglomeration in different regions varies with the level of marketization. Tang et al. (2022) examined the impact of the Broadband China policy on eco-efficiency and found that the positive impact of information infrastructure on eco-efficiency is more pronounced in cities with higher marketization levels. Rafei et al. (2022) found that the interaction between economic complexity and natural resources helps improve environmental quality, but varies in countries with different levels of institutional quality.
Through the above literature combing, we found that the role or extent of market mechanisms in the relationship between high-tech industry agglomeration and green economic efficiency is closely related to the level of marketization. When the level of marketization is low, resource allocation mainly relies on the government’s promotion, but the government’s allocation of resources is inherently short-sighted. In addition, the high investment, long cycle, and high-risk nature of high-tech industry development makes it unpopular with local officials. Moreover, the imperfect market mechanism makes it difficult for industrial parks to rely on themselves and form agglomeration economies of scale. With the continuous improvement of market mechanisms and the improvement of marketization level, the business environment has been improved, and the mobility of production factors such as talent and capital has increased. This not only stimulates technological innovation and technology spillover effects in high-tech industries, but also weakens the rent-seeking motivation of polluting enterprises, strengthens market supervision mechanisms, which is conducive to the improvement of green economic efficiency. It can be seen that due to the influence of marketization level, the impact of high-tech industry agglomeration on green economic efficiency may have nonlinear characteristics.
China is currently in a critical period of economic development and transformation, with significant differences in the degree of marketization among different regions. However, the existing studies have not considered the impact of industrial agglomeration promoted by economic system reform on green economy, and also overlooked the objective fact that there are significant differences in the marketization process and high-tech industry agglomeration level in different regions of China. There is no analysis of the differential impact of high-tech industry agglomeration on green economy efficiency from the perspective of different levels of marketization, nor is there any literature delving into various aspects of marketization and the four major categories of high-tech industries to study this issue. We believes that the level of marketization, as an important external environment for industrial development, cannot ignore the market environment to analyze the relationship between high-tech industry agglomeration and green economic efficiency. This is not in line with the reality of economic development. It is necessary to distinguish the differences in the level of marketization among different regions and judge the different impacts of high-tech industry agglomeration on green economic efficiency. Therefore, this study incorporates the marketization process into the analytical framework of the high-tech industry agglomeration impact on green economic efficiency, constructs a panel threshold econometric model, explores the threshold effect of the high-tech industry agglomeration impact on green economic efficiency under different levels of marketization in terms of the total marketization index and the aspect index, and examines the industry differences with respect to this impact based on the broad categories of high-tech industries.
The contributions of this study is reflected in the following three aspects: 1) Previous studies mostly analyze the relationship between industrial agglomeration and environmental pollution or economic development under the framework of linear model. This paper introduces the differential variable of marketization level and constructs a nonlinear panel threshold model to study the differential impact of high-tech industrial agglomeration on green economic efficiency under different marketization levels. 2) China’s market-oriented reforms are rich in content, including the relationship between the government and the market, the development of the non-state economy, the degree of product market development, the degree of factor market development, as well as market intermediary organizations and the legal system environment, which are considered the five marketization aspects of the high-tech industry (Wang et al., 2018). This paper investigates the threshold effect of high-tech industry agglomeration on green economic efficiency under different marketization levels from the five aspects of marketization mentioned above, which compensates for the insufficiency of the current literature considerations with respect to the market environment for industrial development. 3) Most current studies on high-tech industry are conducted from the perspective of the overall industry, but China’s high-tech industry includes a variety of sectors, such as the pharmaceutical manufacturing industry, the electronic and communication equipment manufacturing industry, the computer and office equipment manufacturing industry, and the medical equipment and instrumentation manufacturing industry. It is not comprehensive and thorough to study all the high-tech industries manifested in these sectors without discrimination. This study analyzes the above four industries separately, which makes up for the inadequacy of the literature with respect to the study of industry differences.
Compared with traditional industries, the production and operation activities of high-tech industries take R&D and innovation as the core, and their industrial development depends on the industrialization of innovation achievements to a certain extent. According to the development experience of high-tech industries in developed countries, the capital investment required for R&D and innovation and the conversion of achievements to industrial production has shown a significant growing trend, coupled with the uncertainty of innovation activities, which validates that the high-tech industries are characterized by high investment, high risk, long cycle, high knowledge density and capital density. It is precisely due to the existence of these special characteristics of the high-tech industries that their economic activities have higher requirements for agglomeration, and their scale effect and the technology spillover effect are the most typical effects of the agglomeration of such industries (Henderson, 2001), hence, these effects have an important impact on green economic efficiency.
Drawing on the study of Sueyoshi and Goto (2012) on production and environmental regulation, this paper expresses the possibility frontier of production as
As shown in Figure 1, the main coordinate (

FIGURE 1. Mechanism through which high-tech industry agglomeration influences green economic efficiency.
H1:. High-tech industry agglomeration can significantly improve regional green economic efficiency.
China’s market-oriented reform has been gradually promoted along with the general reform and opening up, and the role of the market in resource allocation has gradually changed from “auxiliary” to “main” and from “basic” to “decisive”. Further deepening the reform of the market system and upgrading the level of marketization will lead to the basic economic system that China adheres to in the long term. The market environment plays an important role in the free flow of factors, fair trading, price mechanisms, supply and demand relationships and even institutional improvement. The process of marketization, as an important macroenvironment for the development of high-tech industries, plays an important role in the relationship between high-tech industry agglomeration and green economic efficiency. However, high-tech industries with high technological content are a double-edged sword.
On the one hand, the high-tech industrial agglomeration is not conducive to the improvement of green economic efficiency when the degree of marketization is low. The essence of marketization is to establish and improve a market-oriented economic system, determine factor prices through market mechanisms, and match corresponding property rights systems and economic regulations. Marketization provides inputs such as land, capital, labor for economic development. When the level of marketization is low, the above-mentioned production factors cannot freely flow and cannot be allocated according to market demand, while hindering the effective utilization of foreign investment and knowledge spillover effects, making it impossible for industries in the region to form economies of scale and promote technology spillovers (Xia, et al., 2016; Chuntian, et al., 2018), inhibiting the improvement of regional green economic efficiency.
From the perspective of scale effect, first, the industrial agglomeration theory of neoclassical economics points out that industrial agglomeration is formed spontaneously by enterprises in pursuit of economies of scale under the regulation of marketization, and market conditions are the driving force to promote industrial agglomeration (Henderson, 2003). According to the theory of institutional economics, imperfect market mechanisms can easily lead to weak awareness of property rights, opaque institutional environment, and corruption issues, which affect market transaction costs, chang production decisions and technological innovation of enterprises. Enterprises in the agglomeration area are only “enterprise clusters” formed under the attraction of favorable government policies, and cannot produce economies of scale (Atuahene-Gima and Li, 2002). Second, the lower level of marketization enhances the government’s allocation of resources, while the local government’s performance appraisal and the more mobile mechanism of appointing and promoting officials lead local officials to pay more attention to the traditional industries that can bring political achievements during their tenure and compress support for high-tech industries, which is not conducive to the formation of the scale effect in industrial clusters in the shortest possible period (Yue, et al., 2015; Chuntian, et al., 2018). Third, in the factor market, excessive intervention by the government makes factor prices unable to truly reflect the supply and demand relationship, leading to distorted factor prices and increasing production costs for enterprises. This phenomenon restricts the improvement of industrial agglomeration in green economic efficiency.
From the perspective of technology spillover effects, first, high-tech industry agglomeration is manifested in the agglomeration of advanced technology and high-tech talent. Regions with low levels of marketization often have strong government intervention. In order to protect local enterprises, the government creates artificial barriers to form monopolies, which is not conducive to the flow of talent and technology diffusion. In contrast, agglomeration accelerates the formation of intraregional monopoly power and greatly weakens the driving force of technological innovation in enterprises; however, the improvement of the technological level can significantly reduce the amount of enterprise emissions, and the inefficiency of pollution emission reduction is a key factor leading to green economic inefficiency (Yang and Wen, 2017). Second, the lower level of marketization will also relaxes the government’s constraints on environmental regulation of enterprises, strengthens local protectionism, enhances the rent-seeking incentives of polluting firms, and relaxes corporate pollution abatement constraints and environmental responsibility, causing enterprises in the agglomeration area to continue to produce low value-added goods at low costs, making it difficult to form the technological progress effect of industrial agglomeration, thereby hindering the improvement of green economic efficiency, and industrial agglomeration will continuously amplify this negative impact effect (Rashidi and Saen, 2015; Yang et al., 2022).
On the other hand, the optimized market mechanism creates a favorable production and operation environment for enterprises, reduces transaction costs, and fully unleashes the scale effect and technological progress effect of industrial agglomeration, promoting the improvement of green economic efficiency. First, in terms of scale effect, With the gradual deepening of market-oriented reform and the improvement of marketization level, market information becomes more transparent. For example, market prices can better reflect the supply and demand relationship of products, enabling enterprises to comprehensively grasp market demand, which is beneficial for enterprises to adjust production scale timely, and stimulate the scale effect within the agglomeration area (Tanaka and Managi, 2021). Additionally, the improvement of marketization level is conducive to cross regional competition and cooperation, which will promote active agglomeration of industries and the specialized production combined with their own comparative advantages, so as to improve production efficiency, reduce transaction costs, and form economies of scale (Chen et al., 2022; Meysam et al., 2022).
Second, in terms of technology spillover effects, a higher level of marketization represents a reduction in government intervention and an improvement in the business environment, which can weaken the rent-seeking incentive of polluting firms, and the marketization of capital prices can improve enterprise financing and promote the accumulation of R&D capital, which can generate a technological innovation effect and promote technological progress (Xie and Fang, 2011). The increase in the level of marketization greatly enhances the level of openness between industries, enhances the mobility of factors of production and is conducive to the better exertion of technological spillover effects. Furthermore, high-tech industries have higher labour productivity, bringing higher factor compensation. In terms of the role of the market mechanism, technology, capital, talent and other high-quality factors of production follow the price mechanism and are bound to flow to high-tech industries and the cleaner production sector, which is conducive to technology spillover and promotes technological progress throughout society (Delgado and Castro, 2016). It can be observed that a strong market environment and a sound market mechanism play a positive role in the relationship between high-tech industry agglomeration and green economic efficiency.
Through the above analysis, marketization as the macro environment of industrial development will affect the high-tech industry agglomeration effect on green economic efficiency. Accordingly, this paper proposes the following research hypotheses:
H2:. The effect of high-tech industry agglomeration on green economic efficiency is heterogeneous and it depends on the level of marketization.
H2a:. High-tech industry agglomeration is not conducive to the improvement of green economic efficiency when the marketization level is low.
H2b:. The positive effect of high-tech industry agglomeration on green economic efficiency can be effectively stimulated only when the market environment is sound and marketization is raised to a certain level.
The sample interval of this paper is from 2001 to 2020, and the research object is 30 provinces (autonomous regions and municipalities directly under the central government, excluding Tibet due to missing data) in mainland China. Except for the data related to the level of marketization from the Report on the Marketization Index of China’s Provinces, other original data are derived from the China Statistical Yearbook on High Technology Industry, China Statistical Yearbook on Environment, China Economic Census Yearbook, China Statistical Yearbook on Science and Technology, China Statistical Yearbook, Statistical Yearbook of the Chinese Investment in Fixed Assets and the statistical yearbooks of provinces (autonomous regions and municipalities). Some of the missing data are added from the China Economic and Social Big Data Research Platform. The detailed selection, definition and statistical characteristics of the variables are shown in Table 1. The study sample includes 600 observations. The mean value of green economic efficiency is 0.4667, the maximum value is 1.9276, and the minimum value is 0.2008. The mean value of high-tech industry agglomeration is 0.9151, the maximum value is 5.2212, and the minimum value is 0.9151. The mean value of the total marketization index is 7.1180, the maximum value is 11.9340, and the minimum value is 2.2430. There are large variances among other variables, which provide sufficient information for our study.

TABLE 1. Descriptive statistics of variables.
Green economic efficiency (
where
where
Based on the above measurement method, it is necessary to set the input variables, desired output and undesired output variables for measuring green economic efficiency. This paper draws on the methodology of Zhang et al. (2014) to measure factor inputs in terms of capital, labour and resources (Zhou et al., 2018) and measures desired outputs in terms of both economic and environmental benefits, while the three industrial wastes are the undesired outputs, which are used to examine the negative impacts on the environment. The specific indices are defined in Table 2.
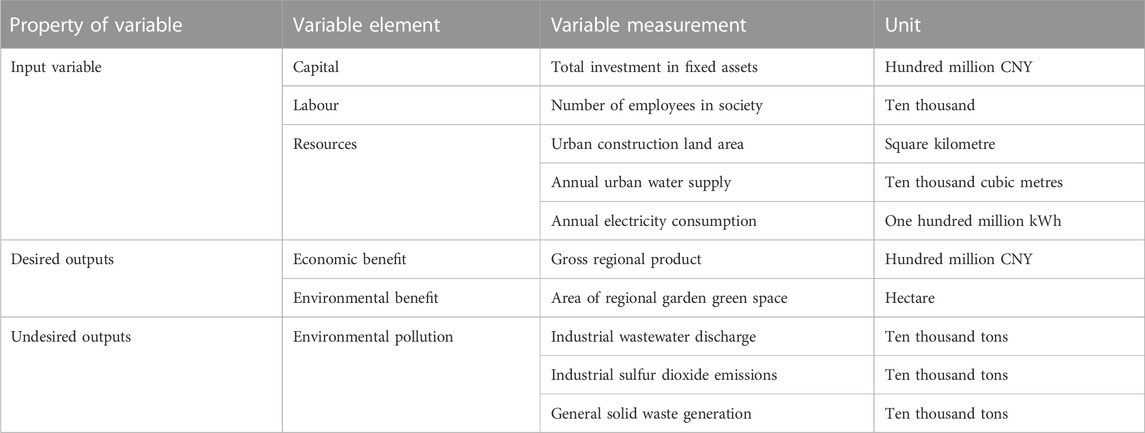
TABLE 2. Green economic efficiency input‒output variables.
High-tech industry agglomeration (
where
Marketization level (
Considering other factors affecting green economic efficiency and drawing on existing research results (Horbach, 2008; Tanaka and Managi, 2021; Zhao and Rasoulinezhad, 2023), the control variables mainly include: 1) foreign direct investment (
To reveal whether there is a threshold feature for the green economy effect of high-tech industry agglomeration as affected by the marketization process, this paper constructs the following dynamic test model based on the nonlinear dynamic perspective, drawing on the threshold regression model proposed by Hansen (1999):
where
To calculate the specific threshold, Eq. 4 is superimposed and standardized as:
Taking the mean within the group and stacking all observations, we obtain:
For the given threshold, the least squares estimation of Eq. 6 is performed:
Calculate the residual sum of squares:
where the residual sum of squares
The significance test for the threshold effect sets the original hypothesis
The original hypothesis for testing whether the threshold is equal to the true value is
The above analysis is a single-threshold scenario. However, in reality, there may be double-threshold or multithreshold scenarios in the role of marketization in terms of the influence of high-tech industry agglomeration on green economic efficiency, and it is necessary to incorporate the necessary control variables. Therefore, the basic model is expanded as follows:
In the above equation,
The panel threshold regression model requires the variables to be stationary series, and non-stationary variables may lead to pseudoregression problems. Therefore, this paper adopts the ADF-Fisher method to carry out the unit root test on the core variables. The original hypothesis is that there is a unit root; that is, the variables are non-stationary series. The results are shown in Table 3, and it can be seen that the p-values of all variables are significantly less than 1%, which strongly rejects the original hypothesis and indicates that all variables are stationary series. Furthermore, this paper adopts the Pedroni and Kao-ADF cointegration test methods to construct statistics based on regression residuals to test whether there is a long-run equilibrium relationship between the core variables of high-tech industry agglomeration, marketization and green economic efficiency. The original hypotheses of both methods are that there is no cointegration relationship between the variables, and the test results are shown in Table 4. It can be seen that in the residual-based Pedroni cointegration test, only the Panel PP and Group Roh statistics fail to pass the significance level test, the rest of the statistics satisfy the significance level of 1%, and the residual-based Kao-ADF cointegration test is also significant at the level of 1%, which rejects the original hypothesis and considers that there is a cointegration relationship between the variables. Based on the majority principle for decision-making, there is a long-run stable equilibrium relationship between the core variables, and the regression of the panel threshold model can be carried out.
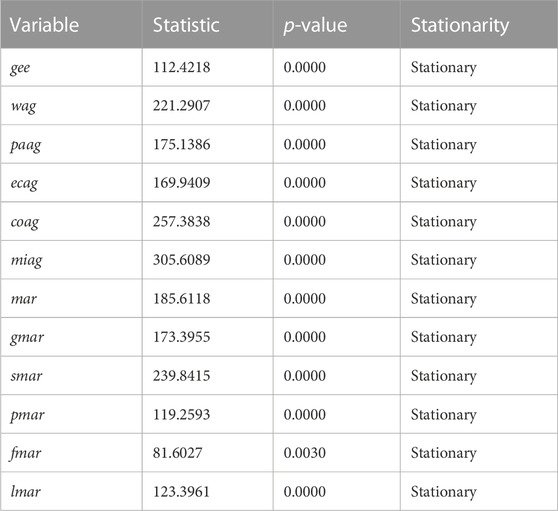
TABLE 3. Panel unit root test.
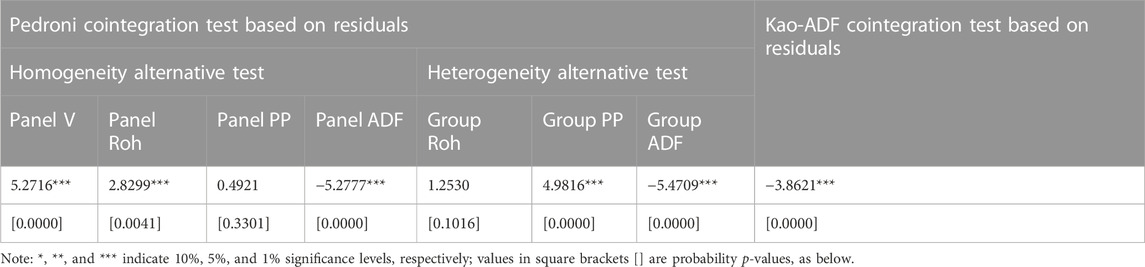
TABLE 4. Panel cointegration test.
Hansen’s bootstrap method is used to test the threshold effect, and the bootstrap-value is obtained by overlapping the simulated likelihood ratio test statistic 500 times, which is used to judge the existence of the threshold effect of marketization. The results are shown in Table 5, the double-threshold effect is significant at the 1% level, indicating that the impact of high-tech industry agglomeration on green economic efficiency has a double-threshold effect under the condition of marketization as the threshold variable. After the threshold effect test is passed, the specific thresholds need to be estimated. Table 5 reports the thresholds and their corresponding 95% confidence intervals, and the two thresholds of marketization are 5.8620 and 8.9380, which are within the confidence intervals of [5.7320, 5.9130] and [8.5975, 8.9470], respectively. As seen from Figure 2 of the likelihood ratio function, the likelihood ratio is 0 when the first threshold value (left figure) and the second threshold value (right figure) reach 5.8620 and 8.9380, respectively, indicating that the likelihood ratio value accepts the original hypothesis at the 1% significance level, and it can be assumed that the threshold estimates are equal to the true value.
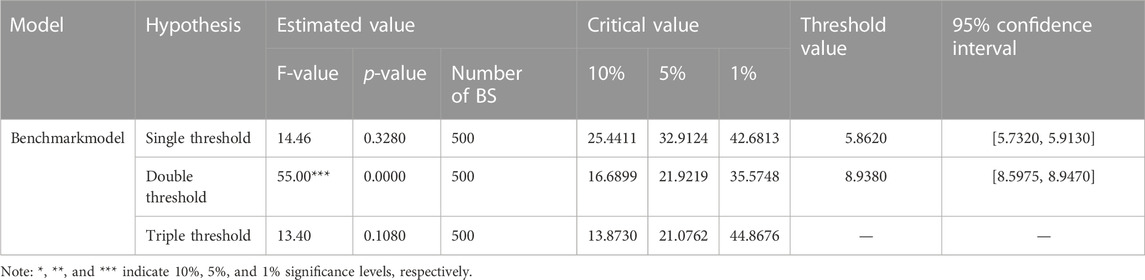
TABLE 5. Threshold effect test and threshold estimation.
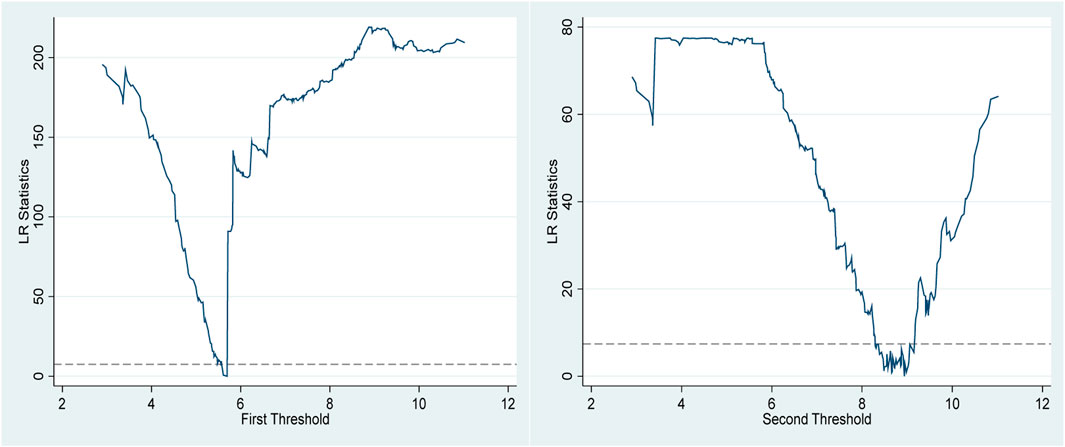
FIGURE 2. Threshold effect detection results.
Table 6 reports the results of the stepwise regression based on the double-threshold panel model. It is not difficult to see that the impact of high-tech industry agglomeration on green economic efficiency has significant nonlinear characteristics due to the difference in marketization levels. From the results in column (7), when the marketization level is lower than 5.8620, the estimated coefficient of high-tech industry agglomeration is significantly negative, indicating that high-tech industry agglomeration has an inhibitory effect on green economic efficiency when the marketization level is low. When the marketization level increases to a level between 5.8620 and 8.9380, the estimated coefficient of high-tech industry agglomeration turns positive and passes the 1% significance level test, indicating that high-tech industry agglomeration can significantly promote green economic efficiency in the second threshold range. When the market environment continues to improve and the marketization level exceeds 8.9380, the estimated coefficient of high-tech industry agglomeration is still positive and passes the significance level test of 1%, but its strength effect decreases from 0.412 in the second threshold range to 0.026. This result validates the previous research hypothesis.
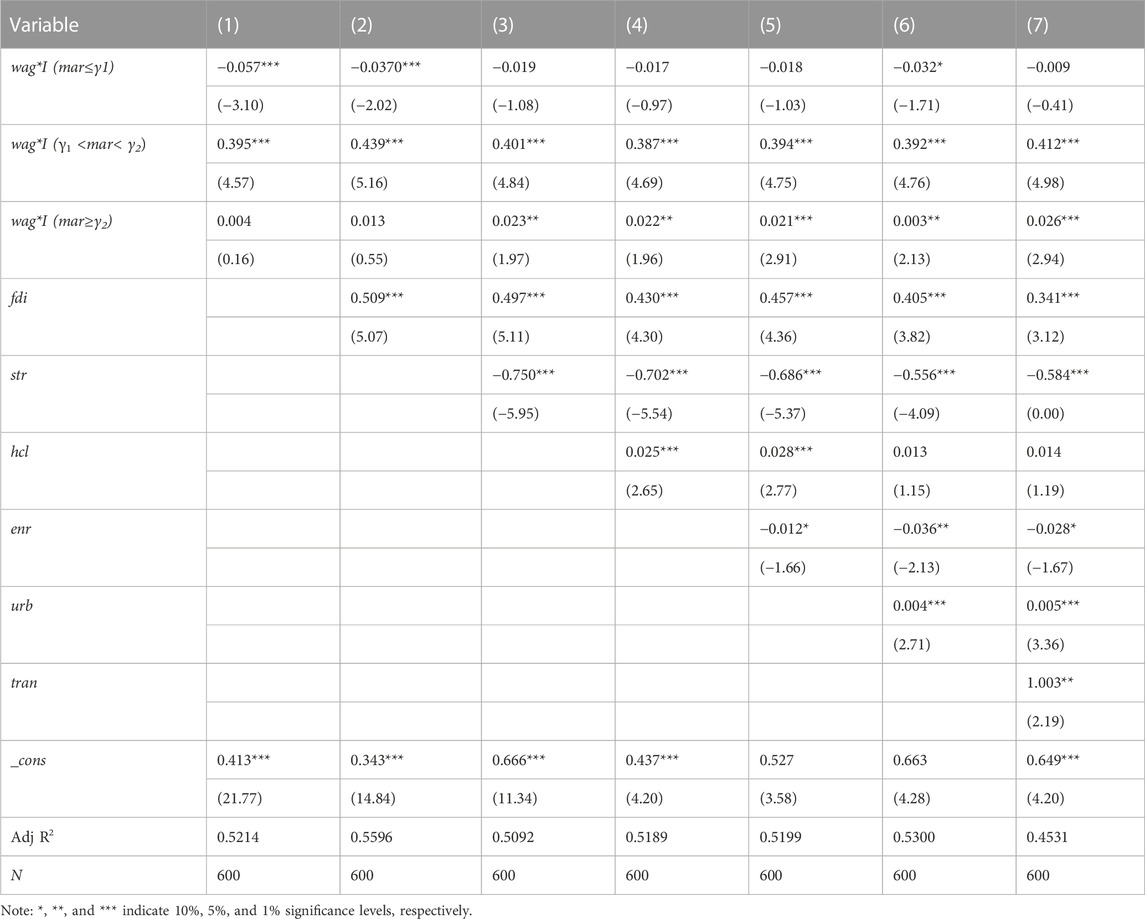
TABLE 6. Threshold effect regression results.
The results in the previous have verified the research hypothesis, but this result may be biased by sample selection and variable measurement. To ensure the reliability of the research conclusions, this study adopts the following two methods for robustness test: one is to replace variables, adopt the green GDP (GGDP = traditional GDP−resource consumption cost−environmental loss cost) to measure the green economic efficiency to conduct the robustness test I; the second is to delete special samples, due to policy bias, municipalities directly under the central government have advantages in resource allocation and factor agglomeration that other cities cannot match, and these factors may have an impact on the estimated results. Therefore, the samples of Beijing, Tianjin, Shanghai and Chongqing municipalities were deleted for re-inspection. The threshold effect test and threshold estimation results are shown in Table 7, the single-threshold and double-threshold effects of robustness test I are significant at the 1% level, and robustness test II also passes the test of the double-threshold effect at 1%, and the threshold estimates of robustness test I and robustness test II are comparable to the benchmark model, indicating that the benchmark model test results are reliable. The regression results of the threshold model are shown in columns (1) and (2) of Table 8, the sign of the estimated coefficients in the robustness test results of both methods remains consistent with the benchmark model, with only minor changes in the significance level, indicating that the main findings of this paper are robust.
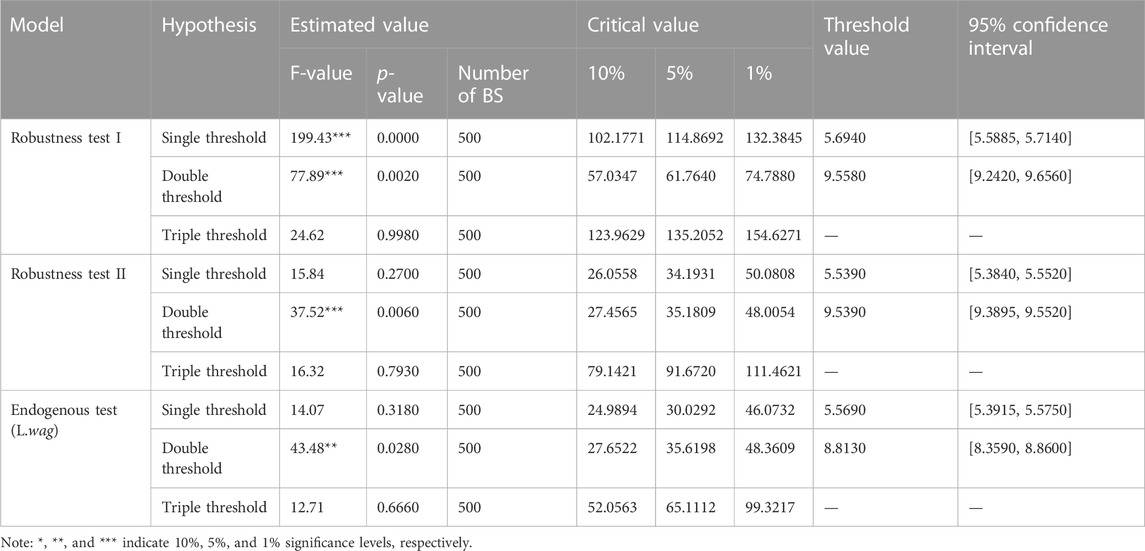
TABLE 7. Threshold effect test and threshold estimation: Robustness check and endogenous test.
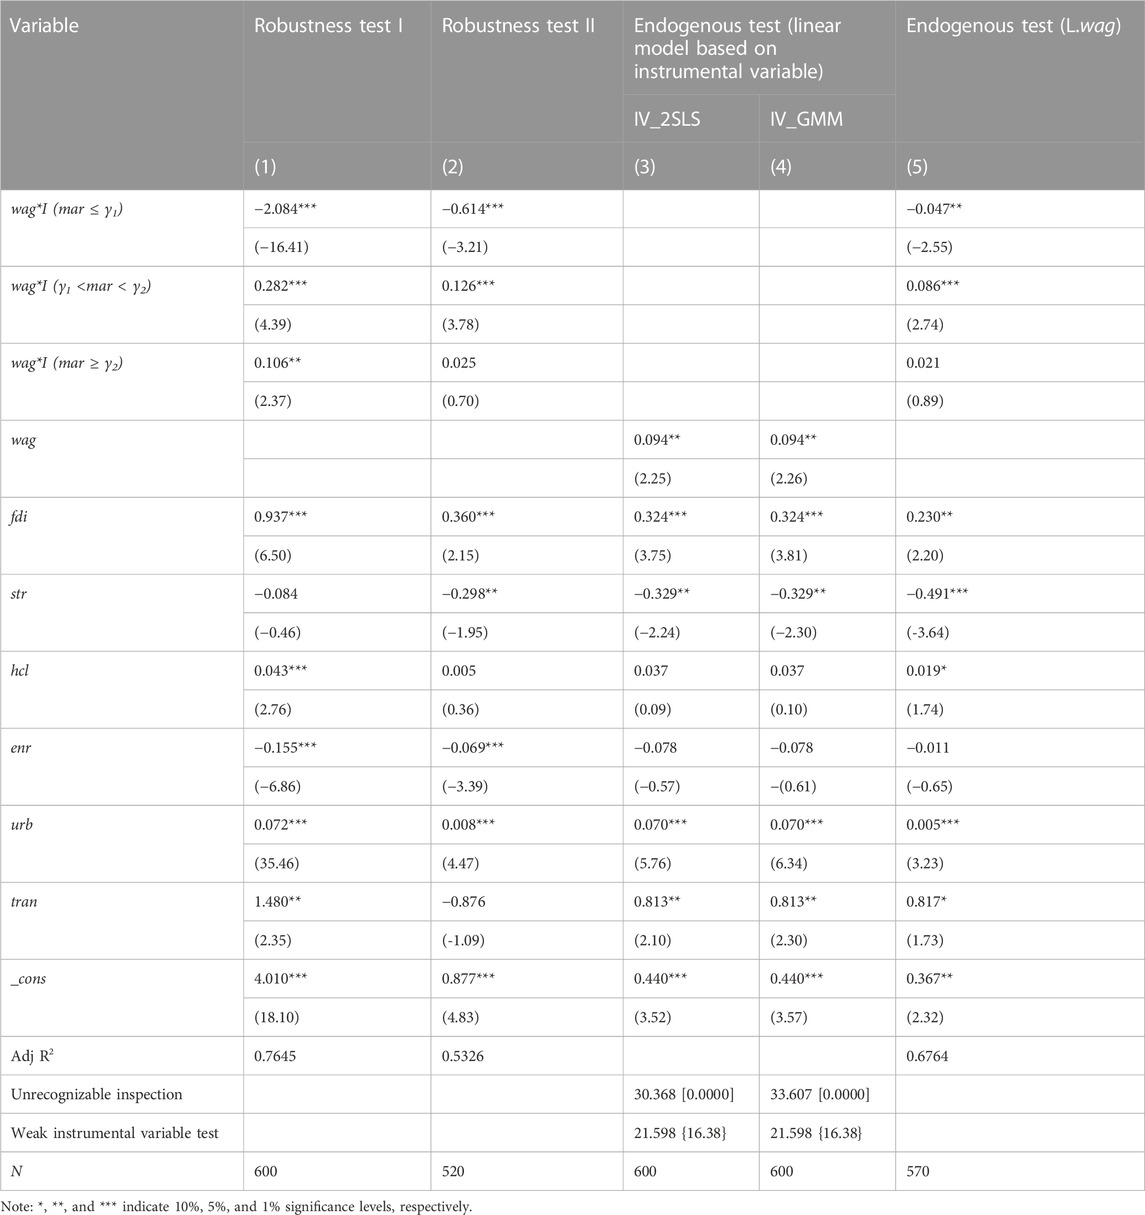
TABLE 8. Robustness and endogeneity test results.
The potential endogeneity issues in this study may come from two aspects: missing variables and bidirectional causal relationships. In view of the possible endogeneity caused by missing variables, on the one hand, we adopt stepwise regression method in the benchmark regression to test whether the addition of control variables will affect the research conclusions. From Table 6, with the addition of control variables, the core research conclusions remain robust. On the other hand, to alleviate the endogeneity problem caused by the potential multicollinearity between the explanatory variable and the control variables, we measured the variance inflation factor of the model, VIF = 2.61, indicating that there is no multicollinearity effect, which controls the endogeneity problem to some extent. In addition, drawing on the method of Chen and Feng (2023), we examine the endogeneity of the linear impact of high-tech industry agglomeration. From the perspective of natural geography, we choose terrain undulation as the instrumental variable and adopted the methods of IV _ 2 SLS and IV _ GMM for instrumental variable regression, the results are shown in columns (3) and (4) of Table 8. The regression coefficient of high-tech industry agglomeration is significantly positive at the 5% level, indicating that the linear model alleviates endogeneity issues to some extent.
Due to the lack of alternative methods for endogeneity testing in nonlinear models, we refer to the experience of Dong and Han (2016) and estimate the lagged value of high-tech industry agglomeration (L.wag) as a substitute indicator. The results are shown in column (5) of Table 8, it shows significant negative effects in the first threshold range and significant positive effects in the second threshold range and the third threshold range, and the influence of the second threshold range is much stronger than that of the third threshold range. After dealing with the endogeneity problem through the above methods, the conclusions of this study are consistent with the benchmark regression results.
Based on the threshold value in the previous section, the sample is divided into low-marketization level regions, medium-marketization level regions and high-marketization level regions. Given that the mean value of the marketization level from 2001 to 2020 only reflects the overall distribution characteristics during the study period and cannot reflect the current development status of each province, this paper reports the sample distribution based on the mean value and the current 2020 value, as shown in Table 9. From the overall distribution of the mean value calculation, the marketization level of most provinces in China during the study period is located in the second threshold range, where the high-tech industry agglomeration has the strongest promoting effect on green economic efficiency, the low-marketization level regions are dominated by Yunnan-Guizhou and Northwest China in large numbers, and the high-marketization level regions are all in the eastern provinces. Compared with the distribution of the sample in 2020, China’s marketization level increases considerably, with only two provinces left in the first threshold range, Qinghai and Xinjiang, and a significant increase in the number of provinces in the third threshold range, with a tendency to shift from the eastern region to central China and Sichuan-Chongqing, while the second threshold range is mainly dominated by the central and western provinces. Overall, most of the eastern and central provinces in China have a good market environment, which helps stimulate the green economy effect of high-tech industry agglomeration. In the future, the northwestern region and Shanxi Province in central China need to urgently speed up the marketization process to maximize the assistance for the green economy effect of high-tech industry agglomeration.
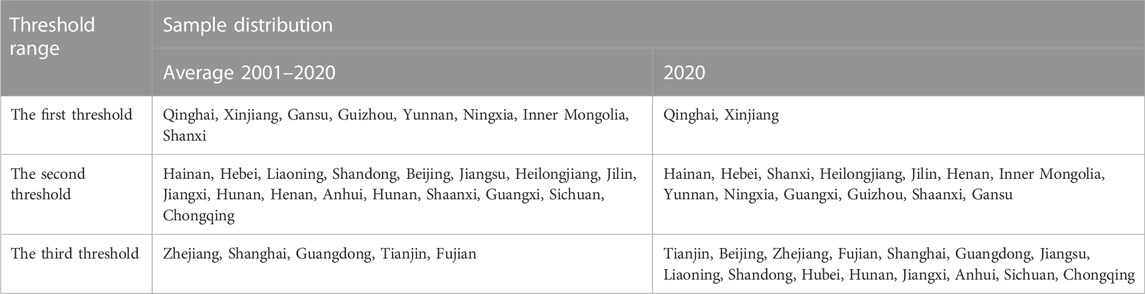
TABLE 9. Sample distribution characteristics.
To further deeply explore the influence effect of the marketization process in high-tech industry agglomeration and green economic efficiency, this paper incorporates five aspect indices of the marketization process into the research framework and tests whether the influence effect of high-tech industry agglomeration on green economic efficiency changes with the evolution of the process of the various aspects of marketization by taking government-market relationship, non-state economic development, product market development, factor market development, market intermediary organization development and legal environment as threshold variables. The results of the threshold effect test and threshold estimation are shown in Table 10. First, the test results taking government-market relationships, non-state economic development, market intermediary organization development and legal environment as threshold variables all support the single-threshold effect at the 5% significance level. The threshold estimates are 7.4950, 12.1960, and 11.6100, with corresponding 95% confidence intervals of [7.4075, 7.5160], [11.6970, 12.2700], and [11.5570, 11.9390], respectively. Taking Figures 3A, B, D into consideration, it can be seen that the likelihood ratio reaches 0 when the thresholds are 7.4950, 12.1960, and 11.6100, respectively, indicating that the estimated value of each threshold is equal to the true value. Therefore, the threshold effect regressions of government-market relations, non-state economic development, market intermediary organization development and legal environment in the subsequent article are all based on the single-threshold panel model. Second, the test results with product market development as the threshold variable show that there is no threshold effect between high-tech industry agglomeration and green economic efficiency, so the subsequent analyses exclude product market development. Finally, the test results with factor market development as the threshold variable show that the single-threshold effect is significant at the 10% level, while the double-threshold effect is significant at the 5% level. Obviously, the double-threshold effect of factor market development is more significant, so this paper adopts the double-threshold model to analyse the factor market, and the two thresholds are 10.3100 and 14.9210, which are located at [10.2005, 10.3370] and [14.5645, 15.4680], respectively within the 95% confidence interval. Examining Figure 3C, which plots the likelihood function for the first threshold on the left and the second threshold on the right, it can be seen that the threshold estimates match the actual values.
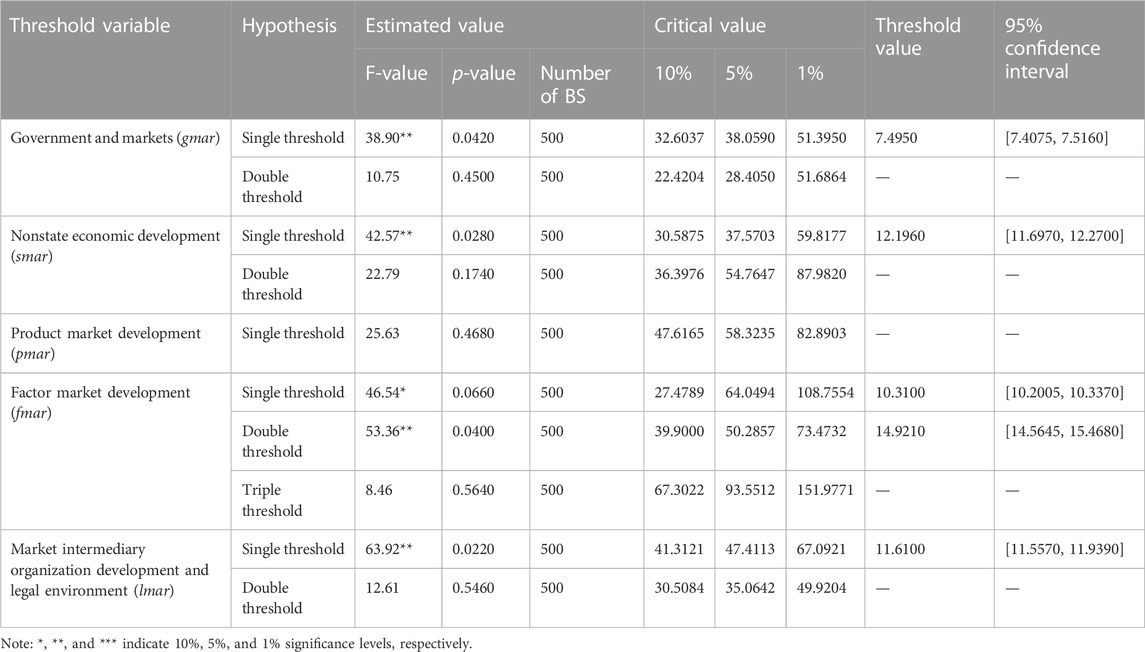
TABLE 10. Threshold effect test: impact of aspect index.

FIGURE 3. Results of the threshold effect test for the aspect index. (The aspect index includes government and markets, nonstate economic development, factor market development, market intermediary organization development and legal environment).
According to the threshold effect test and the determination of the threshold value of all aspects of the marketization process in the previous section, this paper carries out a single-threshold effect regression with government-market relationship, non-state economic development, market intermediary organization and legal environment as the threshold variables and a double-threshold effect regression with factor market development as the threshold variable. The results are shown in Table 11.
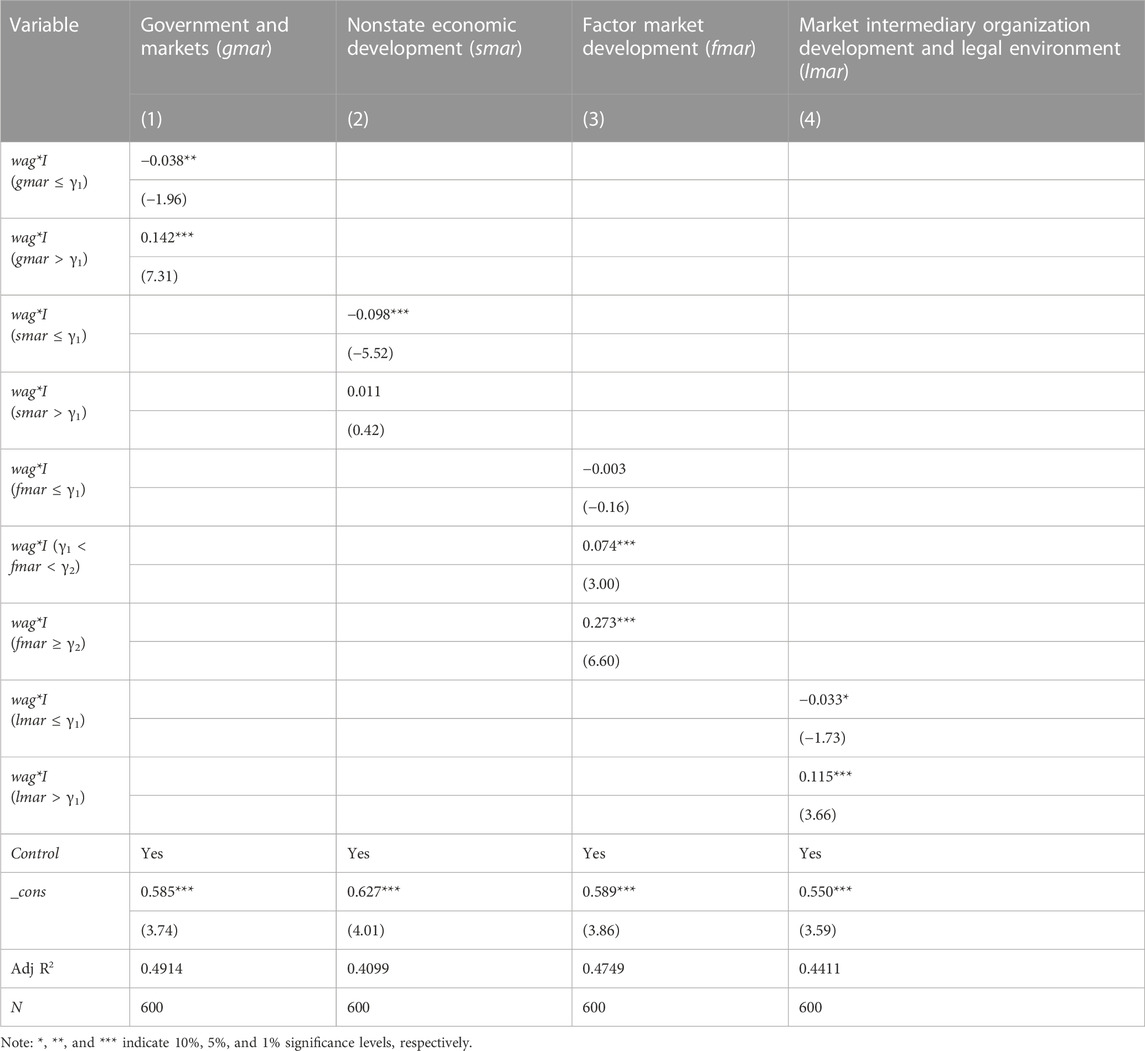
TABLE 11. Threshold effect regression results: impact of aspect index.
First, the impact of high-tech industry agglomeration on green economic efficiency has significant nonlinear characteristics with the evolution of the government-market relationship. When the government-market relationship is lower than the threshold value of 7.4950, the estimated coefficient of high-tech industry agglomeration is negative and significant at the 5% level, and when the government-market relationship crosses the threshold value, the regression coefficient of high-tech industry agglomeration turns positive and passes the significance test of 1%. This indicates that the government-market relationship is an important factor affecting the relationship between high-tech industry agglomeration and green economic efficiency. When the government-market relationship is deteriorating, high-tech industry agglomeration is not conducive to the enhancement of green economic efficiency, while with the continuous optimization of the government-market relationship, high-tech industry agglomeration plays a stronger role in promoting green economic efficiency. Second, the estimation results with non-state economic development as the threshold variable show that when the level of non-state economic development is lower than 12.1960, the regression coefficient of high-tech industry agglomeration on green economic efficiency is negative and passes the 1% significance level test. This indicates that high-tech industry agglomeration is unfavourable to the enhancement of green economic efficiency in the first threshold range, and when the level of non-state economic development is more than the threshold of 12.1960, the estimated coefficient of high-tech industry agglomeration turns positive but is not statistically significant.
Third, the regression results with factor market development as the threshold variable show that the estimated coefficient of high-tech industry agglomeration is negative but insignificant when factor market development is lower than 10.3100 and that high-tech industry agglomeration significantly improves green economic efficiency at the 1% level when factor market development exceeds 10.3100. Moreover, with factor market development rising to the third threshold range (greater than 14.9210), high-tech industry agglomeration has the strongest positive effect on green economic efficiency. Fourth, the estimation results with the market intermediary organization and legal environment as the threshold variables show that when the market intermediary organization and legal environment are imperfect and the development level is lower than 11.6100, the estimated coefficient of high-tech industry agglomeration is negative and significant at the 10% level and that when the market intermediary organization and the legal environment are continuously improved after crossing the threshold, high-tech industry agglomeration can strongly promote green economic efficiency.
To facilitate the observation of the development status of the current marketization process in each province, Table 12 provides a regional division of the distribution of the sample in 2020 based on the different aspects of the marketization process mentioned above. First, under the influence of the government-market relationship, 27 provinces in China are in the first threshold range, where high-tech industry agglomeration is not conducive to the enhancement of green economic efficiency. Only Guangdong, Shanghai and Jiangsu provinces have a better relationship between the government and the market and are in the second threshold range, where high-tech industry agglomeration positively affects green economic efficiency. Second, under the influence of non-state economic development, 23 provinces do not cross the threshold and are located in the first threshold range, and only 7 provinces cross the threshold, which means that only a few regions have better non-state economic development, which is conducive to stimulating the green economic effect of high-tech industry agglomeration. Third, under the influence of the factor market, nearly half of the provinces in China are located in the second threshold range from 10.3100 to 14.9210. Although high-tech industry agglomeration has a positive impact on green economic efficiency, it does not reach the optimal conditions to stimulate the green economic effect of high-tech industry agglomeration. Only six provinces, North, Shanghai, Guangdong, Jiangsu, Zhejiang and Tianjin, are located in the optimal third threshold range, and there are still 10 provinces with poor factor market development, where high-tech industry agglomeration inhibits green economic efficiency, and these 10 provinces also become the key areas for deepening factor market reform in the future. Fourth, under the influence of market intermediary organization and the legal environment, 16 provinces are located in the first threshold range, and they are all from the central and western regions. The high-tech industry agglomeration in these regions is not conducive to enhancing green economic efficiency. Fourteen provinces cross the threshold and are located in the second threshold range, including all nine provinces in the east, Hubei, Jiangxi and Anhui in the centre and Chongqing and Sichuan in the west. The favourable market intermediary organization and legal environment in those places play a positive role in the relationship between high-tech industry agglomeration and green economic efficiency.
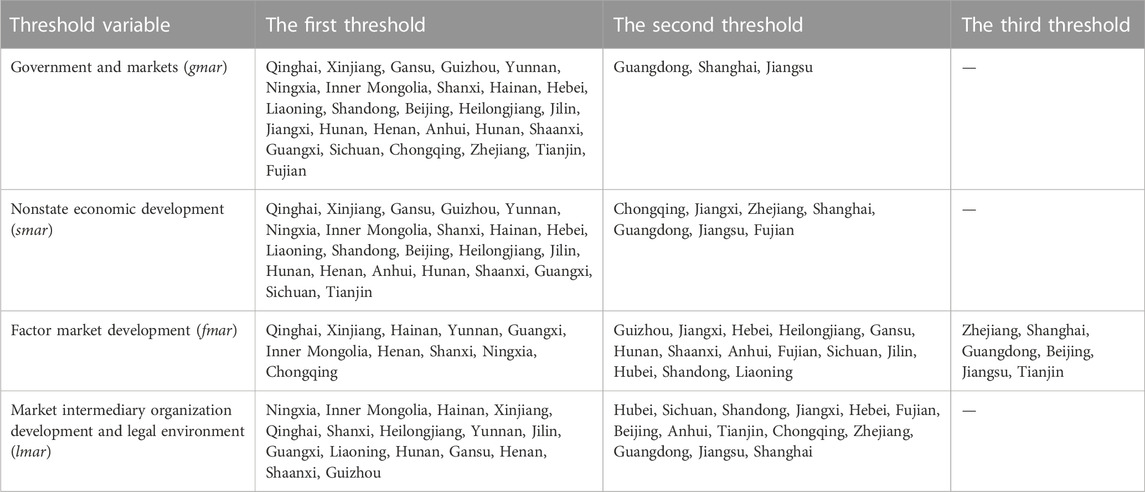
TABLE 12. Characteristics of the sample distribution under the impact of the aspect index.
There are large differences in the impact of the marketization process on the development level of different industries within high-tech industries, which may have a heterogeneous impact on green economic efficiency. This paper further takes the total marketization index as the threshold variable to analyse the threshold effect of the impact of the agglomeration of different industries within high-tech industries on green economic efficiency, and the results of the threshold effect test and threshold estimation are reported in Table 13.
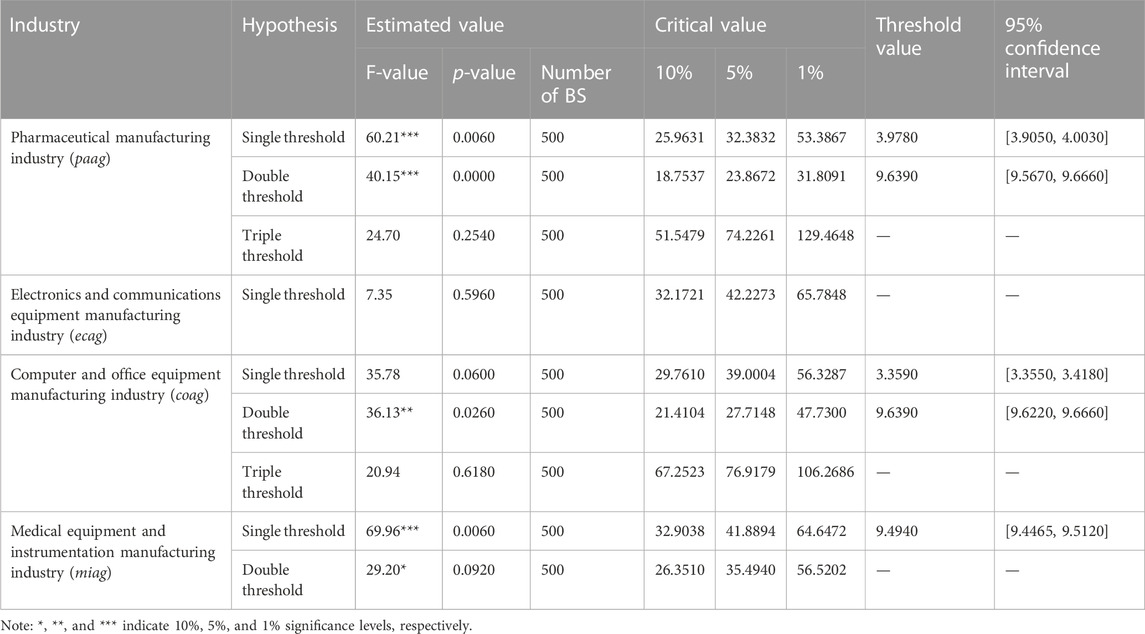
TABLE 13. Threshold effect test results: industry differences.
First, for the pharmaceutical manufacturing industry, both the single-threshold effect and the double-threshold effect are highly significant at the 1% level, indicating that there is a significant double-threshold effect on the impact of pharmaceutical manufacturing industry agglomeration on green economic efficiency due to the difference in marketization level. The threshold estimates are 3.9780 and 9.6390, respectively, corresponding to 95% confidence intervals of [3.9050, 4.0030] and [9.5670, 9.6660]. Second, the test results for the electronics and communications equipment manufacturing industry show that neither the single-threshold nor the double-threshold effect is significant, indicating that there is no marketable threshold effect of the impact of industry agglomeration on green economic efficiency. Therefore, the electronics and communications equipment manufacturing industry will be excluded from the threshold effect regression analysis in a later section. Third, the threshold effect test for the computer and office equipment manufacturing industry shows that the double-threshold effect is significant at the 5% level, and the two thresholds are 3.3590 and 9.6390, which are located in the 95% confidence intervals of [3.3550, 3.4180] and [9.6220, 9.6660], respectively. This indicates that there is a marketable double-threshold effect of the influence of computer and office equipment manufacturing industry agglomeration on green economic efficiency. Fourth, the threshold effect test for the medical equipment and instrumentation manufacturing industry shows that the single-threshold effect passes the 1% significance level test, while the double-threshold effect only satisfies the 10% significance level test, indicating that there is a market-based single-threshold effect of the impact of medical equipment and instrumentation manufacturing industry agglomeration on green economic efficiency. The threshold estimate is 9.4940, and the corresponding 95% confidence interval is [9.4465, 9.5120].
According to the threshold effect test and the determination of the threshold value of different industries in the high-tech industry mentioned above, this section takes marketization as the threshold variable to carry out a regression on the threshold effect of industrial agglomeration of various industries and green economic efficiency. The results are shown in Table 14.
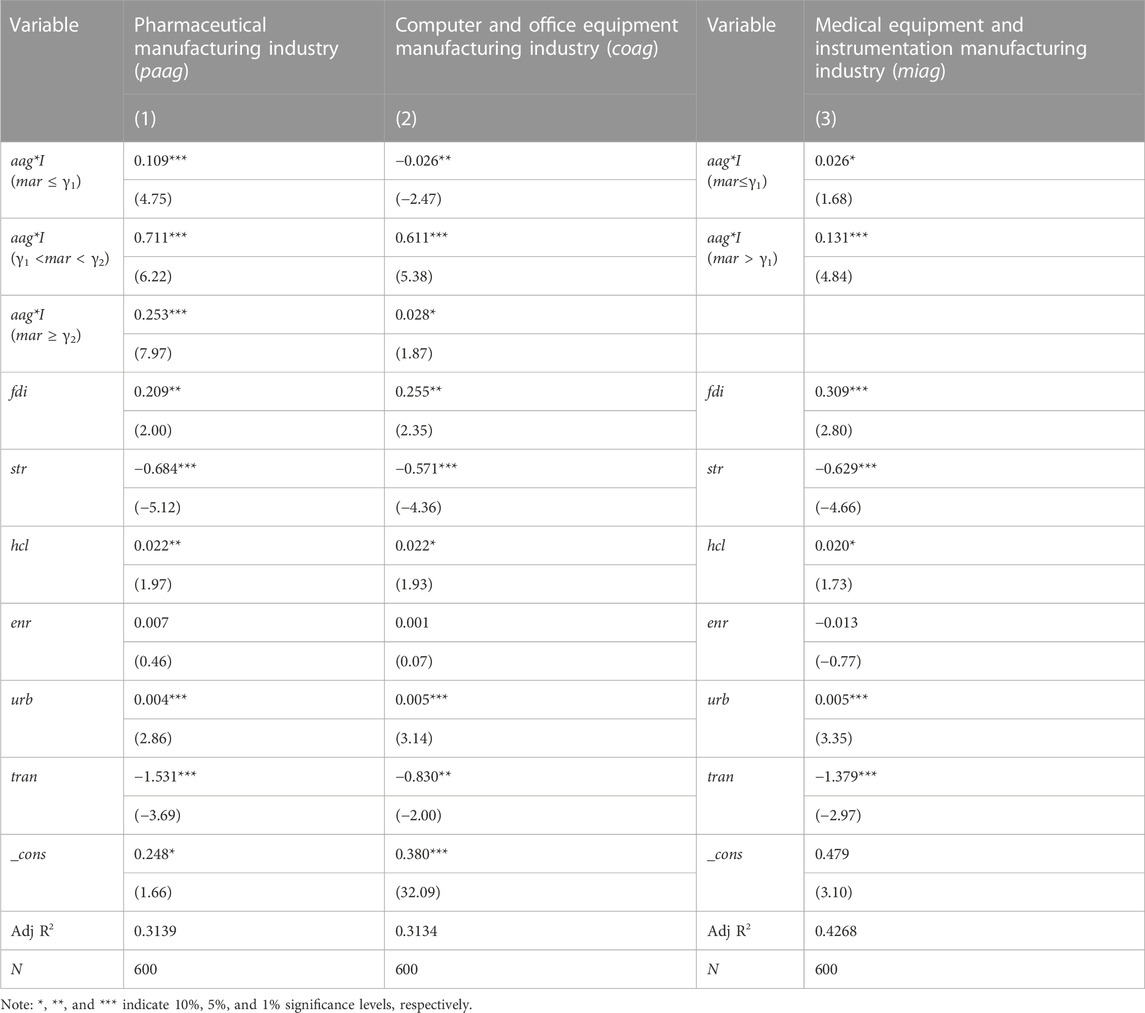
TABLE 14. Threshold effect regression results: industry differences.
First, the impact of pharmaceutical manufacturing industry agglomeration on green economic efficiency has a significant threshold effect with the marketization process. When the level of marketization is lower than 3.9780, the estimated coefficient of pharmaceutical manufacturing industry agglomeration is 0.109 and passes the 1% significance level test. When the marketization level increases to between 3.9780 and 9.6390, the direction of the impact of pharmaceutical manufacturing industry agglomeration on green economic efficiency is still positive and significant, but the intensity of the effect increases to 0.711. When the marketization level further exceeds 9.6390, the estimated coefficient of pharmaceutical manufacturing industry agglomeration decreases to 0.253 and is still highly significant, which indicates that pharmaceutical manufacturing industry agglomeration does have a significant impact on improving regional green economic efficiency, but this effect varies greatly with the marketization process, and the positive effect reaches the maximum when the marketization level is in the second threshold range.
Second, for the computer and office equipment manufacturing industry, when the marketization level is less than 3.3590, industry agglomeration has an inhibitory effect on green economic efficiency. When the marketization level crosses 3.3590 and is less than 9.6390, the estimated coefficient of industry agglomeration becomes positive, and with the further increase in the marketization level to the third threshold range, the estimated coefficient of industry agglomeration is still positive and significant, but the strength of the effect decreases substantially.
Finally, for the medical equipment and instrumentation manufacturing industry, its regression coefficient is positive in both the first and second threshold ranges, and when the marketization level is lower than 9.4940, the impact is small (0.026), while when the marketization level crosses the threshold, the impact is suddenly strengthened (0.131). This indicates that under the influence of the market environment, the impact of medical equipment and instrumentation manufacturing industry agglomeration on green economic efficiency has a significant positive and increasing marginal effect evolutionary trajectory.
This study analyses the nonlinear relationship between high-tech industry agglomeration and green economic efficiency from the perspective of marketization, statistically analyses provincial panel data of 30 provinces in China from 2001 to 2020, constructs a panel threshold econometric model to test whether the impact effect of high-tech industry agglomeration on green economic efficiency changes along with the evolution of the total marketization index and all aspect indices, and further penetrates into the broad categories of industries in high-tech industry to test whether there is a market-oriented threshold effect in the influence of various industries’ industrial agglomeration on green economic efficiency.
The results show that: 1) the influence effect of the total marketization index shows that there is a double-threshold effect of high-tech industry agglomeration on green economic efficiency. When the marketization level is lower than 5.862, high-tech industry agglomeration has an inhibitory effect on green economic efficiency; when the marketization level is increased to between 5.862 and 8.938, high-tech industry agglomeration has a strong promotional effect on green economic efficiency; and when the marketization level is greater than 8.938, the positive effect of high-tech industry agglomeration on green economic efficiency is weakened. During the study period, the marketization level of most provinces in China is located in the second threshold range, and the low-marketization level regions are dominated by Yunnan-Guizhou and Northwest China, while the high-marketization level regions are all eastern provinces. 2) The influence effect of the aspect index on marketization shows that, under the influence of the government-market relationship (threshold value of 7.495), non-state economic development (threshold value of 12.196), market intermediary organization development and legal environment (threshold value of 11.61), the impact of high-tech industry agglomeration on green economic efficiency has a single-threshold effect, and when it is located in the first threshold range, high-tech industry agglomeration is not conducive to the improvement of green economic efficiency. When they are located in the first threshold interval, high-tech industry agglomeration is not conducive to enhancing green economic efficiency, and when they cross the threshold, the impact of high-tech industry agglomeration on green economic efficiency turns positive. Factor market development has a double-threshold effect (threshold values of 10.31 and 14.921), and the effect of high-tech industry agglomeration on green economic efficiency is negative but not significant in the first threshold range and positive and gradually increasing in strength in the second and third threshold ranges. There is no threshold effect on product market development. 3) The industry differences test shows that the pharmaceutical manufacturing industry (threshold values of 3.978 and 9.639) and the computer and office equipment manufacturing industry (threshold values of 3.359 and 9.639) have a double-threshold effect due to the difference in marketization level. Pharmaceutical manufacturing industry agglomeration in the three threshold ranges has a positive impact, but the intensity of the role in the second threshold range reaches the maximum. The effect of computer and office equipment manufacturing industry agglomeration changes from negative to positive, and the positive effect is also the largest in the second threshold range. The influence of medical equipment and instrumentation manufacturing industry agglomeration on green economic efficiency has a single-threshold effect (threshold value is 9.494), which shows a positive evolution trajectory with an increasing marginal effect. The impact of electronics and communications equipment manufacturing industry agglomeration on green economic efficiency does not change with the marketization level.
Based on the above research conclusions, this study has the following policy insights: 1) Strengthen market leadership, build a new mechanism for market-driven green development and agglomeration of high-tech industries, and fully release the institutional dividend of the market in green development. Taking the construction of a unified national market as an opportunity gives full play to the decisive role of the market in resource allocation and reduces the excessive intervention of the government in high-tech industry agglomeration, especially in the central and western regions, to accelerate the pace of the unified big market construction and to create a good and loose market environment. 2) Promote high-standard market system construction with the help of the new round of technological revolutions, such as the digital economy, artificial intelligence and the Internet of Things, and guide the green transformation of the non-state economy in the field of high-tech industries. Fully implement the “36 Articles on Nonpublic Economy,” unswervingly encourage, support and guide non-state economic development, and further expand the development space for the non-state economy to participate in high-tech industries. The independent innovation of non-state-owned high-tech enterprises should be encouraged and supported, the construction of a market-oriented green technology innovation system should be accelerated, and non-state-owned high-tech enterprises should be encouraged to move towards the path of green transformation to continuously improve green economic efficiency. 3) Promote the standardization and unity of the product market, strengthen the top-level design of the product marketization reform, guide the green transformation of the social production mode and consumption mode, promote the upgrading of the consumption structure, and create a good market environment for the realization of high-tech industrial product value. 4) Build a unified and competitive factor market, guide financial and human resources to gather in high-tech industries, open up the “last kilometre” for the transfer of technological achievements, enhance the marketization level of emerging technology applications, and promote green economic efficiency. In addition, China should actively cultivate and strengthen market intermediary organizations that serve the green transformation and agglomeration development of high-tech industries while strengthening legislation, improving the economic legal system, promoting the rapid improvement of the market legal environment, and creating a good legal environment for improving green economic efficiency.
Limitations of this study and future research directions: First, the research object is the high-tech industry and its four major categories, the research scope still remains at the macro and meso levels. High-tech enterprises are the micro entities of high-tech industry agglomeration, and this study lacks the combination of micro enterprise level data for micro mechanism analysis and empirical investigation. Therefore, in future research, high-tech enterprises can be used as research objects to analyze the green transformation behavior of enterprises from the perspectives of production processes, technological innovation, energy utilization, etc., so as to make the research scope as comprehensive as possible. Second, as the relevant data of China’s high-tech and major industries are only calculated to the provincial level, the data at the city level is seriously missing, for this reason, the panel data of 30 provinces can only be used in this study. Therefore, in future research, we can try to use spatial big data to capture the location of enterprises to construct a high-tech industry agglomeration index, and analyze its spatial correlation and spillover effects on green economy efficiency from a spatial perspective.
The data analyzed in this study is subject to the following licenses/restrictions: Except for the data related to the level of marketization from the Report on the Marketization Index of China’s Provinces, other original data are derived from the China Statistical Yearbook on High Technology Industry, China Statistical Yearbook on Environment, China Economic Census Yearbook, China Statistical Yearbook on Science and Technology, China Statistical Yearbook, Statistical Yearbook of the Chinese Investment in Fixed Assets and the statistical yearbooks of provinces. Requests to access these datasets should be directed to Jinqian Deng, dengjq@lzu.edu.cn.
NZ: Writing–original draft, Writing–review and editing. JD: Writing–original draft, Writing–review and editing. YG: Data curation, Writing–original draft. FA: Writing–review and editing.
The author(s) declare financial support was received for the research, authorship, and/or publication of this article. This work was funded by the National Social Science Foundation of China (Grant No. 22XJL011); the Fundamental Research Funds for the Central Universities (Grant No. 2022jbkyjd010); the Soft Science Special Project of Gansu Basic Research Plan (Grant No. 23JRZA527).
The authors are grateful to the referees who provided valuable comments and suggestions to significantly improve the quality of the paper.
The authors declare that the research was conducted in the absence of any commercial or financial relationships that could be construed as a potential conflict of interest.
All claims expressed in this article are solely those of the authors and do not necessarily represent those of their affiliated organizations, or those of the publisher, the editors and the reviewers. Any product that may be evaluated in this article, or claim that may be made by its manufacturer, is not guaranteed or endorsed by the publisher.
Atuahene-Gima, K., and Li, H. (2002). When does trust matter? antecedents and contingent effects of supervisee trust on performance in selling new products in China and the United States. J. Mark. 66 (3), 61–81. doi:10.1509/jmkg.66.3.61.18501
Brunnermeier, S. B., and Cohen, M. A. (2003). Determinants of environmental innovation in US manufacturing industries. J. Environ. Econ. Manag. 45 (2), 278–293. doi:10.1016/S0095-0696(02)00058-X
Chen, F., Ahmad, S., Arshad, S., Ali, S., Rizwan, M., Saleem, M. H., et al. (2022). Towards achieving eco-efficiency in top 10 polluted countries: the role of green technology and natural resource rents. Gondwana Res. 110, 114–127. doi:10.1016/j.gr.2022.06.010
Chen, W., Huang, X., Liu, Y., Luan, X., and Song, Y. (2019). The impact of high-tech industry agglomeration on green economy efficiency—evidence from the Yangtze River economic belt. Sustainability 11 (19), 5189. doi:10.3390/su11195189
Chen, X. B., and Feng, Y. X. (2023). Is government R&D expenditure beneficial for leveraging the innovation performance of small and medium enterprises: a nonlinear threshold effect test based on panel data of industrial enterprises. Stat. Res. 40 (10), 57–68. doi:10.19343/j.cnki.11-1302/c.2023.10.005
Chuntian, C., Fu, C., Gang, L., Bora, R., Ali, M., Tu, Q., et al. (2018). Reform and renewables in China: the architecture of yunnan's hydropower dominated electricity market. Renew. Sustain. Energy Rev. 94, 682–693. doi:10.1016/j.rser.2018.06.033
Delgado, V. M., Castro, G. M., and Amores, S. J. (2016). Intellectual capital and radical innovation: exploring the quadratic effects in technology-based manufacturing firms. Technovation 54, 35–47. doi:10.1016/j.technovation.2016.02.002
Deng, F., and Ren, Z. Z. (2021). Information network, high-tech industrial agglomeration and industrial green transformation. Econ. Surv. 38 (3), 76–85. doi:10.15931/j.cnki.1006-1096.2021.03.006
Dong, F., Wang, Y., Zheng, L., Li, J., and Xie, S. (2019). Can industrial agglomeration promote pollution agglomeration? Evidence from China. J. Clean. Prod. 246, 118960. doi:10.1016/j.jclepro.2019.118960
Dong, M. F., and Han, X. F. (2016). Has R&D investment affected the technological efficiency of strategic emerging industries? Sci. Sci. Manag. S.& Trans. 37 (1), 95–107.
Fan, D., and Sun, X. (2020). Environmental regulation, green technological innovation, and green economic growth. China Popul. Resour. Environ. 30 (6), 105–115. doi:10.12062/cpre.20200123
Fan, G., Ma, G., and Wang, X. (2019). Institutional reform and economic growth of China: 40-year progress toward marketization. Acta Oeconomica 69, 7–20. (s1). doi:10.1556/032.2019.69.S1.2
Fan, Y., Liao, H., and Wei, Y. M. (2007). Can market oriented economic reforms contribute to energy efficiency improvement? Evidence from China. Energy Policy 35 (4), 2287–2295. doi:10.1016/J.ENPOL.2006.07.011
Galinato, G. I., and Chouinard, H. H. (2018). Strategic interaction and institutional quality determinants of environmental regulations. Resour. Energy Econ. 53, 114–132. S0928765516301026. doi:10.1016/j.reseneeco.2018.04.001
Gregori, P., and Holzmann, P. (2022). Entrepreneurial practices and the constitution of environmental value for sustainability. Bus. Strategy Environ. 31, 3302–3317. doi:10.1002/bse.3077
Guo, A. J., and Zhang, N. (2020). The effect of market-oriented reform on green development efficiency: a theoretical mechanism and empirical test. China Popul. Resour. Environ. 30 (8), 118–127. doi:10.12062/cpre.20200317
Hansen, B. E. (1999). Threshold effects in non-dynamic panels: estimation, testing, and inference. J. Econ. 93 (2), 345–368. doi:10.1016/S0304-4076(99)00025-1
Henderson, J. V. (2003). Marshall's scale economies. J. Urban Econ. 53, 1–28. doi:10.1016/S0094-1190(02)00505-3
Henderson, V. (2001). Marshall's scale economies. Work. Pap. 53 (1), 1–28. doi:10.1016/S0094-1190(02)00505-3
Horbach, J. (2008). Determinants of environmental innovation—new evidence from German panel data sources. Res. Policy 37 (1), 163–173. doi:10.1016/j.respol.2007.08.006
Hossain, M. M., Wang, L., and Yu, J. (2023). The reputational costs of corporate environmental underperformance: evidence from China. Bus. Strategy Environ., 1–9. doi:10.1002/bse.3528
Hsieh, C. T., and Klenow, P. J. (2009). Misallocation and manufacturing TFP in China and India. Q. J. Econ. 124 (4), 1403–1448. doi:10.2139/ssrn.1442871
Hu, A. J., Guo, A. J., Zhong, F. L., Wang, X. B., et al. (2018a). Can the high-tech industrial agglomeration improve the green economic efficiency of the region? China Popul. Resour. Environ. 28 (9), 93–101. doi:10.12062/cpre.20180404
Hu, J., Wang, Z., Lian, Y., and Huang, Q. (2018b). Environmental regulation, foreign direct investment and green technological progress—evidence from Chinese manufacturing industries. Int. J. Environ. Res. Public Health 15 (2), 221. doi:10.3390/ijerph15020221
Jahanger, A., Yu, Y., Hossain, M. R., Murshed, M., Balsalobrelorente, D., Khan, U., et al. (2022). Going away or going green in NAFTA nations? Linking natural resources, energy utilization, and environmental sustainability through the lens of the EKC hypothesis. Resour. Policy 79, 103091. doi:10.1016/j.resourpol.2022.103091
Li, L., Hong, X., and Peng, K. (2019). A spatial panel analysis of carbon emissions, economic growth and high-technology industry in China. Struct. Change Econ. Dyn. 49, 83–92. doi:10.1016/j.strueco.2018.09.010
Liu, X., and Meng, Y. (2020). An empirical study on relationships of industrial agglomeration, maketization degree, and industrial innovation performance—evidences from Chinese high-tech industry. Econ. Surv. 37 (1), 105–113. doi:10.15931/j.cnki.1006-1096.2020.01.005
Lou, L., Li, J., and Zhong, S. (2021). Sulfur dioxide (SO2) emission reduction and its spatial spillover effect in high-tech industries: based on panel data from 30 provinces in China. Environ. Sci. Pollut. Res. 28, 31340–31357. doi:10.1007/s11356-021-12755-7
Martínez, Z. I., and Maruotti, A. (2011). The impact of urbanization on CO2 emissions: evidence from developing countries. Ecol. Econ. 70 (7), 1344–1353. doi:10.1016/j.ecolecon.2011.02.009
Nguyen, N. P., and Adomako, S. (2021). Environmental proactivity, competitive strategy, and market performance: the mediating role of environmental reputation. Bus. Strategy Environ. 30 (4), 2008–2020. doi:10.1002/bse.2729
Pierce, D. W. (1996). Blueprint for a green economy, 12. Beijing: Beijing Normal University Publishing Group. Translated by Chu ZF et al. doi:10.1016/0921-8009(93)90022-X
Rafei, M., Esmaeili, P., and Balsalobrelorente, D. (2022). A step towards environmental mitigation: how do economic complexity and natural resources matter? Focusing on different institutional quality level countries. Resour. Policy 78, 102848. doi:10.1016/j.resourpol.2022.102848
Rashidi, K., and Saen, R. F. (2015). Measuring eco-efficiency based on green indicators and potentials in energy saving and undesirable output abatement. Energy Econ. 50, 18–26. JUL. doi:10.1016/j.eneco.2015.04.018
Sueyoshi, T., and Goto, M. (2012). Returns to scale and damages to scale under natural and managerial disposability: strategy, efficiency and competitiveness of petroleum firms. Energy Econ. 34 (3), 645–662. doi:10.1016/j.eneco.2011.07.003
Sun, Z., Liu, L. H., and Sun, Y. Z. (2014). Degree of marketization, local protectionism and spillover effects of R&D—empirical evidence from Chinese industries. J. Manag. World (8), 78–89. doi:10.19744/j.cnki.11-1235/f.2014.08.008
Talberth, J., and Bohara, A. K. (2006). Economic openness and green GDP. Ecol. Econ. 58 (4), 743–758. doi:10.1016/j.ecolecon.2005.09.002
Tanaka, K., and Managi, S. (2021). Industrial agglomeration effect for energy efficiency in Japanese production plants. Energy Policy 156, 112442. doi:10.1016/j.enpol.2021.112442
Tang, C., Xue, Y., Wu, H. T., Irfan, M., and Hao, Y. (2022). How does telecommunications infrastructure affect eco-efficiency? Evidence from a quasi-natural experiment in China. Technol. Soc. 69, 101963. doi:10.1016/j.techsoc.2022.101963
Tone, K., and Sahoo, B. K. (2003). Scale, indivisibilities and production function in data envelopment analysis. Int. J. Prod. Econ. 84 (2), 165–192. doi:10.1016/S0925-5273(02)00412-7
UNEP (2014). Towards a green economy: pathways to sustainable development and poverty eradication. Available at: http://www.unep.org/greeneconomy,2014-11-02.
Wang, X. L., Fan, G., and Hu, L. P. (2018). Marketization index report of China's provinces. CHINA: Social Sciences Academic Press.
Wang, X. L., Fan, G., and Hu, L. P. (2021). Marketization index report of China's provinces. Beijing: Social Sciences Academic Press CHINA.
Wu, R., and Lin, B. (2021). Does industrial agglomeration improve effective energy service: an empirical study of China's iron and steel industry. Appl. Energy 295 (3), 117066. doi:10.1016/j.apenergy.2021.117066
Xia, J., Ortiz, J., and Wang, H. (2016). Reverse technology spillover effects of outward fdi to p.r. China: a threshold regression analysis. Appl. Econ. Q. Former. Konjunkturpolitik) 62, 51–67. doi:10.3790/aeq.62.1.51
Xie, W. M., and Fang, H. X. (2011). Financial development, financing constrains and firms’ R&D investment. J. Financial Res. (5), 171–183.
Yang, H., Xu, X., and Zhang, F. (2022). Industrial co-agglomeration, green technological innovation, and total factor energy efficiency. Environ. Sci. Pollut. Res. 29 (41), 62475–62494. doi:10.1007/s11356-022-20078-4
Yang, N. N., Liu, Q. M., and Chen, Y. E. (2021). Does industrial agglomeration promote regional innovation convergence in China? Evidence from high-tech industries. Ieee Trans. Eng. Manag. 70, 1416–1429. doi:10.1109/TEM.2021.3084936
Yang, Z. J., and Wen, C. X. (2017). Evaluation on China’s green development efficiency and regional disparity. Econ. Geogr. 37 (3), 10–18. doi:10.15957/j.cnki.jjdl.2017.03.002
Yue, S. J., Yang, Y., and Xu, Y. (2015). The integrated performance of market transformation and urban agglomeration from the perspective of green development efficiency. Finance Econ. 2015 (12), 80–91.
Zhang, B. B., Tian, X., and Zhu, J. (2017). Environmental pollution control, marketization and energy efficiency: a theoretical and empirical analysis. Nanjing J. Soc. Sci. (2), 39–46. doi:10.15937/j.cnki.issn1001-8263.2017.02.005
Zhang, N., and Choi, Y. (2013). Environmental energy efficiency of China’s regional economies: a non-oriented slacks-based measure analysis. Soc. Sci. J. 50 (2), 225–234. doi:10.1016/j.soscij.2013.01.003
Zhang, N., Kong, F., Choi, Y., and Zhou, P. (2014). The effect of size-control policy on unified energy and carbon efficiency for Chinese fossil fuel power plants. Energy Policy 70, 193–200. doi:10.1016/j.enpol.2014.03.031
Zhao, L. H., and Rasoulinezhad, E. (2023). Role of natural resources utilization efficiency in achieving green economic recovery: evidence from BRICS countries. Resour. Policy 80, 103164–164. doi:10.1016/j.resourpol.2022.103164
Zhao, X., Mahendru, M., Ma, X., Rao, A., and Shang, Y. (2022). Impacts of environmental regulations on green economic growth in China: new guidelines regarding renewable energy and energy efficiency. Renew. Energy 187, 728–742. doi:10.1016/j.renene.2022.01.076
Keywords: high-tech industry agglomeration, green economic efficiency, marketization, threshold effect, industry categories
Citation: Zhang N, Deng J, Gu Y and Ahmad F (2023) Does the agglomeration of high-tech industries improve the efficiency of China’s green economy? Analysis based on the marketization. Front. Environ. Sci. 11:1326393. doi: 10.3389/fenvs.2023.1326393
Received: 23 October 2023; Accepted: 30 November 2023;
Published: 14 December 2023.
Edited by:
Xianyou Pan, Shanghai University of Electric Power, ChinaReviewed by:
Qiying Ran, Xinjiang University, ChinaCopyright © 2023 Zhang, Deng, Gu and Ahmad. This is an open-access article distributed under the terms of the Creative Commons Attribution License (CC BY). The use, distribution or reproduction in other forums is permitted, provided the original author(s) and the copyright owner(s) are credited and that the original publication in this journal is cited, in accordance with accepted academic practice. No use, distribution or reproduction is permitted which does not comply with these terms.
*Correspondence: Jinqian Deng, ZGVuZ2pxQGx6dS5lZHUuY24=
†ORCID: Na Zhang, orcid.org/0000-0002-9472-2578; Jinqian Deng, orcid.org/0000-0001-6534-5614; Fayyaz Ahmad, orcid.org/0000-0001-9038-0817
Disclaimer: All claims expressed in this article are solely those of the authors and do not necessarily represent those of their affiliated organizations, or those of the publisher, the editors and the reviewers. Any product that may be evaluated in this article or claim that may be made by its manufacturer is not guaranteed or endorsed by the publisher.
Research integrity at Frontiers
Learn more about the work of our research integrity team to safeguard the quality of each article we publish.