 Yuran Feng1
 Huajin Li
- 1Department of Civil Engineering, SIchuan College of Architectural Technology, Deyang, China
- 2School of Architecture and Civil Engineering, Chengdu University, Chengdu, China
- 3Sichuan Engineering Research Center for Mechanical Properties and Engineering Technology of Unsaturated Soils, Chengdu University, Chengdu, China
Earthquake-induced landslides are ubiquitous on slopes in terrestrial environments, which can pose a serious threat to local communities and infrastructures. Data-driven landslide assessments play a crucial role in preventing future landslide occurrences and recurrences. We present a novel granular computing approach that assesses landslide risk by combining fuzzy information granulation and a stacked autoencoder algorithm. The stacked autoencoder is trained using an end-to-end learning strategy to obtain a central latent vector with reduced dimensionality. The multivariate landslide dataset was used as both the input and output to train the stacked autoencoder algorithm. Subsequently, in the central latent vector of the stacked autoencoder, the Fuzzy C-means clustering algorithm was applied to cluster the landslides into various groups with different risk levels, and the intervals for each group were computed using the granular computing approach. An empirical case study in Wenchuan County, Sichuan, China, was conducted. A comparative analysis with other state-of-the-art approaches including Density-based spatial clustering of applications with noise (DBSCAN), K-means clustering, and Principal Component Analysis (PCA), is provided and discussed. The experimental results demonstrate that the proposed approach using a stacked autoencoder integrated with fuzzy information granulation provides superior performance compared to those by other state-of-the-art approaches, and is capable of studying deep patterns in earthquake-induced landslide datasets and provides sufficient interpretation for field engineers.
1 Introduction
Landslides are a major type of natural geohazard and are defined as the movement of a mass of rock, debris, or Earth down a slope (Cruden, 1991; Gao and Meguid, 2018a; 2018b). This can cause numerous casualties and economic losses in mountainous regions (Li et al., 2023). Multiple factors can trigger landslides, including rainfall, earthquake shaking, water level changes, storm waves, rapid stream erosion, and human factors. Among them, earthquake-induced landslides are the most hazardous due to the rapid occurrence and large size of slope failures (Shi et al., 2021).
In practice, landslide risk assessment plays a crucial role in field engineering (Rajabi et al., 2022). The general process involves estimating the level of risk, deciding its appropriateness, and exercising control measures to reduce risk by observing an elevation in risk levels (Dai et al., 2002; Gao et al., 2020; Zhou J. et al., 2021; Chowdhuri et al., 2022). Such procedures are typically followed for landslide assessment and mitigation at regional or catchment scales (Pokharel et al., 2021). The Geographic Information System (GIS) environment in landslide susceptibility map preparation is an effective method for identifying and delineating landslide-prone areas to create a geospatial database of landslide occurrence or ‘landslide inventory’ (Merghadi et al., 2020). The geospatial properties of landslides can be compiled into a comprehensive database using GIS (Karakas et al., 2021). These properties include slope angle, slope aspect, soil type, precipitation, lithology type, and geometric parameters (Gao et al., 2021; Kasama et al., 2021; Zhou et al., 2022). All the properties in the database are valuable for assessing slope stability and modeling the responses of other slopes in the study area to predict future landslide occurrences (Van Westen et al., 2006).
In recent years, data-driven models and frameworks have achieved great success in landslide risk assessment using GIS-based databases. For example, volumetric estimation, spatial geometric computation, and maximum displacement prediction are all considered part of the assessment tasks in engineering practice (Zhou Q. et al., 2021). Althuwaynee et al. (2014) integrated decision trees and logistic regression models to predict the overall landslide risk using multivariate analysis. Huang et al. (2018) applied a support vector machine (SVM) to forecast landslide susceptibility using a GIS-based dataset. Xu et al. (2019) performed a comparative analysis of seven benchmark data mining algorithms and predicted the maximum landslide displacement in loess landslides in Heifangtai, China. Gorsevski et al. (2016) introduced an artificial neural network (ANN) to predict landslide risks simultaneously using GIS-data and Lidar data. The experimental results demonstrated that the ANN offered superior prediction performance and was capable of learning the relationship between geospatial properties and overall landslide risk.
For the time being, advanced analytical tools such as artificial intelligence (AI) and deep-learning (DL) are also playing an increasingly important role in evaluating landside risks in practice. Zhao and Du (2016) initially proposed using convolutional neural network (CNN) to analyze landslide risk using remote sensing images. Paoletti et al. (2018) developed a 3-D CNN to extract both spectral and spatial information in Lidar images for risk assessment tasks. Yi et al. (2020) proposed a novel landslide susceptibility mapping and risk assessment model using multi-scale convolutional neural network (MCNN) in the image-related tasks. Various levels of geological features from low to high are studied by the algorithm to assess landslide risks. All above work provided advanced insights in terms of landslide mapping and risk assessment tasks.
Summarily, the majority of data-driven approaches that perform landslide risk assessment adopt a supervised learning strategy to train data mining or machine learning algorithms and then predict risk labels for new instances (He and Kusiak, 2017; Li, 2022a). The success of these approaches significantly depends on the availability of high-quality datasets. To generate this type of dataset, time and labor cost for field experts is inevitable. If the required dataset is relatively small, the computational and labor costs can be controlled at a reasonable level. However, some case studies may contain excessive numbers of instances within the dataset, which is challenging in practice. For instance, a single field expert may require several weeks to offer risk labels for tens of thousands of landslide instances. Therefore, it is important to develop a more efficient approach to address this challenge.
Granular computing (GC) has recently become a popular data science research direction, with considerable attention in both industry and academia. The granular computing approach adopts fuzzy rule-based modeling to derive granular descriptors for interpreting a dataset that follows an unsupervised learning strategy. Generally, two major advantages of using a granular computing approach in practice exist. First, high flexibility in coping with datasets with diverse geometries and enhancing the representation of the information granules. Thus, the constructed granules are more interpretable for understanding the essential characteristics of the dataset. Second, information granules are often constructed in a refined representation of the original data structure, which intuitively reduces computation overhead. (Ouyang and Zhang, 2022). In typical landslide risk assessment tasks, conventional machine-learning approaches usually adopt supervised-learning strategy which requires labeling the ground-truth to guide the algorithm to learn data patterns. This step becomes the foundation of a supervised-learning approach which ensures the learning quality. Granular computing can be an effective alternative option which utilizes an unsupervised-learning approach to derive the patterns within the same dataset. In comparison, the information granules can largely increase the efficiency of overall computation cost while only sacrificing a limited amount of information.
Based on the above discussion, this study proposes a combinatory data-driven framework to perform landslide risk assessment based on a stacked autoencoder (SAE) and fuzzy information granules. First, the SAE was employed as an information compressor that removed redundant information but preserved valuable patterns within the landslide dataset. The standard mean square error (MSE) loss was proposed as the loss function for training the SAE algorithm. Second, when the loss function of the SAE converged, the central latent representations of the SAE were extracted for information granule construction. Three training strategies are used to explore the optimal design of the SAE architecture. The Fuzzy-C-means (FCM) algorithm was then employed to select the prototypes for each subcluster. Finally, fuzzy-rule-based information granules were constructed using two risk measures, namely, Value-at-Risk (VaR) and Conditional-Value-at-Risk (CVaR). The risk boundaries indicating that the ranges for various levels of landslide risk were computed, and interpretation with respect to each attribute was provided. To evaluate the performance of the proposed framework, comprehensive experiments were conducted using an actual earthquake-induced landslide dataset collected from Wenchuan County, Sichuan Province, China.
The main contributions of this study are summarized as follows:
1) This research introduced SAE to compress the landslide dataset and reduced dimensionality effectively.
2) Fuzzy information granules were computed over the latent representations of the SAE and risk boundaries were computed for various levels of landslide risk based on the constructed granules.
The remainder of this article is organized as follows. The methodology for the SAE algorithm and granular computation process is introduced in Section 2. An overview of the case study area and earthquake-induced landslide dataset is presented in Section 3. The computational results and comparative analyses are presented in Section 4. Discussions are presented in Section 5, and conclusions are presented in Section 6.
2 Methodology
2.1 Stacked autoencoder
An autoencoder (AE) is a popular deep-learning architecture that effectively compresses information. In a typical AE algorithm, the input is a vector or signal, and the output reconstructs the input via an intermediate layer with a reduced number of hidden nodes. AE algorithms attempt to learn higher-level feature representations in the reduced hidden nodes, which can make the reconstruction of the original input feasible (Zabalza et al., 2016; Li, 2022b). The basic scheme of the AE algorithm is shown in Figure 1.
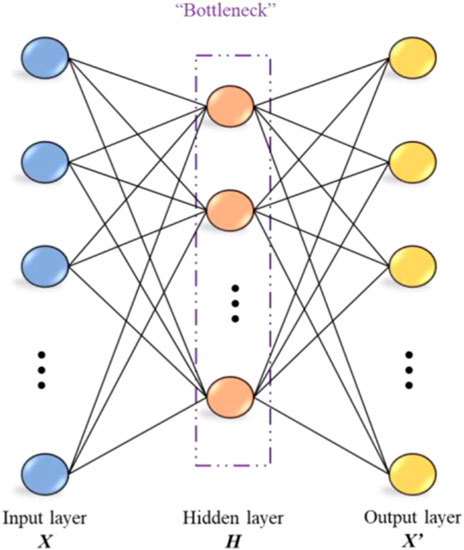
FIGURE 1. Schematic diagram of an autoencoder.
As shown in Figure 1, the autoencoder has a symmetric structure consisting of two components: an encoder and a decoder (Adem et al., 2019). The encoder contracts a nonlinear mapping between the input vector and central hidden layer nodes. For a given input data vector
where,
where,
The training process of the AE algorithm aimed to reproduce the input data vector in the output layer. Hence, internal hidden nodes can provide compressed information from the original dataset (Khamparia et al., 2020). To ensure high-quality data reconstruction, the values in the hidden nodes can be regarded as new reduced features representing the original vector X. Thus, the training of the AE continuously optimizes the parameters
where,
2.2 SAE and latent representations
An stacked autoencoder (SAE) is considered as an expansion of the traditional AE algorithm. The SAE simply stacks several layers between the input and output layers. This hierarchical structure enables the features to be learned through progressive abstraction levels (Liseune et al., 2020). A schematic of a SAW is shown in Figure 2.
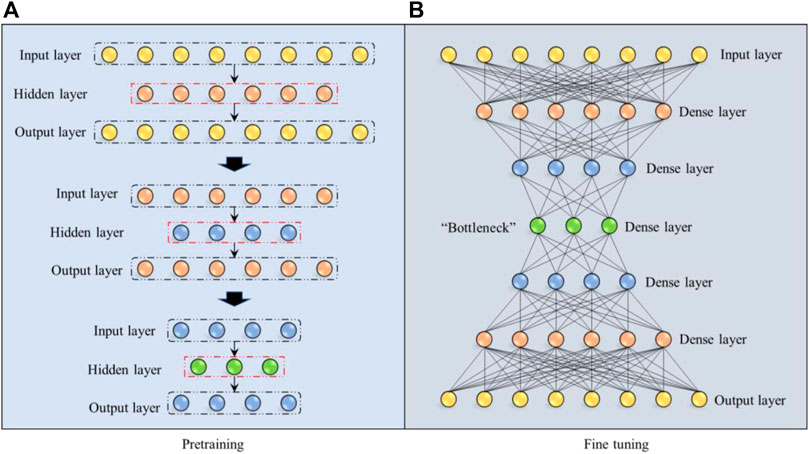
FIGURE 2. Schematic diagram of SAE.
As shown in Figure 2A, the hidden layers within the SAE were pre-trained in a greedy layer-by-layer manner. For example, a typical SAE structure comprises three hidden layers. If the input and output vectors have eight dimensions, the first hidden layer has six dimensions. It can then be formulated as a vanilla AE algorithm to pre-train the first hidden layer. Once the loss function converges to a small range, the pretraining is stopped. Next, a pre-trained hidden layer with six dimensions was used as both the input and output layers for the next pre-training step. The second hidden layer with four dimensions served as the hidden layer in the training step. Here, the same pre-training strategy was adopted as in the first step. In the final pre-training step, the last hidden layer with only three dimensions served as the hidden layer, whereas the pre-trained layer with four dimensions provided by the last step served as both the input and output layers. The majority of the reconstruction loss has been reduced in the pre-training steps while only a limited proportion of the loss has been reduced in the final fine-tuning step. Overall, multiple autoencoders were pre-trained in a bottom-up manner, enabling the encoder to effectively learn the pattern inside the dataset.
As illustrated in Figure 2B, after the pre-training of all hidden layers, all layers were stacked into a hierarchical and symmetric structure. The dense layers are the pre-trained hidden layers, as shown in Figure 2A. Then, back-propagation was applied to fine-tune all SAE network parameters. As the input and output were identical in our study, the fine-tuning was a supervised learning process.
2.3 Prototype selection
The well-trained SAE in this study served as an information compressor for dimension reduction purposes. Using the trained SAE structure, higher-level patterns inside the dataset can be effectively compressed into a central latent vector, which preserves important information from the original data space. As illustrated in Figure 2B, the central “Bottleneck” layer is considered the most compressed version of the information from the input data vector. Thus, for every input vector, the values within the “Bottleneck” layer are extracted and utilized to construct information granules in this research.
In this study, an information granule is defined as a data descriptor of a certain region in the data space according to its size and position (He and Kusiak, 2017; Ouyang et al., 2019a). To localize the granules, the selection of a prototype (data cluster center) is an essential step. An FCM (Ouyang et al., 2019c) algorithm was developed to partition the latent representations of the SAE into several data clusters. The prototype (cluster geometric center) served as a representation of a group of data points within the same constructed granular space. Here, the FCM is selected over the most popular K-mean algorithm is due to the superior capacity of FCM in selecting an actual data point as the prototype while K-mean algorithm is incapable to perform the same task.
For a given dataset
where,
The FCM starts with the determination of the number of clusters, followed by a random selection of the initial cluster centers. Each data point was assigned a membership degree to each cluster. Next, the cluster centers and corresponding membership degrees are updated iteratively by minimizing the objective function. The objective function of the FCM is expressed in Eq. 7:
where,
A visual interpretation of FCM clustering with the three sub-clusters is shown in Figure 3. This demonstrates an example of a dataset partitioned into three subclusters. The centers of each cluster (red points) were selected as prototypes. Here, the gradient of color shading indicates the value of membership similarity score with respect to the assigned clusters. The brighter color indicates the membership score is higher of a data point while a shallow color indicates lower membership similarity score.
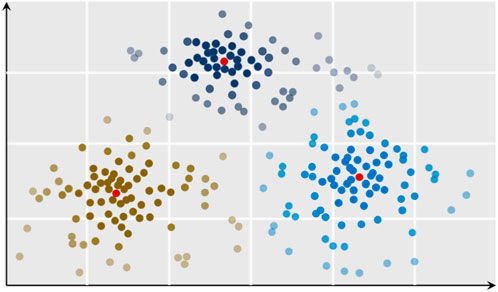
FIGURE 3. Plot depicting an example of the FCM clustering algorithm.
2.4 Optimization of information granule structures
Once the prototypes were selected using the FCM algorithm, it was essential to determine the size of the information granules. According to the general rules of data description methods, a set of information granules is the concentration of numeric prototypes and their membership points, which are formed as data descriptors (Li, 2022b). In this study, we considered generic and simple granule formations based on the radius parameter and selected prototypes. The generic rule-based information granules were depicted as in Eq. 10.
where,
Granule formation involves coverage and specificity indices that directly influence the performance of the underlying data description. The formation is based on two randomly selected points:
where,
Specificity indicates the precision of the constructed information granules. A higher specificity value indicated a smaller granule size. The computation of specificity for the upper and lower bounds is defined in Eq. 13 and Eq. 14, respectively, as follows:
where,
2.5 Evaluation of information granules
Generally, high-quality information granules are expected to have both high coverage and specificity for describing data (Ouyang et al., 2019b). However, in practice, these two functions are usually in conflict and must be maximized simultaneously. Thus, the product of these two functions was selected to search for the optimal size of the information granules. The product of coverage and specificity is
where,
Additionally, the representation capacity of the information granules was considered in this study. Considering that granules reflect the structure of the original dataset, the representation capacity can be quantified using a reconstruction criterion. We can reconstruct any data point
where,
where,
2.6 Granular boundaries
Information granules provide fuzzy rules to determine the boundaries of the decision-making tasks. However, the interpretability of these rules is vague. Two widely used risk measures namely, VaR and CVaR were introduced to interpret the boundaries with respect to all attributes or variables within the original input dataset.
For a certain variable, all data points within the same information granule follow a distribution with a cumulative density function (CDF),
where, VaR can be conceived as the inverse computation of the CDF with respect to the confidence level
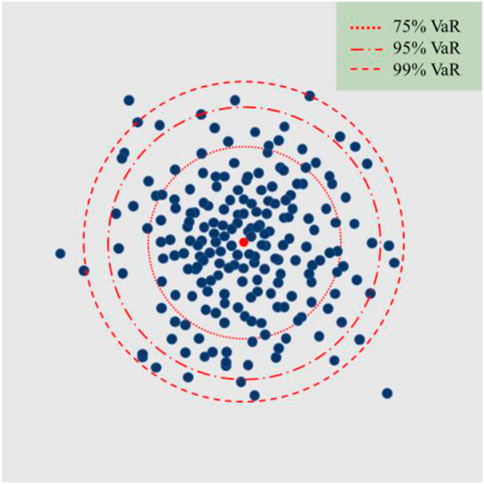
FIGURE 4. Plot illustrating the various confidence levels of a single information granule.
3 Field investigation and data collection
In this study, data collected from multiple earthquake-induced landslides in Wenchuan County, Sichuan Province, China, were used to perform a case study analysis using the proposed approach (Carabella et al., 2022). The study area is located in the Longmen Mountains area on the northwest edge of the Sichuan Basin. On 12 May 2008, the Wenchuan earthquake, with a magnitude of 8.0 occurred in the Longmenshan tectonic zone of Sichuan Province (Chigira et al., 2010; Xie et al., 2020). This strong earthquake event in the mountainous region triggered over 3000 landslides and chains of related geohazard events, including rockfalls, debris flows, and unstable slopes (Fan et al., 2019; Li et al., 2022).
This area was selected as our study area because it has the highest seismic intensity (Modified Mercalli Intensity XI) and coseismic landslide density (Chen et al., 2020). The Yingxiu-Beichuan fault crosses the study area and is the leading cause of Wenchuan earthquake event in 2008. The elevation of the study area varies from 760 to 3200 a.s.l. and the topography consists of rugged mountains and deeply incised valleys. Multiple slides and debris flows were discovered along the Mingjiang River Valley, which is a tributary of the Yangtze River, with an average annual discharge of 452 m3/s. Summer precipitation is the leading factor that triggers post-earthquake slides and debris flows. Typical examples of slides and debris flows are shown in Figure 5.
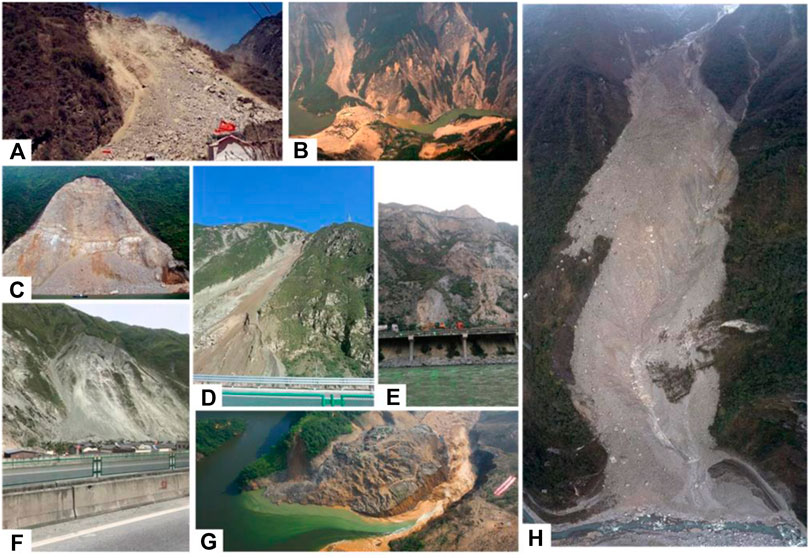
FIGURE 5. Photographs showing the onsite investigation and remote sensing detection of earthquake-induced landslides in Wenchuan County.
Since the Wenchuan earthquake, earthquake-stricken regions have been intensively monitored by geologists using remote-sensing techniques combined with field investigations. Remote sensing techniques offer highly precise information for geohazard monitoring and mitigation. Data acquisition, including full coverage and high resolution, was accomplished by multiple groups of geologists in the period between 2008 and 2018. The GIS method was then utilized to integrate the landslide inventory into the spatial dataset to discover the quantitative relationships between landslide activity and triggering factors.
We selected 3000 landslides for our case studies, the majority of which were deep-seated landslides. Based on an on-site investigation, eight geohazard-related geometrical variables of the earthquake-induced landslides are provided in Table 1. These variables are considered critical to fuzzy-rule-based models for geo-risk assessment, according to expert opinions. The statistical properties of each variable are summarized in Table 1.
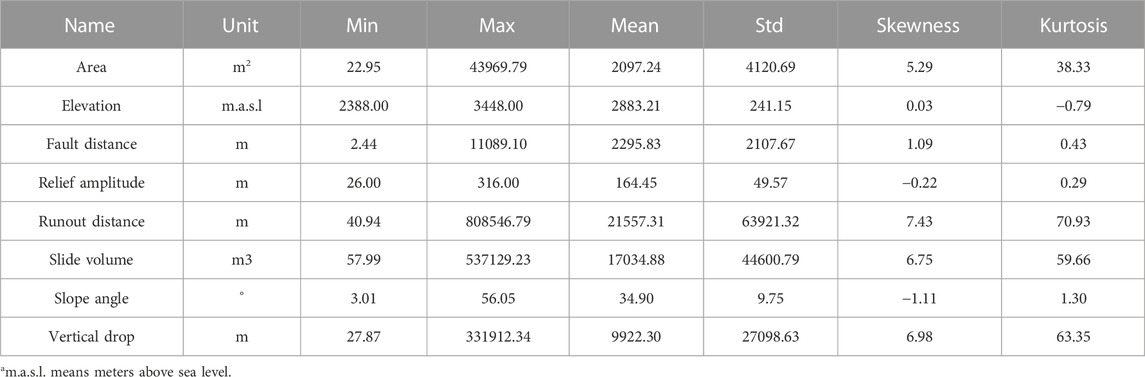
TABLE 1. Wenchuan landslides data description.
According to Table 1, eight geomorphology-related variables–slide area, elevation, slope fault distance, relief amplitude, runout distance, slide volume, slope angle, and vertical drop–were measured and included. It also provides a unit of measurement. Additionally, the minimum value, maximum value, mean, and standard deviation were computed as first-order statistical properties. Furthermore, second-order statistical properties such as skewness and kurtosis were computed. Finally, according to expert opinions, three types of labels (high, medium, and low risks) were assigned to all landslide cases in the dataset.
4 Experimental results
4.1 Training of SAE
The proposed data-driven information granule-based approach was applied to the risk assessment of over 3000 landslide case studies in Wenchuan County, Sichuan Province, China. Among which, 2500 cases were utilized for cross-validation, and the remaining 500 cases were used as the independent test dataset. Eight geomorphology-related landslide variables are included in the granule construction dataset. Three training strategies were implemented to achieve high-quality information compression results. The strategies used are summarized in Table 2 below.
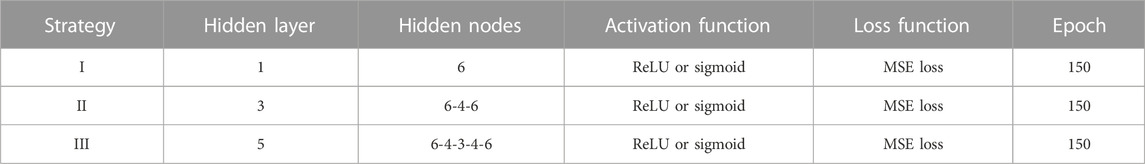
TABLE 2. Training strategies of Stacked Autoencoder.
In Table 2, the first strategy (Strategy I) contains only one hidden layer with six hidden nodes. This is a typical autoencoder. Both the ReLU and sigmoid functions were tested as the activation functions, and the one with the smallest error was selected. The MSE loss was selected as the loss function, and the Adam optimizer was selected as the optimization algorithm to reduce the loss function. The maximum number of training epochs was 150, and once the loss function converged, early termination was implemented. The second strategy (Strategy II) adopts a similar approach with three symmetric hidden layers. The two outer hidden layers on each side have 6 hidden nodes, and the central “Bottleneck” layer contains only 4 hidden nodes. Layer-by-layer pre-training and fine-tuning of the stacked architecture are both included, as described in Section 2.2 Figure 2. The third training strategy (Strategy III) adopted the same training approach as Strategy II with five hidden layers in total. The central “Bottleneck” hidden layer contains only 3 hidden nodes which aims to further reduce the dimension of the original data vector. The loss functions for the three training strategies during the epochs are shown in Figure 6.
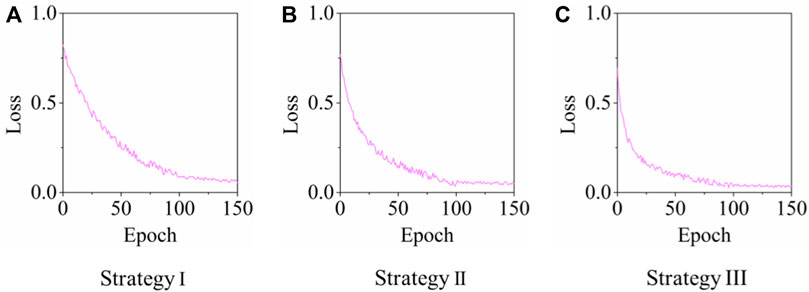
FIGURE 6. Plots showing the loss functions for all training strategies for SAE.
The data reconstruction loss (MSE loss) was also measured for the three training strategies. The error between the input and the reconstructed outputs was measured for the test dataset for performance evaluation. A histogram illustrating the distribution of the MSE loss are provided below in Figure 7. Here, the loss distribution comes from the MSE loss by inputing all validation dataset (the remaining 30%) into the trained SAE algorithm. Thus, the loss distribution in Figure 7 is the validation loss distribution of the SAE algorithm with respect to three different training strategies.
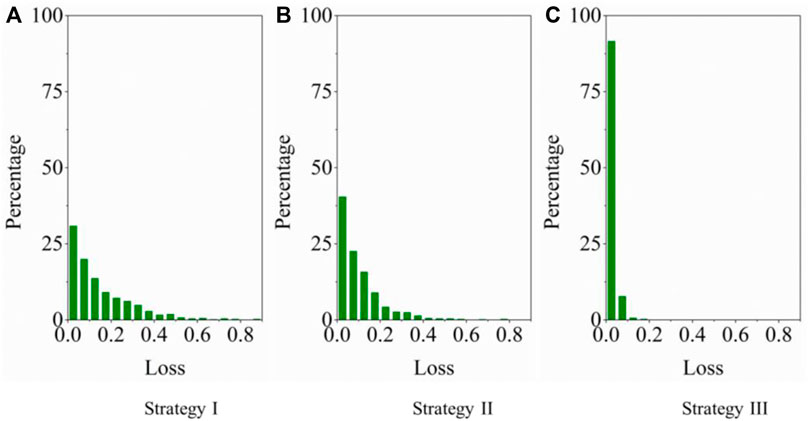
FIGURE 7. Bar charts depicting the distribution of reconstruction MSE error for all training strategies.
As shown in Figure 7, in comparison, the loss distribution for training strategy III converges close to zero. This indicates that strategy III produces a higher-quality data reconstruction outcome, and useful information is successfully encoded into the central latent layer. We then extracted a central latent vector with less dimensionality to construct robust information granules for landslide risk classification.
4.2 Constructing information-granules
Information granules were constructed using the central latent vector of the pretrained SAE algorithm. The latent vectors not only reduce dimensionality but also preserve important information in the original input dataset. To validate the superiority of using the SAE latent vector, other state-of-the-art data structures for information granule construction, including density-based spatial clustering of applications with noise (DBSCAN), k-mean clustering, and principal component analysis (PCA), were selected for comparative analysis.
For the predefined three levels of risk by the experts, a global measurement of granular quality was performed. Figure 8 displays the coordinates of various coverage-specificity curves for the test dataset. The area under the coverage-specificity curves directly indicates the quality of the constructed information granules. The proposed approach, using the latent vector of the SAE as the source data structure, had the largest area for the three risk groups. This demonstrates the superior performance of the SAE latent vector as the source data structure to construct information granules.
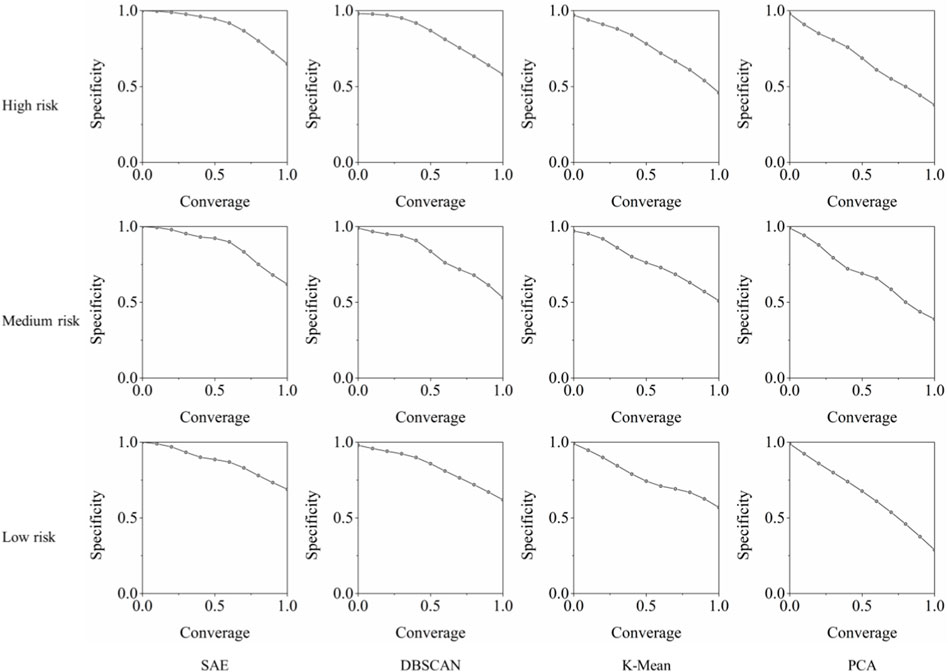
FIGURE 8. Plots showing the comparison of specificity against coverage values against state-of-art approaches.
In Figure 9, we also compute another metric Q with respect to the different numbers of clusters provided by the FCM. The average Q values and 95% confidence intervals were visualized for all possible cluster numbers. It is significant that for all three risk levels, the proposed approach using the latent vector of the SAE as the source data structure has higher Q values, and thus, better granule quality. Additionally, for representation capacity,
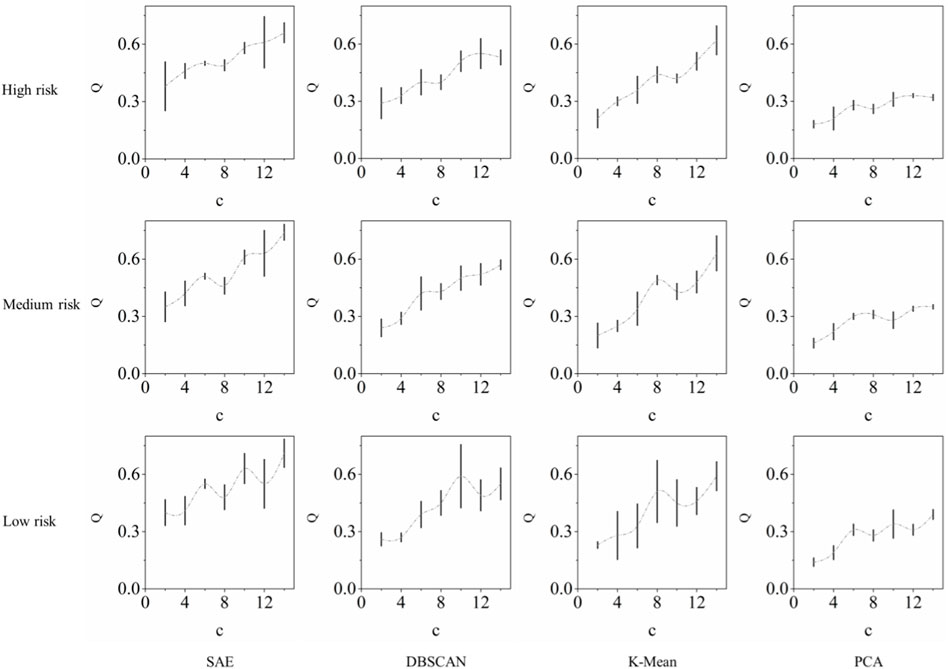
FIGURE 9. Histograms showing the comparison of Q values against state-of-art approaches.
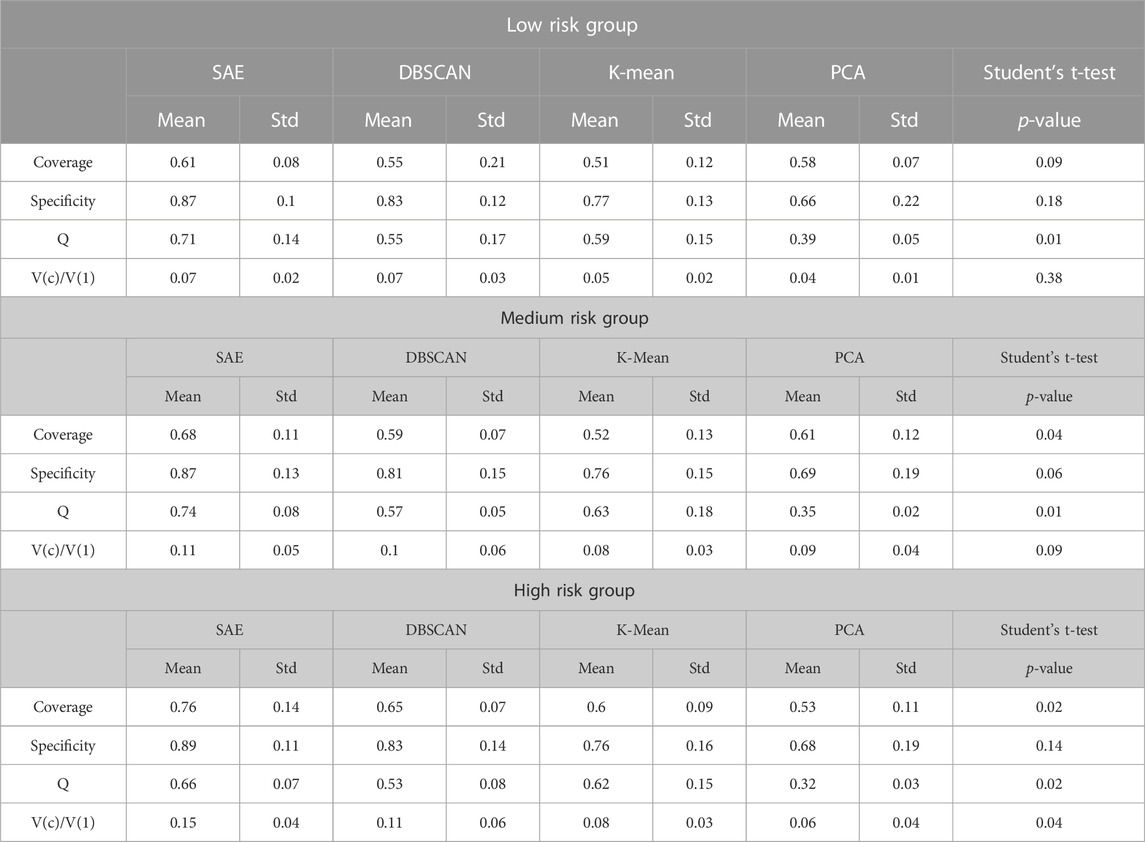
TABLE 3. Measurement of information granules for three risk group.
4.3 Granular interpretation
Information granules are based on fuzzy rules that lack sufficient explanation for field engineers. To improve the interpretability of the proposed approach, two widely used risk measures, namely, VaR and CVaR were computed to indicate the boundaries of each variable in the original dataset. Information granules with respect to each variable were visualized using box plots, and are presented in Figure 10. Considering the scale differences across all variables, all box plots used min-max rescaling to ensure that the values were between 0 and 1.
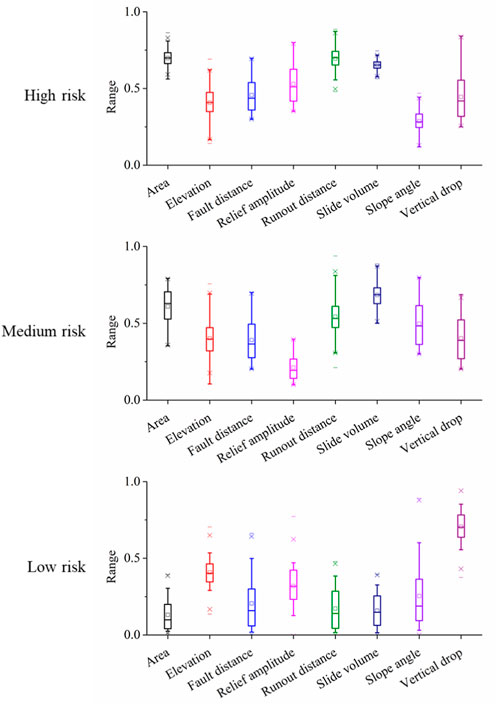
FIGURE 10. Box plots illustrating the interpretation of information granules for all risk groups.
According to Figure 10, the mean, median, 25th–75th, 10th–90th, and 5th–95th percentiles for the distribution in each variable per group are visualized. Here, the information granules denote the interval between VaR.05 and VaR.95. A significant distinction between the three risk groups existed with respect to area, runout distance, and slide volume. This phenomenon confirms the expert opinion that these three are the top factors in determining landslide risk.
Additionally, the geospatial distribution of the three risk groups was labeled on the map with different colors, as illustrated in Figure 11. These colored points indicate the location and size of the corresponding earthquake-induced landslides in Wenchuan County. Instead of a case-by-case risk assessment, the proposed approach automatically classified the risk of landslide occurrence in the study area.
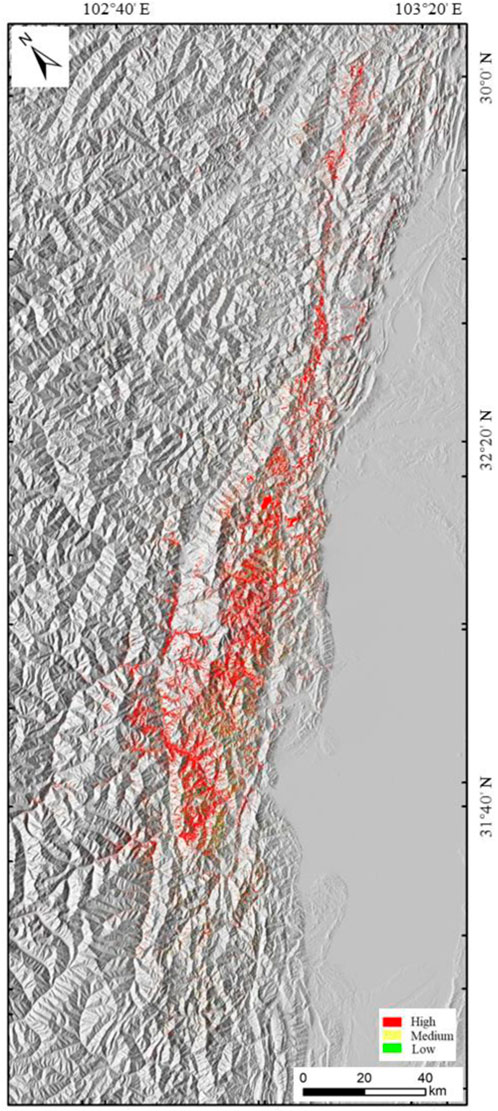
FIGURE 11. Map depicting the geospatial distribution of the earthquake induced landslides in Wenchuan County, China.
5 Discussion
The information granules constructed for the three risk groups were computed using the latent vectors of the (SAE) algorithm. The interpretation of the information granules in each risk group has been visualized in Figure 10 with respect to each variable in the provided dataset. To provide meaningful information to field engineers for classifying the risks of applying these information granules, we computed the CVaR.95/VaR.95 and CVaR.05/VaR.05 for each variable and included them in Table 4.
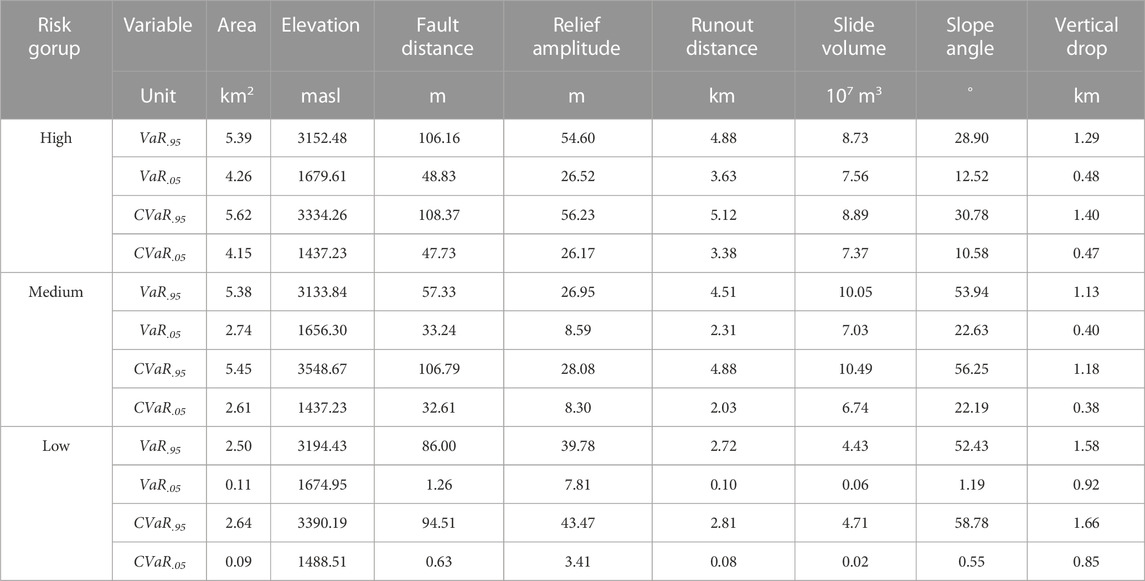
TABLE 4. Computed VaR and CVaR for the three risk groups obtained by information granules.
As listed in Table 4, the computed values indicate the risk boundaries for landslides in each risk group. A new sample can be automatically applied to the explainable rules derived from information granules to obtain the corresponding risk assessment.
6 Conclusion
In this study, a data-driven framework is proposed to assess the risks of earthquake-induced landslides using a semi-supervised learning approach. The development of the proposed framework consists of two phases: training the stacked autoencoder and construction of fuzzy information granules. The stacked autoencoder was trained using field landslide data, following an unsupervised learning approach. The data vector was utilized as both the input and output, and the mean squared error loss was selected as the loss function for all training tasks. The deep patterns within the dataset were effectively compressed into a central latent space, and fuzzy information granules were constructed. The boundaries in the latent space for all risk levels were optimized and obtained.
The development of this framework was compared with that of the different benchmarks in a case study area in Wenchuan County, China. The computational results demonstrate that the pre-trained stacked autoencoder can more effectively compress deep data patterns into a low-dimensional space. A comparative analysis based on the testing dataset demonstrated that the information granules could cover most of the homogenous data points in each subgroup. Additionally, stacked-autoencoder-based information granules offer higher accuracy, robustness, and specificity than other state-of-the-art data structures. The proposed fuzzy information granules based on the latent space of a stacked autoencoder are promising for achieving satisfactory classification performance, especially for earthquake-induced landslide datasets, and can offer valuable suggestions to practicing field geology engineers.
Data availability statement
The original contributions presented in the study are included in the article/Supplementary material, further inquiries can be directed to the corresponding author.
Author contributions
YF: Data curation, Writing–original draft. WY: Writing–original draft, Writing–review and editing. JW: Software, Validation, Writing–original draft. HL: Funding acquisition, Supervision, Writing–review and editing.
Funding
The author(s) declare financial support was received for the research, authorship, and/or publication of this article. This research is supported by Natural Science Foundation of Sichuan Province, China (Grant No. 2023NSFSC0789), and the Open Fund of Sichuan Engineering Research Center for Mechanical Properties and Engineering Technology of Unsaturated Soils (No. SC-FBHT2022-13).
Conflict of interest
The authors declare that the research was conducted in the absence of any commercial or financial relationships that could be construed as a potential conflict of interest.
Publisher’s note
All claims expressed in this article are solely those of the authors and do not necessarily represent those of their affiliated organizations, or those of the publisher, the editors and the reviewers. Any product that may be evaluated in this article, or claim that may be made by its manufacturer, is not guaranteed or endorsed by the publisher.
References
Adem, K., Kiliçarslan, S., and Cömert, O. (2019). Classification and diagnosis of cervical cancer with stacked autoencoder and softmax classification. Expert Syst. Appl. 115, 557–564. doi:10.1016/j.eswa.2018.08.050
Althuwaynee, O. F., Pradhan, B., Park, H. J., and Lee, J. H. (2014). A novel ensemble decision tree-based CHi-squared Automatic Interaction Detection (CHAID) and multivariate logistic regression models in landslide susceptibility mapping. Landslides 11 (6), 1063–1078. doi:10.1007/s10346-014-0466-0
Carabella, C., Cinosi, J., Piattelli, V., Burrato, P., and Miccadei, E. (2022). Earthquake-induced landslides susceptibility evaluation: a case study from the Abruzzo region (Central Italy). Catena 208, 105729. doi:10.1016/j.catena.2021.105729
Chen, M., Tang, C., Xiong, J., Shi, Q. Y., Li, N., Gong, L. F., et al. (2020). The long-term evolution of landslide activity near the epicentral area of the 2008 Wenchuan earthquake in China. Geomorphology 367, 107317. doi:10.1016/j.geomorph.2020.107317
Chigira, M., Wu, X., Inokuchi, T., and Wang, G. (2010). Landslides induced by the 2008 wenchuan earthquake, sichuan, China. Geomorphology 118 (3-4), 225–238. doi:10.1016/j.geomorph.2010.01.003
Chowdhuri, I., Pal, S. C., Janizadeh, S., Saha, A., Ahmadi, K., Chakrabortty, R., et al. (2022). Application of novel deep boosting framework-based earthquake induced landslide hazards prediction approach in Sikkim Himalaya. Geocarto Int. 37 (26), 12509–12535. doi:10.1080/10106049.2022.2068675
Cruden, D. M. (1991). A simple definition of a landslide. Bull. Int. Assoc. Eng. Geology-Bulletin de l'Association Int. de Géologie de l'Ingénieur 43 (1), 27–29. doi:10.1007/bf02590167
Dai, F. C., Lee, C. F., and Ngai, Y. Y. (2002). Landslide risk assessment and management: an overview. Eng. Geol. 64 (1), 65–87. doi:10.1016/s0013-7952(01)00093-x
Fan, X., Scaringi, G., Korup, O., West, A. J., van Westen, C. J., Tanyas, H., et al. (2019). Earthquake-induced chains of geologic hazards: patterns, mechanisms, and impacts. Rev. Geophys. 57 (2), 421–503. doi:10.1029/2018rg000626
Gao, G., and Meguid, M. A. (2018a). On the role of sphericity of falling rock clusters—insights from experimental and numerical investigations. Landslides 15, 219–232. doi:10.1007/s10346-017-0874-z
Gao, G., and Meguid, M. A. (2018b). Modeling the impact of a falling rock cluster on rigid structures. Int. J. geomechanics 18 (2), 1–15. doi:10.1061/(asce)gm.1943-5622.0001045
Gao, G., Meguid, M. A., Chouinard, L. E., and Xu, C. (2020). Insights into the transport and fragmentation characteristics of earthquake-induced rock avalanche: numerical study. Int. J. Geomechanics 20 (9), 04020157. doi:10.1061/(asce)gm.1943-5622.0001800
Gao, G., Meguid, M. A., Chouinard, L. E., and Zhan, W. (2021). Dynamic disintegration processes accompanying transport of an earthquake-induced landslide. Landslides 18, 909–933. doi:10.1007/s10346-020-01508-1
Gorsevski, P. V., Brown, M. K., Panter, K., Onasch, C. M., Simic, A., and Snyder, J. (2016). Landslide detection and susceptibility mapping using LiDAR and an artificial neural network approach: a case study in the Cuyahoga Valley National Park, Ohio. Landslides 13 (3), 467–484. doi:10.1007/s10346-015-0587-0
He, Y., and Kusiak, A. (2017). Performance assessment of wind turbines: data-derived quantitative metrics. IEEE Trans. Sustain. Energy 9 (1), 65–73. doi:10.1109/tste.2017.2715061
Huang, F., Yao, C., Liu, W., Li, Y., and Liu, X. (2018). Landslide susceptibility assessment in the Nantian area of China: a comparison of frequency ratio model and support vector machine. Geomatics, Nat. Hazards Risk 9 (1), 919–938. doi:10.1080/19475705.2018.1482963
Karakas, G., Nefeslioglu, H. A., Kocaman, S., Buyukdemircioglu, M., Yurur, T., and Gokceoglu, C. (2021). Derivation of earthquake-induced landslide distribution using aerial photogrammetry: the January 24, 2020, Elazig (Turkey) earthquake. Landslides 18 (6), 2193–2209. doi:10.1007/s10346-021-01660-2
Kasama, K., Furukawa, Z., and Hu, L. (2021). Practical reliability analysis for earthquake-induced 3D landslide using stochastic response surface method. Comput. Geotechnics 137, 104303. doi:10.1016/j.compgeo.2021.104303
Khamparia, A., Saini, G., Pandey, B., Tiwari, S., Gupta, D., and Khanna, A. (2020). KDSAE: chronic kidney disease classification with multimedia data learning using deep stacked autoencoder network. Multimedia Tools Appl. 79, 35425–35440. doi:10.1007/s11042-019-07839-z
Li, H. (2022a). SCADA data based wind power interval prediction using LUBE-based deep residual networks. Front. Energy Res. 10, 920837. doi:10.3389/fenrg.2022.920837
Li, H. (2022b). Short-Term wind power prediction via spatial temporal analysis and deep residual networks. Front. Energy Res. 10, 920407. doi:10.3389/fenrg.2022.920407
Li, H., He, Y., Xu, Q., Deng, j., Li, W., and Wei, Y. (2022). Detection and segmentation of loess landslides via satellite images: a two-phase framework. Landslides 19, 673–686. doi:10.1007/s10346-021-01789-0
Li, H., He, Y., Xu, Q., Deng, J., Li, W., Wei, Y., et al. (2023). Sematic segmentation of loess landslides with STAPLE mask and fully connected conditional random field. Landslides 20, 367–380. doi:10.1007/s10346-022-01983-8
Liseune, A., Salamone, M., Van den Poel, D., Van Ranst, B., and Hostens, M. (2020). Leveraging latent representations for milk yield prediction and interpolation using deep learning. Comput. Electron. Agric. 175, 105600. doi:10.1016/j.compag.2020.105600
Merghadi, A., Yunus, A. P., Dou, J., Whiteley, J., ThaiPham, B., Bui, D. T., et al. (2020). Machine learning methods for landslide susceptibility studies: a comparative overview of algorithm performance. Earth-Science Rev. 207, 103225. doi:10.1016/j.earscirev.2020.103225
Ouyang, T., Pedrycz, W., and Pizzi, N. J. (2019b). Record linkage based on a three-way decision with the use of granular descriptors. Expert Syst. Appl. 122, 16–26. doi:10.1016/j.eswa.2018.12.038
Ouyang, T., Pedrycz, W., and Pizzi, N. J. (2019c). Rule-based modeling with DBSCAN-based information granules. IEEE Trans. Cybern. 51 (7), 3653–3663. doi:10.1109/tcyb.2019.2902603
Ouyang, T., Pedrycz, W., Reyes-Galaviz, O. F., and Pizzi, N. J. (2019a). Granular description of data structures: a two-phase design. IEEE Trans. Cybern. 51 (4), 1902–1912. doi:10.1109/tcyb.2018.2887115
Ouyang, T., and Zhang, X. (2022). DBSCAN-based granular descriptors for rule-based modeling. Soft Comput. 26 (24), 13249–13262. doi:10.1007/s00500-022-07514-w
Paoletti, M. E., Haut, J. M., Plaza, J., and Plaza, A. (2018). A new deep convolutional neural network for fast hyperspectral image classification. ISPRS J. photogrammetry remote Sens. 145, 120–147. doi:10.1016/j.isprsjprs.2017.11.021
Pokharel, B., Alvioli, M., and Lim, S. (2021). Assessment of earthquake-induced landslide inventories and susceptibility maps using slope unit-based logistic regression and geospatial statistics. Sci. Rep. 11 (1), 21333. doi:10.1038/s41598-021-00780-y
Rajabi, A. M., Khodaparast, M., and Mohammadi, M. (2022). Earthquake-induced landslide prediction using back-propagation type artificial neural network: case study in northern Iran. Nat. Hazards 110 (1), 679–694. doi:10.1007/s11069-021-04963-8
Shi, B., Zeng, T., Tang, C., Zhang, L., Xie, Z., Lv, G., et al. (2021). Landslide risk assessment using granular fuzzy rule-based modeling: a case study on earthquake-triggered landslides. IEEE Access 9, 135790–135802. doi:10.1109/access.2021.3116869
Van Westen, C. J., Van Asch, T. W., and Soeters, R. (2006). Landslide hazard and risk zonation—why is it still so difficult? Bull. Eng. Geol. Environ. 65 (2), 167–184. doi:10.1007/s10064-005-0023-0
Xie, M., Zhao, W., Ju, N., He, C., Huang, H., and Cui, Q. (2020). Landslide evolution assessment based on InSAR and real-time monitoring of a large reactivated landslide, Wenchuan, China. Eng. Geol. 277, 105781. doi:10.1016/j.enggeo.2020.105781
Xu, Q., Li, H., He, Y., Liu, F., and Peng, D. (2019). Comparison of data-driven models of loess landslide runout distance estimation. Bull. Eng. Geol. Environ. 78 (2), 1281–1294. doi:10.1007/s10064-017-1176-3
Yi, Y., Zhang, Z., Zhang, W., Jia, H., and Zhang, J. (2020). Landslide susceptibility mapping using multiscale sampling strategy and convolutional neural network: a case study in Jiuzhaigou region. Catena 195, 104851. doi:10.1016/j.catena.2020.104851
Zabalza, J., Ren, J., Zheng, J., Zhao, H., Qing, C., Yang, Z., et al. (2016). Novel segmented stacked autoencoder for effective dimensionality reduction and feature extraction in hyperspectral imaging. Neurocomputing 185, 1–10. doi:10.1016/j.neucom.2015.11.044
Zhao, W., and Du, S. (2016). Learning multiscale and deep representations for classifying remotely sensed imagery. ISPRS J. Photogrammetry Remote Sens. 113, 155–165. doi:10.1016/j.isprsjprs.2016.01.004
Zhou, J., Wei, J., Yang, T., Zhang, P., Liu, F., and Chen, J. (2021a). Seepage channel development in the crown pillar: insights from induced microseismicity. Int. J. Rock Mech. Min. Sci. 145, 104851. doi:10.1016/j.ijrmms.2021.104851
Zhou, Q., Xu, Q., Peng, D., Fan, X., Ouyang, C., Zhao, K., et al. (2021b). Quantitative spatial distribution model of site-specific loess landslides on the Heifangtai terrace, China. Landslides 18, 1163–1176. doi:10.1007/s10346-020-01551-y
Keywords: earthquake-induced landslides, risk assessment, stacked autoencoder, information granule, prototype selection
Citation: Feng Y, Yang W, Wan J and Li H (2023) Granular risk assessment of earthquake induced landslide via latent representations of stacked autoencoder. Front. Environ. Sci. 11:1308808. doi: 10.3389/fenvs.2023.1308808
Received: 07 October 2023; Accepted: 06 December 2023;
Published: 19 December 2023.
Edited by:
Yunhui Zhang, Southwest Jiaotong University, ChinaReviewed by:
Lichun Zhang, Stanford University, United StatesGe Gao, McGill University, Canada
Qi Zhou, GFZ German Research Centre for Geosciences Potsdam, Germany
Copyright © 2023 Feng, Yang, Wan and Li. This is an open-access article distributed under the terms of the Creative Commons Attribution License (CC BY). The use, distribution or reproduction in other forums is permitted, provided the original author(s) and the copyright owner(s) are credited and that the original publication in this journal is cited, in accordance with accepted academic practice. No use, distribution or reproduction is permitted which does not comply with these terms.
*Correspondence: Weiqi Yang, eWFuZ3dlaXFpQHNjYWMuZWR1LmNvbQ==