
95% of researchers rate our articles as excellent or good
Learn more about the work of our research integrity team to safeguard the quality of each article we publish.
Find out more
ORIGINAL RESEARCH article
Front. Environ. Sci. , 26 January 2024
Sec. Environmental Informatics and Remote Sensing
Volume 11 - 2023 | https://doi.org/10.3389/fenvs.2023.1305282
 Jixuan Yan1*
 Hongqiang Qiao2Qiang Li1Miao Song1Xiangdong Yao1Pengcheng Gao1Meihua Zhang1Jie Li1Guangping Qi1Guang Li3
The Yellow River Basin is an important ecological barrier zone in China, and the landscape pattern has changed greatly due to intense human activities. It is of great significance to explore the dynamic forecasting of ecological risk based on terrain gradient for the ecological security of the Yellow River Basin. In this study, the distribution characteristics of ecological risk from 2000 to 2040 are evaluated by CA-Markov and ERI models. We put forward a new method of landscape ecological risk assessment based on terrain gradient and further analyzed the relationship between ecological risk and terrain index. The results showed that the proportion of the cultivated land and the grassland in the Yellow River basin is more than 73%, with the largest dynamic change in 2020. The ecological risk in the study area showed a spatial pattern of “high in the northwest and southwest, low in the east and south-central.” During the study period, the overall ecological risk showed a decreasing trend, and the high risk was reduced by four times. The future ecological risk of all terrain gradient will show a decreasing trend, the high risks mainly occurred in areas with “flat terrain with low terrain gradient and low vegetation coverage.” This study will provide a new perspective for the dynamic forecasting of ecological risk and the analysis of the change of ecological risk through terrain gradients.
• We successfully predicted the landscape ecological risk in future years using CA-Markov model.
• The overall ecological risk showed a decreasing trend during the study period, and the high risk was mainly distributed in the “Low-lying flat terrain, low vegetation coverage” areas.
• The results of this study will help to provide a new perspective to analyze the change of ecological risk only through terrain.
Ecological security, as a pivotal indicator for assessing regional ecosystem stability, serves as a vital foundation for the development of ecological civilization and the sustainable growth of human society. Furthermore, it constitutes a crucial guarantee for promoting the healthy evolution of social economy and building a robust national security framework (Xie et al., 2020). In recent years, with the rapid growth of the global economy and increased human activities, there has been mounting pressure on natural resources and ecosystems. As a result, ecological risks and environmental problems are becoming increasingly prevalent (Strand et al., 2018; Pérez-Girón et al., 2020). Hence, there is a need for scientific prediction and assessment of ecological hazards to enhance the theoretical foundations in establishing regional ecological security and fostering the harmonious and sustainable development of ecosystems. Furthermore, it is imperative to optimize the landscape configuration and effectively mitigate and tackle the pragmatic predicaments of ecological risks in the future (Fan et al., 2016).
In the field of environmental ecology, there has been a growing interest in dynamic forecasting and evaluation of ecological risk in recent years (Ji et al., 2021). Early ecological risk simulations rely on models such as CLUE-S, Logistic, grey system, and meta-cellular automata. However, these models typically neglect the dynamic nature of ecosystem changes and their forecasting accuracy needs to be improved. Therefore, there is a need to develop more advanced approaches for accurately forecasting ecological risk and promoting the coordinated and sustainable development of ecosystems (Fu et al., 2018; Wang et al., 2021). In recent years, CA-Markov models using landscape pattern transfer matrices have been increasingly utilized for simulating and forecasting landscape ecological risk. This approach combines the temporal analysis capability of the Markov model with the spatial analysis capability of the CA model, allowing for effective simulation of the process of spatial pattern change among different landscape types. This method has shown promising results in addressing early ecological risk simulation and forecasting but its application for large watersheds is currently underreported (Popp et al., 2017; Xu et al., 2021). The Yellow River Basin is the fifth largest river basin in the world and serves as the main agricultural production base in China, earning the title of “energy basin.” The study area is predominantly situated in arid and semi-arid regions, with altitude, climate, geomorphology, and human activities impacting the area. This has led to the concentration of desertification and sandy land, poor soil quality, grassland degradation, soil erosion, extensive industrial pollution, and insufficient water resources. Consequently, it has caused numerous issues such as a fragile ecological environment and challenging management (Chen et al., 2020).
Terrain is a crucial factor that limits the man-land system by influencing the spatial distribution of human activities through its impact on light, temperature, water, and nutrients distribution, ultimately determining the landscape pattern and spatial distribution of ecological risk (Goldsmith et al., 2017). The change in ecological risk usually exhibits a certain distribution pattern on the terrain gradients. By analyzing the relationships between ecological risk change and terrain gradients, many scholars have discussed the terrain characteristics, the spatial expansion, the future terrain pressure of the ecological risk change (Andraski et al., 2014; Zhang et al., 2016). However, current research on the relationship between landscape ecological risk and terrain gradients has mainly examined the isolated effects of individual terrain factors such as elevation or slope. Although some studies have proposed that high ecological risks are predominantly found in “high elevation complex terrain” and “low elevation flat terrain” (Xue et al., 2019), relatively few studies have investigated the combined effects of multiple terrain factors on the variability of landscape ecological risk.
Therefore, this study focused on the Yellow River Basin and utilized CA-Markov models, satellite data of watershed, and adaptive atlas to predict data of landscape component for the next 20 years. Furthermore, the study employed the landscape disturbance index and spatial autocorrelation model to uncover the spatial-temporal patterns and concentration state of landscape ecological risk. By calculating the terrain niche index based on elevation and slope, and combining the distribution index, this study also examined the variation of ecological risk on different terrain gradients. The study provided a theoretical foundation and technical support for ecosystem management, human activity management, and natural disaster prevention in the Yellow River Basin.
The Yellow River Basin originates from the Bayan Har Mountains on the Qinghai-Tibet Plateau, flowing eastward through 73 prefecture-level cities across Qinghai, Sichuan, Gansu, Ningxia, Inner Mongolia Autonomous Region, Shaanxi, Shanxi, Henan, and Shandong provinces (Zhang et al., 2018). With a basin area of approximately 793,000 km2 and a total length of approximately 5,464 km, the Yellow River is the second longest river in China and the fifth longest river in the world. Its geographical location lies between 96°–119°E and 32°–42°N, belonging to the mid-latitude zone, with an average temperature range of about −4–14°C and an average annual rainfall range of about 300–600 mm (Qu et al., 2021; Xiao et al., 2021). The Yellow River Basin encompasses four distinct geomorphic units: the Qinghai-Tibet Plateau, the Inner Mongolia Plateau, the Loess Plateau, and the Huang-Huai-Hai Plain. The climate of the region is varied and complex, and the terrain ranges from high in the west to low in the east, with an intricate network of ravines and a mixture of different landscape types. Due to its fragile ecological environment, the Yellow River Basin is regarded as one of the most vulnerable regions in China (Lu et al., 2020). The location of the study area is shown in Figure 1.
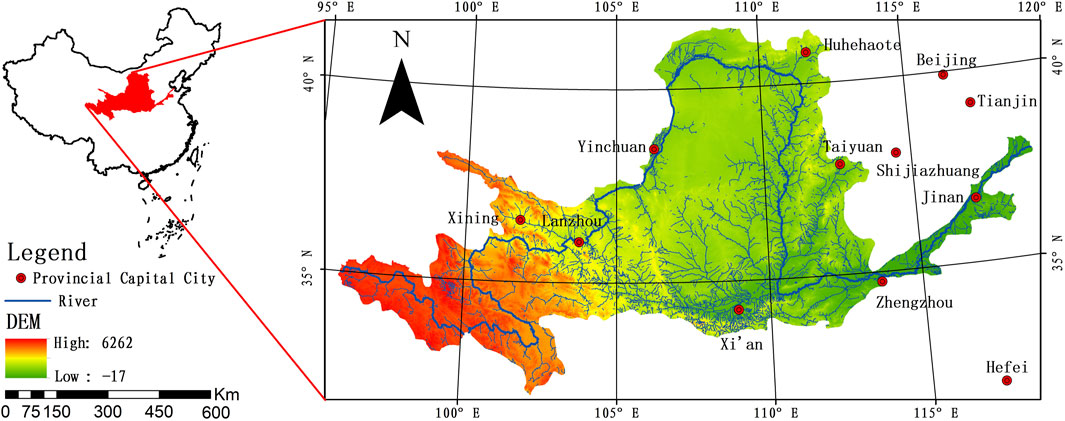
FIGURE 1. Location of the study area.
The data utilized in this study consisted of the following: 1) The data of landscape components: the data of landscape component for 2000 and 2010 were acquired from the Data Centre of the Resource and Environment Science Service website of the Chinese Academy of Sciences (http://www.resdc.cn), with an accuracy better than 85%. The data of landscape components for 2020 were acquired from the National Center for Basic Geographic Information’s Global Land Cover Data website (https://www.webmap.cn), with an accuracy of better than 86%. The data of landscape components were reclassified into six categories: forest, grassland, farmland, water, bare land, and urban, using ArcGIS in this study. 2) The data used in this study was sourced from various databases. DEM data with a ground resolution of 30 m * 30 m were obtained from the Geospatial Data Cloud (http://www.gscloud.cn), while the slope data were calculated from the DEM data. Temperature and precipitation data were obtained from the National Meteorological Science Data Centre (http://data.cma.cn). Additionally, data related to the distance from towns and roads were sourced from the National Public Service Platform for Geographic Information (https://service.tianditu.gov.cn).
The CA-Markov model integrates the capabilities of cellular automata (CA) models to manage spatial changes in complex systems with the features of Markov models for predicting the temporal and quantitative aspects of landscape components, thus achieving the dynamic evolution of landscape components in both space and time (Karimi et al., 2018; Faichia et al., 2020). In this study, the transition area matrix and transition probability matrix of landscape components were established using the CA-Markov module of Idrisi software to derive the transition rules of future landscape components (Mansour et al., 2020). By combining the suitability atlas, we simulated the forecast of landscape component changes in 2020, and the accuracy between the actual and simulated maps in 2020 was verified using the Kappa index. The Kappa index was calculated using the Eq. (1):
where Po is the probability of a correct simulation; Pc is the probability of a predicted simulation; Pp is the probability of an ideal simulation.
The sampling process for dividing the risk regions was conducted using a grid with a size two to five times larger than the average area of landscape patches (Peng et al., 2015). The Yellow River Basin was divided into 3,868 risk regions, each measuring 20 km × 20 km, using the fishing net tool in ArcGIS 10.2.
Combining the theory of landscape ecology and the actual situation of the watershed, the landscape ecological risk index (ERI) was calculated by using the area proportion of various landscape components and the landscape loss index (Zhang et al., 2020). The calculation formula of landscape ecological risk index (ERI) is Eq. (2):
where n represents the total number of landscape types,
where Fi represents the landscape vulnerability index. Based on the experience of previous studies (Liang et al., 2017; Cui et al., 2018), and the characteristics of the study area, the following values were assigned in descending order: 6 for bare land, 5 for water, 4 for farmland, 3 for grassland, 2 for forest, and 1 for urban. Each landscape vulnerability index was obtained after normalization (Jin et al., 2019; Chen et al., 2022; Tian et al., 2023).
Where
Spatial autocorrelation analysis (Moran’s I) can describe whether there is a significant correlation between the attribute value of an element and the attribute value of its adjacent elements in space (Bosso et al., 2017). This paper uses Geoda software to calculate global and local Moran’s I to reveal the spatial aggregation characteristics of landscape ecological risk in the Yellow River Basin. Global Moran’s I index is used to examine the spatial correlation of attribute values of an element across the study area, with Moran’s I values ranging between plus and minus 1. Moran’s I = 0 indicates no spatial correlation, Moran’s I > 0 indicates the presence of positive spatial correlation and vice versa for negative spatial correlation (Darand et al., 2017). Local Moran’s I index is used to reflect the correlation between the attribute value of a certain element and the adjacent spatial units. Moran’s I > 0 indicates a high state of aggregation of high-high or low-low, and Moran’s I < 0 indicates high-low or low-high low aggregation states, and Moran’s I = 0 indicates non-significant states (Davarpanah et al., 2018). Global and local Moran’s I were calculated as Eqs 5, 6, respectively.
Where
The terrain niche index is a terrain factor that integrates elevation and slope, which can provide a comprehensive synthesis of the spatial differentiation of terrain conditions (Tong et al., 2016). The calculation formula of terrain niche index is Eq. (7):
where
The distribution index is used to describe the distribution of different classes of landscape ecological risk on the terrain index gradient, indicating the distribution dominance of different classes of ecological risk (Gong et al., 2017). The calculation formula of distribution index is Eq. (8):
where
Utilizing the data of landscape component of the Yellow River Basin in 2000 and 2010, and in accordance with previous research findings (Bastakoti et al., 2017), a suitability atlas was created by integrating DEM, slope, temperature, precipitation, distance from towns, and distance from roads with the present conditions of the study area. The CA-Markov model was applied to generate a simulated landscape component type map of the Yellow River Basin for 2020. The Kappa index was computed between the simulated and actual maps for 2020, yielding a value of 86%, indicating a good model fit. Furthermore, using the data of landscape components in 2010 and 2020, the spatial data of landscape components in 2030 and 2040 were successfully predicted. The ArcGIS software was utilized to generate a spatial distribution map of landscape components (Figure 2), which showed that although the spatial distribution pattern of the data of landscape component in the forecast years (2020–2040) and the current years (2000–2020) is similar, the types of interior landscape components undergo significant changes.
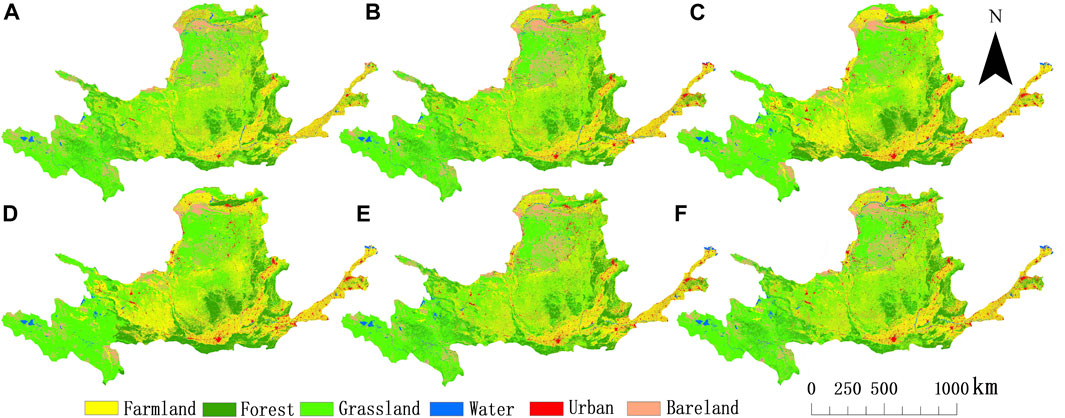
FIGURE 2. Actual landscape component type maps of 2000 (A), 2010 (B), 2020 (C) and simulated landscape component type maps of 2020 (D), 2030 (E), 2040 (F).
Based on the area proportion of landscape components in the Yellow River Basin (Figure 3), it could be seen that grassland and farmland landscapes dominated the study period, accounting for more than 73% of the total area. The farmland and forest landscapes exhibited a trend of increasing before decreasing, both reaching a maximum value of 250,000 and 119,000 km2, respectively in 2020. Meanwhile, the grassland and bare land landscapes experienced a decrease before increasing, reaching a minimum value of 346,000 and 40,000 km2 in 2020, respectively. The urban landscape showed a continuous expansion, with its area proportion gradually increasing from 2.4% in 2000 to 3.9% in 2040, resulting in a total increase of 12,000 km2. Meanwhile, the proportion of water landscape remained relatively stable, with the least change range compared to other landscape types. It stabilized at around 1.6% and covered an area of approximately 13,000 km2.
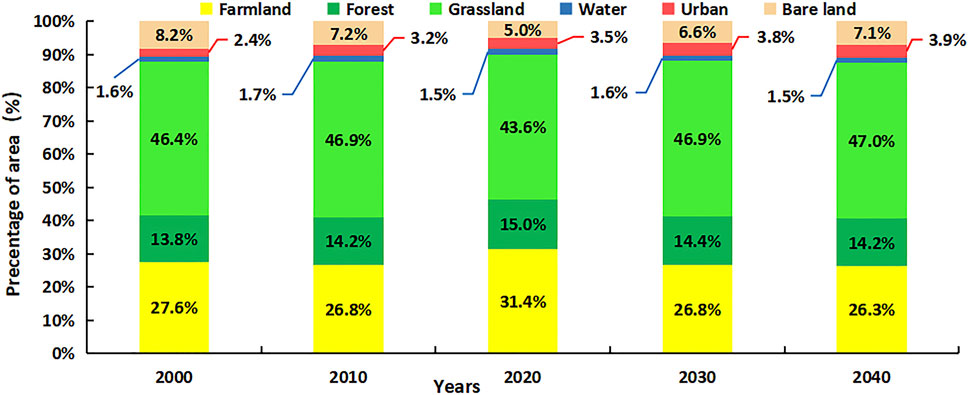
FIGURE 3. Percentages of landscape component types area in the Yellow River Basin.
The ecological risk value of each risk cell was calculated and assigned as an attribute value to the central point of each evaluation unit. Kriging interpolation method was used to interpolate the landscape ecological risk values of each evaluation unit, and the spatial distribution of landscape ecological risk in the study area from 2000 to 2040 was obtained. The landscape ecological risk was divided into five grades by natural breakpoint method of ArcGIS software: low risk (ERI ≤ 0.12), lower risk (0.12 < ERI ≤ 0.14), middle risk (0.14 < ERI ≤ 0.16), higher risk (0.16 < ERI ≤ 0.20), and highest risk (ERI > 0.20). The spatial distribution of landscape ecological risk in the Yellow River Basin from 2000 to 2040 was then mapped (Figure 4).
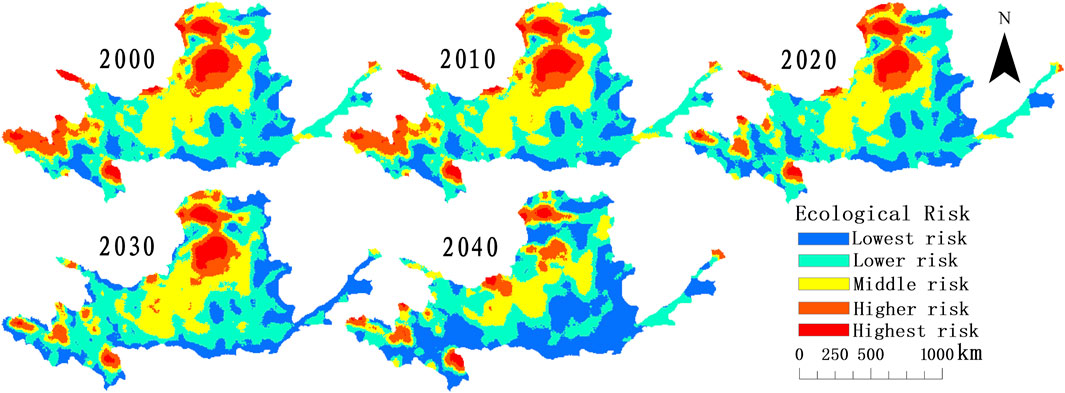
FIGURE 4. Spatial distribution of ecological risk in the Yellow River Basin from 2000 to 2040.
Based on Figure 4, there was a similar spatial distribution of landscape ecological risk values in different years, showing a general pattern of “high in the northwest and southwest, low in the east and south-central parts.” The spatial distribution of ecological risk values in the Yellow River Basin varies greatly among different areas. The regions with the lowest risk were scattered and mainly concentrated in Guoluo Prefecture of Qinghai Province, Gannan Prefecture of Gansu Province, Baoji and Xi’an City of Shaanxi Province, Luoyang City of Henan Province, Jinan and Zibo City of Shandong Province, most areas of Shanxi Province, and the north of Baotou City and Hohhot City of Inner Mongolia Autonomous Region. The regions with lower ecological risk were primarily distributed surrounding the areas with the lowest ecological risk, mainly in Gansu Province, the junction of Qinghai Province and the Yellow River Basin, as well as in most regions of Shaanxi Province, Shanxi Province, Henan Province, and Shandong Province. The regions with moderate ecological risk were mainly located in the central part of the Yellow River Basin, including most of Ningxia Hui Autonomous Region, the eastern part of Gansu Province, Yulin City in Shaanxi Province, and the southeastern part of Bayannur City in Inner Mongolia Autonomous Region. The regions with higher ecologic risk were mainly concentrated in the westernmost parts of Qinghai Province, Yulin City in Shaanxi Province, and Ordos City in Inner Mongolia Autonomous Region. The area of these high-risk regions decreased gradually over time. In 2040, Zhongwei City in Ningxia Hui Autonomous Prefecture shifted from being a middle-risk region to a high-risk region. The areas with the highest ecologic risk were mainly located in the north and south of Ordos City in Inner Mongolia Autonomous Region, the northwestern part of Aba Prefecture in Sichuan Province, and the junction of Haibei Prefecture and Haixi Prefecture in Qinghai Province.
By using ArcGIS to calculate the average value of landscape ecological risk from 2000 to 2040, it was found that the order was: 2000 ERI (0.1439) > 2010 ERI (0.1438) > 2020 ERI (0.1389) > 2030 ERI (0.1371) > 2040 ERI (0.1286). This indicated a decreasing trend in the overall ecological risk value of the Yellow River Basin, with the ecological risk level of each region gradually decreasing over time. Based on Table 1, the ecological risk in the Yellow River Basin was mainly at the lower and middle risk levels. During the study period, the extent of regions with the lowest risk showed a continuous increase, with the largest increase of 25.24%, and the most significant increase occurred between 2030 and 2040. The area of regions with lower ecological risk exhibited a gradual change, with an increase and then decline, reaching its maximum in 2020 at 43.51% of the total area. The area of regions with medium ecological risk displayed an overall decreasing trend, with a total reduction of 69,600 km2 over the 40-year period. The area of high ecological risk and ecologic risk regions had also decreased, with their respective proportions decreasing by factors of 2 and 4, respectively.
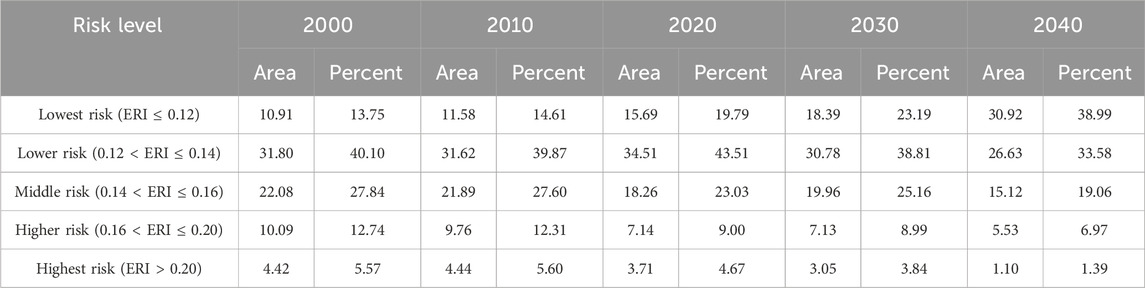
TABLE 1. Area (104 km2) and percent (%) of each ecological risk grades of the Yellow River Basin from 2000 to 2040.
Based on the landscape type and level, the proportion of the landscape ecological risk area in the Yellow River Basin from 2000 to 2040 (Figure 5), which indicated that the ecological risk of artificial landscape had been changing in a consistent and stable manner. Farmland landscapes were predominantly associated with lower risk, while urban landscapes were associated with the lowest risk, both having less than 5% of their highest risk regions. The overall ecological risk of natural landscape decreased over the study period. Forest landscape and water landscape were dominated by middle risk, comprising about 40%–60% of the area, followed by the lowest risk. The highest risk area proportion peaked in 2010 and then gradually decreased. The ecological risk of grassland landscape decreased gradually with the highest risk level in the 40-year period. Bare land landscape was dominated by the highest risk with less than 10% of the area at lower risk and the lowest risk. The ecological risk level for each type of landscape component was ranked as follows from highest to lowest: bare land landscape > grassland landscape > water landscape > forest landscape > farmland landscape > urban landscape.
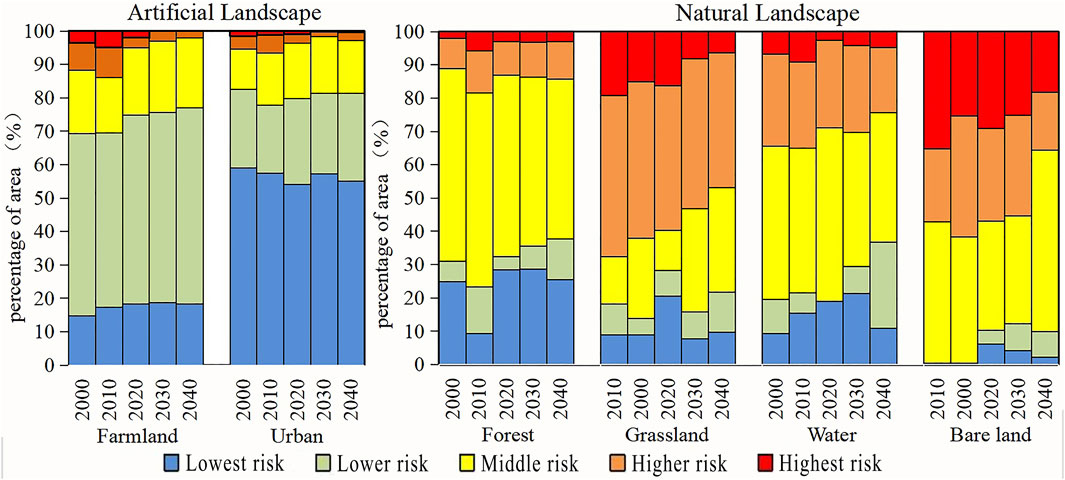
FIGURE 5. Proportion of ecological risk areas of different landscape types at different grades from 2000 to 2040.
The GeoDa software was used to calculate the global Moran’s I index for landscape ecological risk in the Yellow River Basin from 2000 to 2040. The results showed values of 0.642, 0.641, 0.624, 0.651 and 0.591 for each risk unit (Figure 6), all of which were above 0.59, indicating that the landscape ecological risk in the study area exhibited spatial clustering. The local Moran’s I index was utilized to investigate the clustering properties and correlations between neighboring units’ attribute values of landscape ecological risk, revealing that ecological risk in the Yellow River Basin exhibited two aggregation types: High-High and Low-Low. The former dominated the highest risk areas while the latter occupied the lowest risk areas. Furthermore, there were only a few instances of High-Low or Low-High aggregation, and scattered distribution displayed strong spatial heterogeneity.
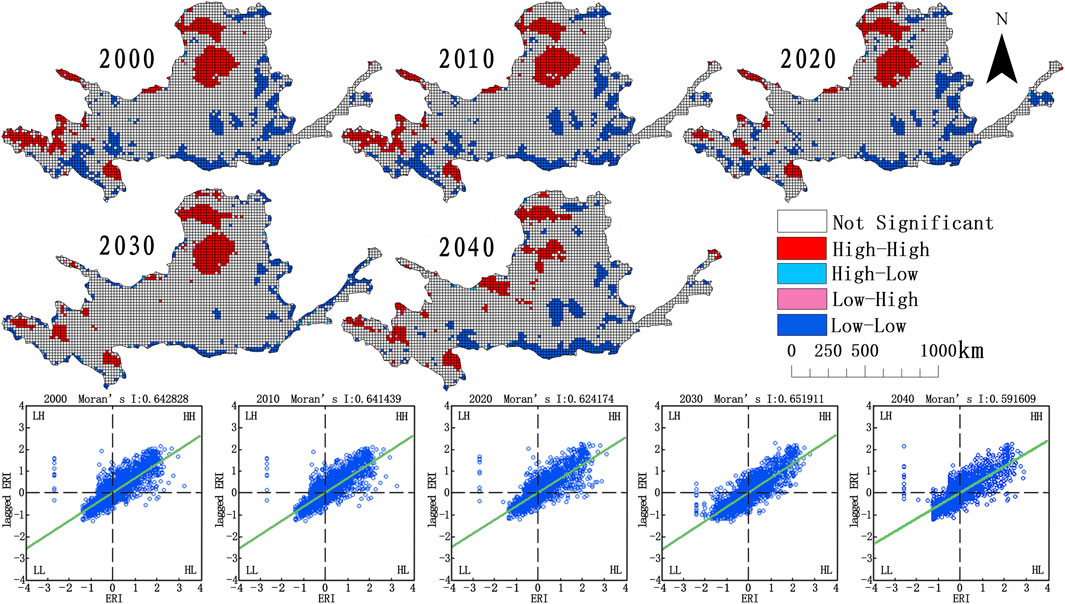
FIGURE 6. Global and local spatial autocorrelations of the ecological risk index in the Yellow River Basin from 2000 to 2040.
The terrain distribution index was used to display the distribution of different landscape ecological risk levels on various terrain factor gradients. To achieve this, ArcGIS natural breaks was utilized to categorize elevation, slope, and terrain niche into five levels based on numerical values. The terrain niche gradient levels were as follows: Grade I gradient (TNI ≤ 0.3), Grade II gradient (0.3 < TNI ≤ 0.5), Grade III gradient (0.5 < TNI ≤ 0.7), Grade IV gradient (0.7 < TNI ≤ 0.9), and Grade V gradient (TNI > 0.9). The terrain factor gradient distribution was then visualized and presented in Figure 7.
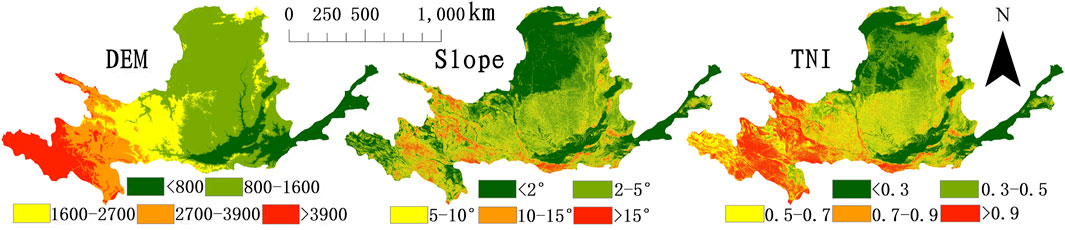
FIGURE 7. The gradient distribution map of terrain factors.
Based on Figure 8, it was evident that the dominant distribution of landscape ecological risk levels across different terrain niche gradients varies significantly. The dominant distribution of the lowest risk in the Yellow River Basin from 2000 to 2040 gradually increased with the rise in TNI gradient levels. The distribution of lower risk was relatively consistent, with TNI gradient levels of grade I, IV, and V being the dominant areas. The middle risk exhibited a “bulge” shape across the five TNI gradients, with the dominant area being gradients II and III. As time advanced, the dominant distribution of higher risk gradually became apparent on the lower TNI gradients. The most significant concentration of the highest risk was observed in the lower terrain gradients with low elevation and less slope, particularly on the grade I gradient.
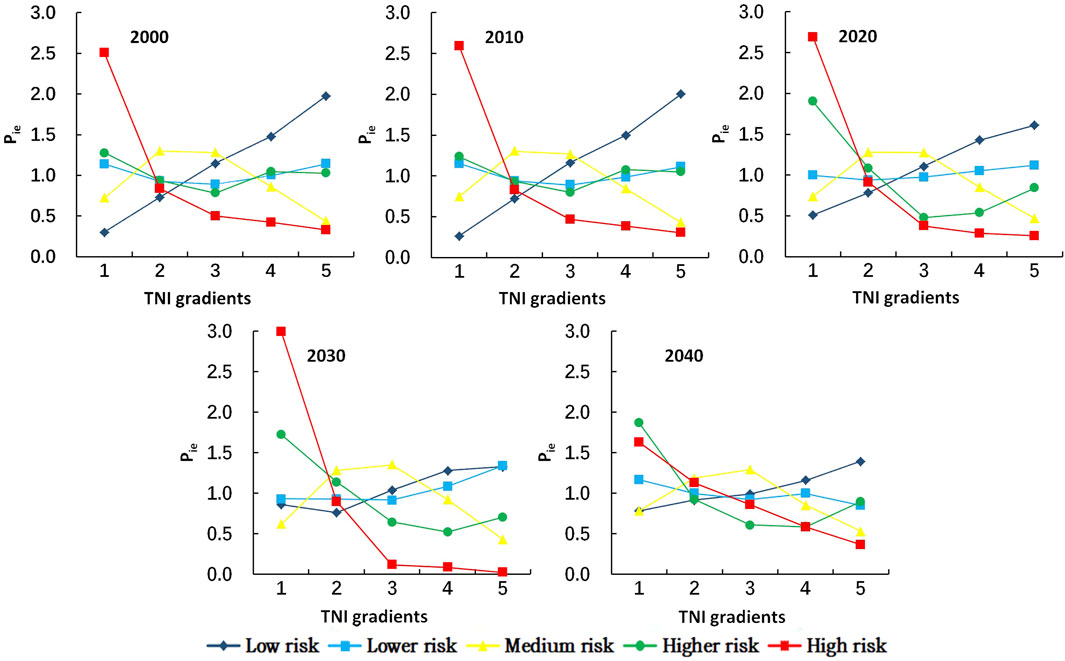
FIGURE 8. Distribution index of each ecological risk grade on terrain gradient from 2000 to 2040.
As the national ecological civilization strategy is being implemented and human awareness of environmental protection improves, the overall ecological risk in the Yellow River Basin is consistently decreasing, and the risk level in each region is declining over time. The lowest risk areas in the Yellow River Basin have high internal stability of the landscape due to low intensity of human activities, mainly consisting of large-scale contiguous distribution of forest. With the continuous strengthening and improvement of relevant national policies and measures, the extent of lowest risk regions is expanding. The landscape fragmentation in the lower risk areas of the Yellow River Basin is relatively low, and the farmland landscapes of high-quality distributed in this area. Due to the susceptibility of this landscape type to soil erosion, which leads to the existence of its ecological risk. However, the ecological risk level of the basin is decreasing with the continuous increase of efforts in soil and water prevention and control (Ying et al., 2020). The fragmentation degree of landscape in the middle risk areas of the Yellow River Basin is relatively high. These areas are mainly characterized by interlaced distribution of grassland landscapes and farmland landscapes. The differentiated economic development and ecological protection measures in the basin have led to heterogeneous changes in landscape ecological risks in different regions of the basin. For example, the strict ecological protection policies in Qinghai Province and Shaanxi Province have prompted human activities to develop towards rationalization after 2010, therefore, the middle risk areas are gradually transforming into lowest- and lower risk areas, whereas the ecological environment of Zhongwei City in Ningxia Hui Autonomous Region has been seriously damaged due to the unreasonable mining activities, leading to an increasing ecological risk (Fang et al., 2016). It is expected to transform from middle risk to higher risk by 2040. It is anticipated that the city will transition from middle risk to higher risk by 2040, hence necessitating the adoption of appropriate measures to mitigate the situation. The Yellow River Basin’s higher risk regions are primarily characterized by the distribution of grassland and bare land landscapes. These landscapes have become increasingly fragmented due to the cumulative impact of human activities and the demand for development and construction, resulting in a high ecological risk level. The regions with the highest risk in the Yellow River Basin are primarily characterized by extensive bare land with high vulnerability and limited coverage of grassland. The impact of human activities has disrupted the ecosystem, resulting in fragmented landscapes, reduced connectivity, diminished stability, and weakened resilience to external disturbances. Furthermore, significant alterations in the natural environment have led to snow melting, frost, and other natural disasters, culminating in high levels of risk (Liu et al., 2018).
The policies on development and supervision have a significant impact on artificial landscapes, resulting in high stability of landscape patches and low ecological risk as the prevalent risk factor. However, for natural landscape, each component type is distributed in a disjointed manner, leading to a lack of internal structural stability and connectivity. The high level of fragmentation and separation of landscape patches results in a high ecological risk (Xie et al., 2021). The adjacent space units exhibit similar levels of ecological risk, which presents significant space aggregation. These findings are consistent with previous studies by Baran et al. (2018), Wu et al. (2018), and Li et al. (2020).
Terrain is a crucial factor that impacts the spatial distribution of landscape components in the natural environment, wherein alterations in the landscape component types directly influence the stability of regional ecological environments. Thus, terrain is inextricably linked to the distribution of ecological risk (Wilson et al., 2013). The northwestern section of the Grade I TNI gradient has a flat terrain dominated by the extensive distribution of unused landscape, with interwoven grassland and low-coverage woodland landscapes. Due to early deforestation and overgrazing, this terrain section witnessed increased fragmentation in the woodland and grassland landscapes (Kayumba et al., 2021). Since 2010, there has been increased focus on environmental and ecological protection, leading to a gradual reduction in ecological risk on the Grade I TNI gradient. Large areas of grassland landscape are distributed on the Grade II, Grade III and Grade IV TNI gradients, interspersed with farmland landscape, water landscape and urban landscape, resulting in a high density of patches. These landscapes are continuously affected by human activities, leading to a moderate and low level of ecological risk. Since 2010, Shaanxi Province and Qinghai Province have been actively responding to the national call to implement restrictive development policies and ecological protection measures. These efforts have led to a certain extent of improvement in the ecological environment (Teng et al., 2019). The Grade V TNI gradient is not suitable for human habitation and production due to the limitations of terrain conditions. As a result, human interference has gradually decreased, forests are extensively distributed, and patch density is high, resulting in predominance of the lowest and lower risk levels (Liu et al., 2019).
The future ecological risk across all terrain gradients in the Yellow River Basin will exhibit a decreasing trend. Regions with the highest risk mainly distribute in the areas of ‘flat terrain in low-lying areas, low vegetation coverage’ affected by the pressures from both human activities and environmental changes. Therefore, it is crucial to implement appropriate protective, restorative, and utilization measures, tailored specifically to the characteristics of high-risk areas. It is necessary to increase the efficient utilization of unutilized land and encourage the development of small, unused land located near cultivated land or in water areas for cultivation. These unused areas can be irrigated and made suitable for cultivation, leading to improved landscape components and economic benefits. This approach can enhance the landscape of desertification cultivated land and prevent the abandonment of cultivated land, ultimately improving land use efficiency. Additionally, it is critical to minimize the negative impacts of human activities such as agricultural and tourism practices, and persist with the implementation of ecological restoration projects to effectively prevent and manage soil erosion, water loss, and environmental pollution. By implementing sound planning and management strategies, we can promote coordinated regional development and maintain a healthy ecological environment.
The CA-Markov model and distribution index have produced satisfactory results in predicting landscape ecological risk and examining gradient distribution characteristics. However, they also have limitations. For instance, the CA-Markov model may not be suitable for landscapes with high fragmentation and small area, such as cities, leading to slight changes in simulation of the overall landscape pattern, as noted by Li et al. (2017). Therefore, further research is required to investigate the impact of fragmented patches on the dynamic forecasting of landscape ecological risk. Secondly, the division of evaluation cells is critical for portraying the spatial heterogeneity of ecological risk, and the scale effects can magnify its uncertainty (Cao et al., 2019). The optimal size of evaluation cells should be studied more extensively in future research, and administrative areas could be utilized as evaluation cells to confirm the variability of ecological risk values calculated with grid-based evaluation cells. Despite these limitations, this study can provide a theoretical reference for high-quality development and ecological security management in the Yellow River Basin.
By utilizing the CA-Markov model, data of landscape component and suitability atlas, we accurately predicted data of landscape component for the upcoming 20-year period. Through the use of various indices such as ERI, Moran’s I, TNI and distribution index, we were able to analyze the spatial and temporal evolution process, patterns, characteristics, agglomeration areas, and terrain gradient distribution patterns of landscape ecological risks. Based on our findings, the study highlights the following key observations:
(1) The landscape components in the Yellow River Basin were mainly comprised of grassland and farmland, which together accounted for over 73% of the total area. During the study period, there were significant changes in the landscape components, with the cultivated land experiencing the largest change. Specifically, the bare land and grassland were primarily converted to cultivated and forest land, resulting in an increase of 9,500 and 30,000 km2 in the area of forest and farmland in 2020, respectively. Urban land continued to expand, leading to an unreasonable change in the landscape pattern.
(2) The spatial distribution of landscape ecological risk values among different years was similar, with an overall landscape pattern of ‘high in the northwest and southwest, low in the east and middle-south’. These regions demonstrated a high degree of spatial correlation and significant spatial aggregation. The overall ecological risk tended to decrease during the study period, with the ecological risk level of all regions progressively decreasing over time. Specifically, the area of highest risk and higher-risk regions decreased by four times and two times, respectively, from 2000 to 2040.
(3) The artificial landscape patches exhibited stability, with the lowest and lower risk classes being dominant. However, the natural landscape areas tended to have higher ecological risks, showing high spatial correlation and significant clustering. This finding suggested that due to the growing awareness of human environmental protection and the continuous improvement of national development supervision policies, the ecological risk of the natural landscape had declined over the years. This indicated a gradual improvement in the ecological environment of the Yellow River Basin.
(4) The ecological risk in all terrain gradients of the Yellow River Basin was expected to decrease in the future, with the highest risk regions concentrated in areas with “low terrain slope, low vegetation coverage, and double impacts from human activities and natural environment changes.” To promote high-quality development, a restoration strategy should be implemented, with human restoration as the primary approach and natural restoration as a supplementary measure, taking into account the distribution characteristics of high-risk areas and reducing adverse effects caused by human activities and natural environment changes.
The original contributions presented in the study are included in the article/supplementary material, further inquiries can be directed to the corresponding author.
JY: Data curation, Funding acquisition, Project administration, Visualization, Writing–original draft. HQ: Investigation, Supervision, Visualization, Writing–review and editing. QL: Conceptualization, Validation, Writing–review and editing. MS: Formal Analysis, Investigation, Writing–review and editing. XY: Software, Validation, Writing–review and editing. PG: Methodology, Supervision, Writing–review and editing. MZ: Conceptualization, Validation, Writing–review and editing. JL: Project administration, Supervision, Writing–review and editing. GQ: Funding acquisition, Methodology, Writing–review and editing. GL: Funding acquisition, Methodology, Writing–review and editing.
The authors declare financial support was received for the research, authorship, and/or publication of this article. This work was sponsored in part by National Natural Science Foundation of China (51969003); Finance Special Project of Gansu Province (GSCZZ20160909); Gansu Provincial Department of Education: Industrial Support Program Project (2021CYZC-15,2022CYZC-41).
The authors declare that the research was conducted in the absence of any commercial or financial relationships that could be construed as a potential conflict of interest.
All claims expressed in this article are solely those of the authors and do not necessarily represent those of their affiliated organizations, or those of the publisher, the editors and the reviewers. Any product that may be evaluated in this article, or claim that may be made by its manufacturer, is not guaranteed or endorsed by the publisher.
The Supplementary Material for this article can be found online at: https://www.frontiersin.org/articles/10.3389/fenvs.2023.1305282/full#supplementary-material
Baran, A., Wieczorek, J., Mazurek, R., Urbański, K., and Klimkowicz-Pawlas, A. (2018). Potential ecological risk assessment and predicting zinc accumulation in soils. Environ. Geochem. Health 40 (1), 435–450. doi:10.1007/s10653-017-9924-7
Bastakoti, R. C., Bharati, L., Bhattarai, U., and Wahid, S. M. (2017). Agriculture under changing climate conditions and adaptation options in the Koshi Basin. Clim. Dev. 9 (7), 634–648. doi:10.1080/17565529.2016.1223594
Bosso, L., De Conno, C., and Russo, D. (2017). Modelling the risk posed by the zebra mussel Dreissena polymorpha: Italy as a case study. Environ. Manag. 60 (2), 304–313. doi:10.1007/s00267-017-0882-8
Cao, Q., Zhang, X., Lei, D., Guo, L., Sun, X., Wu, J., et al. (2019). Multi-scenario simulation of landscape ecological risk probability to facilitate different decision-making preferences. J. Clean. Prod. 227, 325–335. doi:10.1016/j.jclepro.2019.03.125
Chen, H., Zhou, D., Zhang, J., Chen, S., Li, M., and Wang, Z. (2022). Ecological risk assessment of Gansu section of Weihe River Basin based on landscape pattern. Agric. Eng. 12 (11), 72–79. doi:10.19998/j.cnki.2095-1795.2022.11.013
Chen, Y., Fu, B., Zhao, Y., Wang, K. B., Zhao, M. M., Ma, J. F., et al. (2020). Sustainable development in the Yellow River Basin: issues and strategies. J. Clean. Prod. 263, 121223–121237. doi:10.1016/j.jclepro.2020.121223
Cui, L., Zhao, Y., Liu, J., Han, L., Ao, Y., and Yin, S. (2018). Landscape ecological risk assessment in Qinling Mountain. Geol. J. 53, 342–351. doi:10.1002/gj.3115
Darand, M., Dostkamyan, M., and Rehmani, M. I. A. (2017). Spatial autocorrelation analysis of extreme precipitation in Iran. Russ. Meteorology Hydrology 42 (6), 415–424. doi:10.3103/s1068373917060073
Davarpanah, A., Babaie, H. A., and Dai, D. (2018). Spatial autocorrelation of neogene-quaternary lava along the snake River plain, Idaho, USA. Earth Sci. Inf. 11 (1), 59–75. doi:10.1007/s12145-017-0315-5
Faichia, C., Tong, Z., Zhang, J., Liu, X., Kazuva, E., Ullah, K., et al. (2020). Using RS data-based CA–Markov model for dynamic simulation of historical and future LUCC in Vientiane, Laos. Sustainability 12 (20), 8410. doi:10.3390/su12208410
Fan, J., Wang, Y., Zhou, Z., You, N., and Meng, J. (2016). Dynamic ecological risk assessment and management of land use in the middle reaches of the Heihe River based on landscape patterns and spatial statistics. Sustainability 8 (6), 536–544. doi:10.3390/su8060536
Fang, Y., Cheng, W. M., Zhang, Y. C., Wang, N., Zhao, S., Zhou, C., et al. (2016). Changes in inland lakes on the Tibetan Plateau over the past 40 years. J. Geogr. Sci. 26 (4), 415–438. doi:10.1007/s11442-016-1277-0
Fu, X., Wang, X. H., and Yang, Y. J. (2018). Deriving suitability factors for CA-Markov land use simulation model based on local historical data. J. Environ. Manag. 206, 10–19. doi:10.1016/j.jenvman.2017.10.012
Goldsmith, G. R., Bentley, L. P., Shenkin, A., Salinas, N., Blonder, B., Martin, R. E., et al. (2017). Variation in leaf wettability traits along a tropical montane elevation gradient. New Phytol. 214 (3), 989–1001. doi:10.1111/nph.14121
Gong, W., Wang, H., Wang, X., Fan, W., and Stott, P. (2017). Effect of terrain on landscape patterns and ecological effects by a gradient-based RS and GIS analysis. J. For. Res. 28 (5), 1061–1072. doi:10.1007/s11676-017-0385-8
Ji, Y., Bai, Z., and Hui, J. (2021). Landscape ecological risk assessment based on LUCC—a case study of chaoyang county, China. Forests 12 (9), 1157. doi:10.3390/f12091157
Jin, X., Jin, Y., and Mao, X. (2019). Ecological risk assessment of cities on the Tibetan Plateau based on land use/land cover changes–Case study of Delingha City. Ecol. Indic. 101, 185–191. doi:10.1016/j.ecolind.2018.12.050
Karimi, H., Jafarnezhad, J., Khaledi, J., and Ahmadi, P. (2018). Monitoring and prediction of land use/land cover changes using CA-Markov model: a case study of Ravansar County in Iran. Arabian J. Geosciences 11 (19), 592–599. doi:10.1007/s12517-018-3940-5
Kayumba, P. M., Chen, Y., Mindje, R., Mindje, M., Li, X., Maniraho, A. P., et al. (2021). Geospatial land surface-based thermal scenarios for wetland ecological risk assessment and its landscape dynamics simulation in Bayanbulak Wetland, Northwestern China. Landsc. Ecol. 36 (6), 1699–1723. doi:10.1007/s10980-021-01240-8
Li, J., Pu, R., Gong, H., Luo, X., Ye, M., and Feng, B. (2017). Evolution characteristics of landscape ecological risk patterns in coastal zones in zhejiang province, China. Sustainability 9, 584–618. doi:10.3390/su9040584
Li, W., Wang, Y., Xie, S., Sun, R., and Cheng, X. (2020). Impacts of landscape multifunctionality change on landscape ecological risk in a megacity, China: a case study of Beijing. Ecol. Indic. 117, 106681. doi:10.1016/j.ecolind.2020.106681
Liang, E., Zhang, J., and Yang, W. (2017). Spatiotemporal variation of landscape ecological vulnerability in oasis in the Manas River Basin, Xinjiang. Arid. Zone Res. 34 (4), 950–957. doi:10.13866/j.azr.2017.04.30
Liu, D., Chen, H., Zhang, M., Shang, S., and Liang, X. (2019). Analysis of spatial-temporal distribution of landscape ecological risk in ecologically vulnerable areas and its terrain gradient—a case study of mizhi county of Shaanxi province. Res. Soil Water Conserv. 26, 239–244. doi:10.13869/j.cnki.rswc.2019.04.036
Liu, F., Qin, T. L., Girma, A., Wang, H., Weng, B., Yu, Z., et al. (2018). Dynamics of land-use and vegetation change using NDVI and transfer matrix: a case study of the Huaihe River Basin. Pol. J. Environ. Stud. 28 (1), 213–223. doi:10.15244/pjoes/82900
Lu, X., Qu, Y., Sun, P., Yu, W., and Peng, W. (2020). Green transition of cultivated land use in the Yellow River Basin: a perspective of green utilization efficiency evaluation. Land 9 (12), 475. doi:10.3390/land9120475
Mansour, S., Al-Belushi, M., and Al-Awadhi, T. (2020). Monitoring land use and land cover changes in the mountainous cities of Oman using GIS and CA-Markov modelling techniques. Land Use Policy 91, 104414. doi:10.1016/j.landusepol.2019.104414
Peng, J., Zong, M., Hu, Y., Liu, Y., and Wu, J. (2015). Assessing landscape ecological risk in a mining city: a case study in Liaoyuan City, China. Sustainability 7 (7), 8312–8334. doi:10.3390/su7078312
Pérez-Girón, J. C., Alvarez-Alvarez, P., Díaz-Varela, E. R., and Lopes, D. M. M. (2020). Influence of climate variations on primary production indicators and on the resilience of forest ecosystems in a future scenario of climate change: application to sweet chestnut agroforestry systems in the Iberian Peninsula. Ecol. Indic. 113, 106199–106207. doi:10.1016/j.ecolind.2020.106199
Popp, A., Calvin, K., Fujimori, S., Havlik, P., Humpenöder, F., Stehfest, E., et al. (2017). Land-use futures in the shared socio-economic pathways. Glob. Environ. Change 42, 331–345. doi:10.1016/j.gloenvcha.2016.10.002
Qu, Y., Zong, H., Su, D., Ping, Z., and Guan, M. (2021). Land use change and its impact on landscape ecological risk in typical areas of the Yellow River Basin in China. Int. J. Environ. Res. Public Health 18 (21), 11301. doi:10.3390/ijerph182111301
Strand, J., Soares-Filho, B., Costa, M. H., Oliveira, U., Ribeiro, S. C., Pires, G. F., et al. (2018). Spatially explicit valuation of the Brazilian Amazon forest’s ecosystem services. Nat. Sustain. 1 (11), 657–664. doi:10.1038/s41893-018-0175-0
Teng, M., Huang, C., Wang, P., Zeng, L., Zhou, Z., Xiao, W., et al. (2019). Impacts of forest restoration on soil erosion in the Three Gorges Reservoir area, China. Sci. Total Environ. 697, 134164. doi:10.1016/j.scitotenv.2019.134164
Tian, Y., Ma, L., and Wu, Q. (2023). Landscape ecological risk assessment in Inner Mongolia reaches of Yellow River based on land use evolution. Ecol. Sci. 42 (5), 103–113. doi:10.14108/j.cnki.1008-8873.2023.05.013
Tong, X., Wang, K., Brandt, M., Yue, Y., Liao, C., and Fensholt, R. (2016). Assessing future vegetation trends and restoration prospects in the karst regions of southwest China. Remote Sens. 8 (5), 357. doi:10.3390/rs8050357
Wang, X., Che, L., Zhou, L., and Xu, J. (2021). Spatio-temporal dynamic simulation of land use and ecological risk in the yangtze river delta urban agglomeration, China. Chin. Geogr. Sci. 31 (5), 829–847. doi:10.1007/s11769-021-1229-1
Wu, H., and Song, T. (2018). An evaluation of landslide susceptibility using probability statistic modeling and GIS's spatial clustering analysis. Hum. Ecol. Risk Assess. Int. J. 24 (7), 1952–1968. doi:10.1080/10807039.2018.1435253
Xiao, F. (2021). Impact of climate change on ecological security of the Yellow River Basin and its adaptation countermeasures. J. Landsc. Res. 13 (4), 51–56.
Xie, H., He, Y., Choi, Y., Chen, Q., and Cheng, H. (2020). Warning of negative effects of land-use changes on ecological security based on GIS. Sci. Total Environ. 704, 135427–135439. doi:10.1016/j.scitotenv.2019.135427
Xie, H., Wen, J., Chen, Q., and Wu, Q. (2021). Evaluating the landscape ecological risk based on GIS: a case-study in the poyang lake region of China. Land Degrad. Dev. 32 (9), 2762–2774. doi:10.1002/ldr.3951
Xu, Q., Guo, P., Jin, M., and Qi, J. (2021). Multi-scenario landscape ecological risk assessment based on Markov–FLUS composite model. Geomatics, Nat. Hazards Risk 12 (1), 1449–1466. doi:10.1080/19475705.2021.1931478
Xue, L., Zhu, B., Wu, Y., Wei, G., Liao, S., Yang, C., et al. (2019). Dynamic projection of ecological risk in the Manas River basin based on terrain gradients. Sci. Total Environ. 653, 283–293. doi:10.1016/j.scitotenv.2018.10.382
Ying, X., Min, W., Haiping, Y., and Chunyan, D. (2020). Landscape ecological risk assessment and its spatio-temporal evolution in Dongting lake area. Ecol. Environ. 29 (7), 1292. doi:10.16258/j.cnki.1674-5906.2020.07.002
Zhang, J., and Ren, Z. (2016). Spatiotemporal pattern and terrain gradient effect of land use change in Qinling-Bashan mountains. Trans. Chin. Soc. Agric. Eng. 32 (14), 250–257.
Zhang, Q., Zhang, Z., Shi, P., Singh, V. P., and Gu, X. (2018). Evaluation of ecological instream flow considering hydrological alterations in the Yellow River basin, China. Glob. Planet. Change 160, 61–74. doi:10.1016/j.gloplacha.2017.11.012
Keywords: ecological risk, dynamic forecasting, terrain gradient, landscape, Yellow River Basin
Citation: Yan J, Qiao H, Li Q, Song M, Yao X, Gao P, Zhang M, Li J, Qi G and Li G (2024) Landscape ecological risk assessment across different terrain gradients in the Yellow River Basin. Front. Environ. Sci. 11:1305282. doi: 10.3389/fenvs.2023.1305282
Received: 02 October 2023; Accepted: 22 December 2023;
Published: 26 January 2024.
Edited by:
Yong Q. Tian, Central Michigan University, United StatesReviewed by:
Wenting Zhang, Huazhong Agricultural University, ChinaCopyright © 2024 Yan, Qiao, Li, Song, Yao, Gao, Zhang, Li, Qi and Li. This is an open-access article distributed under the terms of the Creative Commons Attribution License (CC BY). The use, distribution or reproduction in other forums is permitted, provided the original author(s) and the copyright owner(s) are credited and that the original publication in this journal is cited, in accordance with accepted academic practice. No use, distribution or reproduction is permitted which does not comply with these terms.
*Correspondence: Jixuan Yan, eWFuaml4dWFuZEBzaW5hLmNvbQ==
Disclaimer: All claims expressed in this article are solely those of the authors and do not necessarily represent those of their affiliated organizations, or those of the publisher, the editors and the reviewers. Any product that may be evaluated in this article or claim that may be made by its manufacturer is not guaranteed or endorsed by the publisher.
Research integrity at Frontiers
Learn more about the work of our research integrity team to safeguard the quality of each article we publish.