 Senhu Qu1*
 Junxiao Zhou2
- 1Nanjing Jianye Ecological Environment Monitoring Center, Nanjing, China
- 2Jiangsu China Tobacco Industry Co., Ltd. Nanjing Cigarette Factory, Nanjing, China
Phytoplankton community structure influences the water quality of freshwater lakes and attracts the attention worldwide. The physicochemical parameters including dissolved oxygen (DO), total nitrogen, total phosphorus, NH4+-N and CODMn and biological index such as Chl.a concentrations were measured in water of different sites of Xuanwu Lake, China in varied seasons. The Trophic level index (TLI) was calculated to evaluate the trophic status of the lake based on critical water quality parameters. The phytoplankton community structure and biomass in the water was also identified and detected. Obvious change of physicochemical parameters and biological index was detected in varied sampling time. The results showed that TN, TP, NH4+-N, CODMn and Chl.a had higher concentrations in June and August with higher temperature. Obtained Trophic level index values from key water quality indicators revealed that Xuanwu Lake exhibited a state of mesotrophic level in December 2021, mild eutrophic level in October and February, and remained in a state of moderate eutrophication during other periods having higher temperature. Chlorophyta exhibited the highest species diversity and accounted for 48.1% of the entire community. Cyanobacteria had higher density compared to other phytoplankton, which suggesting the potential ecological risk in the lake. These findings aligned with the outcomes of the analysis of the phytoplankton community structure, underscoring a certain degree of correlation between the primary water quality indicators and phytoplankton abundance in Xuanwu Lake. That is, higher discharge of contaminant including nutrients potentially dominated the phytoplankton community structure. The continuous monitoring of phytoplankton community and water quality enabled the assessment of its trophic status of urban lake. Appropriate measures such as adjustment of phytoplankton community structure were proposed to mitigate the eutrophication status of lake. The investigation indicated that phytoplankton variation was the important indicator of water quality and supplied direct evidence for the water quality management and ecosystem restoration of urban lakes.
1 Introduction
Lakes are vital for the global environmental landscape, which offer critical habitats to diverse species and serve as integral components of aquatic ecosystems (Brirch et al., 1999). Lakes situated within or in close proximity to urban areas are collectively referred to as “urban lakes,” comprising both natural and artificial lake types (Andersson et al., 2014). Urban lakes represent intricate systems that interconnect natural, social, and economic elements, thereby constituting a crucial component of urban ecosystems. Frequently located on the periphery of cities, these lakes playing essential roles in water regulation, tourism, recreational opportunities, and dissemination of urban cultural values (Gkelis et al., 2014). Due to the intensive anthropogenic activities around the lakes, large amount of contaminants such as nutrients was discharged into the lakes and induce the potential eutrophication in water and attract the attention worldwide (Yang et al., 2017; Radosavljevic et al., 2022).
Phytoplankton, with their rapid reproductive rates and short life cycles, serve as valuable indicators of environmental parameters such as water nutrient levels, heavy metal concentrations, pesticides, and other organic pollutants (Bu-Olayan et al., 2001; et al., 2014). Consequently, they are commonly employed to approve and assess the health of aquatic ecosystems (Chen et al., 2003; Chakraborty et al., 2010; Xu et al., 2013; Ligorini et al., 2023). Yuan et al. (2021) proposed that phosphorus could be removed from lake sediments by Potamogeton crispus. In addition, nutrients including phosphorus and nitrogen had remarkable effects on phytoplankton distribution in the lake (Bu-Olayan et Çeleklia et al., 2020). Notably, variations in phytoplankton community structure, including shifts in species composition, exhibit meaningful correlations with water quality conditions and developmental trends (Su et al., 2016). However, the long-time response of phytoplankton community structure to water quality change of urban lakes are still limited and need more evidence.
Xuanwu Lake located in Nanjing City, China has long been a research hotspot of urban water management efforts, and is subjected to the degradation of ecological and environmental quality As a typical an urban lake (Xu et al., 2010). After experiencing eutrophication since the late 1980s, cyanobacterial bloom occurred in Xuanwu Lake in July 2005. Subsequent monitoring between 2006 and 2019 indicated a transition from moderate to mild eutrophication, primarily attributed to total nitrogen and total phosphorus as prominent environmental limiting factors (Hu et al., 2011; Chen et al., 2021; Wu et al., 2022). Phytoplankton community was gradually recovered and water quality was improved in this lake over time (Xu et al., 2010). Through comprehensive investigations into the phytoplankton community structure and eutrophication status of lakes, targeted strategies for lake restoration and conservation can be effectively formulated and adjusted. This approach holds promise in strengthening the management of lake’s aquatic ecology and realizing sustainable water clarity and ecological equilibrium. Furthermore, it facilitates a comprehensive and precise understanding of the lake’s ecological status, thereby promoting the orderly and sustainable development of aquatic environment of lakes.
2 Materials and methods
2.1 Research area and sampling
Xuanwu Lake, an typical urban lake, China, spans an area of approximately 3.68 km2, with a mean water depth of 1.14 m and a maximum depth of 2.31 m. The lake’s surface is segmented into three distinct sections by four small islands, namely, the North Lake, Southeast Lake, and Southwest Lake (Xu et al., 2010). Four sampling sites (Figure 1) were collected within Xuanwu Lake to facilitate bi-monthly sampling at regular intervals, specifically on October, 2021, December, 2021, February, 2022, April, 2022, June, 2022, and August, 2022, respectively.
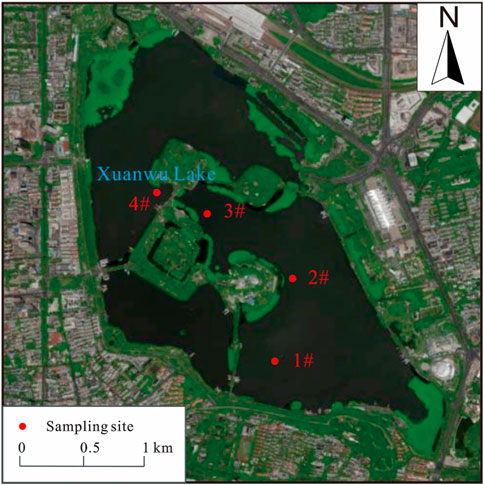
FIGURE 1. Sampling sites in Xuanwu Lake.
In addition, In-situ measurements were conducted using a multi-parameter water quality monitoring instrument (YSI, USA) to assess various water quality parameters, including water temperature (WT), conductivity (Cond.), potential of hydrogen (pH), turbidity (Tur), and dissolved oxygen (DO). Additionally, transparency (SD) was gauged by employing the Secchi disk method. Water samples were collected from a depth of 0.5 m utilizing organic glass water samplers and preserved in 500 mL polyethylene bottles after acidification to pH < 2 with H2SO4 except for common parameters except chlorophyll-a (Chl.a). Subsequent laboratory analyses encompassed a range of parameters, such as total nitrogen (TN), total phosphorus (TP), ammonium nitrogen (NH4+-N), suspended solids (SS), Chl.a, and permanganate index (CODMn), adhering to the protocols outlined in the Water and Wastewater Monitoring and Analysis Methods (4th Edition) (Ministry of Environmental Protection of the People’s Republic of China, 2002).
2.2 Phytoplankton collection and processing
Quantitative samples of phytoplankton were collected from the surface water using a 1 L water sampler, poured into sample bottles, labeled with unique sample numbers, and immediately treated with Lugol’s reagent in an amount of 1%–1.5% of the water sample volume (Chen et al., 2021). The identification and counting process of phytoplankton primarily adhered to the guidelines presented in Freshwater Algae of China: Systematics, Taxonomy, and Ecology (Hu and Wei, 2006). In brief, following a 48 h settling period in the laboratory, the supernatant of the sample was removed via siphoning, and the remaining volume was adjusted to 30 mL with distilled water. Phytoplankton identification and counting were conducted utilizing the counting frame method. In brief, 0.1 mL of 30 mL quantitative sample was rapidly drawn into a 0.1 mL counting frame (20 mm × 20 mm) beneath a cover slip. Subsequently, three to five rows in each field of view were meticulously counted utilizing a high-power microscope. In cases of low phytoplankton abundance, whole-slide counts were performed. Each sample was counted on two slides, and their mean values were recorded. The discrepancy between the counts on the two slides and their mean values were required to remain within ±15%. If this criterion was not met, a third slide counting was conducted, and the process was repeated until the difference between the three slide counts and their mean values did not surpass 15%. The mean values of the two closest values among the three slide counts would then be considered the final result.
Phytoplankton density was calculated as follows (Hu and Wei, 2016):
Where N denotes the total number of phytoplankton cells (cells/L); N0 represents the total area of the counting frame (mm2); N1 is the area counted within the frame (mm2); V1 is the volume of the water sample after concentration (mL); V0 represents the volume of the counting frame (mL); Pn denotes the number of phytoplankton counted.
Due to the approximate density of phytoplankton being close to 1, individual biomass could be directly estimated using the volume conversion method. Based on the morphological dimensions, such as length, width, and diameter, of phytoplankton species, a minimum of 50 randomly selected individuals from each species were measured. The volume of each species was calculated based on the most suitable geometric formula, and the mean value was obtained. Multiplying this mean value by the number of individuals of the respective algal species in 1 L of water sample yielded the biomass of that particular phytoplankton species in the sample. Summation of all phytoplankton species’ biomasses determined the total phytoplankton biomass in 1 L of water sample, expressed in mg/L.
2.3 Data processing
The Trophic level index (TLI) was employed to evaluate the trophic status of the lake based on critical water quality parameters, including TN, TP, CODMn, Chl.a, and SD (Wang and Liu, 2002). The TLI(∑) was calculated using the following equation:
Where TLI(∑) represents the comprehensive trophic status; Wj denotes the relative weight of the trophic state index for the jth parameter; TLI(j) signifies the trophic state index corresponding to the jth parameter. The quality thresholds of TLI index for each parameter is summarized in Table 3.
By selecting Chl.a as the reference parameter, the normalized weight (Wj) for each parameter was computed as follows (Wang and Liu, 2002):
Where rij denotes the correlation coefficient between the jth parameter and the reference parameter, Chl.a; m indicates the total number of parameters under evaluation. Table 1 presents the correlation coefficients (rij) and their squares (rij2) between selected parameters concerning Chl.a in Chinese lakes and reservoirs.
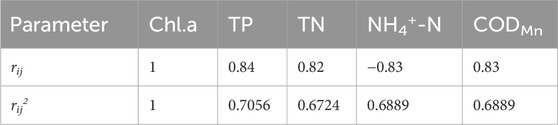
TABLE 1. Correlation coefficients (rij) and their squares (rij2) between selected parameters and Chl.a in Chinese lakes and reservoirs.
The TLI for each parameter was calculated as follow (Wang and Liu, 2002)s:
Where Chl.a is expressed in mg/m3, SD in m, and the other indicators in mg/L.
The determination of dominant phytoplankton species was based on their respective dominance values (Y), which were calculated as follows:
Where Ni represents the number of individuals of the ith species, N denotes the total number of individuals across all species, and fi signifies the occurrence frequency of the ith species. Species with Y values greater than or equal to 0.02 were categorized as dominant species (Ministry of Agriculture of the People’s Republic of China, 2010).
3 Results and discussion
3.1 Physicochemical parameter variation
The physicochemical parameters including WT, DO, Cond, pH, Tur, SD, TN, TP, NH4+-N and CODMn were plotted in Figure 2. These parameters did not display the remarkable difference in different sampling sites, indicating the homogeneity of water quality. The WT in Xuanwu Lake exhibited a range of 5.43°C–34.21°C, with mean value of 21.8°C. Notably, it displayed significant seasonal variations, reaching its peak in June 2022 and its nadir in December 2021. DO concentrations showcased fluctuations between 9.94 and 21.1 mg/L, with the highest monthly mean value of 19.55 mg/L recorded in October 2021 and the lowest of 10.72 mg/L in June 2022. The DO concentrations were remarkably higher than Datong Lake and Shijiuhu Lake which are also situated in the Yangtze River, China (Chao et al., 2022; Yuan et al., 2023). Based DO threshold value proposed by GB3838-2002 standards (China), Xuanwu Lake consistently maintained a DO concentration within Class I criteria (National Standard of the People’s Republic of China, 2002). The Cond. Values ranged from 221.2 to 342.3 uS/cm, with mean value of 273.52 uS/cm. The pH values exhibited variation between 7.37 (December) and 12.12 (Apri), with mean value of 9.9, indicating a certain alkaline characteristic. Tur demonstrated values within the range of 1.39–23.88 NTU, with the lowest value appearing in December 2021 and the highest in June 2022. Additionally, the SD varied between 0.21 m and 1.94 m, with the lowest value observed in June 2022 and the highest in December 2021. The temporal trends of DO and Tur exhibited pronounced seasonality and were consistent with WT.
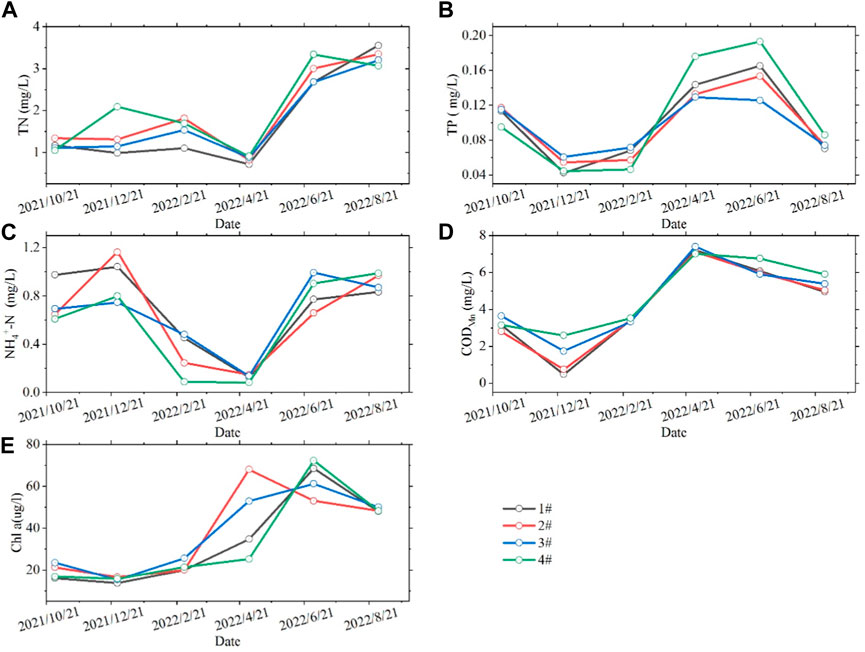
FIGURE 2. Variation trend of environment indexes including TN, TP, NH4+-N, CODMn and Chl a concentrations over time. The lines refer to different sampling sites.
The TN content in Xuanwu Lake ranged from 0.72 to 3.55 mg/L, with mean value of 1.85 mg/L. The lowest monthly mean value of 0.83 mg/L was observed in April 2022, followed by a gradual increase, reaching the highest value of 3.29 mg/L in August 2022, which were higher than that in Datong lake with TN value less than 1.5 mg/L (Chao et al., 2022). Furthermore, TN levels remained relatively lower in October 2021, December 2021, and February 2022, with respective values of 1.17 mg/L, 1.38 mg/L, and 1.53 mg/L. As per GB3838-2002, the compliance rate of Xuanwu Lake’s surface water with Class IV standards (<1.5 mg/L) was 66.7%. However, TN content exceeded Class V standards (>2 mg/L) in June and August 2022, indicating significant N pollution level in this lake.
The TP in the lake water ranged from 0.042 to 0.19 mg/L, with a mean value of 0.10 mg/L. The lowest monthly mean value of 0.051 mg/L was observed in December 2021, followed by a gradual increase, reaching the highest value of 0.16 mg/L in June. Additionally, TP concentrations remained relatively lower in August 2022 and October 2021, with values of 0.076 and 0.11 mg/L, respectively. Throughout the study period, Xuanwu Lake did not meet the Class III standards for TP specified in GB3838-2002. In December 2021, February 2022, and August 2022, it met the Class IV standards, while the remaining months fell under Class V standards. However, the TP concentrations in Xuanwu Lake were lower than that in Datong lake with TP value higher than 0.1 mg/L and higher than that in Shijiuhu Lake with TP value less than 0.05 mg/L, respectively (Chao et al., 2022; Cai et al., 2023).
Ammonium nitrogen (NH4+-N) in Xuanwu Lake ranged from 0.001 mg/L to 0.037 mg/L, with mean value of 0.013 mg/L. The highest monthly mean value of 0.019 mg/L was observed in December 2021, followed by a gradual decrease, reaching the lowest value of 0.0021 mg/L in April 2022. NH4+-N concentrations remained stable in June and August 2022. Ammonium nitrogen (NH4+-N) concentrations were generally lower than that in Datong lake (Chao et al., 2022). Nitrate nitrogen (NO3−-N) varied from 0.082 to 1.16 mg/L, with mean value of 0.64 mg/L. The highest monthly mean value of 0.94 mg/L was recorded in December 2021, followed by a gradual decrease, reaching the lowest value of 0.12 mg/L in April 2022. Relatively higher values were observed in June 2022, August 2022, and October 2021, with respective values of 0.83 mg/L, 0.91 mg/L, and 0.73 mg/L. The water quality of Xuanwu Lake met Class III standards for NH4+-N throughout the study period. In February 2022, it met Class II standards, and in April 2022, it met Class I standards. Generally, N in Xuanwu Lake is at a low level of pollution.
In addition, CODMn in Xuanwu Lake ranged from 0.47 mg/L to 7.4 mg/L, with mean value of 4.45 mg/L, which was generally lower than that in Datong Lake with COD values higher than 5 mg/L (Chao et al., 2022). The highest monthly mean value of 7.18 mg/L was observed in April 2022, followed by a gradual decrease, reaching the lowest value of 1.39 mg/L in December 2021. In February 2022, CODMn exhibited a relatively lower value of 3.43 mg/L. According to GB3838-2002 standards, Xuanwu Lake met Class IV standards in April and June 2022, Class III standards in August 2022, Class II standards in October 2021 and February 2022, and Class I standards in December 2021.
Finally, the Chl.a concentration in the lake was also shown in Figure 2. Significant increase of Chl.a was found during the monitoring period. The Chl.a values ranged from 13.71o 72.23 μg/L, with an mean value of 35.69 μg/L. The highest monthly mean value of 63.73 μg/L was observed in June 2022, followed by August 2022 and April 2022, with values of 48.69 and 45.23 μg/L, respectively. In October 2021, December 2021, and February 2022, Chl.a levels were relatively lower, with values of 19.43 μg/L, 15.37 μg/L, and 21.72 μg/L, respectively. In general, remarkable variation of physicochemical and biological parameters were found in Xuanwu Lake during the changed sampling times, which were also detected in other lakes (Tong et al., 2021; Yuan et al., 2023). High pH is concordant with high chl.a values. Photosynthesis consumes inorganic C from the water, which shifts the pH towards high values by loss of the alkaline reserve in the form of phytoplankton (Brettum, 1996). This mechanism was speculated to be responsible for the higher pH values in warm period.
3.2 Phytoplankton community structure
A visual representation of the mean phytoplankton species composition in Xuanwu Lake is depicted in Figure 3. During the period from 2021 to 2022, the phytoplankton community in Xuanwu Lake was composed primarily of Chlorophyta, Cryptophyta, Cyanobacteria, Chrysophyta, Bacillariophyta, Pyrrophyta, Euglenophyta, and amounting to a total of 65 species. Among these, Chlorophyta exhibited the highest species diversity, encompassing 32 different species, which accounted for 48.1% of the entire community. Similar high abundance of Chlorophyta was also found in Xingyu Lake, China (Su et al., 2016). Following closely, Bacillariophyta comprised 14 species, representing 24.2% of the community, while Cyanobacteria constituted ten species, making up 15.4%. As the biological indicator of eutrophication of lake ecosystem, Cyanobacteria contributed 14.8% to the community in this lake (Rönicke et al., 2021). The groups Pyrrophyta and Euglenophyta were relatively rare, collectively contributing 8.3% to the overall community. Interestingly, Chrysophyta, represented solely by the species Dinobryon sp., had the lowest representation in the Lake.
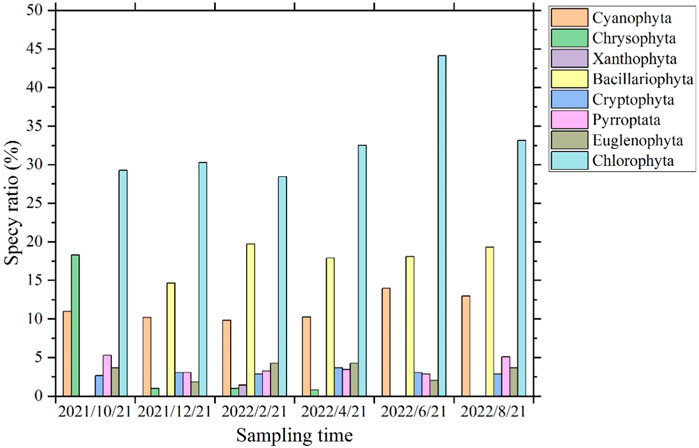
FIGURE 3. Phytoplankton species composition in Xuanwu Lake.
A comprehensive overview of the dominant phytoplankton species and their corresponding dominance values can be found in Table 2. The phytoplankton community in Xuanwu Lake is characterized by two dominant species, namely, Raphidiopsis sinensia and Pseudanabaena sp., both exhibiting a dominance value of 0.09. Dominant phytoplankton species attached to Cyanobacteria suggested potential ecological risk in Xuanwu Lake (Gkelis et al., 2014; Xue et al., 2021).
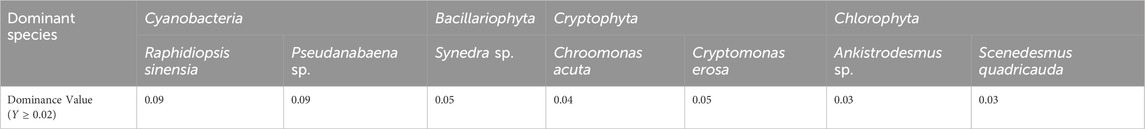
TABLE 2. Dominant phytoplankton species and their dominance values in Xuanwu Lake.
3.3 Phytoplankton density and biomass
The monthly mean phytoplankton density in Xuanwu Lake exhibited a range from 8.26 × 10⁵ to 2.18 × 10⁷ cells/mL, with the lowest value observed in December 2021 and the highest in June 2022. Notably, Cyanobacteria dominated the phytoplankton community during October 2021, June 2022, and August 2022, reaching its peak density in June 2022 (1.88 × 10⁷ cells/L) when higher temperature occurred. Similar high density of Cyanobacteria were also found in Taihu Lake in warm period (Qin et al., 2018). Conversely, the lowest density of Cyanobacteria occurred in February 2022, recording 1.73 × 10⁴ cells/L. In October 2021, Cyanobacteria accounted for 80.67% of the total density, while Cryptophyta and Chlorophyta contributed 8.78% and 7.71%, respectively. However, in December 2021, Cryptophyta experienced a substantial increase, becoming the dominant group with a proportion of 75.31%, and Chlorophyta also increased to 10.53%. In February 2022, Cyanobacteria reached the lowest density, and Cryptophyta further increased to 83.47%, with the appearance of Chrysophyta noted for the first time. In April 2022, Bacillariophyta exhibited a substantial rise, comprising 40.62% of the total density, followed by Cryptophyta, Cyanobacteria, and Chlorophyta, contributing 24.41%, 18.74%, and 15.12%, respectively. Both in June and August 2022, Cyanobacteria dominated the community with proportions of 86.14% and 84.1%, respectively, indicating the potential eutrophication in the lake. In general, elevated temperatures facilitated the increase of the dense of phytoplankton communities in the lake (Hao et al., 2018).
The monthly mean biomass in the Lake exhibited a range from 0.91 to 8.45 mg/L, with the highest value observed in April 2022 and the lowest in October 2021. In October 2021, Cryptophyta dominated the biomass, contributing 53.86%, while Bacillariophyta also made a significant contribution with a proportion of 12.36%. Similar predominance of Cryptophyta was also found in Baiyangdian Lake, China (Liu et al., 2010). During December 2021, Cryptophyta remained the predominant group, accounting for the highest biomass (63.36%), followed by Pyrrophyta, contributing 20.78%. In February 2022, Cryptophyta and Euglenophyta contributed the majority of the biomass, comprising 56.28% and 31.09%, respectively. In April 2022, Bacillariophyta dominated the biomass (52.91%), and Cryptophyta constituted the second most abundant group (35.73%). In June 2022, Bacillariophyta accounted for the highest biomass (48.74%), followed by Chlorophyta and Cryptophyta, with proportions of 19.96% and 16.5%, respectively. Finally, in August 2022, Cryptophyta represented the highest biomass proportion (45.6%), followed by Bacillariophyta and Chlorophyta, contributing 24.58% and 13.02%, respectively. In general, Cyanobacteri did not show significantly higher biomass than other phytoplankton species, suggesting relative healthy community structure of phytoplankton in Xuanwu Lake.
3.4 Correlation between water quality and phytoplankton
The categorization of major water quality indicators in Xuanwu Lake is also summarized in Table 3. The evaluation of key water quality indicators in this Lake, based on their annual mean values, revealed that the overall water quality fell within Class I for DO, Class V (GB3838-2002) for TN, Class IV for TP, Class III for NH4+-N, and Class IV for CODMn. An analysis of all sample indicators indicated that DO fully met Class I standards at 100%, and TN met inferior Class V standards at a rate of 37.5%. In addition, 12.5% of TP, 91.67% of NH4+-N, and 75% of CODMn complied with Class III or higher surface water standards. The TLI(∑) was calculated using five indicators (TN, TP, Chl.a, CODMn, and SD), resulting in values ranging from 36.34 to 69.67, with an overall mean of 56.84. Monthly variations in TLI(∑) were observed within the range of 42.76–67.38. The variation trends of TIL values are plotted in Figure 4. The data analysis revealed that approximately 16.67% of the time, Xuanwu Lake experienced mesotrophic conditions, predominantly observed in December 2021. The majority of the remaining months exhibited eutrophic conditions, with October 2021 and February 2022 falling under mild eutrophication, and April, June, and August 2022 indicating moderate eutrophication. Remarkable deterioration of water quality was found during the research period when temperature tended to be higher. Similar variation was also found in Baiyangdian Lake and Shijiuhu Lake (Liu et al., 2010; cai et al., 2023). That is, warm period facilitate the accumulation of pollutant including nutrients and degradation of lake water quality.
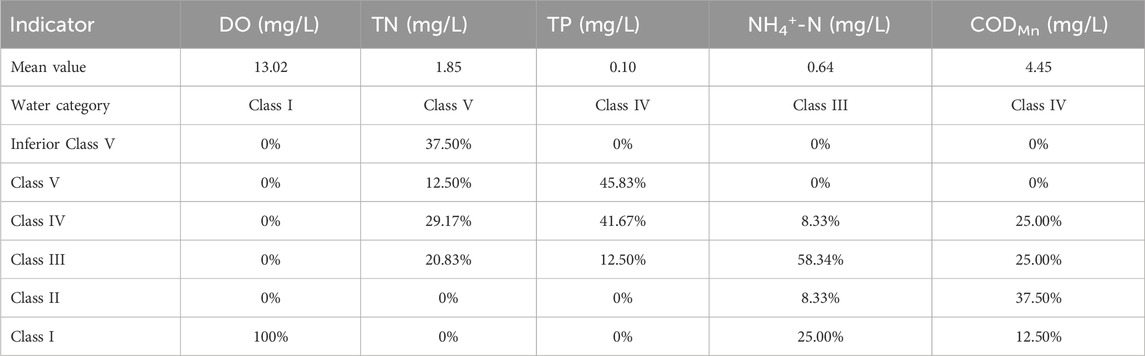
TABLE 3. Major water quality indicators and their categories in Xuanwu Lake.
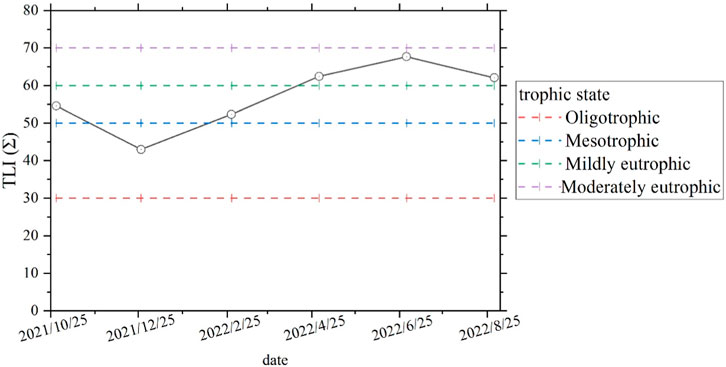
FIGURE 4. Trends in TLI(∑) for Xuanwu Lake.
Based on the established eutrophication assessment criteria for lakes in China, which categorize phytoplankton density and biomass levels, we defined oligotrophic conditions when the phytoplankton density was below 3 × 10⁵ cells/mL or the biomass was less than 1.5 mg/L. Mesotrophic conditions occurred when the density fell within the range of (3–10) ×105 cells/mL or the biomass lay between 1.5 and 5 mg/L. The phytoplankton community structure could be altered t due to their sensitivity to nutrient concentrations (Su et al., 2016). Eutrophic conditions were identified when the density exceeded 10 × 105 cells/mL, or the biomass ranged from 5 to 10 mg/L. Analyzing the phytoplankton density and biomass data in Xuanwu Lake, we found that the lake predominantly experienced eutrophic conditions throughout the observation period, except for December 2021, during which it exhibited mesotrophic characteristics. Liu et al. (2010) proposed that the physico-chemical factors had a positive correlation with phytoplankton community structure. Seasonal variation of phytoplankton was also detected in Taihu Lake and Chaohu Lake, China, indicating the potential nutrient limitation in different seasons in lake water (Xu et al., 2013; Jiang et al., 2014). Generally, the TLI(∑), derived from relevant water quality indicators, aligned with the assessment based on phytoplankton density and biomass, suggesting a significant correlation between the phytoplankton community structure and relevant water quality indicators in Xuanwu Lake. The improvement measurements of water quality such as the emission reduction of N and P loads from the terrestrial sources can adjust the phytoplankton community structure and biomass of urban lakes.
4 Conclusion
The present study aimed to analyze the temporal variations in environmental factors and assess the trophic status of a freshwater lake, Xuanwu Lake, through an examination of its phytoplankton community. The results demonstrated that:
1) Xuanwu Lake exhibited elevated nutrient levels, with mean TN concentration of 1.85 mg/L and mean TP concentration of 0.1 mg/L over time. Seasonal fluctuations were observed, with TN water quality falling into inferior Class V during June and August 2022 and TP water quality being classified as Class V in October 2021 and April and June 2022.
2) The comprehensive survey identified a total of 65 phytoplankton species, with Chlorophyta and Bacillariophyta predominating. Species abundance displayed seasonal patterns, reaching its nadir in December and peaking in June. The lowest phytoplankton density was observed in December, while the highest occurred in June. Regarding biomass, the lowest values were recorded in October, while the highest values appeared in April.
3) Water quality deteriorate with the increase of temperature. Warm period facilitate the accumulation of nutrients and degradation of lake water quality. The TLI(∑) aligned with the assessment based on phytoplankton density and biomass suggested a significant correlation between the phytoplankton community structure and relevant water quality indicators in Xuanwu Lake. The investigation supply direct evidence for the water quality management and ecosystem restoration of urban lakes.
Data availability statement
The original contributions presented in the study are included in the article/Supplementary Material, further inquiries can be directed to the corresponding author.
Author contributions
SQ: Conceptualization, Data curation, Formal Analysis, Funding acquisition, Investigation, Methodology, Project administration, Resources, Software, Supervision, Validation, Visualization, Writing–original draft, Writing–review and editing. JZ: Investigation, Writing–review and editing.
Funding
The author(s) declare financial support was received for the research, authorship, and/or publication of this article. This research was funded by Jiangsu Water Conservancy Science and Technology Project (2021038).
Conflict of interest
Author JZ was employed by Jiangsu China Tobacco Industry Co., Ltd. Nanjing Cigarette Factory.
The remaining author declares that the research was conducted in the absence of any commercial or financial relationships that could be construed as a potential conflict of interest.
Publisher’s note
All claims expressed in this article are solely those of the authors and do not necessarily represent those of their affiliated organizations, or those of the publisher, the editors and the reviewers. Any product that may be evaluated in this article, or claim that may be made by its manufacturer, is not guaranteed or endorsed by the publisher.
References
Andersson, M., Klug, M., Eggen, O. A., and Ottesen, R. T. (2014). Polycyclic aromatic hydrocarbons (PAHs) in sediments from Lake Lille Lungegårdsvannet in Bergen, western Norway; appraising pollution sources from the urban history. Sci. Total Environ. 470-471, 1160–1172. doi:10.1016/j.scitotenv.2013.10.086
Birch, S., and Mccaskie, J. (1999). Shallow urban lakes: a challenge for lake management. Hydrobiologia 395, 365–378. doi:10.1023/a:1017099030774
Brettum, P. (1996). Changes in the volume and composition of phytoplankton after experimental acidification of a humic lake. Environ. Int. 22, 619–628. doi:10.1016/0160-4120(96)00037-2
Bu-Olayan, A. H., Al-Hassan, R., Thomas, B. V., and Subrahmanyam, M. N. V. (2001). Impact of trace metals and nutrients levels on phytoplankton from the Kuwait Coast. Environ. Int. 26, 199–203. doi:10.1016/s0160-4120(00)00106-9
Cai, Y. W., Wang, H. X., Zhang, T. X., Zhou, Y. W., Dong, A. Z., Huang, R., et al. (2023). Seasonal variation regulate the endogenous phosphorus release in sediments of Shijiuhu Lake via water-level fluctuation. Environ. Res. 238, 117247. doi:10.1016/j.envres.2023.117247
Çeleklia, A., Kayhana, S., and Çetin, T. (2020). First assessment of lakes’ water quality in Aras River catchment (Turkey); Application of phytoplankton metrics and multivariate approach. Ecol. Indic. 117, 106706. doi:10.1016/j.ecolind.2020.106706
Chakraborty, P., Babu, P. V. R., Acharyya, T., and Bandyopadhyay, D. (2010). Stress and toxicity of biologically important transition metals (Co, Ni, Cu and Zn) on phytoplankton in a tropical freshwater system: an investigation with pigment analysis by HPLC. Chemosphere 80, 548–553. doi:10.1016/j.chemosphere.2010.04.039
Chao, C. X., Lv, T., Wang, L. G., Li, Y., Han, C., Yu, W. C., et al. (2022). The spatiotemporal characteristics of water quality and phytoplankton community in a shallow eutrophic lake: implications for submerged vegetation restoration. Sci. Total Environ. 821, 153460. doi:10.1016/j.scitotenv.2022.153460
Chen, Y. N., Huang, R., Guan, Y. S., Zhuang, T. Y., Wang, Y. Y., Tan, R. C., et al. (2021). The profiling of elements and pesticides in surface water in Nanjing, China with global comparisons. Sci. Total Environ. 774, 145749. doi:10.1016/j.scitotenv.2021.145749
Chen, Y. W., Fan, C. X., Teubner, K., and Dokulil, M. (2003). Changes of nutrients and phytoplankton chlorophyll-a in a large shallow lake, Taihu, China: an 8-year investigation. Hydrobiologia 506-509, 273–279. doi:10.1023/b:hydr.0000008604.09751.01
Gkelis, S., Papadimitriou, T., Zaoutsos, N., and Leonardos, I. (2014). Anthropogenic and climate-induced change favors toxic cyanobacteria blooms: evidence from monitoring a highly eutrophic, urban Mediterranean lake. Harmful Algae 39, 322–333. doi:10.1016/j.hal.2014.09.002
Hao, B. B., Wu, H. P., Jeppesen, E., and Li, W. (2018). The response of phytoplankton communities to experimentally elevated temperatures in the presence and absence of Potamogeton crispus. Algal Res. 35, 539–546. doi:10.1016/j.algal.2018.09.032
Hu, H. J., and Wei, Y. X. (2016). The freshwater algae of China—Systematics, taxonomy and ecology. Beijing, China: Science Press.
Hu, X., Wang, C., and Zou, L. M. (2011). Characteristics of heavy metals and Pb isotopic signatures in sediment cores collected from typical urban shallow lakes in Nanjing, China. J. Environ.l Manage. 92, 742–748. doi:10.1016/j.jenvman.2010.10.016
Jiang, Y. J., He, W., Liu, W. X., Qin, N., Ouyang, H. L., Wang, Q. M., et al. (2014). The seasonal and spatial variations of phytoplankton community and their correlation with environmental factors in a large eutrophic Chinese lake (Lake Chaohu). Ecol. Indic. 40, 58–67. doi:10.1016/j.ecolind.2014.01.006
Ligorini, V., Garrido, M., Malet, N., Simon, L., Alonso, L., Bastien, R., et al. (2023). Response of phytoplankton communities to variation in salinity in a small mediterranean coastal lagoon: future management and foreseen climate change consequences. Water 15, 3214. doi:10.3390/w15183214
Liu, C. Q., Liu, L. S., and Shen, H. T. (2010). Seasonal variations of phytoplankton community structure in relation to physico-chemical factors in Lake Baiyangdian, China. Procedia Environ. Sci. 2, 1622–1631. doi:10.1016/j.proenv.2010.10.173
Ministry of Agriculture of the People’s Republic of China, (2010). The trade standard of the People's Republic of China: specifications for freshwater plankton survey (SC/T-9402-2010). Beijing, China: Ministry of Agriculture of the People’s Republic of China.
Ministry of Environmental Protection of the People's Republic of China, (2002). Water and wastewater monitoring and analysis methods. 4th. Beijing, China: China Environmental Science Press.
National Standard of the People’s Republic of China, (2002). Environmental quality standards for surface water (GB3838-2002). Beijing, China: National Standard of the People’s Republic of China.
Qin, B. Q., Yang, G. J., Ma, J. R., Wu, T. F., Li, W., Liu, L. Z., et al. (2018). Spatiotemporal changes of cyanobacterial bloom in large shallow eutrophic lake Taihu, China. Front. Microbiol. 9, 451. doi:10.3389/fmicb.2018.00451
Radosavljevic, J., Slowinski, S., Shafii, M., Akbarzadeh, Z., Rezanezhad, F., Parsons, C. T., et al. (2022). Salinization as a driver of eutrophication symptoms in an urban lake (Lake Wilcox, Ontario, Canada). Sci. Total Environ. 846, 157336. doi:10.1016/j.scitotenv.2022.157336
Rönicke, H., Frassl, M. A., Rinke, K., Tittel, J., Beyer, M., Kormann, B., et al. (2021). Suppression of bloom-forming colonial cyanobacteria by phosphate precipitation: a 30 years case study in Lake Barleber (Germany). Ecol. Eng. 162, 106171. doi:10.1016/j.ecoleng.2021.106171
Su, Y. P., Zhang, C. W., Liu, J. X., Weng, Y., Li, H. L., and Zhang, D. Y. (2016). Assessing the impacts of phosphorus inactive clay on phosphorus release control and phytoplankton community structure in eutrophic lakes. Environ. Pollut. 219, 620–630. doi:10.1016/j.envpol.2016.06.029
Tong, Y. D., Xu, X. W., Qi, M., Sun, J. J., Zhang, Y. Y., Zhang, W., et al. (2021). Lake warming intensifies the seasonal pattern of internal nutrient cycling in the eutrophic lake and potential impacts on algal blooms. Water Res. 188, 116570. doi:10.1016/j.watres.2020.116570
Wang, M. C., and Liu, X. Q. (2002). Evaluate method and classification standard on lake eutrophication. Environ. Mot. China 18, 47–49.
Wu, B. W., Dai, S. J., Wen, X. L., Qian, C., Luo, F., Xu, J. Q., et al. (2022). Chlorophyll-nutrient relationship changes with lake type, season and small-bodied zooplankton in a set of subtropical shallow lakes. Ecol. Indic. 135, 108571. doi:10.1016/j.ecolind.2022.108571
Xu, S., Huang, B., Wei, Z. B., Luo, J., Miao, A. J., and Yang, L. Y. (2013). Seasonal variation of phytoplankton nutrient limitation in Lake Taihu, China: a monthly study from Year 2011 to 2012. Ecotox. Environ. Safe. 94, 190–196. doi:10.1016/j.ecoenv.2013.05.006
Xu, Y., Wang, G. X., Yang, W. B., and Li, R. H. (2010). Dynamics of the water bloom-forming Microcystis and its relationship with physicochemical factors in Lake Xuanwu (China). Environ. Sci. Pollut. Res. 17, 1581–1590. doi:10.1007/s11356-010-0345-8
Xue, J. Y., Yao, X. L., Zhao, Z. H., He, C., Shi, Q., and Zhang, L. (2021). Internal loop sustains cyanobacterial blooms in eutrophic lakes: evidence from organic nitrogen and ammonium regeneration. Water Res. 206, 117724. doi:10.1016/j.watres.2021.117724
Yang, L. K., Peng, S., Zhao, X. H., and Li, X. (2017). Development of a two-dimensional eutrophication model in an urban lake (China) and the application of uncertainty analysis. Ecol. Model. 345, 63–74. doi:10.1016/j.ecolmodel.2016.11.014
Keywords: water quality assessment, water quality indicators, phytoplankton, eutrophication, Xuanwu Lake
Citation: Qu S and Zhou J (2024) Phytoplankton community structure and water quality assessment in Xuanwu Lake, China. Front. Environ. Sci. 11:1303851. doi: 10.3389/fenvs.2023.1303851
Received: 28 September 2023; Accepted: 22 December 2023;
Published: 10 January 2024.
Edited by:
Paweł Tomczyk, Wroclaw University of Environmental and Life Sciences, PolandReviewed by:
Juan Soria, University of Valencia, SpainJiunn T. Wu, Biodiversity Research Center, Academia Sinica, Taiwan
Copyright © 2024 Qu and Zhou. This is an open-access article distributed under the terms of the Creative Commons Attribution License (CC BY). The use, distribution or reproduction in other forums is permitted, provided the original author(s) and the copyright owner(s) are credited and that the original publication in this journal is cited, in accordance with accepted academic practice. No use, distribution or reproduction is permitted which does not comply with these terms.
*Correspondence: Senhu Qu, cXVzZW5odWlAMTI2LmNvbQ==