 Katarzyna Prokop1
 Marta Włodarczyk-Sielicka
95% of researchers rate our articles as excellent or good
Learn more about the work of our research integrity team to safeguard the quality of each article we publish.
Find out more
ORIGINAL RESEARCH article
Front. Environ. Sci. , 13 November 2023
Sec. Environmental Informatics and Remote Sensing
Volume 11 - 2023 | https://doi.org/10.3389/fenvs.2023.1303067
This article is part of the Research Topic Women in Environmental Informatics and Remote Sensing View all 8 articles
Automatic data analysis systems in the Internet of Things are a key element. One such case is the use of drones to monitor rivers, which are quite often located around built-up areas. This is an important element for the analysis of urban areas that are exposed to various environmental challenges such as pollution and animal habitats. Data analysis allows the detection of anomalies in the state of rivers, reducing the risk of ecological disasters or even floods. Additionally, constant control of areas enables analysis of the impact of urbanization on a given area as well as environmental protection. In this paper, we propose an end-to-end system, where the user performs measurements with a drone and the result is a segmentation mask from the U-Net network, but improved by image processing algorithms. The system is based on performing segmentation with a neural network, imposing the obtained mask on the image that was previously subjected to edge detection. All pixels under the mask are analyzed by the clustering method in terms of belonging to a river or bank. In addition, when there are other measurements from the same area, they are used to compare and analyze changes. The proposed system architecture is based on the automation of activities due to the combination of various graphics processing methods. Moreover, the method allows for obtaining more accurate segmentation results than classic methods. The proposition was tested on data gathered near river areas in southern Poland to show the possibilities and effectiveness of the system. Proposed methodology reached 0.8524 of Dice coefficient using VGG16 as encoder.
Technological progress enables the creation of systems that, after obtaining data, will automatically analyze them. This is important in the perspective of systems or solutions aimed at estimating or detecting certain changes or differences over time. An important element is climate change, which affects the environment. In the event of rainfall or rising water levels in rivers, this can have huge consequences for the areas around the rivers. It is worth noting that quite often rivers flow between built-up areas where people live. Therefore, it is important to constantly analyze the state of rivers, and in particular their analysis in relation to a specific time. The possibility of continuous analysis can be implemented using automatic systems connected to objects with sensors. An example is drones that allow video recording of the area below them.
Nowadays, the analysis of the state of water allows the creation of flood protection systems, or even systems informing about changes around rivers (Diaconu et al., 2023). A system dedicated to Internet of Things solutions can be used (Rusdi et al., 2023). The authors focused on creating a system based on a physical device using the Arduino microcontroller. In order to verify the solution, ultrasonic sensors were used, which were tested in Binjai City. As part of the analysis of the results, the authors showed that the error decreases with the increase in the amount of measurement data. One of the most popular solutions of such systems is the analysis of water quality, rather than the use of techniques to alert about changes. However, the used and modeled solutions can be applied in a variety of systems after their adaptation to a different purpose. An example of such a system is the supervision framework (Jiang et al., 2023). The idea was to correctly combine equipment, models and knowledge for a system that can monitor or even remove failures to maintain the state of municipal waters. It is a solution based on the Internet of Things that enables the automation of the activities of individual objects or things. The enormous development of the Internet of Things has resulted in a focus on various objects that can retrieve data from the environment. A particularly important element is the method of processing data from these sensors so that it can enable a certain analysis or action to be performed. An example is paying attention to data cleaning and processing (Kumarapu et al., 2022). In the case of drones, camera data is most often combined with the location, height above the terrain and the lens used. This allows georeferencing of measurement data to be generated in order to precisely locate the data or obtain certain information. In the case of real-time analysis applications, it is important to focus on object detection/classification (Singh et al., 2022). Analysis of activities allows the use of this information in further analysis, an example of which is the analysis of coastal changes (Tur et al., 2020). The authors focused on analyzing the situation of coastal changes in Turkey through the use of UAVs. This solution uses photometric photos and point clouds with a constant spacing of 0.25 m. The results of analyzes over several years have shown the occurrence of sedimentation and erosion. Another solution is to create a model based on data fusion (Yin et al., 2023), where the authors presented a segmented network model with a spatial transformation network connection. The network architecture allowed for obtaining very good segmentation results by using a database of panoramic photos of Lake Urmia.
The mentioned scientific research shows that the topic is current and necessary due to the possibilities of analysis. However, the proposed systems are based on huge amounts of data used for analysis or network training. Moreover, models quite often use additional sensors to increase the amount of data, which in the processing process allows obtaining better results. As a result, there are no solutions that will work on the basis of data obtained during measurements without the need to train the classifier first. Based on this observation, we propose an end-to-end system that enables automatic processing of data obtained from a drone in order to analyze the state of rivers as well as making a mosaic visualization to display the processed area. The system is based on mobile technology, where the entire analysis process is performed by one application. Processing and analysis of measurement data is based on determining the coordinates of the image, segmentation of the river on a simplified image using a dedicated network with learning transfer. The result of the segmentation is an image with an indication of the river and its borders. However, such processing does not allow for good accuracy in terms of edge analyses. For this purpose, we propose the use of image processing and clustering methods to enable more accurate segmentation. In addition, such a sample is analyzed in relation to the width of the river at selected points with the possibility of comparison with archive data, which are automatically checked. The end result for the user is the ability to visualize the analyzed area/impose a segmentation image, as well as information analyzing current data with archived data. The main contribution of this paper can be described as.
• End-to-end system for the analysis of data obtained from the drone,
• A solution enabling segmentation at various levels of network training due to the possibility of using image processing methods,
• Dedicated river segmentation solution in 2D images based on combining the result of the U-Net network with the algorithm of clustering and image processing in order to obtain more accurate results on the riverbanks.
The rest of the work is divided into four sections. The next section focuses on the analysis of state of art and the current state of image processing research. Section 3 describes the proposed data processing methodology. Section 4 presents the tests and experiments performed to verify the operation of the proposal with a detailed discussion of the results obtained. The last section presents a summary of the proposed method, the results obtained and future work that could develop the proposed system.
Technological development allows for the construction of devices with many different sensors, which contributes to modeling methods of processing this data for analysis purposes. An example is the water quality assessment system based on the use of sensors enabling the collection of temperature, carbon monoxide, or pH reading (Kumar et al., 2023). The measurements are transmitted to a computer via a wireless network where the data processing takes place. Analysis results are stored in the cloud or on the server. It is a solution that divides tasks into individual stages/equipment. Other systems focus on the analysis of data obtained from various sensors, as exemplified by the modeling of the dynamics of arsenic in water (Marcheva et al., 2023). The data obtained from water analyses allowed for their processing through clustering and subsequent use of regression models for further analysis. A river water quality management system can be based on qualitative data that was subjected to multiple regression (Seo et al., 2023). It was pointed out that monitoring systems are an important element in the accurate analysis of measurement data, as well as those that can observe specific changes in places that are not accessible to humans, e.g., due to depth or height. Change monitoring systems are not only used on rivers, but also on volcanoes (Budi-Santoso et al., 2023). The authors of the paper noticed changes in monitoring systems that moved from visual to automatic analyses using various sensors. The next stage of changes was the transition from offline to online mode, which allowed for real-time data analysis. Despite the great progress, modern monitoring systems have many disadvantages or problems that should be minimized through newer modifications or solutions (Sreedevi et al., 2023). Pointed out that the integration of different techniques is important because it allows for a wide range of analysis as well as the use of distributed systems and models. It can be also seen in other Internet of Thing’s solutions, where machine learning, especially neural networks, were applied (Połap and Srivastava, 2021). Such solution is also applied in the analysis of the state of lakes. It allows for the prediction of changes based on changes already made. (Yin et al., 2023). The solution is based on training a segmentation network with LSTM layers of data spanning several years (Nie et al., 2023). The architecture model allowed for high accuracy due to large amounts of training data. The prediction of changes in the lake boundaries is an interesting solution that may indicate future environmental changes. Another interesting issue is the construction of models based on LiDAR laser data (Włodarczyk-Sielicka et al., 2023; Zhou et al., 2023), which enable the generation of a points cloud that allows obtaining the location of the analyzed objects in space. From the point of view of practical applications, this solution allows for obtaining larger amounts of data and, above all, much more precise data.
The issue of supervision and analysis of water resources is crucial due to the increasing urbanization of areas. A discussion on today’s remote sensing and geostatic solutions was carried out (Liu et al., 2023). The authors point to an increasing trend of such research, which may bring interesting results. Especially in the case of implementing such technological solutions in practice, which may contribute to increasing the quality of water resources monitoring. An important tool that is used is primarily deep learning due to the accuracy of the analyses. As indicated, machine learning algorithms are used in many applications, an example of which is primarily the Internet of Things (which also includes, among others, drones), where objects have sensors through which data is collected and analyzed. Artificial neural networks reached a huge milestone when convolutional networks were modeled, which are still used or modified and adapted to the assumed goals to this day. An example of the use of convolutional neural networks is the rapid analysis of two-dimensional images (Li et al., 2023). In the cited research paper, the authors show that convolutional networks can process the image and automatically detect its features. The first work focused on modeling a framework for recognizing driver fatigue while driving. In the second paper, neural networks were used to analyze seismic anomalies based on data recorded in graphical form. Of course, the use of neural networks involves the need for a huge database to achieve a high accuracy rate. However, recent years have shown that the concept of learning transfer is crucial in order to minimize the amount of time needed for training. Learning transfer enables the use of an already trained network or only its fragments for another database. This makes the adaptation of already trained models much less time-consuming and does not require such a large database. Examples of such models are Inception (Szegedy et al., 2015), or VGG16 (Simonyan and Zisserman, 2014). Moreover, learning transfer enables the use of trained network fragments in various other network concepts. An example is segmentation, which is based on the construction of two networks named as U-Net, where the first one is called encoder and the second decoder. The purpose of the encoder is to extract features of the image, which are then used by the decoder to generate a segmented image. Such neural networks are of great use as described by (Raza et al., 2023). The authors used u-net to segment multiple MRI images to detect a brain tumor. The input to the network was an image made by the CT scanner, and the result was a processed image with a marked tumor, if any (Candan and Kalkan, 2023). modeled a network that analyzes an image created on the basis of a point cloud created with LiDAR, which in effect allowed road segmentation. This solution makes it possible to detect roads or even obstacles (SaiNikhil, 2023). The presented examples of the latest achievements focus mainly on single elements such as classification or segmentation, but in the end it can be used in a larger information technology system (Połap, 2023).
The proposed system is based on a framework for quick measurement analysis of the water level in the analyzed rivers. This is an important problem from the point of view of the speed of informing about changes. Even the smallest changes are important and allow you to react quickly to prevent further consequences. For this purpose, we propose the use of a drone to obtain measurement data that can be performed regularly depending on the weather. Of course, attention should be paid to the data obtained and their form for further processing. Figure 1 show the location of the drone relative to the area recorded by the camera. During the recording, the exact location of the drone and its altitude are obtained. In addition, its displacement is possible by taking into account the flight path. As a consequence, the recorded image is saved together with the location of the drone and its altitude. We assume that the recorded video image shows the surface under the camera, so the lens is directed parallel to the surface under it. The video image is divided into frames with a certain time interval between them. This is due to the number of frames that are generated per second of video, which is 24. The classic solution to skipping certain frames is to select the first frame every one or 2 seconds. Hence, 60 or 30 frames are saved for 60 s of the drone’s flight. In addition, each image is georeferenced to get the correct location of each pixel. For this purpose, we use the height of the drone H (whose gimbal is pointing down) and its GPS position (which points to the center point of the image acquired by the gimbal). For each drone model with a camera, we get a field of view marked as α, which allows us to determine the real distance (d) between points representing opposite vertices (see Figure 1) as:
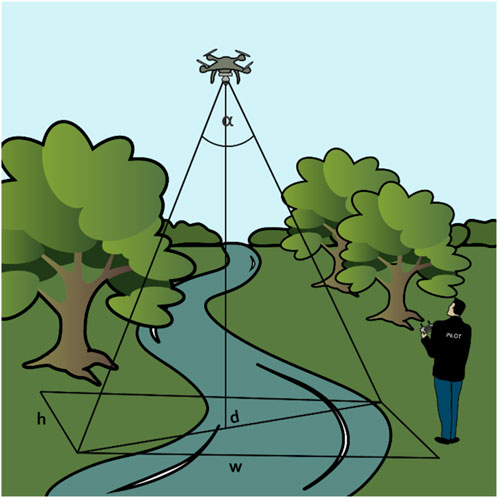
FIGURE 1. Visualization of the use of the drone when taking river recordings by the camera that is positioned towards the ground. The drawing also overlays the data used to perform georeferencing, such as: width w and height h of the image, the height of the drone H and the field of view as the α angle.
Offset can be calculated according to:
where w, h are, respectively, the width and height of the image recorded by the camera. Using these values, we determine the location of two points on the edges of the image by determining their values with the help of the real value using a rhumb line. Each of the remaining image points is determined with the values calculated according to the above formulas, but each time determining the distance and angle relative to the center of the image, i.e., the projection of the gimbal point.
In the next step, each frame is processed by a trained U-Net. Learning transfer was used to create a dedicated solution. The VGG16 model was used, which allowed to create part of the encoder. VGG16 is a pretrained Convolutional Neural Network (CNN) model, consisting of 16 convolutional layers and max-pooling layers in between (presented visually in Figure 2). The model was trained on a ImageNet subset, consisting of over a dozen million samples of 22,000 different classes. CNNs are based on how the human eye perceives the world around. Rather than paying attention to every single pixel, we can extract the information from what is called a perception field. These perception fields are created by convolutional layers. Each convolutional layer has a set of channels, each one assigned its own weight matrix. With this matrix, feature maps are obtained by processing an input image through each individual channel. Max-pooling layers help to reduce the amount of input data even further, shrinking obtained feature maps by passing further only the strongest signals (in case of VGG16, the strongest signal among 3 × 3 matrices). The output of each convolutional layer can be described by Eq. 3, where
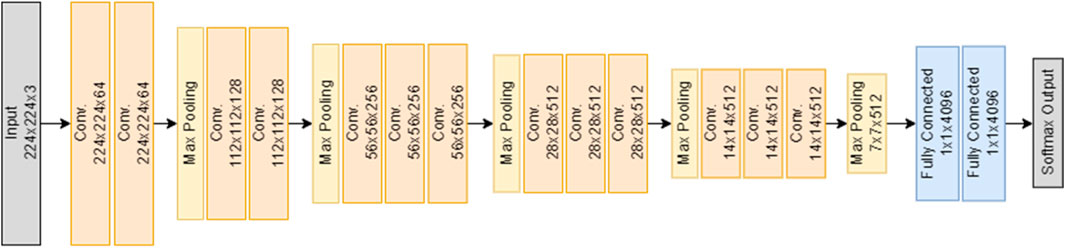
FIGURE 2. VGG16 network architecture. Each convolutional layer has 3 × 3 kernel and each max pooling layer has 2 × 2.
Having described VGG16, the pretrained model provides a set of weights able to extract useful and abstract features from an image. A network model was selected to reduce the number of learning parameters due to its use in mobile/server applications. The architecture of such a network is shown in Figure 3. The name U-Net is derived from the shape in which the network is most often presented. It can be divided into two segments, encoding and decoding. Both are connected via concatenation paths, which provide information about feature maps from the encoder’s convolutional layers to the decoder’s up sampling convolutional layer. This process greatly reduces the time required for such encoding/decoding structures to converge and which makes the U-Net architecture so successful, especially with the use of learning transfer. At this stage of data processing, it should be noted that the frame is much larger than the network input. In order to properly process the image, the frame is resized. The neural network returns a segmented image of the river, which allows you to quickly locate the water as well as the shore. However, the image size is smaller than the image frame, so the segmentation result is extended to the full image, allowing it to be resized to its original size. Of course, doing so results in a loss of edge accuracy. Note that achieving very accurate segmentation with U-net (even for the original frame size) is possible, but requires a huge amount of training data. In addition, training on large amounts of data means that the training process will require a lot of computing power. Assuming that the framework should ultimately work as a mobile application with a server access, the amount of required computing power is minimized (for instance due to internet transfer).
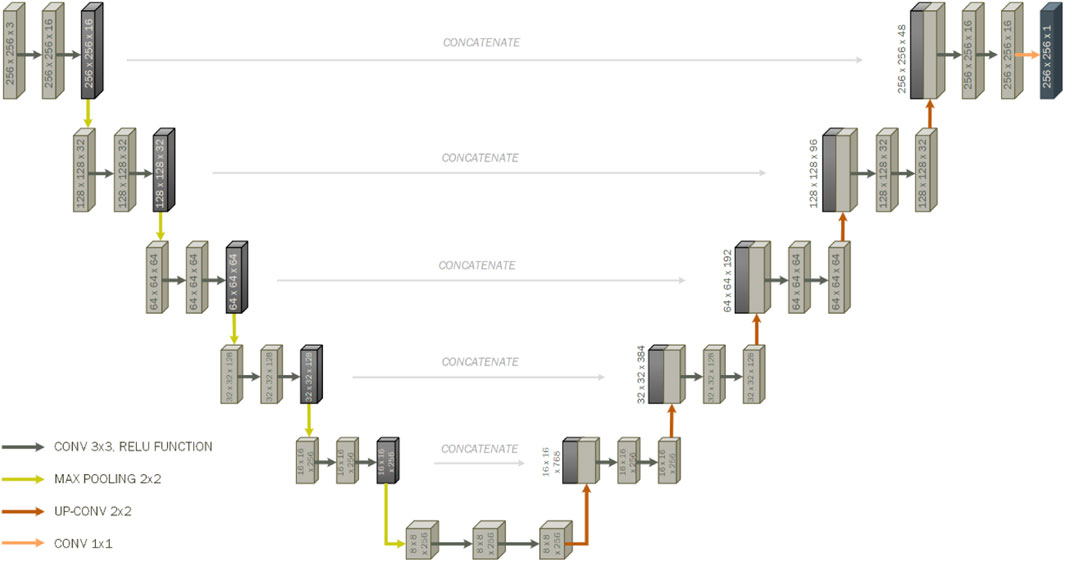
FIGURE 3. Used U-NET architecture for river segmentation. The model was based on VGG16 learning transfer.
Obtaining the location of the river on the frame using the segmentation performed by the network allows its localization. Then the edge is analyzed to detect the boundaries as accurately as possible. This is accomplished through the use of Sobel-Feldman edge detection algorithm (Lubna et al., 2016), that allows to mark the appropriate pixels. Such an image is combined with the result of segmentation, which allows attention to be drawn to which edges should be taken into account. This is done by matching the segmented area of the river on image with edges. If there are some pixels under the segmented area, then these will be analyzed. Point analysis is based on the idea of clustering against two classes: the river or the rest of the area. It’s worth noting that we only focus on the black pixels (representing the edges) within the river segmentation area. Hence, if a given pixel has enough neighbors in a small area, it will point to an area that is not a river. For this purpose, a single black pixel is distanced from the other ones. Pixels whose distance is less than θ relative to the analyzed one is counted. If the number of pixels is greater than γ% of the analyzed area, then a given pixel together with all its neighbors defines an area that is not a river. At the end of processing all pixels, if any of them is not covered by the area defined by the neighborhood of any point, it is automatically changed to the background color. Visualization of this operation is presented in Figure 4. Segmentation areas processed in this way enable a much more accurate segmentation of the river. Given that each frame is previously georeferenced, we automatically have coordinates that cover the river area. The georeferenced image, mask, measurement date and flight parameters are saved in the database.
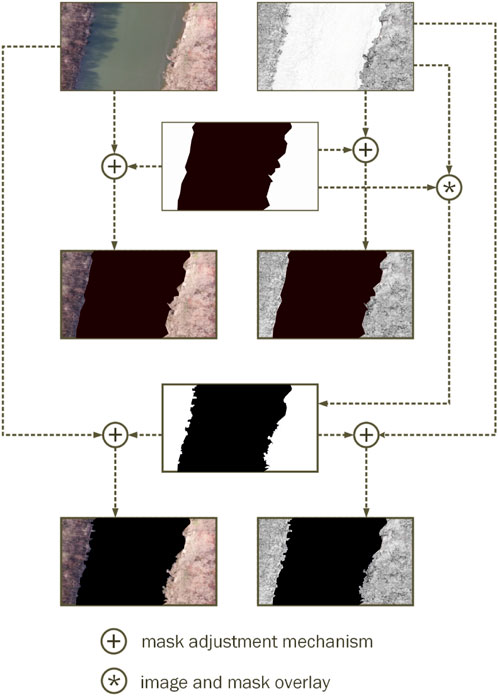
FIGURE 4. Formed pipeline of the LFI area, the average water depth at the outer seaward LFI edge, the average distance from the coast to the outer seaward LFI edge.
Using the location, it is possible to compare the state of the river with archival data. If there are records in the database about previous flights of the drone in this area, then the information from the database and the appropriate frames assigned to these coordinates are downloaded. If there is more than one record associated with this location, the last one is ultimately returned for change comparison. However, the possibility of selecting other archival data allows for the analysis of the state of the river over a longer period of time, so such a possibility also exists. The comparison is done by analyzing two segmentation masks in exactly the same areas. Of course, in practice this comparison can be made by comparing the coordinate values of the river (in order to minimize the number of calculations). If any area has been reduced, it will mean that the water in the river has decreased. Otherwise, the water has increased and attention should be paid to the potential flooding of the river into neighboring areas. Alerting can be done by visualizing the overlapping of areas and marking where changes are suspected. A general framework is shown as pseudocode for re-implementation purposes in Figure 5.
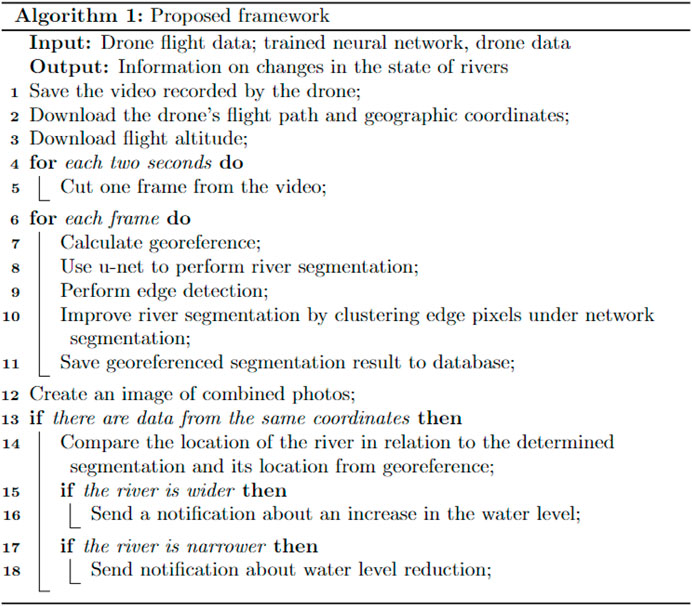
FIGURE 5. Algorithm with detailed step by step of the proposed framework.
Test basic measurements were made over the Oder river in southern Poland (17 March 2023), where the DJI Mavic 2 Pro drone (field of view is equal to 60°, the height of the drone above the surface was always 90 m) was used to perform the measurement operation. The drone moved along both banks, recording the area with the camera facing vertically downwards. As a result, 12 short measurements were made (average recording time was 20 s with frame size set to 1920 × 1,080 pixels). An example area combination from the obtained drone frames is shown in Figure 6 (the connection was made using the SIFT algorithm). The implementation of the solution was based on Python 3.9.7 with the OpenCV and TensorFlow libraries on a dedicated server with an Intel Core i9-10850 K 3.60 GHz processor, 32 GB RAM and an NVIDIA GeForce RTX 3060 12 GB graphics card along with the construction of a simple mobile application in JAVA for visualization of data processed on the server.

FIGURE 6. An example of a measurement sample made using a drone.
The first stage of the research was the analysis of the number of samples needed to obtain correct results. This was done by using the process of creating a merged measurement image, which can be seen, among others, in Figure 6. For this purpose, images were merged using frames spaced 1, 2, 3, and 4 s apart. The amount of connected area was verified using the SIFT algorithm, which was evaluated against the largest amount of space coverage. This was possible by using georeferencing and checking the difference on the y-axis, which was set relative to the shore. This process can be called evaluating the number of connected frames representing the river’s bank. The coverage results are shown in Figure 7.
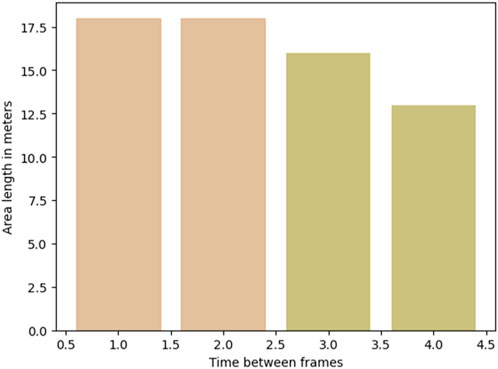
FIGURE 7. An example of a measurement sample made using a drone.
Then, a segmentation database was made manually for all frames, i.e., for 4,300 frames, manual segmentation was performed in order to obtain a mask. Pairs of images, i.e., (frame, mask) were used to train the U-Net neural classifier with VGG16 coders. Before the training was performed, the database was divided in the proportion of 70:30, i.e., there were 3,010 samples in the training set and 1,290 in the test one. The training process was carried out by using the ADAM algorithm for 30 epochs. ADAM is a state-of-the-art, momentum-based optimizer, widely used mainly thanks to its adaptive learning rate. It is commonly applied in many kinds of problems, swiftly converging towards the optimal solution. During training, it was assumed that in the event of overfitting or no changes in the values of evaluation metrics, the training process would be automatically interrupted—however, as the performance kept on growing, it was not interrupted. Dice coefficient, precision, and recall were selected as evaluation metrics. Dice coefficients can be presented as twice the cardinality of the union of two sets divided by the sum of the cardinalities of these sets (See Eq. 4). The Dice coefficient was also chosen as the loss function (in the form presented in Eq. 5). Plotted charts of changes in the values of these coefficients during each epoch are presented in Figure 8.
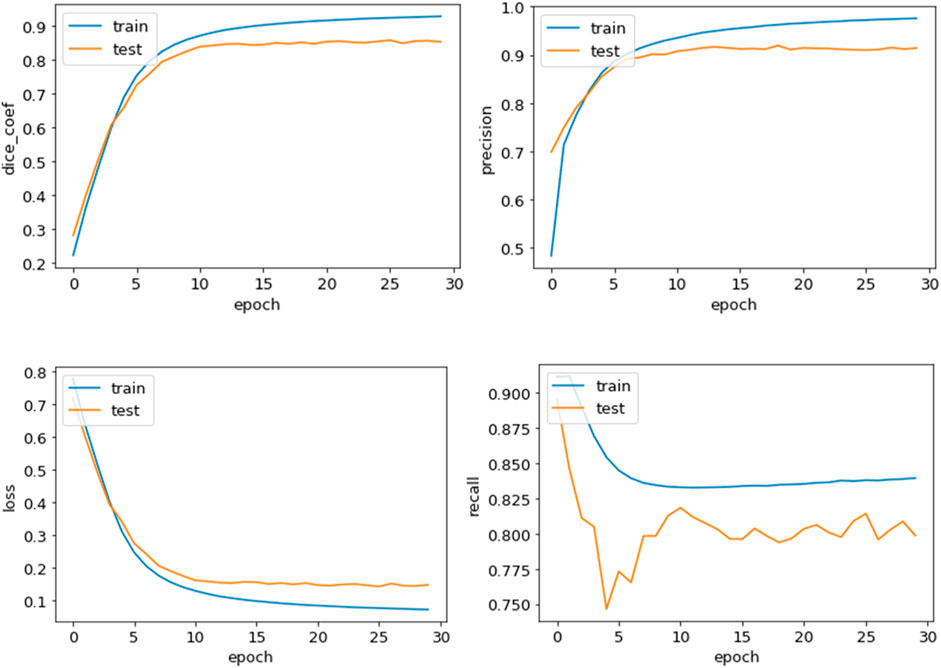
FIGURE 8. Algorithm with detailed step by step of the proposed framework.
Subsequent tests were based on the analysis of γ and θ coefficients. The tests were carried out for the γ parameters equal to 0.2, 0.3, and 0.4, and θ as 10, 15, 20, 25, and 30. The gamma parameter meant the value of accepting the analyzed area as not water, i.e., most likely the shore or flora on the shore. Each pixel in the processed image was evaluated by detecting the edges under the segmentation mask from the U-Net network. It was made by checking the number of neighbors (other edges) in the neighborhood defined by the θ radius. The distance was measured by the Euclidean metric. For each set of parameters, it was checked how many pixels in relation to the original image were correctly classified. The results of the γ and θ parameters can be found at Figure 9.
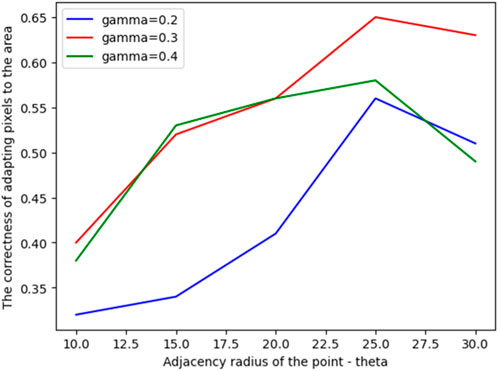
FIGURE 9. Measured dependence of individual parameters during the segmentation mask improvement.
In order to validate the solution and the ability to detect differences, an additional drone flight was made over the same area on 28 March 2023 using the same drone parameters. Using frame extraction every 2 s, γ = 0.3 and θ = 25. Based on mask position changes, the proposal results in information about small changes in the river’s banks. Comparative results based on the created masks from the application are shown in Figure 10.

FIGURE 10. Measured dependence of individual parameters during the segmentation mask improvement.
As part of the validation of the solution, measurement tests were carried out on the river, where the drone automatically recorded data, which, after being sent to the server, was processed and placed in the database. During data processing, deep neural networks as well as image processing methods were used. As part of the research on the verification of the proposed approach, each element of the system was tested to determine the quality of operation and the potential of such an approach to build systems for automatic analysis of data taken from the drone. This is especially important when the river flows around built-up areas, which can allow the application to continuously monitor the state of the river.
The first experiments focused on adjusting the number of extracted frames from the video recording. Four different variants were analyzed, which was the extraction of single frames relative to a specific time interval: 1, 2, 3 or 4 s. Due to the lack of specific metrics analysis for such a selection, the SIFT algorithm was used, which allows for the detection of key points in individual images and then their connection. We assumed that if it is possible to combine the frames into one area based on a set of frames from the video, then this will be a sufficient time interval that will allow the preservation of frames representing the entire measurement area. Hence, the analysis results focused on the connection and measurement of the edge width on the sample. Based on the obtained results (see Figure 7), it was noticed that with long time intervals the obtained results cover a much smaller area. This is because there are no common points between the two consecutive frames, which is a consequence of the small number of frames. In the case of extracting a frame every one or 2 seconds, the end result is the same, i.e., the entire test area is obtained. However, it should be noted that despite the final result, choosing one second as the interval between frames causes twice as many frames to be analyzed, so the number of calculations increases accordingly. In the case of long drone recordings, this will be of great importance, as it will prevent real-time results.
Having selected the time between frames, which will be further used for saving it, the focus was shifted onto the neural network intended for segmentation. The first step was to manually create a database that required masks, i.e., segmented images to be returned by the network. This was necessary because the network was trained with a learning-with-teacher algorithm. The results of training for 30 epochs allowed to draw attention to the possibility of achieving high coefficients. A high Dice coefficient has been achieved, which allows you to evaluate the coverage of the original image with the returned one. It amounted to 0.8524. Accordingly, the value of the loss amounted to 0.1476. Based on the plotted curves (Figure 8), it can be seen that the loss on the training set decreased with each iteration, although for the test set, it remained at the level of over 80% with a slight fluctuation. To obtain better results, the database would have to be significantly expanded. In addition, other metrics such as precision and recall also achieved high values. However, as can be seen in Figure 8, as precision kept growing, recall was falling. This trade-off indicates that the model became more aggressive towards classifying pixels near the edges, preferring to mark pixels as a river when uncertain. Furthermore, with recall we observe major fluctuations during the test set, which is not seen in any other metric. This tells us what kind of samples the model has problems with and what might be the weak point of the model. That is the reason why it was important to monitor the model’s performance with several metrics, rather than a single one. The achieved accuracy does not return ideal segmentation results, but further processing allows it to be improved. On the other hand, the learning transfer used contributed significantly to such high scores considering the small database. In subsequent experiments, attention was paid to the mechanism of improving the segmentation mask, which has two parameters γ and θ (see Figure 9). In the case of the θ parameter, it meant the length of the analyzed neighborhood for a particular pixel. For distance analysis, the classical Euclidean metric was used, which, given a parameter, analyzed neighboring pixels in a circle where a given point was in the center. The best results for various parameters γ were obtained using θ = 25 pixels. In the case of the γ parameter, the result with this θ = 25 pixels were also the highest one. However, the values of the coverage parameter showed the best value for the database had been used much earlier, achieving best results at θ = 20, γ = 0.3, and then the curve increased significantly with increasing distance. The analysis of these results also indicates that the coverage equal to 65% of the analyzed set is the upper limit of the number of points correctly assigned. If the coverage threshold had been reached, the entire area around the point would have been considered to be a shore or flora. Hence, if a border point is analyzed, a large part of the river can be removed from the segmentation mask. The parameters selected this way made it possible to test the proposed solution by making an additional drone flight over the same area. When the same location was detected, coverage results that were different were returned. A fragment of this difference is marked in Figure 10. With such a small change relative to the edge, the proposed system returns information that something has changed and the segmentation mask has moved slightly. In this case, the bushes on the shore have grown. However, there is potential in analyzing rivers with this approach.
The proposed solution was aimed at analyzing rivers and the possibility of using such a solution in monitoring or even warning systems. In addition, the user who performs the measurements receives access to the results in real time (provided that the network is already trained), hence the architecture of the end-to-end system is very beneficial. The automation of tasks and the inability to manipulate data makes such a solution practical and safe. Unfortunately, this is not a perfect solution, which can be seen by the failure to achieve higher metric values. This is due to the small amount of data used during the analysis. To minimize the impact of samples, learning transfer was applied, and more precisely, VGG16 as an encoder in the proposed network architecture. The proposed system is based on an end-to-end architecture, where the user receives final information without the need to interfere with the operation or data processing. This solution allows for very high automation of the methodology. Using neural networks, the training process depends on the amount of data used in this process. However, the proposed methodology of combining neural networks and graphical filters makes it possible to expand the training dataset with new samples. Graphic filters have much less impact on performance when the network achieves good segmentation results, In comparison with other models, it should be noted that most often methods are dedicated to specific databases or single areas. Therefore, it is difficult to compare these methods in terms of accuracy. However, the literature analysis in the first two sections highlights the latest developments in this field. (Yin et al., 2023). proposed a U-Net-LSTM prediction model using a large amount of data of the same area over years. They used LSTM layers in the modeled system. Again, in another work (Yin et al., 2023) showed the possibility of implementing STN into the U-NET network. Another approach was also based on the use of data recorded in the form of a point cloud (Tur et al., 2020). Current research is aimed at different approaches to analyzing the boundaries of rivers, coasts and even lakes. Compared to other solutions, the proposed system enables the use of end-to-end architecture as well as the use of methodology at the initial stage of system operation. This is equivalent to the possibility of analysis with a small amount of data in the database, which will not guarantee good evaluation metrics of neural networks. It should also be noted that such a solution can be attached to a larger system for analyzing water reservoirs by combining the results of two different objects (Włodarczyk-Sielicka et al., 2023).
Automatic data processing systems for drones enable rapid data analysis in real time. In particular, the use of the end-to-end model is an interesting solution due to the lack of need for user intervention in data processing and analysis. User, among others the drone operator records data in an area consisting of a river, which is then automatically processed on the server (although it is possible to transfer all operations to a smartphone, without a database). For this purpose, we have proposed a method based on the use of deep learning, more specifically the U-Net network with learning transfer. Moreover, the operation of the network was combined with classical image processing methods, which contributed to the improvement of the obtained segmentation results. From the point of practical use, the methodology allows obtaining good results even with low accuracy of the neural network, due to the implementation of automatic processing with image filters. As the accuracy of the neural network increases, image filters will have less impact on results’ accuracy. The created masks can be used in the further process of network training, which significantly affects the automation of the system. The resulting segmentation mask allows to perform comparative analysis with archived data and pay attention to changes in the state of the river or banks. High model accuracy was achieved, which shows that the proposed architecture and data processing method are viable methods of monitoring rivers. However, some disadvantages were also found, such as the small database used to train the classifier. However, the use of VGG16 learning transfer allowed to reduce the impact of a small amount of data at the initial stage of operation of the proposed method.
In future work, we plan to investigate the possibility of increasing the amount of data, taking into account automatic supervision of their generation. There is also the issue that data may be private and owners may not be willing to share it. Hence, the use of federated learning will be the next step in developing this system. Federated learning can reduce the computational requirements for the user because it will be distributed among all users of the system. At the same time, we plan to focus on improving the system as a whole by developing its functionality.
The raw data supporting the conclusion of this article will be made available by the authors, without undue reservation.
KPr: Conceptualization, Data curation, Investigation, Methodology, Software, Supervision, Visualization, Writing–original draft. KPo: Data curation, Investigation, Software, Writing–original draft. MW-S: Formal Analysis, Investigation, Supervision, Validation, Writing–review and editing. AJ: Data curation, Investigation, Software, Writing–original draft.
The author(s) declare financial support was received for the research, authorship, and/or publication of this article. This work was supported by the National Centre for Research and Development (NCBR) of Poland under grant no. LIDER/4/0026/L-12/20/NCBR/2021.
Authors KPo and AJ were employed by Marine Technology Ltd.
The remaining authors declare that the research was conducted in the absence of any commercial or financial relationships that could be construed as a potential conflict of interest.
All claims expressed in this article are solely those of the authors and do not necessarily represent those of their affiliated organizations, or those of the publisher, the editors and the reviewers. Any product that may be evaluated in this article, or claim that may be made by its manufacturer, is not guaranteed or endorsed by the publisher.
Budi-Santoso, A., Beauducel, F., Nandaka, I. G. M. A., Humaida, H., Costa, F., Widiwijayanti, C., et al. (2023). “The Merapi volcano monitoring system,” in Merapi Volcano: geology, eruptive activity, and monitoring of a high-risk volcano (Cham: Springer International Publishing), 409–436. doi:10.1007/978-3-031-15040-1_13
Candan, A. T., and Kalkan, H. (2023). „U-Net-based RGB and LiDAR image fusion for road segmentation. Signal, Image Video Process. (SIViP) 17, 2837–2843. doi:10.1007/s11760-023-02502-5
Diaconu, D. C., Koutalakis, P. D., Gkiatas, G. T., Dascalu, G. V., and Zaimes, G. N. (2023). River sand and gravel mining monitoring using remote sensing and UAVs. Sustainability 15 (No. 3), 1944. doi:10.3390/su15031944
Jiang, J., Men, Y., Pang, T., Tang, S., Hou, Z., Luo, M., et al. (2023). An integrated supervision framework to safeguard the urban river water quality supported by ICT and models. J. Environ. Manag. 331, 117245. doi:10.1016/j.jenvman.2023.117245
Kumar, M., Singh, T., Maurya, M. K., Shivhare, A., Raut, A., and Singh, P. K. (2023). Quality assessment and monitoring of river water using IoT infrastructure. IEEE Internet Things J. 10, 10280–10290. doi:10.1109/JIOT.2023.3238123
Kumarapu, K., Mesapam, S., Keesara, V. R., Shukla, A. K., Manapragada, N. V. S. K., and Javed, B. (2022). RCC Structural deformation and damage quantification using unmanned aerial vehicle image correlation technique. Appl. Sci. 12 (13), 6574. doi:10.3390/app12136574
Li, R., Gao, R., and Suganthan, P. N. (2023). A decomposition-based hybrid ensemble CNN framework for driver fatigue recognition. Inf. Sci. 624, 833–848. doi:10.1016/j.ins.2022.12.088
Liu, Z., Xu, J., Liu, M., Yin, Z., Liu, X., Yin, L., et al. (2023). Remote sensing and geostatistics in urban water-resource monitoring: a review. Mar. Freshw. Res. 74, 747–765. doi:10.1071/MF22167
Lubna, , Khan, M. F., and Mufti, N. (2016). “Comparison of various edge detection filters for ANPR,” in 2016 Sixth International Conference on Innovative Computing Technology (INTECH), Dublin, Ireland, 306–309. doi:10.1109/INTECH.2016.7845061
Marcheva, Z., Kotsev, T., Tchorbadjieff, A., and Stoyanova, V. (2023). Modeling of arsenic dynamics in groundwater of а river floodplain contaminated with mine tailings: ogosta River case, NW Bulgaria. J. Bulg. Geogr. Soc. 48, 3–14. doi:10.3897/jbgs.e99206
Nie, T., Wang, S., Wang, Y., Tong, X., and Sun, F. (2023). An effective recognition of moving target seismic anomaly for security region based on deep bidirectional LSTM combined CNN. Multimedia Tools Appl., 1–14. doi:10.1007/s11042-023-14382-5
Połap, D. (2023). Hybrid image analysis model for hashtag recommendation through the use of deep learning methods. Expert Syst. Appl. 229, 120566. doi:10.1016/j.eswa.2023.120566
Połap, D., and Srivastava, G. (2021). Neural image reconstruction using a heuristic validation mechanism. Neural Comput. Appl. 33, 10787–10797. doi:10.1007/s00521-020-05046-8
Raza, R., Bajwa, U. I., Mehmood, Y., Anwar, M. W., and Jamal, M. H. (2023). dResU-Net: 3D deep residual U-Net based brain tumor segmentation from multimodal MRI. Biomed. Signal Process. Control 79, 103861. doi:10.1016/j.bspc.2022.103861
Rusdi, M., Lestari, M. W., and Hulu, F. N. (2023). River flood early warning system based on internet of Things in Binjai city. Int. J. Res. Vocat. Stud. (IJRVOCAS) 2 (No. 4), 42–47. doi:10.53893/ijrvocas.v2i4.161
SaiNikhil, R., Rao, S. G., and Rao, P. V. P. (2023). “Identification of road and surrounding obstacles using U-net architecture for better perception,” in 2023 5th International Conference on Smart Systems and Inventive Technology (ICSSIT). IEEE, Tirunelveli, India, 23-25 January 2023, 1425–1429. doi:10.1109/ICSSIT55814.2023.10060912
Seo, J., Rho, P., and Bae, H. K. (2023). Estimations for water quality factors of kumho river, South Korea, using remote sensing technology. Environ. Eng. Res. 28 (No. 5), 220368–220370. doi:10.4491/eer.2022.368
Simonyan, K., and Zisserman, A. (2014). Very deep convolutional networks for large-scale image recognition. arXiv preprint arXiv:1409.1556. doi:10.48550/arXiv.1409.1556
Singh, C. H., Mishra, V., Jain, K., and Shukla, A. K. (2022). FRCNN-based reinforcement learning for real-time vehicle detection, tracking and geolocation from UAS. Drones 6 (12), 406. doi:10.3390/drones6120406
Sreedevi, S., Sinha, R. K., and Eldho, T. I. (2023). “Integration of geospatial techniques in environment monitoring systems,” in Modeling and simulation of environmental systems (Florida, United States: CRC Press), 221–238. doi:10.1201/9781003203445
Szegedy, C., Liu, W., Jia, Y., Sermanet, P., Reed, S., Anguelov, D., et al. (2015). “Going deeper with convolutions,” in Proceedings of the IEEE conference on computer vision and pattern recognition, Boston, MA, USA, June 7 2015 to June 12 2015, 1–9. doi:10.48550/arXiv.1409.4842
Tur, R., Uzunsakal, L., and Mehr, A. D. (2020). “Coastline change determination using UAV technology: a case study along the Konyaaltı coast, Antalya, Turkey,” in Drones in smart-cities (Berlin, Germany: Elsevier), 123–141. doi:10.1016/B978-0-12-819972-5.00008-2
Włodarczyk-Sielicka, M., Połap, D., Prokop, K., Połap, K., and Stateczny, A. (2023). Spatial visualization based on geodata fusion using an autonomous unmanned vessel. Remote Sens. 15 (7), 1763. doi:10.3390/rs15071763
Yin, L., Wang, L., Li, T., Lu, S., Tian, J., Yin, Z., et al. (2023). U-Net-LSTM: time series-enhanced lake boundary prediction model. Land 12 (10), 1859. doi:10.3390/land12101859
Yin, L., Wang, L., Li, T., Lu, S., Yin, Z., Liu, X., et al. (2023). U-Net-STN: a novel end-to-end lake boundary prediction model. Land 12 (8), 1602. doi:10.3390/land12081602
Keywords: river monitoring, remote sensing, image processing, drones, VGG16, end-to-end system
Citation: Prokop K, Połap K, Włodarczyk-Sielicka M and Jaszcz A (2023) End-to-end system for monitoring the state of rivers using a drone. Front. Environ. Sci. 11:1303067. doi: 10.3389/fenvs.2023.1303067
Received: 27 September 2023; Accepted: 01 November 2023;
Published: 13 November 2023.
Edited by:
Dominika Dąbrowska, University of Silesia in Katowice, PolandReviewed by:
Ali Danandeh Mehr, Antalya Bilim University, TürkiyeCopyright © 2023 Prokop, Połap, Włodarczyk-Sielicka and Jaszcz. This is an open-access article distributed under the terms of the Creative Commons Attribution License (CC BY). The use, distribution or reproduction in other forums is permitted, provided the original author(s) and the copyright owner(s) are credited and that the original publication in this journal is cited, in accordance with accepted academic practice. No use, distribution or reproduction is permitted which does not comply with these terms.
*Correspondence: Marta Włodarczyk-Sielicka, bS53bG9kYXJjenlrQHBtLnN6Y3plY2luLnBs
Disclaimer: All claims expressed in this article are solely those of the authors and do not necessarily represent those of their affiliated organizations, or those of the publisher, the editors and the reviewers. Any product that may be evaluated in this article or claim that may be made by its manufacturer is not guaranteed or endorsed by the publisher.
Research integrity at Frontiers
Learn more about the work of our research integrity team to safeguard the quality of each article we publish.