 Chenchen Li
 Jianwei Wu*
- Academy of Forestry Inventory and Planning, National Forestry and Grassland Administration, Beijing, China
Achieving the goal of water resource allocation improvement is significant for the ecological conservation of basins. Considering the water supply and demand contradiction and the competition among stakeholders within water-deficient regions, we developed a multi-objective optimization model and proposed the most effective method for allocating water resources based on the study of supply and demand. This study reveals the following findings: 1) the total demand for the Fen River Basin in 2030 will be 6.68 billion m3. Compared with previous years, the actual consumption has increased, but the growth rate has slowed down. 2) The basin’s total supply of water in 2030 will be 7.855 billion m3. With the tightening of the management practice, the consumption and supply in each county showed a decreasing trend year by year. 3) The results of optimal water allocation for 2030 indicate that the FRB should allocate 1.655 billion m3 for domestic water, 4.57 billion m3 for production consumption, and 57 million m3 for ecological use.
1 Introduction
Optimizing water resource allocation has emerged as a pivotal means of achieving ecological conservation of basins. The Yellow River has played a key role in the development of China’s economy in recent decades (Chen and Hobbs, 2020; Omer et al., 2021). For millennia, the waters of the Yellow River have sustained generations of Chinese communities, serving as a vital source for urban development and industrial growth (Yan et al., 2020). Although the Yellow River accounts for only approximately 2% of the runoff, it supports the living of 9% of the China’s population and contains 15% of arable land (Xiang et al., 2017). However, as the Yellow River Basin (YRB) undergoes significant social development and economic growth alongside population growth, the disparity between water supply and consumption becomes increasingly pronounced. This challenge is compounded by inefficient management, limited technological advancements, and disparities in the spatio-temporal distributions (Li et al., 2017; Yang et al., 2021; Zhao et al., 2021). Water resource management is now confronted with new imperatives under the policy of ecology first (Zhang et al., 2020a; Liu and Zhang, 2022). This entails the dual challenge of reserving sufficient ecological water to meet the needs of ecosystem protection in the YRB and ensuring water resource availability for industrial development.
In the past decade, various regions within the YRB have grappled with moderate to severe water shortages, driven by factors such as population growth, agricultural demands, climate variability, and limited water availability. Agriculture, being the predominant industry in the YRB, consumes over half of the region’s total water intake due to extensive irrigated lands (Shao et al., 2017; Di et al., 2019). An intriguing phenomenon in the YRB involves the diversion of groundwater from agriculture to urban and industrial sectors in pursuit of greater economic efficiency, with reclaimed water being allocated to agriculture, benefiting the environment (Bai et al., 2017; Yin et al., 2017). Despite these efforts aimed at rationalizing water resource allocation, they have not kept pace with the increasing water demand. The Fen River Basin (FRB), the second largest subbasin in the YRB, exemplifies the complex interplay between social economy, resource endowment, and ecological conditions (Gao et al., 2020; Chai et al., 2021). Despite a dense population, the basin allocates only 26% of its local provincial water resources to support approximately 40% of the population (Zhao et al., 2020; Chen et al., 2021; Liu et al., 2022). Over time, due to inefficient water use and poor management, the FRB has faced challenges such as groundwater over-extraction and low water-use efficiency (Liao and Ming, 2018; Liu et al., 2021). It is significant how to improve water efficiency for realizing sustainable management (Wang et al., 2017; An et al., 2021; Huang et al., 2021).
Numerous research studies have tackled the challenge of optimal water resource allocation using diverse mathematical approaches. For instance, Zhou et al. (2015) established a multi-region water resource optimization model by adopting the two-stage stochastic programming approach. This method was able to produce optimization results in the form of intervals, with the aim of reducing the uncertainty of optimal water allocation in irrigated areas. Zhang et al. (2020b) focused on the China’s Taihu Basin and showed that the risk of localized water deficits can be reduced by using water rights allocation plans that are optimal. Furthermore, research studies such as those conducted by Yan et al. (2018) applied the optimal allocation model improved by the whale optimization algorithm in Handan City and made a comparative analysis with the particle swarm optimization algorithm. While existing efforts contribute to the rational allocation of multiple water sources under specific objectives, there remains a notable gap in research specific to the FRB.
This study’s goal is to determine how to best distribute the region’s physical water resources, with a particular emphasis on the FRB, which has significant variations in water supply and demand. By doing so, this research aims to fill this gap in the study of FRB’s water resource allocation and provide essential policy insights for optimizing water resource allocation in other regions within the YRB.
2 Research area
The FRB is located in Shanxi Province, including 35 counties in the six cities: Taiyuan, Jinzhong, Yuncheng, Xinzhou, Linfen, and Lvliang (Figure 1). It occupies 39,000 km2 or more than 25% of Shanxi Province (Zhang X. et al., 2020; Zhang F. et al., 2021). Because of the continental monsoon climate in this basin, there are significant annual and inter-annual differences in precipitation, and the annual average climate change is obvious (Farnsworth et al., 2019; Zhao et al., 2019; Sun et al., 2021). The FRB is adjacent to the Lvliang Mountains in the west and the Taihang Mountains in the east (Pan et al., 2016; Fan et al., 2020). The total population of the FRB accounts for nearly 50%, and the total GDP of the province accounts for more than 40% (Zhao et al., 2017; Zhang J. et al., 2021). However, extensive utilization and inefficient management aggravate the unreasonable utilization of water resources.
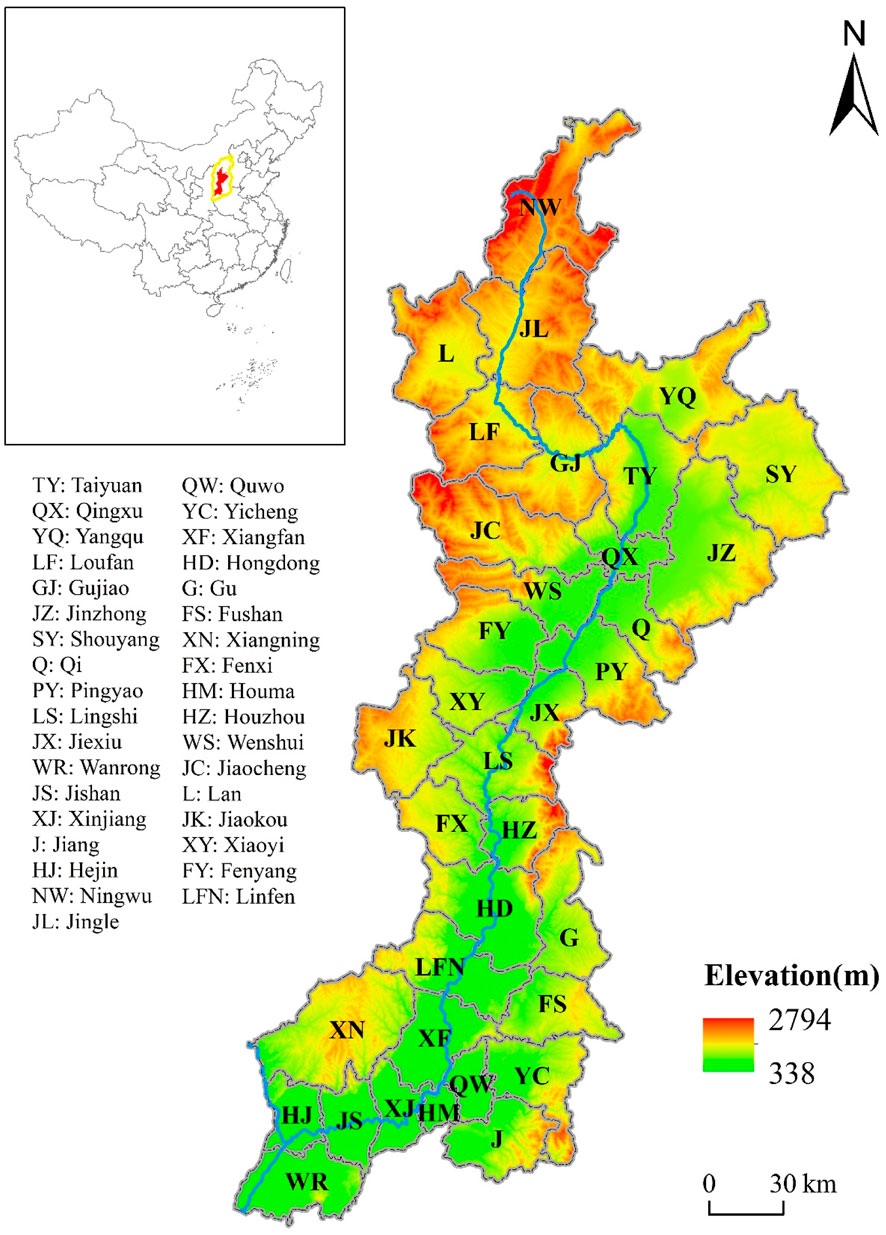
FIGURE 1. Geographic location of the Fen River.
3 Data and methods
3.1 Data source
Data on both water resources and socioeconomic development indicators were gathered for this study. GDP, population, primary industrial production, secondary industrial development, and greenbelt area were all included in socioeconomic development data. Four main indications of industrial production were specifically collected: the amount of grain crops seeded, the number of animals and poultry, the area of orchards, and the area used for aquaculture. As the driving force behind the second industrial development, we exploited the industrial added value. Data on socioeconomic development were taken from the Shanxi Statistical Yearbook, while information on water resources was taken from the Bulletin of Water Resources for individual cities.
3.2 Water demand prediction
The water-use system in the FRB is intricate, encompassing various categories, such as urban and residential water, industrial production water, and ecological water (Figure 2). Different types of water demand require diverse prediction methods. Common approaches for predicting water demand include gray theory and machine learning methods like neural networks, regression analysis, and quota analysis (Al-Zahrani and Abo-Monasar, 2015; Villarín, 2019; Fan et al., 2020; Meng and Wu, 2021). To account for the impact of multiple social indicators on water demand and policy adjustments, this study employs a well-established and precise technique—quota analysis. Specifically, the domestic demand in the FRB comprises urban and rural residents’ domestic demand, production demand (which includes primary and secondary industry production demand but excludes tertiary industry demand contributing to domestic consumption), and ecological use.
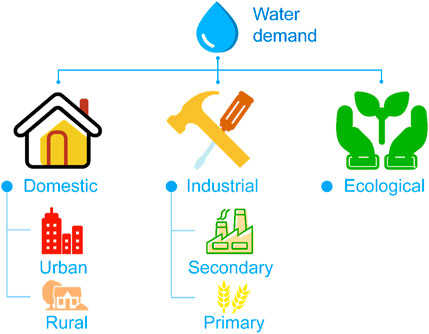
FIGURE 2. Water demand structure in the Fen River Basin.
3.2.1 Domestic demand
The domestic demand in the FRB comprises two components: the domestic demand of urban and rural residents. Within the urban component, the daily water demand includes not only the needs of urban residents but also the public water demand of towns. For forecasting the domestic water demand, the following equation is employed:
where
When using quota analysis to determine residents’ daily water demands, it is crucial to take into account complex situations such as social and economic development, residents’ current water use quota, improvements in residents’ water-saving awareness, advancements in water-saving technology, the impact of policy adjustments, and other aspects in FRB. This paper follows the principles of keeping close to reality, meeting demand, classified quota and social progress, combining with the annual change of domestic consumption in Shanxi, and the actual water use in FRB in 2019. The comprehensive domestic water quota for urban residents (including household daily water demand and public water demand) in FRB in 2030 is 227 L/person · day and that for rural residents is 62 L/person · day.
When predicting the future urban and rural population, this paper adopts the autoregressive distributed lag model which is based on the time series analysis (Rahman and Vu, 2021). Compared with the time series analysis, the lag value of the explained variable is re-added into this model as the explanatory variable, which can improve the accuracy. The general form of the autoregressive distributed lag model is expressed as follows (Bildirici and Ersin, 2018):
where
The autoregressive distributed lag model applied to predict the population is developed based on Eqs 1–3. For year t, the population is
If you do not take into account the annual increase in population, taking the natality and mortality as all explanatory observables, the prediction model can be shown as follows:
To compare the performance of prediction models with different lag periods i, this paper makes logarithmic transformation of the lag period of natality and mortality.
Then, we can test the predictive performance of various lag phases on the basis of EViews 11 and choose the best lag phase to develop the model.
3.2.2 Primary industry
The demand of the primary industry is contingent upon the water production and water consumption characteristics of various agricultural sectors, including farmland, irrigation, livestock and poultry breeding, orchard irrigation, and aquaculture. The calculation of irrigation water demand is derived by multiplying the demand quota by the irrigation area. The quota for irrigation water demand is established based on the findings from relevant government departments and existing research efforts that have undergone extensive scrutiny (Cui et al., 2018; Sordo-Ward et al., 2020). It also considers the effects of technology breakthroughs and water-saving agriculture practices.
The irrigation water requirement of farmland and orchard is estimated using
where
Water demand for livestock and poultry breeding is calculated using Eq. 8:
where
Water demand for aquaculture is calculated using Eq. 9:
where
On the basis of a series of local governmental official documents such as the 15th Five-Year Plan of National Economic and Social Development of Shanxi Province, this paper employs a method combining agricultural water quota and mathematical statistics referring to the requirements of future water-saving targets. Finally, the water demand of primary industry in FRB is determined, which is 2,740 m3/ha for agricultural irrigation, 1,390 m3/ha for orchard irrigation, 19 m3/head · year for livestock breeding, 5.5 m3/head · year for poultry breeding, and 1,520 m3/ha for aquaculture.
3.2.3 Secondary industry
The demand of the secondary industry is predicted by the comprehensive water demand quota of ten thousand yuan of the added value.
where
Referring to the official documents such as the 15th Five-Year Plan of National Economic and Social Development of Shanxi Province, the growth rate of secondary industry in different counties is determined. Furthermore, according to the industrial structure, gross product, and current situation of water use, the water quota for secondary industry in FRB is determined to be 4.8 m3/thousand yuan, considering the improvement of water-use efficiency and water-saving measure in future of the secondary industry.
3.2.4 Ecology
Ecological demand is the water requirement necessary for maintaining the normal functioning and ecological health of an ecosystem within a specific timeframe and a defined region, guided by ecological protection, restoration, or construction objectives (Zhao, 2021). In the context of this study, domestic water demand from the river is not considered in the water optimal allocation. Therefore, the ecological water demand discussed here pertains specifically to the greening water demand of cities located outside the river. Following the existing literature (Jin et al., 2011; Zhang et al., 2020b; Chen et al., 2020), the ecological water demand quota of FRB in 2030 is estimated to be 4,620 m3/ha.
3.3 Optimization model
3.3.1 Objectives
Objective 1: GDP maximization. The value added of all the counties in the FRB is summed to determine the economic benefits, which are represented by the economic objective function. The following equation represents the objective function:
where
Objective 2: Minimization of water deficit. The objective of optimal allocation in FRB is to balance the conflict between supply and demand and to coordinate the contradiction between water users. To realize sustainable utilization, ensure the stable development of social economy and orderly industrial production. Therefore, minimization of water deficit will bring the greatest social benefit. The objective function is as follows:
where D (j, k) denotes the water demand of user
3.3.2 Constraints
Limitations on the supply of water. There is a finite amount of water, and the amount that can be supplied from the many sorts of water sources is limited:
where
Constraints of quantity of water use. The consumption of water users must be greater than or equal to the minimum standard to meet requirement. However, excessive water supply is unnecessary. This constraint is given as follows:
where
Constraints of variables. The variables in the model cannot be negative because of their practical significance:
3.3.3 Pareto optimization
For water allocation within a river basin, the existence of numerous conflicting objectives precludes the attainment of a single all-encompassing solution. Consequently, the imperative arises to explore multiple trade-off solutions among these objectives. These trade-off Pareto optimal solutions, characterized by the inability to enhance one objective without compromising another, collectively constitute the Pareto front. Conventional optimization methods advocate the conversion of multi-objective problems into single-objective problems by prioritizing one particular Pareto optimal solution at a time. In this study, our primary objectives include 1) maximizing and 2) minimizing water deficit. To reconcile these conflicting objectives, we conduct multiple iterations of the simulation and optimization process.
4 Results
4.1 Economic and social development
Based on the data of indexes such as grain-sown area, this study predicted the results of economic and social development, the number of poultry and livestock, he area of orchard, he area of aquaculture, and industrial added value in each county in FRB and referred to anticipation and annual average growth of all indicators in 2030 in the 15th Five-Year Plan of National Economic and Social Development. According to the contribution rate of each county in 2019 to Shanxi, the national economic and social development indicators of each region in FRB in 2030 are determined. The population is predicted by adopting an autoregressive distributed lag model. The prediction results are shown in Table 1.

TABLE 1. Prediction results of national economic and social development.
4.2 Prediction of water demand
Following the equations and methods in Section 3.1–Section 3.3; Section 3.2.1–Section 3.2.4, the various demands for production, living, and ecology in the FRB in 2030 are calculated on the basis of prediction results of various indicators of national economic and social development (Figure 3).
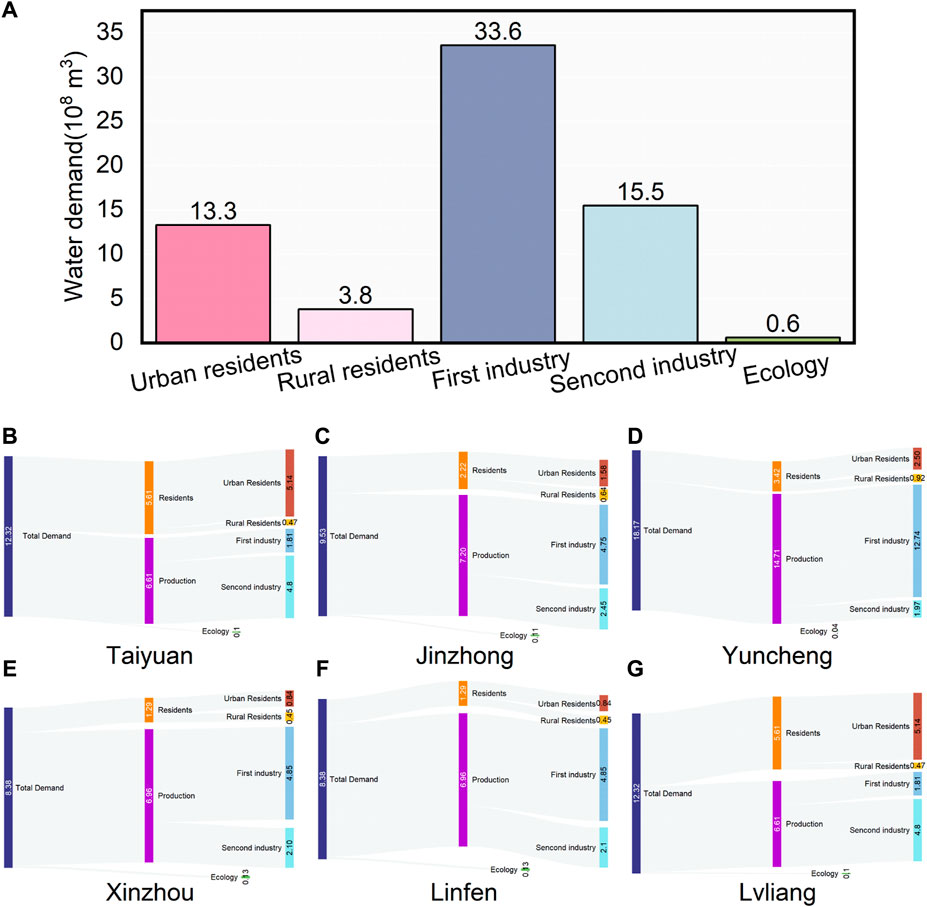
FIGURE 3. Water demand of FRB (A) and various cities (B–G) in 2030 (unit: 108 m3).
The total water demand in the FRB is projected to reach 6.68 billion m³ in 2030. When compared to figures from 2015 to 2019, it is evident that the actual water consumption in the FRB has increased, albeit at a slower growth rate. This increase in the regional water demand is primarily attributable to the continuous improvement in the economic development of the FRB. The demand for water in the region has consistently increased over time, but it has been moderated by the implementation of water-efficient technology, water-saving measures, and improvements in water resource management. According to the structure of water demand, the ratio of water demand for residents, production, and ecology in the FRB in 2030 is 25.6: 73.5: 0.9. Among these categories, production water demand is the largest, approximately three times the combined total of the other two categories. This significant proportion of production water demand is primarily attributed to the primary industry’s mode of operation, which inherently requires substantial water resources.
4.3 Prediction of water supply
Surface water supply, groundwater supply, sewage reuse, and mine water use are the main sources of water supply in FRB. The sewage reuse and mine water utilization are classified as other water supply sources. As shown in Figure 4, the water consumption and supply of each county show a decreasing trend year by year, owing to much stricter policies of water resource management. It is prominent that surface water supply is cutting down. Despite other water supplies have increased with the progress of technology, the overall water supply capacity of FRB is declining. We adopt quota analysis to derive the quantity of water supply, following to city-level Bulletin of Water Resources. This approach takes into account the spatial and temporal distribution of precipitation, annual surface runoff that occurs naturally, water storage dynamics in large- and medium-sized reservoirs, groundwater dynamics in the basin plain area, groundwater falling funnel in the basin plain area, and water use in its entirety.
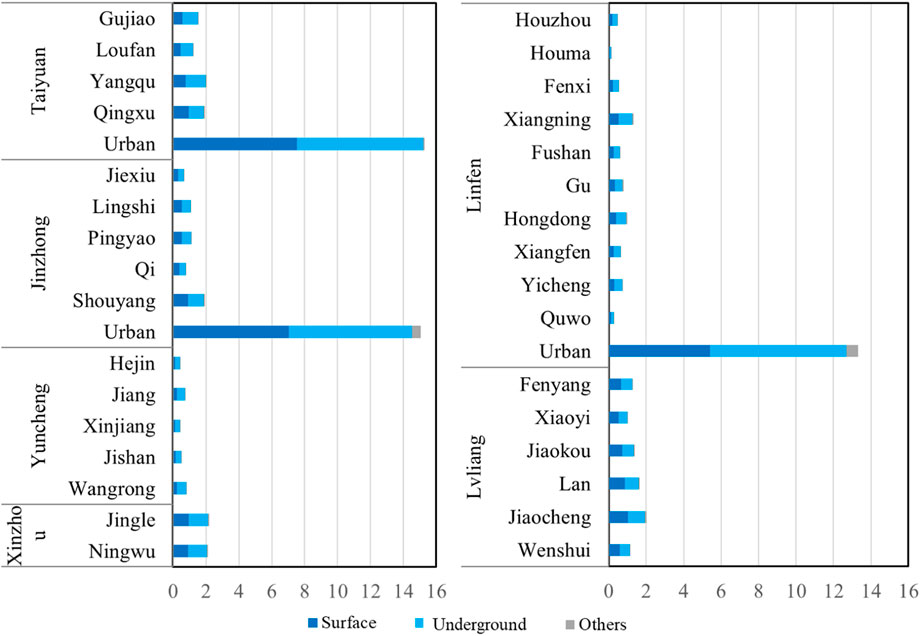
FIGURE 4. Prediction of water supply.
4.4 Optimal allocation of water resources
We employ professional math software LINGO 13.0 as a solver, based on the developed optimization model. The results are shown in Figures 5, 6. In 2030, the total water demand of FRB is estimated to be 6.68 billion m3. To improve the water-use efficiency, the water supply assurance rate in this study is set at 95%, the total water supply is set at 6.349 billion m3, the water shortage of the whole basin is set at 331 million m3, and the water shortage rate is set at 4.96%. All counties except for the counties under Taiyuan are facing water resource shortages to varying degrees. Among the 33 counties in FRB, Shouyang of Pingyao city and Guxian of Linfen city face the most severe water shortages, with a water shortage rate of more than 0.8%. The fact that each county’s water demand can essentially be supplied under the water supply guarantee rate of 95% is nevertheless encouraging.
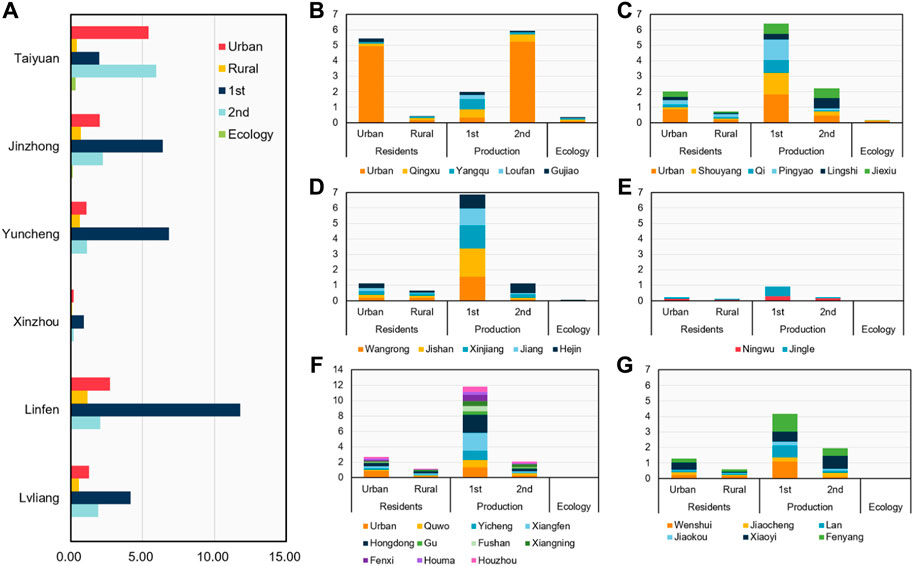
FIGURE 5. Results of water allocation of various cities (A) and counties (B–G) in the FRB (unit: 108 m3).
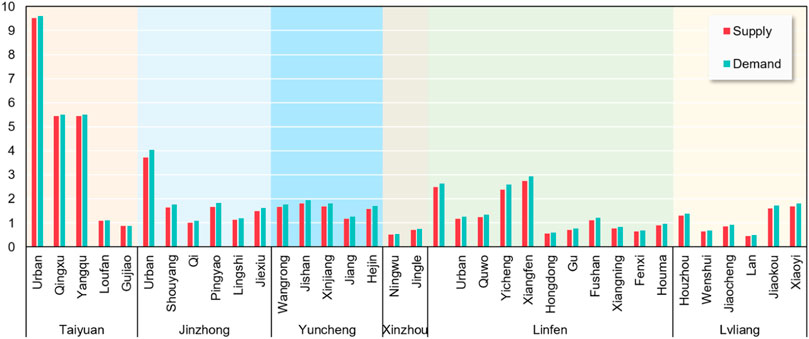
FIGURE 6. Gap between water supply and demand in the FRB (unit: 108 m3).
Our optimization allocation confirms the feasibility of achieving a mutually advantageous scenario reconciling economic development and water conservation within FRB, facilitated by regional water using restructuring. The results reveal that this restructuring holds the potential to yield significant economic benefits, amounting to 70 billion yuan, and meets over 95% of water demand. Situated as a pivotal area within China’s YRB, the FRB has transitioned into the intermediate phase of industrialization and demonstrated notable advancements in various dimensions, including the control of industrial water consumption and improvements in industrial water usage efficiency. Nevertheless, a pronounced incongruity persists between the constraints imposed by limited water resources and the prevalent water-intensive industrial structure in the region. Given the scarcity of water resources in the FRB, the adoption of an optimal allocation becomes imperative to realize sustainable socioeconomic development.
It is essential to acknowledge that our model encompasses two objectives, and any enhancement of one objective comes at the detriment of the other. These two objectives are not of equal significance, with economic advancement holding precedence over addressing water scarcity, aligning more closely with the trajectory of China’s economic development. Water allocation strategies that do not align with the imperatives of economic growth tend to encounter substantial implementation challenges. In the process of making trade-offs for Pareto optimization, while numerous viable options exist, our considerations are narrowed down in recognition of the primacy of economic priorities. We base our choices on a water demand that ensures 95% of the required supply, selecting the allocation option that yields the highest economic development.
5 Conclusion and discussion
5.1 Conclusion
The water demand in the FRB continues to escalate in tandem with the region’s socioeconomic development and population growth. However, the FRB grapples with inherent limitations in natural water and relatively low efficiency, resulting in a pronounced disparity between water supply and demand. This water scarcity intensifies competition among water users, undermining the prospects for regional economic growth and industrial development. In this context, optimizing the water allocation and enhancing water-use efficiency become imperative for the FRB. The ultimate goal is achieving the sustainable water resource utilization. Our research endeavors to provide a viable scheme of water resource allocation in the FRB in future, offering valuable insights for policymakers and decision-makers. The major conclusions are as follows:
(1) The total water demand in the FRB for 2030 is projected to reach 6.68 billion m³, reflecting an increase compared to 2015 and 2019. Although water consumption has increased over the years, the growth rate has decelerated. The regional water demand has also steadily increased with ongoing economic development in the FRB. The growth rate of the regional water demand has been effectively controlled owing to water-saving initiative implementation, enhanced water resource management, and advancements in water-saving technology.
(2) The total supply capacity of water in the FRB for 2030 amounts to 7.855 billion m³. This total includes 3.518 billion m³ from surface water, 4.086 billion m³ from groundwater, and 251 million m³ from other water supply sources. Water consumption and water supply in each county have experienced a consistent decline over the years, primarily due to increasingly stringent water resource management policies. Notably, surface water supply has substantially reduced, even though other water supply sources have shown improvements.
(3) The results of optimal water allocation for 2030 indicate that the FRB should allocate 1.655 billion m³ for domestic water, 4.57 billion m³ for production water, and 57 million m³ for ecological water. Most counties, excluding those under Taiyuan, face varying degrees of water resource shortages. However, the water demand for each water-use category can generally be met through the optimized allocation process.
It is important to highlight the fact that while water demand is increasing due to economic development and population growth, measures like water-saving initiatives and advanced water resource management have helped control the growth rate. Further research is imperative to conduct a comprehensive analysis of the precise mechanisms through which specific policies influence regional industrial restructuring. Further research studies will facilitate the development of more precise and efficacious recommendations for informing future policymaking.
5.2 Discussion
In terms of supply and demand for water resources, this article explains the demand from users and the FRB’s capacity to meet that demand. It then proposes the best plan for allocating water resources within the FRB. However, it is essential to recognize certain limitations and opportunities for future research:
(1) This study employs quota analysis to assess water resource demand, a method commonly used in similar research. However, it is important to acknowledge that quota analysis introduces a degree of subjectivity into the estimation process. Furthermore, due to the absence of an extensive historical dataset, the inversion of historical trends may carry biases that could influence prediction outcomes.
(2) This research primarily takes an inter-annual perspective, which overlooks the critical influence of seasonal cycles on water resource dynamics. Future research should aim to incorporate the complexities of seasonal water resource supply and demand patterns into the framework to improve the accuracy and scientific rigor of allocation schemes.
(3) The current study focuses primarily on optimizing the allocation of water resources among various user categories. However, it does not address the optimal scheduling of water resource projects, which is another critical aspect of water resource management. Future research endeavors should aim for a more comprehensive approach that considers the full spectrum of water resource allocation, including project scheduling, to provide more holistic solutions.
(4) The findings of this study have significant policy implications for the management of water resources in the FRB and similar regions. As the water demand continues to increase alongside population and economic development, strategies for sustainable resource allocation become crucial. It is recommended that the research could further explore the policy implications of the results. For example, the study could discuss the potential need for stricter regulations on water use in sectors with high demand and low efficiency. Additionally, exploring the feasibility and benefits of water-saving technologies and practices could offer practical recommendations for policymakers aiming to address the increasing water scarcity in the FRB.
(5) Although the current study primarily focuses on the intra-regional allocation of water resources within the FRB, it is worth considering the potential for cross-regional water allocation. Collaborative efforts between regions sharing water resources can be an effective strategy to alleviate water scarcity. The discussion could explore the possibilities and challenges associated with inter-regional water allocation and the role of governmental bodies and policy frameworks in facilitating such cooperation.
In conclusion, while the research has made significant strides in assessing water resource allocation in the FRB, these discussions of limitations and opportunities for future research will provide valuable guidance for the continued development of sustainable water resource management strategies in water-deficient areas. Addressing these aspects will enhance the depth and practicality of the study’s contributions to the field.
Data availability statement
The original contributions presented in the study are included in the article/Supplementary material; further inquiries can be directed to the corresponding author.
Author contributions
CL: data curation, software, writing–original draft, formal analysis, and methodology. JW: conceptualization, supervision, validation, visualization, writing–original draft, and writing–review and editing.
Funding
The author(s) declare that no financial support was received for the research, authorship, and/or publication of this article.
Conflict of interest
The authors declare that the research was conducted in the absence of any commercial or financial relationships that could be construed as a potential conflict of interest.
Publisher’s note
All claims expressed in this article are solely those of the authors and do not necessarily represent those of their affiliated organizations, or those of the publisher, the editors, and the reviewers. Any product that may be evaluated in this article, or claim that may be made by its manufacturer, is not guaranteed or endorsed by the publisher.
References
Al-Zahrani, M. A., and Abo-Monasar, A. (2015). Urban residential water demand prediction based on artificial neural networks and time series models. Water Resour. Manage 29, 3651–3662. doi:10.1007/s11269-015-1021-z
An, Z., Yan, J., Sha, J., Ma, Y., and Mou, S. (2021). Dynamic simulation for comprehensive water resources policies to improve water-use efficiency in coastal city. Environ. Sci. Pollut. Res. 28, 25628–25649. doi:10.1007/s11356-020-12191-z
Bai, L., Cai, J., Liu, Y., Chen, H., Zhang, B., and Huang, L. (2017). Responses of field evapotranspiration to the changes of cropping pattern and groundwater depth in large irrigation district of Yellow River basin. Agric. Water Manag. 188, 1–11. doi:10.1016/j.agwat.2017.03.028
Bildirici, M., and Ersin, o.o. (2018). Correction to: economic growth and CO2 emissions: an investigation with smooth transition autoregressive distributed lag models for the 1800–2014 period in the USA. Environ. Sci. Pollut. Res. 25, 220–221. doi:10.1007/s11356-017-0564-3
Chai, N., Yi, X., Xiao, J., Liu, T., Liu, Y., Deng, L., et al. (2021). Spatiotemporal variations, sources, water quality and health risk assessment of trace elements in the Fen River. Sci. Total Environ. 757, 143882. doi:10.1016/j.scitotenv.2020.143882
Chen, F., Yao, L., Mei, G., Shang, Y., Xiong, F., and Ding, Z. (2021). Groundwater quality and potential human health risk assessment for drinking and irrigation purposes: a case study in the semiarid region of North China. Water 13, 783. doi:10.3390/w13060783
Chen, L., and Hobbs, B. F. (2020). Flood control through engineered avulsions and floodways in the lower Yellow River. J. Water Resour. Plan. Manag. 146, 04019074. doi:10.1061/(ASCE)WR.1943-5452.0001151
Chen, X., Li, F., Li, X., Hu, Y., and Hu, P. (2020). Evaluating and mapping water supply and demand for sustainable urban ecosystem management in Shenzhen, China. J. Clean. Prod. 251, 119754. doi:10.1016/j.jclepro.2019.119754
Cui, R. Y., Calvin, K., Clarke, L., Hejazi, M., Kim, S., Kyle, P., et al. (2018). Regional responses to future, demand-driven water scarcity. Environ. Res. Lett. 13, 094006. doi:10.1088/1748-9326/aad8f7
Di, D., Wu, Z., Guo, X., Lv, C., and Wang, H. (2019). Value stream analysis and emergy evaluation of the water resource eco-economic system in the Yellow River Basin. Water 11, 710. doi:10.3390/w11040710
Fan, M., Xu, J., Chen, Y., Li, D., and Tian, S. (2020). How to sustainably use water resources—a case study for decision support on the water utilization of xinjiang, China. Water 12, 3564. doi:10.3390/w12123564
Farnsworth, A., Lunt, D. J., Robinson, S. A., Valdes, P. J., Roberts, W. H. G., Clift, P. D., et al. (2019). Past East Asian monsoon evolution controlled by paleogeography, not CO2. Sci. Adv. 5, eaax1697. doi:10.1126/sciadv.aax1697
Gao, F., Wang, Y., Chen, X., and Yang, W. (2020). Trend analysis of rainfall time series in Shanxi province, northern China (1957–2019). Water 12, 2335. doi:10.3390/w12092335
Huang, C., Yin, K., Liu, Z., and Cao, T. (2021). Spatial and temporal differences in the green efficiency of water resources in the yangtze river economic belt and their influencing factors. Int. J. Environ. Res. Public Health 18, 3101. doi:10.3390/ijerph18063101
Jin, X., Yan, D., Wang, H., Zhang, C., Tang, Y., Yang, G., et al. (2011). Study on integrated calculation of ecological water demand for basin system. Sci. China Technol. Sci. 54, 2638–2648. doi:10.1007/s11431-011-4535-5
Li, H., Zhang, Q., Singh, V. P., Shi, P., and Sun, P. (2017). Hydrological effects of cropland and climatic changes in arid and semi-arid river basins: a case study from the Yellow River basin, China. J. Hydrology 549, 547–557. doi:10.1016/j.jhydrol.2017.04.024
Liao, X., and Ming, J. (2018). Pressures imposed by energy production on compliance with China’s ‘Three Red Lines’ water policy in water-scarce provinces. Water Policy 21, 38–48. doi:10.2166/wp.2018.211
Liu, G., Najmuddin, O., and Zhang, F. (2022). Evolution and the drivers of water use efficiency in the water-deficient regions: a case study on Ω-shaped Region along the Yellow River, China. Environ. Sci. Pollut. Res. 29, 19324–19336. doi:10.1007/s11356-021-16969-7
Liu, G., and Zhang, F. (2022). Inequality of household water footprint consumption in China. J. Hydrology 612, 128241. doi:10.1016/j.jhydrol.2022.128241
Liu, G., Zhang, F., and Deng, X. (2021). Is virtual water trade beneficial for the water-deficient regions? New evidences from the Yellow River Basin, China. J. Hydrology Regional Stud. 38, 100964. doi:10.1016/j.ejrh.2021.100964
Meng, X., and Wu, L. (2021). Prediction of per capita water consumption for 31 regions in China. Environ. Sci. Pollut. Res. 28, 29253–29264. doi:10.1007/s11356-021-12368-0
Omer, A., Zhuguo, M., Yuan, X., Zheng, Z., and Saleem, F. (2021). A hydrological perspective on drought risk-assessment in the Yellow River Basin under future anthropogenic activities. J. Environ. Manag. 289, 112429. doi:10.1016/j.jenvman.2021.112429
Pan, J., Wang, W., and Li, J. (2016). Building probabilistic models of fire occurrence and fire risk zoning using logistic regression in Shanxi Province, China. Nat. Hazards 81, 1879–1899. doi:10.1007/s11069-016-2160-0
Rahman, M. M., and Vu, X.-B. (B. ) (2021). Are energy consumption, population density and exports causing environmental damage in China? Autoregressive distributed lag and vector error correction model approaches. Sustainability 13, 3749. doi:10.3390/su13073749
Shao, W., Cai, J., Liu, J., Luan, Q., Mao, X., Yang, G., et al. (2017). Impact of water scarcity on the fenhe River Basin and mitigation strategies. Water 9, 30. doi:10.3390/w9010030
Sordo-Ward, Á., Bejarano, M. D., Granados, I., and Garrote, L. (2020). Facing future water scarcity in the duero-douro basin: comparative effect of policy measures on irrigation water availability. J. Water Resour. Plan. Manag. 146, 04020011. doi:10.1061/(ASCE)WR.1943-5452.0001183
Sun, B., Ma, L., Liu, T., and Huang, X. (2021). Changes in runoff in a typical temperate continental-monsoon transitional zone in the last four centuries. J. Hydrology 596, 126124. doi:10.1016/j.jhydrol.2021.126124
Villarín, M. C. (2019). Methodology based on fine spatial scale and preliminary clustering to improve multivariate linear regression analysis of domestic water consumption. Appl. Geogr. 103, 22–39. doi:10.1016/j.apgeog.2018.12.005
Wang, Y., Zhou, L., Jia, Q., and Yu, W. (2017). Water use efficiency of a rice paddy field in Liaohe Delta, Northeast China. Agric. Water Manag. 187, 222–231. doi:10.1016/j.agwat.2017.03.029
Xiang, X., Svensson, J., and Jia, S. (2017). Will the energy industry drain the water used for agricultural irrigation in the Yellow River basin? Int. J. Water Resour. Dev. 33, 69–80. doi:10.1080/07900627.2016.1159543
Yan, Z., Sha, J., Liu, B., Tian, W., and Lu, J. (2018). An ameliorative whale optimization algorithm for multi-objective optimal allocation of water resources in handan, China. Water 10, 87. doi:10.3390/w10010087
Yan, Z., Zhou, Z., Liu, J., Wang, H., and Li, D. (2020). Water use characteristics and impact factors in the Yellow River basin, China. Water Int. 45, 148–168. doi:10.1080/02508060.2020.1743565
Yang, J., Xie, B., Zhang, D., and Tao, W. (2021). Climate and land use change impacts on water yield ecosystem service in the Yellow River Basin, China. Environ. Earth Sci. 80, 72. doi:10.1007/s12665-020-09277-9
Yin, Y., Tang, Q., Liu, X., and Zhang, X. (2017). Water scarcity under various socio-economic pathways and its potential effects on food production in the Yellow River basin. Hydrology Earth Syst. Sci. 21, 791–804. doi:10.5194/hess-21-791-2017
Zhang, F., Jin, G., and Liu, G. (2021a). Evaluation of virtual water trade in the Yellow River delta, China. Sci. Total Environ. 784, 147285. doi:10.1016/j.scitotenv.2021.147285
Zhang, J., Huang, G., Liu, L., Zhai, M., Xie, Y., Xin, X., et al. (2021b). Economic sensitivity analysis of dual perspectives induced by energy scarcity for energy-dependent region. Sci. Total Environ. 768, 144876. doi:10.1016/j.scitotenv.2020.144876
Zhang, L., Li, S., Wu, Z., Fan, X., Li, H., Meng, Q., et al. (2020a). Variation in runoff, suspended sediment load, and their inter-relationships in response to climate change and anthropogenic activities over the last 60 Years: a case study of the upper fenhe River Basin, China. Water 12, 1757. doi:10.3390/w12061757
Zhang, L., Zhang, X., Wu, F., and Pang, Q. (2020b). Basin initial water rights allocation under multiple uncertainties: a trade-off analysis. Water Resour. Manage 34, 955–988. doi:10.1007/s11269-019-02453-y
Zhang, X., Kong, Y., and Ding, X. (2020c). How high-quality urbanization affects utilization efficiency of agricultural water resources in the Yellow River Basin under double control action? Sustainability 12, 2869. doi:10.3390/su12072869
Zhang, Y., Lu, Y., Zhou, Q., and Wu, F. (2020d). Optimal water allocation scheme based on trade-offs between economic and ecological water demands in the Heihe River Basin of Northwest China. Sci. Total Environ. 703, 134958. doi:10.1016/j.scitotenv.2019.134958
Zhao, H., Zhai, X., Guo, L., Liu, K., Huang, D., Yang, Y., et al. (2019). Assessing the efficiency and sustainability of wheat production systems in different climate zones in China using emergy analysis. J. Clean. Prod. 235, 724–732. doi:10.1016/j.jclepro.2019.06.251
Zhao, K., Zhang, R., Liu, H., Wang, G., and Sun, X. (2021). Resource endowment, industrial structure, and green development of the Yellow River Basin. Sustainability 13, 4530. doi:10.3390/su13084530
Zhao, L. (2021). Prediction model of ecological environmental water demand based on big data analysis. Environ. Technol. Innovation 21, 101196. doi:10.1016/j.eti.2020.101196
Zhao, X., Chen, X., and Huang, Q. (2017). Trend and long-range correlation characteristics analysis of runoff in upper Fenhe River basin. Water Resour. 44, 31–42. doi:10.1134/S0097807817010201
Zhao, Z., Liu, R., and Zhang, Z. (2020). Characteristics of winter haze pollution in the fenwei plain and the possible influence of EU during 1984–2017. Earth Space Sci. 7, e2020EA001134. doi:10.1029/2020EA001134
Keywords: water resource management, high-quality development, Fen River Basin, multi-objective programming, water efficiency
Citation: Li C and Wu J (2023) How can we achieve more sustainable water allocation in water-deficient areas? A case study from China’s Fen River Basin. Front. Environ. Sci. 11:1302845. doi: 10.3389/fenvs.2023.1302845
Received: 27 September 2023; Accepted: 13 November 2023;
Published: 01 December 2023.
Edited by:
Yuankun Wang, North China Electric Power University, ChinaReviewed by:
Bai Tao, Xi’an University of Technology, ChinaChunhui Li, Beijing Normal University, China
Copyright © 2023 Li and Wu. This is an open-access article distributed under the terms of the Creative Commons Attribution License (CC BY). The use, distribution or reproduction in other forums is permitted, provided the original author(s) and the copyright owner(s) are credited and that the original publication in this journal is cited, in accordance with accepted academic practice. No use, distribution or reproduction is permitted which does not comply with these terms.
*Correspondence: Jianwei Wu, d3VqaWFud2VpX2ZvcmVzdHJ5QDE2My5jb20=