
94% of researchers rate our articles as excellent or good
Learn more about the work of our research integrity team to safeguard the quality of each article we publish.
Find out more
ORIGINAL RESEARCH article
Front. Environ. Sci., 04 January 2024
Sec. Environmental Informatics and Remote Sensing
Volume 11 - 2023 | https://doi.org/10.3389/fenvs.2023.1302220
 Qixian Wu1Yun Chen2*Congying Li2Xiaoya Shi2
In order to carry out the research on the measurement and prediction of carbon emissions from highway projects, the prediction index system is constructed by selecting seven influencing factors, namely, urbanization rate, industrial structure, energy intensity, energy structure, key low-carbon technologies, highway construction planning, and green financial support. The carbon emission coefficient method is used to measure the carbon emissions of highway projects from the perspective of energy consumption, and finally, a carbon emission scenario prediction model based on the scenario analysis method and the LSTM algorithm of the recurrent neural network is constructed to put forward a new way of predicting the carbon emissions of highway projects. Taking Hunan province as a case study object, the carbon emission trends in the next 15 years are predicted under three scenarios: low carbon, baseline, and high carbon. The results show that the highway project in Hunan province is expected to peak in 2031 under the low-carbon scenario, in 2037 under the baseline scenario, and around 2044 under the high-carbon scenario. It is also found that energy saving and emission reduction measures have a certain lag in the emission reduction effect of highway projects. Finally, based on this, suggestions and countermeasures for carbon emission reduction of highway development in Hunan province are proposed.
Climate change is one of the most serious challenges faced by all countries and regions of the world. The Government of China is committed to peaking carbon dioxide emissions by 2030 and striving to achieve carbon neutrality by 2060. Achieving the goal of carbon peaking and carbon neutrality requires the joint efforts of the whole society and the full participation of all industries, among which the transportation industry is no exception.
The rapid development of China’s highways is not only the focus of China’s construction of a strong transportation country but also an important support for the development of the national economy. Highway engineering not only contributes to economic and social development but also is the main source of carbon emissions; therefore, highway engineering and construction of low-carbon development is imperative. This paper takes Hunan province as a case study, analyzes and combs the main influencing factors of carbon emission of highway projects, predicts the time of reaching the peak, and puts forward the emission reduction path, which is of important research significance for highway development planning.
The study of highway engineering carbon emission measurement is mainly carried out for the division project in the highway, through the analysis of the carbon emission source of the asphalt pavement construction link, to construct the carbon emission measurement model based on the carbon emission factor and global warming potential measurement of asphalt pavement construction machinery (Yun et al., 2019).
The whole life cycle of a highway project is divided into four stages: planning, design, construction, and operation, and the existing carbon emission measurement method is mainly applied to the construction stage. The construction period is divided into three phases: material materialization, mechanical construction, and material transportation, and the emission coefficient method is used to establish the calculation model (Ying and Shuangshuang, 2022). With the endogenous carbon emissions during the construction period as the object of research on construction machinery, personnel activities, and resource changes in the cluster analysis, through the IPCC recommended methods, similarity studies and engineering analogies are used to determine the different clustering coefficients and then carry out divisional carbon emission accounting (Guangyuan, 2013). Research results for the scale of CO2 emissions associated with infrastructure construction activities on mountain highways show that CO2 emissions from road segments are one order of magnitude lower than those from bridges and tunnels (Yuanyuan et al., 2019). The mainstream analytical method in the field of energy and carbon emission forecasting research at home and abroad is the scenario analysis method. From the point of view of the forecasting model used, domestic and foreign macro carbon emission forecasting methods can be categorized into three types: the macro energy-economic environment modeling method, the model fitting forecasting method based on the key influencing factors of carbon emissions, and the environmental Kuznets curve modeling method (Huaquan, 2015). For industry, studies have been conducted to predict the future values of the influencing factors of carbon emissions as well as the industrial carbon emissions under the target scenario (Xiaosong and Guohao, 2014; Zhenying and Jiangao, 2014). For the construction industry, neural networks and system dynamics are utilized to predict the carbon emission intensity of the construction industry (Donglei and Yisheng, 2019; Guangtai et al., 2021). For highway engineering, the BP neural network and random forest are used to learn the carbon emission data and then establish the prediction model of carbon emission during the highway construction period (Huiying, 2022).
Through the analysis of the existing literature, it is found that there are two major problems in the calculation and prediction of carbon emissions during the highway construction period; that is, there are few calculation models for carbon emissions of regional highway projects, and the carbon emission scenario prediction indexes are not closely related to highway projects. Therefore, this paper proposes to take the urbanization rate, industrial structure, energy intensity, energy structure, key low-carbon technologies, highway construction planning, and green financial support as the carbon emission prediction indicators of highway projects and use the carbon emission coefficient method to construct the carbon emission measurement model of highway projects from the perspective of energy consumption. Through the carbon emission scenario prediction model based on the scenario analysis method and the LSTM algorithm of recurrent neural network, the carbon emission trends in Hunan province under three scenarios of low carbon, baseline, and high carbon are analyzed to provide theoretical basis for the realization of the dual-carbon target.
Based on the relevant literature at home and abroad, the actual situation in China, and the questionnaire survey on the front-line practitioners, using the Likert scale and Pearson correlation analysis, we finally determined seven important influencing factors, namely, urbanization rate, industrial structure, energy intensity, energy structure, key low-carbon technology, highway construction planning, and green financial support, to build the carbon emission prediction index system for highway construction projects. The process of calculating each indicator is shown in Table 1.
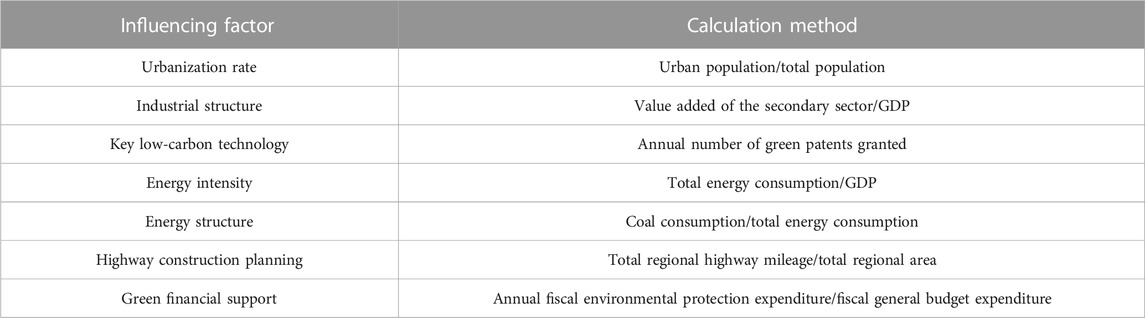
TABLE 1. Table of the projected indicator system.
Urbanization rate: It is a measure of urbanization, calculated by the ratio of the urban population to the total population.
Industrial structure: The industry proposed in this paper refers to the secondary industry which is highly related to the construction of the highway and is calculated by the ratio of the value added of the secondary industry to the regional GDP.
Energy intensity: It refers to the energy consumption per unit of output value and is calculated by the ratio of energy consumption to GDP. The lower energy intensity represents the less energy consumed and the higher quality of GDP, and it also reflects the degree of economic dependence on energy.
Energy structure: It is calculated as the ratio of raw coal in transportation to the total energy consumption.
Key low-carbon technology: Green low-carbon technology patents, which refer to patents with green low-carbon technology as the subject of invention, should have the technical effect of reducing carbon emissions compared with existing technologies (Jianchun, 2023). In this paper, the annual number of green low-carbon technology patents is used as a value to measure the development of low-carbon technology in a region.
Highway construction planning: The degree of highway development in a region is measured by the density of the highway network, and this paper uses the density of the highway network to indicate the highway construction planning, calculated as the ratio of the number of miles to the total area of the region.
Green fiscal support: It is the value of a series of fiscal policies and measures enacted by the government to promote the development of green economy. The implementation of an effective green fiscal policy is an important means to realize the goal of “carbon peak and carbon neutral.”
Based on the energy consumption characteristics of the highway project, seven energy types, namely, raw coal, gasoline, kerosene, diesel fuel, fuel oil, natural gas, and electricity, are selected and discounted according to the carbon emission factor method. The calculation formula is as follows:
In Eq. 2-1, C is the carbon dioxide emissions; Ei is the consumption of the ith energy source; and Fi is the carbon emission factor of the ith energy source.
Referring to the results of the Energy Research Institute of the National Development and Reform Commission and combining with the general background of highway construction, this paper sets three scenarios of high carbon, low carbon, and baseline based on the future development trend of the predicted indicators, and the specific meanings of the scenarios are shown in Table 2.
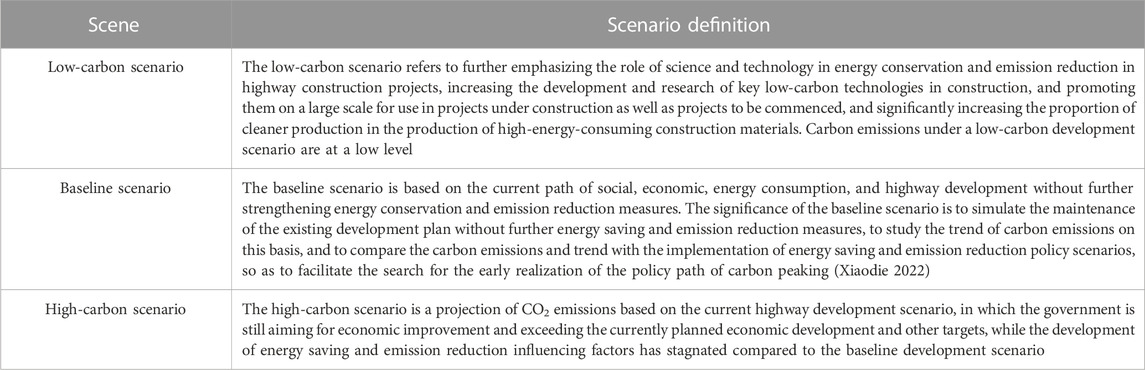
TABLE 2. Definitions of low-carbon, baseline, and high-carbon scenarios.
The long short-term memory (LSTM) network is a temporal recurrent neural network, which is specially designed to solve the long-term dependency problem that exists in general recurrent neural networks (RNNs) (Bingxiao et al., 2022).
The carbon emission prediction of highway projects is uncertain, complex, and time-series and needs to consider the long-term trend and short-term fluctuations and other comprehensive factors at the same time. The LSTM network is more suitable for dealing with time-series data, as it can capture the long-time dependence and learn adaptively, consider long-term and short-term information at the same time, and record the historical information and apply it to the current prediction.
(1) Data processing
Since the seven influencing factors of urbanization rate, industrial structure, energy intensity, energy structure, key low-carbon technologies, highway construction planning, and green financial support have large differences in the order of magnitude, it is necessary to normalize the data used for model training and testing to be between [0,1], and this processing can be accomplished by relying on the function of MinMaxScaler in Scikit-Learn. The normalization mathematical expression is shown as follows:
In Eq. 2-2, X0 is the original data and X is the processed data.
After the prediction, the output value y should be inverse normalized, and the expression is shown as follows:
(2) Projected evaluation indicators
After outputting the predicted values, the gap between the predicted and true values is evaluated using mean absolute percentage error (MSPE), mean absolute error (MAE), and root mean square error (RMSE), with a smaller gap representing a smaller error (Shipeng, 2021).
The data cutoff is set to 0.8, but considering the small number of test sets, the window value is set to 3 so that the test set can be taken forward for three more years; the training step size T is set to 3; layer_size, i.e., the number of hidden layers of the LSTM model, is set to 1; epoch, i.e., the number of training rounds, is set to 200; and Adam is chosen as the optimizer. MAE is chosen for the loss function; the learning rate is a constant affecting the independent variable used to reduce the loss value, set to 0.001; and the activation function is the tanh function.
The training parameter settings of the LSTM prediction model are organized as shown in Table 3.
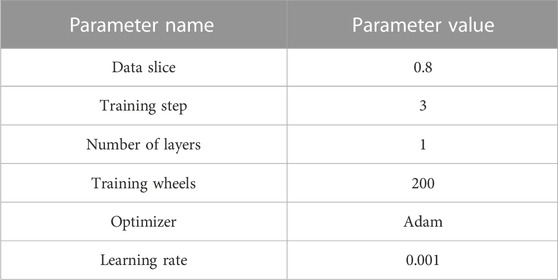
TABLE 3. LSTM model parameter setting table.
The construction of highways in Hunan province began in 1993. As the country and Hunan province strengthen the investment in highway transportation infrastructure, the scale of transportation infrastructure in Hunan province has seen unprecedented growth during the “13th Five-Year Plan” period. 5,700 km of highway mileage in 2015, as of the end of 2022, the highway mileage in Hunan province exceeded 7,300 km of highway, an increase of 28.07%. The total mileage of highway is 5,700 km in 2015. The highway network skeleton of “five vertical and seven horizontal” is basically formed (Figure 1).
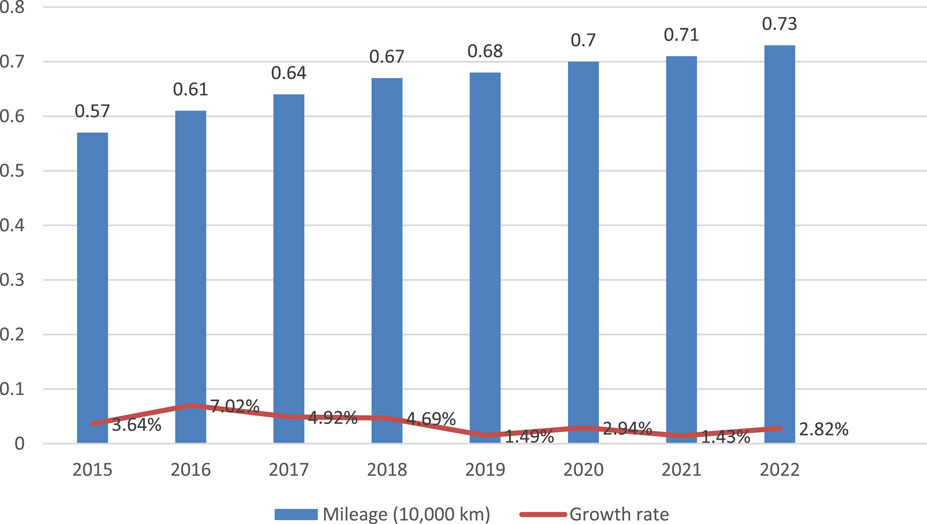
FIGURE 1. Changes in the total mileage of highways in Hunan province in the past 8 years.
Carbon emissions from highway construction projects in Hunan province from 2000 to 2021 are calculated (Figure 2). The consumption of raw coal, gasoline, kerosene, diesel fuel, fuel oil, natural gas, and electricity in the transportation industry of Hunan province is taken from the China Energy Statistical Yearbook, and the basic data and results of the accounting are shown in Table 4.
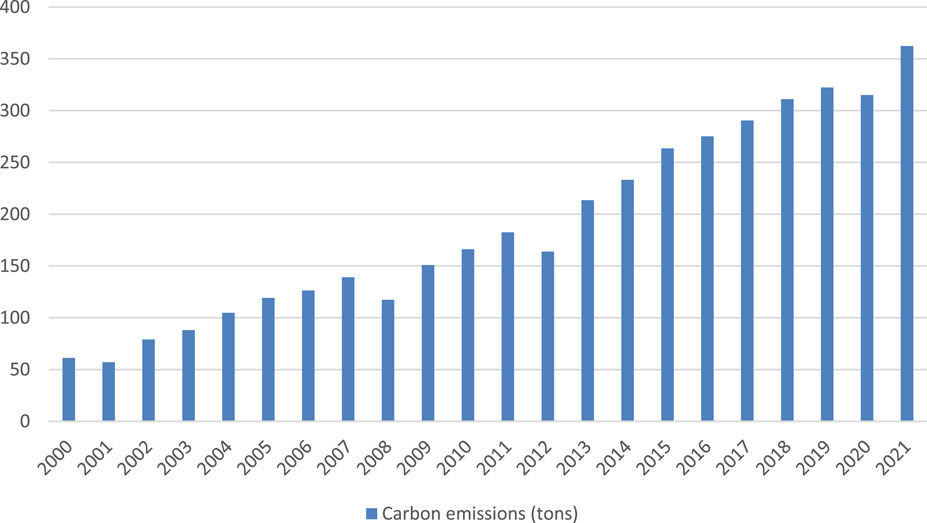
FIGURE 2. Carbon emissions from highway construction projects in Hunan province, 2000–2021.
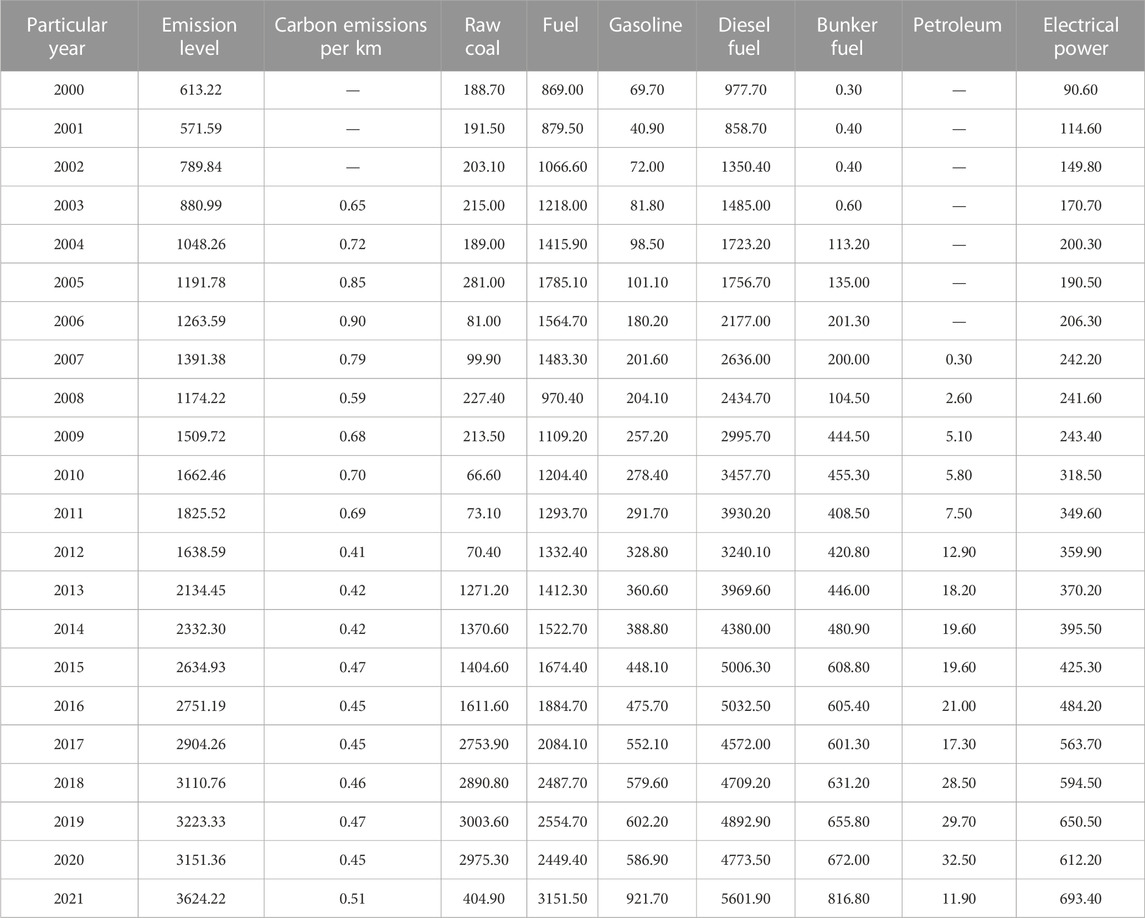
TABLE 4. Carbon emissions from highway construction projects (unit: thousand tons).
The following conclusions can be drawn from the analysis of the calculation results and change trends of carbon emissions from highway projects in Hunan province from 2000 to 2021.
If the influence of abnormal years is ignored, it can be found that the carbon emissions from highway projects in Hunan province from 2000 to 2021 show two stages of characteristics. The first stage is the rapid growth stage (2000–2015), from 613,200 tons in 2000 to 2,634,900 tons in 2015, an increase of 329.30%, with an average annual growth rate of 21.95%. The second stage is the slow growth stage (2015–2021), from 2,634,900 tons in 2015 to 3,624,200 tons in 2021, with an average annual growth rate of 6.26%.
The parameter values of the screened influencing factors were set based on the three scenarios of low carbon, baseline, and high carbon, and the LSTM model and scenario analysis were applied to forecast the CO2 emissions of Hunan province from 2022 to 2036.
The urbanization rate, the number of highway mileage in Hunan province, the value added of the secondary industry for calculating the industrial structure, and the GDP of Hunan province are from the Hunan Provincial Statistical Yearbook; the energy intensity is obtained by converting the measured total energy consumption; the number of green patents in Hunan province is from the China Research Data Service Platform (CNRDS); and the financial environmental protection expenditure and the financial general budget expenditure of Hunan province are from the National Bureau of Statistics (NBS). Specific forecast indicators are shown in Table 5.
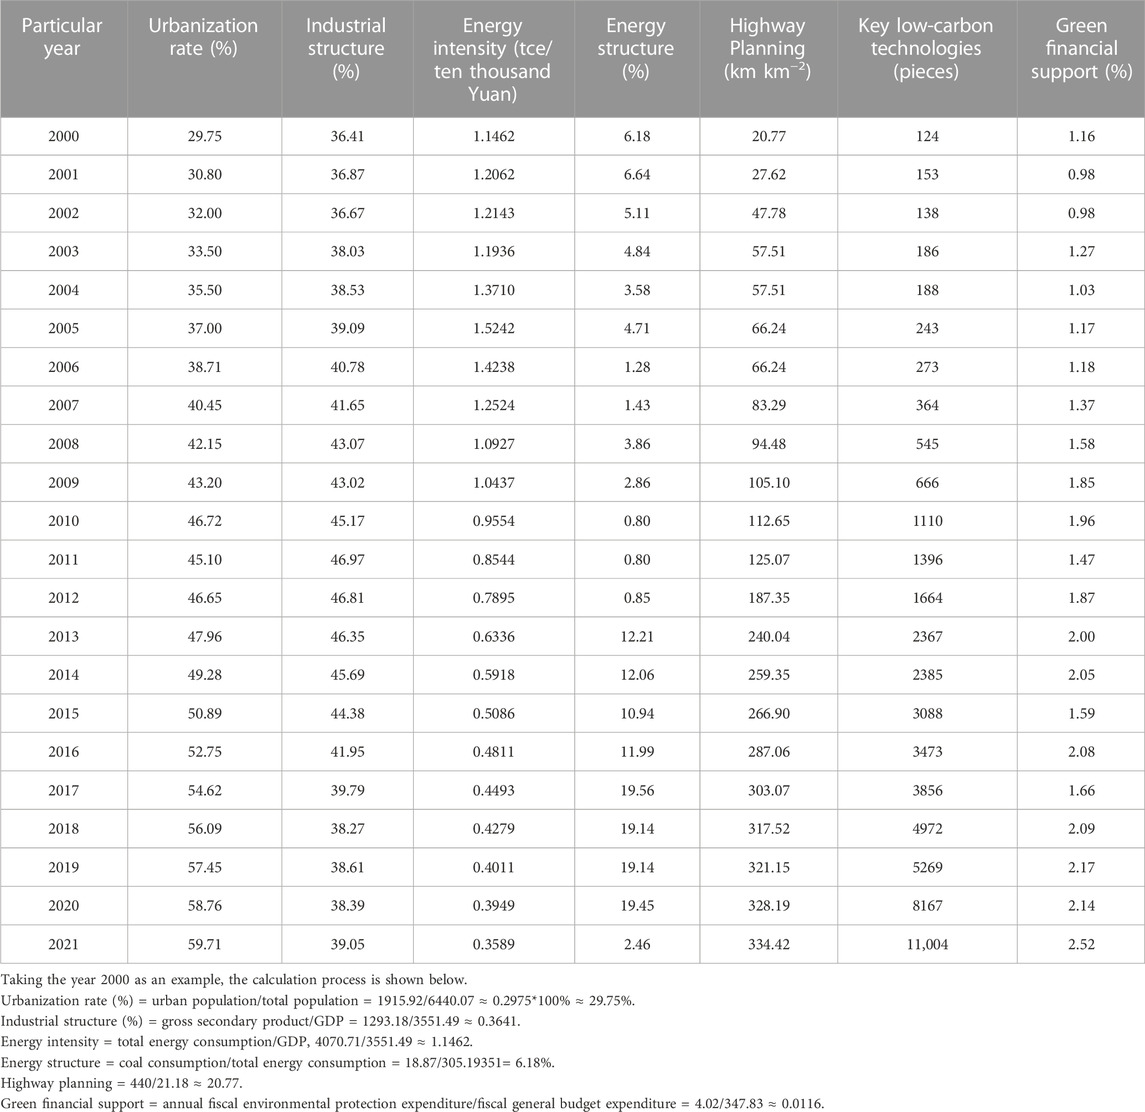
TABLE 5. Influence factor data of the carbon emission prediction model for highway projects.
Pearson correlation analysis of highway construction project carbon emissions and prediction index data: The results show that the carbon emissions and the seven influencing factors all show significance, and the correlation coefficient values are 0.98, 0.78, −0.92, −0.87, 0.98, 0.89, and 0.86. It means that the selected variables are basically reasonable.
(1) Scenario setting for urbanization development
The “14th Five-Year Plan for New Urbanization in Hunan province” combines the development rate of urbanization in Hunan province over the past decade and draws on the urbanization development laws of first-tier cities to scientifically formulate that the urbanization rate of the resident population will reach 63% by 2025 and strive to reach 72% by 2035. Through calculation, it can be seen that in order to achieve this goal, the average annual growth rate of urbanization in Hunan province from 2022 to 2035 will be 1.35%. Setting this growth rate as the baseline development scenario, the corresponding urbanization growth rates of Hunan province in the high-carbon and low-carbon development scenarios increase and decrease by 0.1%, respectively.
(2) Scenario setting for industrial structure development
According to the statistics of Hunan province during the period of the “Tenth Five-Year Plan,” “Eleventh Five-Year Plan”, and “Twelfth Five-Year Plan,” the secondary industry of Hunan province has shown an increasing and then decreasing trend. However, the tertiary industry has been growing continuously, and its proportion shows a trend of surpassing that of the secondary industry. Therefore, the study predicts that under the baseline development scenario, the proportion of the industrial output value in Hunan province will be reduced to 35% in 2050, with an average annual growth rate of −0.38%, while under the high-intensity emission reduction measures, the average annual growth rate under the low-carbon development scenario is −0.58%, and the growth rate is set at −0.18% under the high-carbon development scenario.
(3) Energy intensity development scenario setting
The World and China Energy Outlook 2050 (2020 Edition) of the China Academy of Petroleum Economics and Technology forecasts an average annual decline in energy intensity of about 3.5% between 2020 and 2050 under the baseline scenario. This is used as a basis to set the average annual energy intensity growth rate for 2022–2036 at −3.50%, −4.00% for the low-carbon development scenario and −3.00% for the high-carbon development scenario.
(4) Scenario setting for energy mix development
Currently, the proportion of coal consumption in China has reached 57.64%, and the proportion of raw coal consumption in Hunan province’s transportation sector in 2020 was 19.45%. However, the data show that there is a precipitous drop in raw coal consumption in 2021, which is very different from the trend in previous years, plus the fact that the statistics for 2022 have not yet been released, so it is not possible to know whether the change is consistent going forward. This paper, therefore, uses energy mix data for 2020 as the basis for calculating the development scenario.
(5) Prospects for the development of key low-carbon technologies are set
The country’s average development rate for 2016–2021 is set as the baseline scenario at 6.5%. The annual growth rates for the low-carbon and high-carbon scenarios are set at 7.5% and 8.5%, respectively.
(6) Highway construction planning and development prospect setting
As of the end of 2021, the density of highway network in Hunan province was 334.42 km2∙km−2. According to the “14th Five-Year Plan for Transportation Development in Hunan province (Highway and Waterway)” released in 2021, the density should reach 613.79 km2∙km−2 by 2050. This is set as the baseline scenario for highway construction planning, with an average annual growth rate of 2.12%, and the low-carbon development scenario and high-carbon development prospect are set at 1.92% and 2.32%, respectively.
(7) Setting the scene for green financial development
The proportion of fiscal environmental protection expenditure in Hunan province increases from 2.08% in 2016 to 2.52% in 2021, with an average annual growth rate of 3.93%, which is set as the growth rate under the baseline scenario, and the low-carbon and high-carbon scenarios are set at 4.43% and 3.43%, respectively.
The parameters of the above seven projected indicators for the low-carbon, baseline, and high-carbon scenarios are summarized in Table 6.
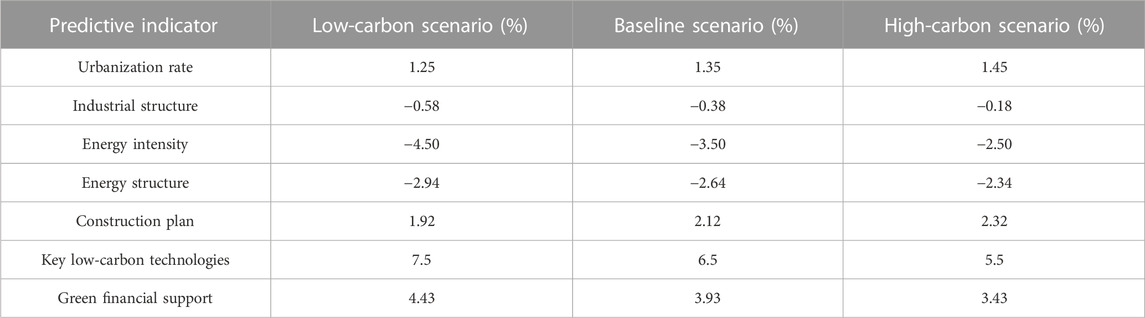
TABLE 6. Setting of growth rates for each of the projected indicators under different scenarios (in %).
The model is first trained, and the final batch size and number of implied nodes are determined to be 4 and 7, respectively. At this point, the performance of the model is as shown in Table 7.
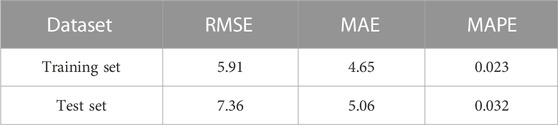
TABLE 7. Table of model evaluation results.
According to the table of model evaluation results, it can be found that no overfitting occurred in the model. In order to further verify the prediction effect, the LSTM model was trained and tested, and the comparison of its simulated and real values is shown in Figure 3 and Table 8.
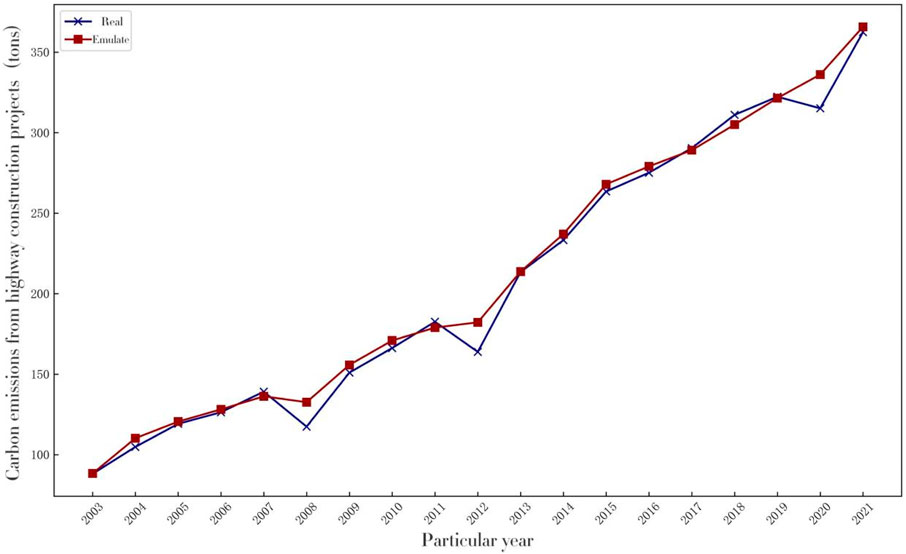
FIGURE 3. Comparison of predicted and real carbon emissions from highway construction projects in Hunan province.
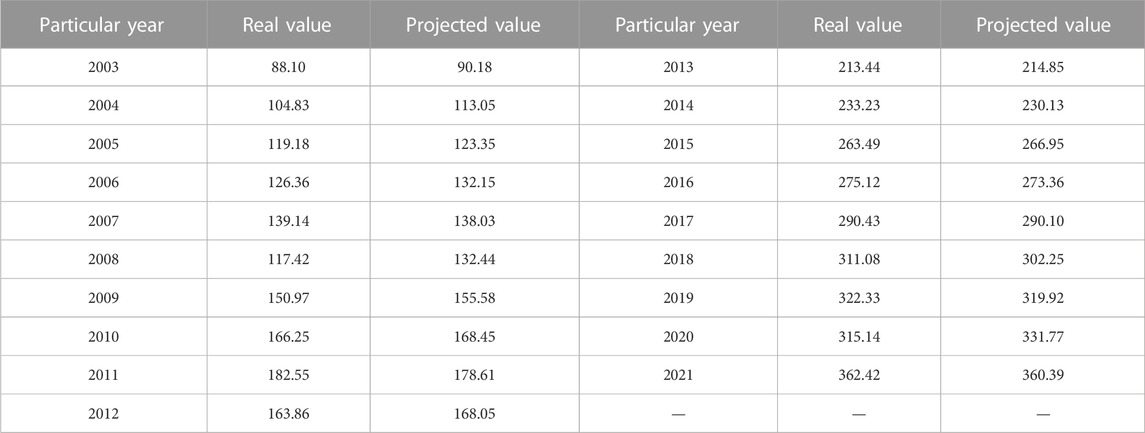
TABLE 8. Specific data on the predicted and real values of carbon emissions from highway construction projects in Hunan province.
A comparison of the simulated and real values of the LSTM model is shown in Figure 3.
The specific values are shown in Table 8.
As can be seen from the graph, the LSTM model has individual error values that are large, but the overall prediction error is low and has high accuracy.
With the three scenarios of low carbon, baseline, and high carbon and the different settings of their prediction indexes, the data are organized and then imported into the LSTM model for prediction, thus obtaining the prediction results of the carbon emissions from highway construction in Hunan province under the three development scenarios in the period of 2022–2036, and the specific results are shown in Figure 4 and Table 9.
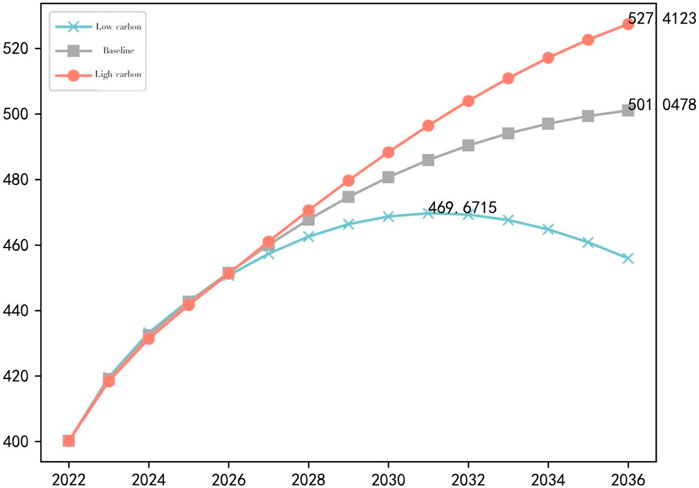
FIGURE 4. Carbon emission trends of highway construction projects in Hunan province under different scenarios.
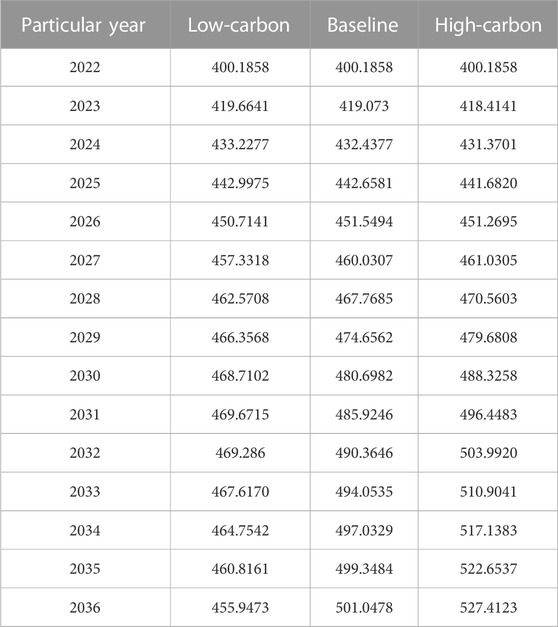
TABLE 9. Results of LSTM projections of carbon emissions for 2022–2036 (in tons).
Figure 4 shows the results of the LSTM model prediction of future carbon emissions from highway projects in Hunan province under different scenarios, from which the trend change of future carbon emissions can be seen.
(1) Comparison of the trends: The years in which carbon emissions peak under different scenarios are different. The results show that as of 2036, the low-carbon scenario will peak in 2031, the baseline scenario will peak in 2037, and the high-carbon scenario is expected to peak around 2044.
(2) Total carbon emissions are analyzed: Carbon emissions increase under the low-carbon scenario, the baseline scenario, and the high-carbon scenario, in that order. Under the three different scenarios, there is a large gap in carbon emissions, with the low carbon peaking at 469.6715 tons and the high carbon yet to peak will reach 527.4123 tons.
(3) Analyzing the growth rate of carbon emissions: The average growth rate of carbon emissions in Hunan province in the last 5 years is 6.26%, 2022–2036; the average growth rate of carbon emissions under the three scenarios increases in the order of low carbon, baseline, and high carbon, which is 0.94%, 1.62%, and 1.99%, respectively, and all of them are lower than the average growth rate in the last 5 years.
(4) All three scenarios for the first year of the forecast, 2022, show a substantial increase relative to 2021, due to the impact of the new crown epidemic. In 2021, the society was still under epidemic control, and after the initial liberalization of the new crown epidemic policy, projects began to return to normal construction. Therefore, the real data of carbon emissions in 2021 have a large rebound compared to 2020, with a growth rate of 15%, which appears clearly different from the anomalies of other years, due to which the forecast results may be overall large. However, with the new crown epidemic having been fully liberalized, this effect is no longer present in subsequent years.
In summary, under the baseline scenario, that is, under the existing economic and social development level and highway construction planning in Hunan province and the implementation conditions of relevant emission reduction policies, the highway construction project in Hunan province cannot realize the goal of carbon peak before 2035, and it is expected to lag behind by 2 years, whereas under the low-carbon scenario, it can realize the carbon peak 4 years ahead of time with 2035 as the baseline, and the high-carbon scenario can realize the carbon peak with a delay of 9 years with 2035 as the baseline. This suggests that if Hunan province maintains the current level of carbon emissions, it will not be able to achieve the peak carbon target. This suggests that if Hunan province maintains its current highway construction and development plans, it will need to implement stronger energy conservation and emission reduction policies in order to effectively reduce the total amount and growth rate of carbon emissions.
Based on the scenario analysis method and the LSTM algorithm of the recurrent neural network, this paper constructs a carbon emission prediction model and carries out the carbon emission scenario prediction of highway projects in Hunan province as an example and obtains the following main conclusions:
(1) The carbon emission prediction index system of highway projects is constructed, and the relationship between various indexes and carbon emission of highway projects is sorted out. The results show that the key low-carbon technologies have the greatest impact on carbon emissions, which is also in line with the current academic research focusing on engineering technology research and development.
(2) Construction of the highway engineering carbon emission prediction model: Since the highway engineering carbon emission has not been monitored in the field, there is no accurate historical data, so first of all, we constructed the highway engineering carbon emission measurement model and, thus, completed the measurement of historical data in Hunan province. Then, using the advantage of deep learning, the prediction model with LSTM as the core algorithm was constructed, and a more excellent prediction model was obtained, and the relevant departments can draw on this model to predict, test, and refer to the regional highway carbon emissions.
(3) Scenario prediction of the carbon emission trend of highway projects in Hunan province from 2022 to 2036 was carried out. The results show that under the low-carbon scenario, highway construction in Hunan province can achieve carbon peak in 2031, under the baseline scenario, there is a two-year delay from the planned carbon peak in 2035, and the high-carbon scenario will have a serious lag and reach the peak in 2044; at the initial stage of the sub-scenario prediction, there is not much difference in the carbon emissions of the three scenarios, and the gap is gradually obvious with the time, which indicates emission reduction. This indicates that the implementation of the policy has a certain lag in the impact of carbon emissions from highway projects.
(4) Based on the results of scenario prediction in Hunan province, we propose countermeasures for carbon emission reduction in regional highway development from the perspectives of socio-economics, green technology, and development planning. Based on the results of the scenario prediction in Hunan province, the countermeasures for carbon emission reduction of regional highway development are proposed from the perspectives of socio-economy, green technology, and development planning, which are of certain reference value for the relevant departments of highway construction to formulate development planning.
(1) Adjusting the structure of energy consumption and reducing the intensity of energy consumption
At present, China’s electricity mainly relies on coal, further reducing the proportion of coal in energy consumption and using more natural gas, solar energy, nuclear energy, and other energy sources that replace coal. A reasonable energy structure will help promote the energy-intensive highway construction projects to achieve carbon peak.
(2) Appropriately slowing down the urbanization process and keeping highway construction in sync with urbanization development
The promotion of urbanization is the most fundamental reason for highway construction. Based on the current urbanization planning goal of Hunan province, in order to achieve peak carbon as soon as possible, planning adjustments can be made from the root, that is, to appropriately slow down the process of urbanization, and the simultaneous development of highway development speed will be slowed down.
(3) Actively cultivating outstanding scientific and technological talents to improve the research and development of low-carbon technology
In the process of highway construction, the application of low-carbon engineering technology plays a vital role in carbon emission reduction. The construction and development of the relevant disciplines and specialties in universities should be strongly supported and a series of favorable policies to ensure the high-quality development of the disciplines and specialties should be formulated, in order to lay the foundation for the training of talents. At the same time, the construction of highway technology research and development centers should be actively promoted, and there should be a wide range of absorption of talent to focus on energy saving and emission reduction in the research and development of the neck of the problem, for the future of more key low-carbon technology research and development to create a good environment.
(4) Increasing green financial support
At present, many highway construction enterprises are reluctant to use some of the advanced technologies, which is an important reason for the funds, leading to the decline of the project’s benefits. In view of this situation, the relevant departments should increase the green financial support and give different degrees of financial subsidies to the enterprise projects that actively use low-carbon technologies to promote the application and promotion of green low-carbon technologies in the actual engineering and construction projects.
The original contributions presented in the study are included in the article/Supplementary Material; further inquiries can be directed to the corresponding author.
QW: conceptualization, data curation, formal analysis, methodology, visualization, and writing–review and editing. YC: conceptualization, supervision, and writing–review and editing. CL: supervision and writing–original draft. XS: writing–review and editing.
The authors declare that no financial support was received for the research, authorship, and/or publication of this article.
The authors declare that the research was conducted in the absence of any commercial or financial relationships that could be construed as a potential conflict of interest.
All claims expressed in this article are solely those of the authors and do not necessarily represent those of their affiliated organizations, or those of the publisher, the editors, and the reviewers. Any product that may be evaluated in this article, or claim that may be made by its manufacturer, is not guaranteed or endorsed by the publisher.
Bingxiao, L., Shiwei, Z., and Feihu, H. (2022). Power load forecasting based on LSTM and self attention mechanism. China Meas. Test 48 (S2), 38–43.
Donglei, Z., and Yisheng, L. (2019). Carbon emission prediction of China’s construction industry based on system dynamics. Henan Sci. 37 (12), 2025–2033.
Guangtai, Z., Rui, P., Pingan, N., and Shuwen, D. (2021). Artificial neural networks for predicting the construction industry’s carbon emission intensity: taking beijing-tianjin-hebei as an example. Sci. Technol. Industry 21 (9), 15–20.
Guangyuan, S. (2013). Comparative analysis of the endogenous carbon-emission in the expressway construction period. Highw. Eng. 38 (4), 203–206.
Huaquan, Y. (2015). Scenario-based prediction of building carbon emissions and peak control strategies in hubei Province. [master’s thesis]. Huazhong University of Science and Technology.
Huiying, W. (2022). Study on carbon emission calculation and prediction of guangxi expressway construction period. Guangxi University. [master’s thesis].
Jianchun, Y. (2023). China becomes an important force to pull global green low-carbon technology innovation. China’s Foreign Trad. (3), 32–34.
Shipeng, D. (2021). Research on stock index forecast based on deep model. Mod. Inf. Technol. 5 (16), 100–101+104.
Xiaodie, L. (2022). Research on provincial carbon emission scenario prediction and carbon peak path in China. Anhui University of Science and Technology. [master’s thesis].
Xiaosong, R., and Guohao, Z. (2014). Gray forecasting of China’s industrial carbon emissions and its influencing factors —a study based on the STIRPAT model. J. Beijing Jiaot. Univ. Soc. Sci. Ed. 13 (4), 18–24.
Ying, Z., and Shuangshuang, S. (2022). Calculation and analysis of carbon emission from expressway construction. Value Eng. 41 (8), 156–158.
Yuanyuan, L., Wang, Y., Li, Di, and Yu, Q., (2019). Life cycle assessment for carbon dioxide emissions from freeway construction in mountainous area: primary source, cut-off determination of system boundary. Resour. Conservation Recycl., 14036–14044.
Yun, C., Chan, L., and Jingjing, L. (2019). The carbon emission calculating model of the asphalt pavement construction machineries of highway. Highw. Eng. 44 (1), 140–144.
Keywords: highway construction project, carbon emission, scenario prediction, LSTM model, Hunan province
Citation: Wu Q, Chen Y, Li C and Shi X (2024) Carbon emission scenario prediction for highway construction projects. Front. Environ. Sci. 11:1302220. doi: 10.3389/fenvs.2023.1302220
Received: 27 September 2023; Accepted: 12 December 2023;
Published: 04 January 2024.
Edited by:
Marco Casazza, University of Salerno, ItalyReviewed by:
Hassan Hashemi, Iran University of Science and Technology, IranCopyright © 2024 Wu, Chen, Li and Shi. This is an open-access article distributed under the terms of the Creative Commons Attribution License (CC BY). The use, distribution or reproduction in other forums is permitted, provided the original author(s) and the copyright owner(s) are credited and that the original publication in this journal is cited, in accordance with accepted academic practice. No use, distribution or reproduction is permitted which does not comply with these terms.
*Correspondence: Yun Chen, Y2hlbnlAY3N1c3QuZWR1LmNu
Disclaimer: All claims expressed in this article are solely those of the authors and do not necessarily represent those of their affiliated organizations, or those of the publisher, the editors and the reviewers. Any product that may be evaluated in this article or claim that may be made by its manufacturer is not guaranteed or endorsed by the publisher.
Research integrity at Frontiers
Learn more about the work of our research integrity team to safeguard the quality of each article we publish.