 Fei-Fei Ye1
 Si-Rui Han
95% of researchers rate our articles as excellent or good
Learn more about the work of our research integrity team to safeguard the quality of each article we publish.
Find out more
ORIGINAL RESEARCH article
Front. Environ. Sci. , 10 November 2023
Sec. Environmental Economics and Management
Volume 11 - 2023 | https://doi.org/10.3389/fenvs.2023.1301091
This article is part of the Research Topic Greenhouse Gas Emission (GHG) Reduction and Economic Structural Transformation View all 18 articles
The completeness of indicator information is a critical issue that requires further investigation in the evaluation of carbon emissions management efficiency. However, this problem has not received adequate attention in existing studies, and there is a dearth of analysis using the total factor productivity method, which has proven effective in evaluating efficiency in various domains. Consequently, this study proposes a model for evaluating carbon emissions management efficiency that integrates indicator information and employs the data envelopment analysis (DEA)-Malmquist index. The integration of indicator information is accomplished through the evidential reasoning (ER) approach, which includes the calculation of indicator weights. The DEA-Malmquist index is utilized to assess the efficiency of carbon emissions management and analyze its total factor productivity based on the integrated indicator information. To demonstrate the efficacy of the proposed model, a case study of 17 corporates in China from 2019 to 2021 is provided to illustrate the analysis of three scopes efficiency distribution, efficiency change and improvement strategy of carbon emissions management. Results discussion show that the proposed model can be used to provide a reference for the improvement effectiveness of carbon emissions management.
As the global economy undergoes rapid expansion, society faces a complex balance between reducing carbon emissions and promoting economic growth. When carbon emissions exceed the environmental capacity, it exacerbates the challenges related to environmental remediation and management, putting the sustainability of economic progress at risk. Consequently, optimizing the strategy for carbon emissions management has emerged as a critical priority in our endeavor to mitigate the adverse effects of climate change and environmental degradation, and to achieve sustainable development.
Existing studies shed light on significant regional discrepancies in the efficiency of carbon emissions management within China, influenced by factors such as GDP, level of industrialization, and technological innovation. Ongoing research endeavors strive to refine methodologies, including various DEA models, to enhance their resilience against uncertainties. However, in the selection of DEA carbon emissions management related indicators, careful consideration must be given to determining the appropriate number of indicators. The DEA theory adheres to the rule of thumb, which suggests that the number of decision-making units should be at least 2 to 3 times greater than the number of evaluation indicators. An excessive number of input-output indicators for decision-making units tends to result in efficiencies converging towards 1, thereby diminishing the distinctiveness among decision-making units. Conversely, an inadequate number of indicators renders the decision-making process susceptible to errors and the loss of vital indicator information.
Simultaneously, it becomes apparent that the evaluation of carbon emissions management efficiency is influenced by various indicators to different extents (Ramón et al., 2016; Chen et al., 2017). Inadequate availability and knowledge limitations have resulted in a constrained selection of output indicators for efficiency assessment that is subject to debate as to its sufficiency (Yu et al., 2016; Costa-Campi et al., 2017). One notable limitation of this indicator selection approach is its inherent failure to encompass the comprehensiveness of output indicators in emissions management. For example, Chen et al. (2017) exclusively considered SO2 as an output indicator to represent waste gas emissions, thereby overlooking other pertinent indicators such as O3, smoke, and dust emissions. Furthermore, the majority of studies have ascribed equal significance to diverse input and output indicators within the system modeling of carbon emissions management, despite the evident disparity in their roles. While certain existing research has incorporated weight calculation (Yang et al., 2019), application of these weighting methods within the realm of carbon emissions management has been limited. Consequently, future studies on carbon emissions management must confront numerous challenges that remain unresolved.
Firstly, it is worth noting that the existing body of research on the evaluation of carbon emissions management efficiency has displayed inconsistencies, primarily stemming from variations in the selection of indicators. Different methodologies for indicator selection have yielded divergent outcomes in terms of the chosen indicators. Given that indicator selection plays a pivotal role in the assessment of carbon emissions management efficiency, this inconsistency poses challenges. Notably, previous studies have predominantly relied on experts’ experiences or empirical judgment to guide their indicator selection process (Chen et al., 2017). Consequently, the accuracy and objectivity of the evaluation of carbon emissions management efficiency can be significantly affected by this subjective approach to indicator selection; Secondly, it is worth noting that the previous studies on evaluating the efficiency of carbon emissions management have overlooked the significance of ensuring the integrity of indicator information. This oversight arises from the potential loss of indicator information and its subsequent impact on the evaluation results. Concurrently, it is imperative to consider the thumb rule within the framework of DEA theory, which necessitates the inclusion of two to three times the number of decision-making units (DMUs) compared to the total number of evaluation indicators. Utilizing an excessive number of indicators in a DEA model can lead to a situation where the efficiency of all DMUs approaches unity, thereby reducing the differentiation among DMUs; Finally, it is worth noting that the prevailing body of research on the evaluation of carbon emissions management efficiency has primarily relied on statistical analyses to assess efficiency levels. However, the evolutionary trajectory of these efficiencies, particularly at the industry or corporate level, has been infrequently examined. As highlighted by Sheng et al. (2015), the examination of efficiency changes offers a valuable means of quantifying the rate of change in carbon emissions management efficiency. This approach proves instrumental in comprehensively assessing issues associated with the input-output structure via the lens of efficiency fluctuations.
To address the aforementioned challenges associated with the evaluation of carbon emissions management efficiency, this study introduces a novel efficiency evaluation model. The key components of this model are as follows: 1) the determination of relative weights for different input, undesirable and desirable output indicators pertaining to carbon emissions management; 2) the integration of the set of undesirable output indicators and desirable output indicators, based on the obtained weights, utilizing the evidential reasoning (ER) approach to generate new combined indicators; 3) the utilization of the integrated indicators in conjunction with the DEA model and Malmquist index to assess the efficiency of carbon emissions management. Consequently, the proposed model makes the following contributions to the evaluation of carbon emissions management efficiency:
1) The Correlation Coefficient and Standard Deviation (CCSD) method is employed to compute the relative weights of diverse input, undesirable, and desirable output indicators that are pertinent to carbon emissions management. This method is specifically designed to allocate appropriate significance to each indicator within the comprehensive evaluation process;
2) The integration of input, undesirable, and desirable output indicators is achieved through the use of the ER approach, thereby circumventing the loss of pertinent information and adhering to the fundamental principles of the DEA model. This integration mechanism enables the comprehensive analysis of the various indicators, ensuring their collective consideration and evaluation within a unified framework;
3) The utilization of integrated indicators plays a pivotal role in facilitating the efficiency evaluation of carbon emissions management through the adept application of the DEA model and the Malmquist index. These analytical tools provide a rigorous methodological framework for comprehensively assessing the efficiency of carbon emissions management founded upon the integrated indicators. By addressing the limitations encountered in prior research, this innovative model aims to contribute to a more precise and holistic evaluation of the efficiency of carbon emissions management.
In order to validate the effectiveness of the proposed model, a comprehensive case study is conducted using input, desirable output, and undesirable output indicators as well as data pertaining to carbon emissions management from 17 corporations in China. The dataset encompasses the period spanning from 2019 to 2021. Through this empirical analysis, multiple efficiency-related outcomes are computed, thereby presenting a research framework for the management of carbon emissions in China. Furthermore, the evaluation results of carbon emissions management efficiency highlight significant disparities between comprehensive efficiency and pure technical efficiency during different management periods. Notably, both overall environmental efficiency and pure technical efficiency demonstrate an upward trajectory within these Chinese corporations. This suggests that the positive impact of the existing input-output structure and technical aspects on the comprehensive efficiency of carbon emissions management becomes increasingly pronounced over time.
The escalating issue of carbon emissions necessitates effective scientific management to mitigate its detrimental impact on the global climate and environment. Consequently, an increasing number of scholars have directed their attention towards conducting research on the analysis of influencing factors and addressing the myriad challenges that arise from carbon emissions. Presently, investigations pertaining to carbon emissions predominantly center around exploring the connection between energy consumption and carbon emissions, examining the influencing factors associated with carbon emissions, and developing evaluation model for carbon emissions management.
(1) The connection between energy consumption and carbon emissions. The relationship between energy consumption and carbon dioxide emissions has garnered significant attention in light of the pressing issues of climate change and global warming. Researchers have consistently highlighted that carbon dioxide emissions play a crucial role in environmental hazards (Ali et al., 2022). Several studies have underscored the viability of adopting clean and renewable energy as a viable approach to mitigate carbon dioxide emissions (Zarezade and Mostafaeipour, 2016; Samuel et al., 2019). To empirically analyze the impact of energy consumption on environmental degradation, TailonAlisson et al. (2021) proposed the ARDL bounds testing approach, which was applied to G7 countries. Findings revealed that coal, oil, and natural gas consumption had a positive influence on environmental degradation. Similarly, Samuel and Christian, (2019) noted that renewable energy sources contributed more significantly to environmental degradation than nonrenewable energy sources. In an effort to achieve sustainability and energy efficiency goals in China, Zhang et al. (2021a) evaluated the impact of hydroelectric and renewable electricity generation on carbon dioxide emissions while examining the relationship between renewable energy consumption and carbon dioxide emissions. Furthermore, multiple authors have proposed methods for assessing energy-related carbon dioxide emissions and have conducted analyses to outline dynamic low-carbon energy paths towards 2030 (Lin and Agyeman, 2020).
(2) Influencing factors associated with carbon emissions. The analysis of influencing factors related to carbon dioxide emissions has been the focus of previous research. For instance, Wen and Shao (2019) conducted a panel data analysis to investigate the drivers of carbon dioxide emissions in the commercial sector in China. Their findings revealed that diverse influencing factors exerted varying nonlinear effects on carbon dioxide emissions. Additionally, Hang et al. (2019) examined the factors impacting economic growth and carbon dioxide emissions in the manufacturing industry, illustrating that the adjustment of carbon dioxide emissions density falls short of achieving the anticipated reduction outcomes. Reducing carbon emissions and fostering a low carbon economy constitute important objectives, as highlighted by Wang and Ma (2018) who employed the Tobit model to examine influencing factors on the efficiency of carbon dioxide emissions. Furthermore, Liang et al. (2019) emphasized energy intensity as a significant factor influencing carbon dioxide emissions, revealing a consistent upward trend in carbon dioxide emissions from high energy consumption sectors in China.
(3) Efficiency evaluation of carbon emissions management. The examination of carbon emissions management efficiency is a topic that has garnered significant attention within academic circles. An emerging trend in the academic discourse on this subject has been observed in recent years, with the primary focus of research on carbon emissions management being empirical analysis and practical studies (Hong et al., 2016; Makkonen and Repka, 2016; Cheng et al., 2017). Within the specific context of China, the evaluation of carbon emissions management efficiency has been rigorously explored by scholars, with particular emphasis on variances across different sectors and regions. A study by Zhang et al. (2021b) scrutinized the efficiency of carbon emissions in the Chinese construction industry, underlining the substantial impact of factors such as GDP, level of industrialization, and technological innovation. Similarly, Meng et al. (2016) performed an extensive review employing DEA-type models, revealing both stability and regional inconsistencies in energy efficiency and carbon emissions efficiency during the course of China’s Five Year Plan.
Building upon previous research, Yan et al. (2017) conducted an analysis of China’s power industry, which is responsible for approximately 40% of the nation’s carbon emissions. Their findings indicated that the wealthier provinces on the eastern coast demonstrated higher carbon emission efficiency, and that interregional technological collaboration could further enhance this efficiency. In a similar vein, Cheng et al. (2018) employed an enhanced non-radial directional distance function, revealing a substantial opportunity for efficiency improvement across several provinces. Their research underscored the importance of technical advancement in fostering efficiency. Qu et al. (2022) tackled uncertainties related to climate and governmental economic policy through the use of a robust DEA model. They advocated for the adoption of a green and low-carbon lifestyle, a transformation in energy structures, and the promotion of coordinated regional development.
In this section, Subsection 3.1 presents the methodology for calculating weights for carbon emissions-related indicators, while Subsection 3.2 introduces the ER approach (Wang et al., 2006) for the integration of indicator information.
In the domain of carbon emissions management across diverse enterprises, a variety of distinct indicators exists, each holding its unique degree of importance. To ascertain the importance of these disparate indicators, an esteemed weight calculation mechanism known as the Correlation Coefficient and Standard Deviation (CCSD) method (Wang and Luo, 2010) is utilized. This particular technique enables the determination of indicator weights, underpinned by the collected environmental data, thereby bestowing a rigorous and quantifiable measure of each indicator’s contribution to the comprehensive emissions management schema.
Assumes that carbon emissions management contains T related indicators Ct (t = 1,…, T) and each indicator has S collected data vs,t (s = 1,…, S). Since the collected data is a dimensional representation, it needs to be dimensionless standardized. According to the different characteristics of indicators, the specific standardization is as follows:
where Ωbenefit denotes the set of benefit indicators, whose values are always the larger the better; Ωcost denotes the set of cost indicators, whose values are always the smaller the better; es,t denotes the tth normalized value of the sth indicator.
Based on the S×T normalized values, the correlation coefficient of the tth indicator, denoted as Rt, can be calculated when assuming that the weights of T indicators are wt (t = 1,…, T). The specific formula of calculating Rt is as follows:
where
Here, it is worth noting that if Rt is close to one, then the tth indicator has a little influence on carbon emissions management and it can be assigned a small weight; Otherwise, the weight of the tth indicator should be large. Additionally, the standard deviation of the tth indicator, denoted as
According to the T correlation coefficients and T standard deviations, a revised weight for each indicator, symbolized as
Ultimately, given that the T initial weights wt are premised on the assumption of equality with the T new weights
In the context of efficiency evaluation for carbon emissions management, certain numerical conditions must be met pertaining to the counts of inputs, outputs, and DMUs. For instance, the number of DMUs should surpass twice the sum of the quantity of inputs and outputs, as stipulated by Golany and Roll (1989). Consequently, the ER approach (Wang et al., 2006), derived from the Dempster-Shafer theory of evidence and recognized for its robust capabilities in information fusion, is deployed for the integration of indicator information. Thus, in this study, the input related indicators, desirable output related indicators and the three types of carbon emissions are integrated by the proposed ER model for carbon emissions evaluation.
Assuming that carbon emissions management incorporates T related indicators, denoted as Ct (t = 1,…, T), each indicator carries a weight wt (t = 1,…, T) derived from Section 2.1 and shares a set of mutually exclusive and collectively exhaustive evaluation grades, represented as H = {H1,…, HN}. In accordance with the N grades, the distribution assessment of each indicator, symbolized as S(Ct), can be defined as follows:
In the above equations (Eq. 9),
Based on the distributed assessments and T weights, the basic probability assignments (BPAs) for each indicator can be calculated by:
where
According to the analytical ER algorithm (Chen et al., 2017), the BPAs of T indicators can be integrated as the BPAs of a new integrated indicator, namely, indicator information integration. The corresponding formulas are as follows:
Thus, the BPAs of the integrated indicator is then transformed into the distributed assessment
Meanwhile, the belief degree of uncertainty is calculated by:
Finally, efficaciously represent the integrated indicator information, the distributed assessment should be transmuted into a numeric value. Therefore, when u(Hn) denotes the utility of the n-th grade, the utility value of the integrated distributed assessment is computed using the following equation:
In this section, Subsection 4.1 introduces the concept of efficiency evaluation considering undesirable outputs. Subsequently, Subsection4.2 proposes the dynamic efficiency evaluation utilizing the Malmquist index. It is worth noting that the input related indicators, desirable output related indicators and the three types of carbon emissions of each DMU in DEA undesirable output model and DEA-Malmquist index are integrated based on the Section 3.
In the realm of carbon emissions management, undesirable outputs, such as varying degrees of CO2 in a corporate’s carbon emissions, are inevitable and significantly influence efficiency evaluation. To approach carbon emissions management in a more scientifically rigorous manner, this section incorporates a DEA undesirable output model (Seiford and Zhu, 2002). This model facilitates the evaluation of carbon emissions management efficiency considering undesirable outputs. The DEA undesirable output model, a variant of the DEA models employed for efficiency evaluation, holds comparative advantages over other DEA models (Wang et al., 2008; Wang and Wu, 2011; Song et al., 2018). These include the capability to evaluate efficiency for multiple inputs and outputs without the necessity for dimensionless data processing and weight assumption.
Within the framework of the DEA undesirable output model, assuming the existence of n DMUs with m input indicators, s desirable output indicators and h undesirable output indicators, then the input data, desirable output data, and undesirable output data of n DMUs can be denoted as X, Y and Z, respectively.
Next, according to the input data X, desirable output data Y and undesirable output data Z shown in Eqs 22–24, the following optimization model can be used to evaluate the efficiency of each DMU with consideration of undesirable outputs and the condition of constant returns to scale
where
Finally, the efficiency value
Additionally, in circumstances where an increase or decrease in inputs or outputs leads to a proportional change in the outputs or inputs, i.e., a phenomenon termed variable returns to scale, is also an extra constraint needs to be integrated into the optimization model outlined in Eq. (25). This adjustment enables the evaluation of each DMU’s efficiency considering undesirable outputs under variable returns to scale.
The efficiencies derived from Section 4.1 are static in nature and often fail to encapsulate the evolution of comprehensive efficiency and technical efficiency. To effectively implement carbon emissions management, it is essential to consider dynamic efficiencies. To this end, the Malmquist index (Fare et al., 1992) is incorporated to enrich the efficiency evaluation of carbon emissions management.
In the course of dynamic efficiency evaluation, let’s assume that the input data, desirable output data, and undesirable output data for the tth period are denoted as X t, Yt and Z t, respectively. The Malmquist index formula, which tracks changes from the tth period to the t+1th period, is defined as follows:
In the above equations (Eq. (28)),
In the above equations (Eq. (29)), EC and TC represent the efficiency change and the technical change respectively. An EC value greater than 1 signifies an improvement in the efficiency of carbon emissions management; an EC value equal to 1 indicates that the efficiency of carbon emissions management remains unchanged; and an EC value less than 1 suggests a reduction in the efficiency of carbon emissions management.
When the efficiency evaluation of carbon emissions management is assumed to be variable returns to scale, ECc can be further decomposed into the following two components:
In the above equations (Eq. (30)), PTEC and SEC denote the pure technical efficiency change and the scale efficiency change;
Building on the ER-based indicator information integration delineated in Section 3, and the DEA-Malmquist index-based efficiency evaluation illustrated in Section 4, this section proposes a framework for a carbon emissions management efficiency evaluation model. The main process of this model is depicted in Figure 1.
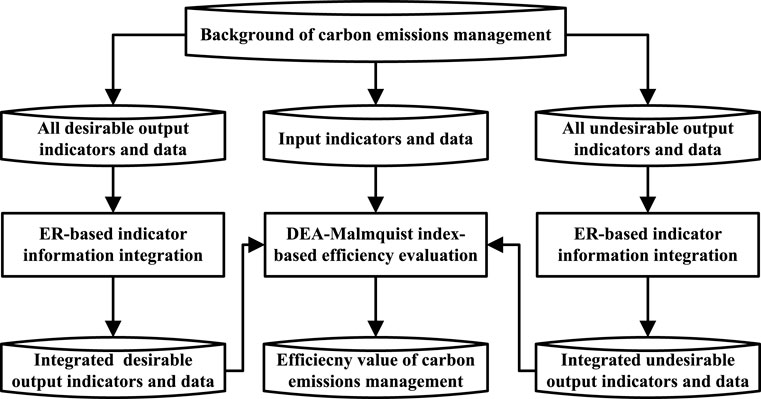
FIGURE 1. Framework of carbon emissions management efficiency evaluation.
From Figure 1, the detailed steps for carbon emissions management efficiency evaluation include:
Step 1: ER-based indicator information integration for desirable and undesirable output indicators. Suppose that there are s desirable output indicators and h undesirable output indicators and their data are collected from n corporates and T years, namely,
Step 2: DEA-Malmquist index-based efficiency evaluation based on the integrated desirable and undesirable output data. Suppose that there are m input indicators and their data collected from n corporates and T years are
This section of the study focuses on the preprocessing of carbon emissions management data obtained from a sample of 17 Chinese corporates, spanning the timeframe of 2019–2021. With the approaching implementation of the “dual-carbon target,” the capital market in China is concurrently experiencing an upsurge in carbon investment. To meet this demand, China has taken preliminary steps to establish a green financial system. Accordingly, this article, taking into account the unique characteristics of the Chinese market and companies, has gathered company-level carbon emission data that aligns with the Chinese investment environment. The data sources utilized encompass revenue breakdown data, carbon emission disclosure data, and pollutant emission data. Revenue breakdown data primarily originates from company annual reports and issuance disclosures, carbon emission disclosure data is derived from corporate social responsibility reports, and pollutant emission data is sourced from the National Pollutant Discharge Permit Management Information Platform. The database coverage encompasses A-shares, Hong Kong stocks, Chinese concept stocks, and bond-issuing enterprises, encompassing the time period from 2019 to 2021. Considering the availability of carbon emission data and the associated indicators, and after employing appropriate techniques to address missing data and indicators, this article ultimately derived a comprehensive dataset and indicator set relating to carbon emissions for the 17 selected corporates.
Detailed information about these corporates is provided in Table 1. Following the specific procedures outlined in Section 4, the efficiency of carbon emissions management and its corresponding technical change efficiency are analyzed, leveraging integrated indicators. Finally, the strategies to enhance carbon emissions management are also proposed.
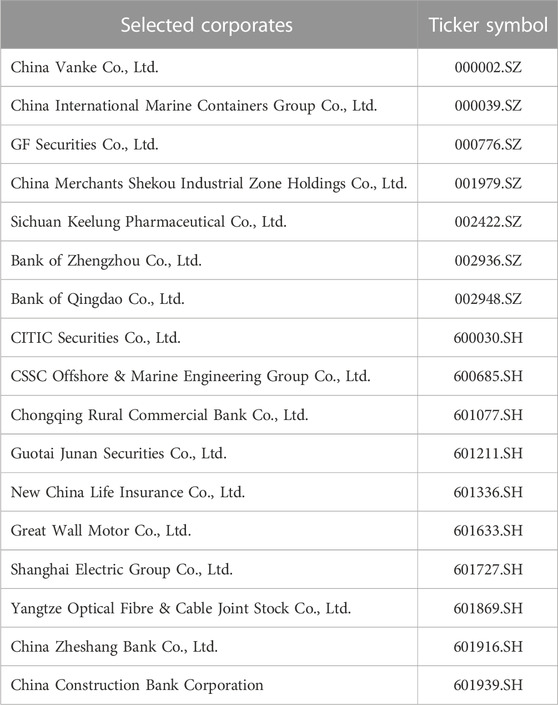
TABLE 1. The information of the 17 selected corporates.
This study adheres to a well-established framework for corporate carbon emissions indicators, as outlined by Ye et al. (2019a, 2019b). In line with this framework, both undesirable and desirable outputs are considered as significant indicators for carbon emissions management. Building on existing literature, the desirable outputs selected for evaluation include main business income, market capitalization, rate of return on equity, and earnings per share. On the other hand, the evaluation of the efficiency of carbon emissions management focuses on three categories of undesirable outputs, specifically direct carbon emissions, process carbon emissions, and final product carbon emissions.
The input indicators in this study are classified into three distinct categories: labor input, asset investment, and capital input. Labor input is quantified through various metrics, such as the number of employees, average employee salary, rate of salary per share, and salary growth. Asset investment is assessed based on the total assets and net assets per share of the corporations under examination. Capital input, on the other hand, is determined by analyzing the capital expenditure and the ratio of income tax to total profit. It is worth noting that among the 17 corporates selected for analysis, significant disparities exist in terms of both input and output indicators for carbon emission control. Consequently, these variations indirectly imply disparities in carbon emissions and the fiscal advantages of individual corporations.
It is imperative to acknowledge that all the indicators mentioned above, including their historical data, can be derived from various sources. The revenue breakdown data can be primarily obtained from corporate annual reports and issuance disclosures, while carbon emission disclosure data can be acquired from corporate social responsibility reports. As for pollutant emission data, it can be sourced from the National Pollution Discharge License Management Information Platform of China. A comprehensive analysis of the integrated desirable output and undesirable output, derived from the indicator information integration based on the ER approach, alongside the three types of inputs, is presented in Table 2.
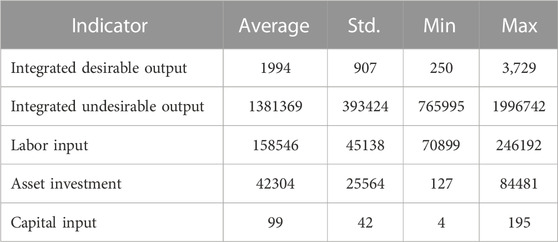
TABLE 2. Statistic analysis of input-output indicators.
To delineate the comprehensive details of both integrated desirable and undesirable outputs, the average values of these outputs across 17 corporations in China for each year are visually presented in Figure 2. Notably, Figure 2 highlights conspicuous disparities in the desirable and undesirable outputs among different corporations in the same year. However, it is observed that annual variations in both desirable and undesirable outputs among these corporations are relatively modest. Analysis of the publicly available data pertaining to these 17 corporations reveals no discernible transformations in their production and energy technologies from 2019 to 2021. Consequently, it becomes challenging to effectively discern short-term changes in carbon emissions for these enterprises at present.
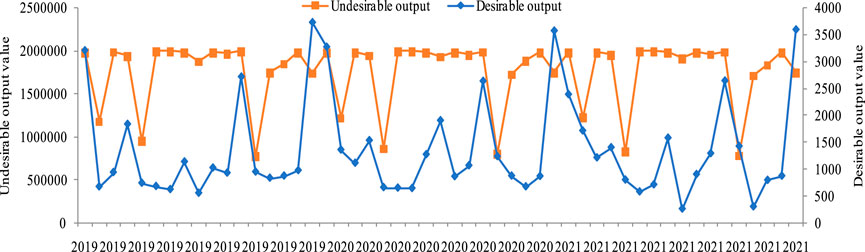
FIGURE 2. Integrated desirable and undesirable output from 2019 to 2021.
Consequently, this article aims to assess the carbon emissions of various corporations through a lens focused on the production process. The research outcomes depicted in Figure 3 demonstrate that, in the case of the majority of corporations, both direct carbon emissions and carbon emissions stemming from the production process far surpass those resulting from final products. Notably, many corporations exhibit the highest carbon emissions during the production process, which underscores the strong correlation between this stage of operations and the prevailing deficiency in the adoption of clean technology innovations within the production technologies employed by Chinese corporations.
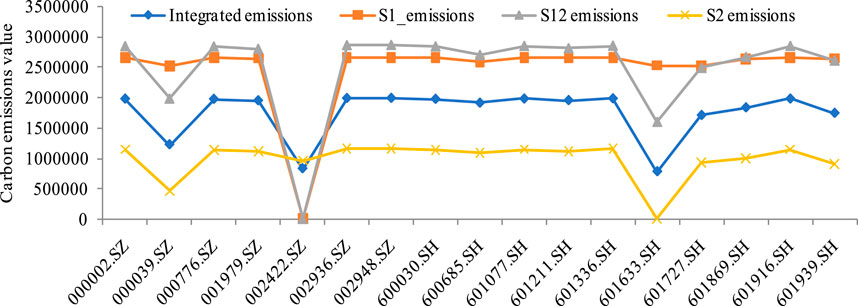
FIGURE 3. Different Scopes of Carbon Emissions of 17 corporates in 2021.
In an effort to examine the variations in carbon emissions management efficiency across different corporations and to identify the underlying factors driving such efficiency fluctuations, this study employs a proposed model to calculate the annual changes in carbon emissions management efficiency for each individual corporation.
By leveraging a comprehensive dataset obtained over a 3-year period encompassing 17 corporations in China, this paper computes the relative efficiency of each corporation’s carbon emissions management. These corresponding efficiencies are visually presented in a clear and comprehensive manner in Figure 4.
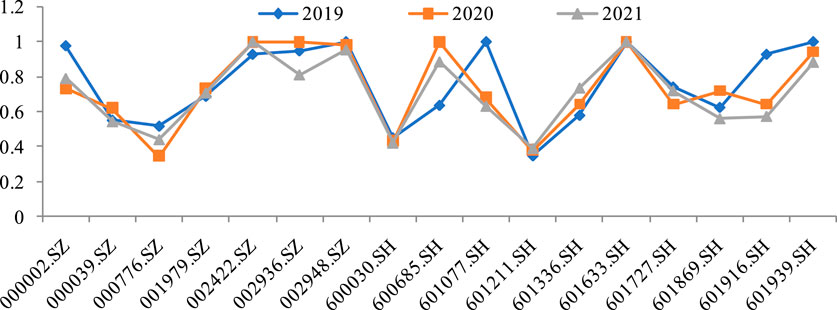
FIGURE 4. Comprehensive efficiency of different corporates from 2019 to 2021.
Upon evaluating the efficiency of carbon emissions management from 2019 to 2021, it becomes evident that only one corporation has achieved the optimal level of carbon emissions management, as reflected by an efficiency value of 1. Conversely, the remaining 16 corporations consistently fail to attain the threshold of relative efficiency during any given year. The majority of these corporations exhibit management efficiency scores that persistently fall below 0.8, with some corporations even demonstrating a discernible downward trend in efficiency values across the considered period.
From the standpoint of returns to scale, Figure 5 illustrates that the carbon emissions management income of each corporation exhibited an upward trend from 2019 to 2021. This pattern suggests that there is still significant room for improving management efficiency through increasing input factors. However, a subset of corporations experienced diminishing returns to scale, indicating that excessive investments in carbon emissions management resulted in redundant outputs. For these corporations, optimizing input resources becomes a key concern. Furthermore, on a broader scale, the carbon emissions management efficiency among the 17 examined corporations varies significantly, highlighting disparities in management capabilities. Consequently, the carbon emissions management efficiency of individual corporations has not effectively improved over time. These findings underscore the importance of rational allocation of input-output structures and the development of effective carbon emissions management policies as crucial factors in addressing current challenges in carbon emissions management in China.
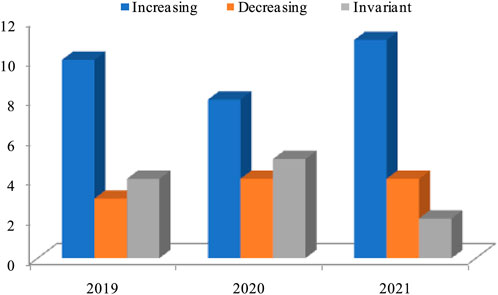
FIGURE 5. Number of corporates in different returns to scale from 2019 to 2021.
To highlight the disparities in the efficiency of carbon emissions management, Figure 6 presents the average efficiency across three types of carbon emissions management from 2019 to 2021 for 17 corporates in China. Through an encompassing analysis, it becomes evident that the carbon emissions management efficiency in 2019 surpasses that of subsequent years, with 2021 registering the lowest efficiency.
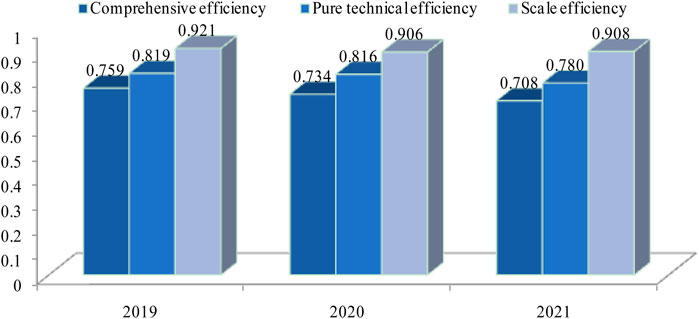
FIGURE 6. Efficiency distribution of different regions in China.
In addition to the impact of economic and resource endowment shifts over the years, substantial discrepancies are observed in the pure technical efficiency of carbon emissions management across different years for these 17 corporates. This is largely attributable to variations in the level of economic development and policy changes. The pure technical efficiency and scale efficiency in 2019 and 2020 are notably higher than those in 2021 across the 17 corporates. This underscores the significant challenge of balancing economic development with sustainable environmental protection within the industrial production processes in China.
In the subsequent section, this study delves into the temporal dynamics of carbon emissions management efficiency. Figure 6 presents the results obtained from the assessment of efficiency using the DEA-Malmquist index. Subsequently, Figure 7 demonstrates the variables EC, PTEC, EC, and TFPC, all indicating a decline in the efficiency of carbon emissions management.
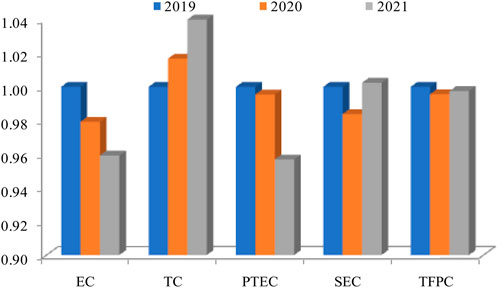
FIGURE 7. Carbon emissions management efficiency change from 2019 to 2021.
A close examination of these figures reveals a discernible downward trajectory in the overall efficiency of carbon emissions management among the 17 included corporations over time. Despite notable fluctuations, the prevailing trend unequivocally points towards a decrease in efficiency. Considering the rapid expansion of these 17 corporations, the issue of carbon emissions necessitates continued attention and heightened significance.
Subsequently, Figure 8 illustrates the variations in carbon emissions management efficiency across different corporates. A perusal of Figure 8 reveals that the efficiency of carbon emissions management in the majority of corporates lacks stability. Despite the numerous shortcomings in China’s current carbon emissions management, there is a conspicuous absence of institutional standardization in the carbon emissions management process. This lack of standardization impedes industrial coordination and the stability of carbon emissions management.
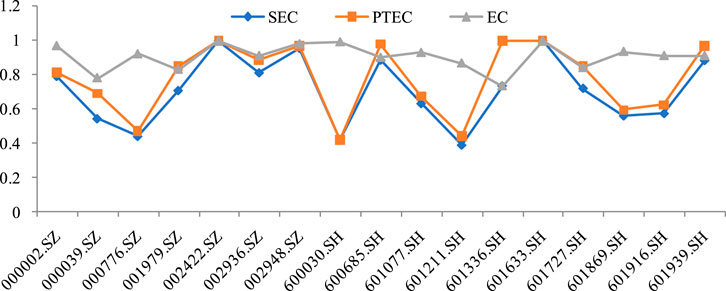
FIGURE 8. Carbon emissions management efficiency change in different corporates.
Furthermore, a comparative analysis conducted between the SEC and EC reveals that the integration of Pure Technical Efficiency Change (PTEC) into the framework yields enhanced efficiency and greater stability in the realm of carbon emissions management. In fact, the inclusion of PTEC facilitates a more intricate examination of the technical processes involved in the management of carbon emissions, enabling a more targeted identification of areas for improvement, such as resource optimization or the adoption of innovative technologies. Moreover, this approach not only augments the efficiency value but also imparts increased stability to the carbon emissions management efficiency. Stability, within this context, denotes the ability to consistently maintain high levels of efficiency over time. This aspect is of utmost importance in the realm of carbon emissions management, as a stable efficiency level signifies a corporation’s capacity to consistently and effectively handle its carbon emissions, thereby making noteworthy contributions towards sustainable development objectives.
In this section, this paper analyzes the comprehensive efficiency of carbon emissions management of 17 corporates in China from 2019 to 2021, which forms 51 analysis samples, and then analyzes the input and output indicators of the samples that fail to reach the effective efficiency according to these data, and obtains the number of provinces with unreasonable input-output indicators, which provides reference for the design of carbon emissions management efficiency improvement scheme, as shown in Figure 9. From the perspective of input redundancy, the situation of investment redundancy in environmental pollution control is more serious, which indicates that there are unreasonable investment resources and excessive investment in the implementation process of carbon emissions management in these corporates production process. The redundancy degree of the three input indicators is basically similar, and the number of provinces occupied by the three excessive investments is relatively large. However, from the perspective of output from 2019 to 2021, it can be found that the output is not reasonable.
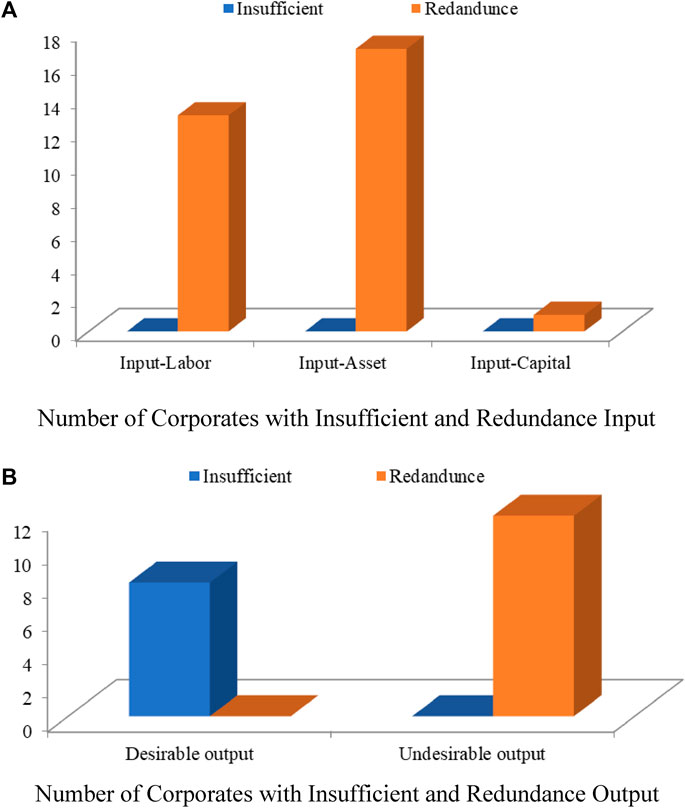
FIGURE 9. Number of corporates with redundant input and insufficient output.
Simultaneously, to dissect the structural disparities in regional carbon emissions management inputs and outputs, this study uses the carbon emissions management efficiency assessment for each corporate in 2021 as a representative example. Additionally, an adjustment scheme for each region’s input-output structure is proposed, the results of which are outlined in Table 3.
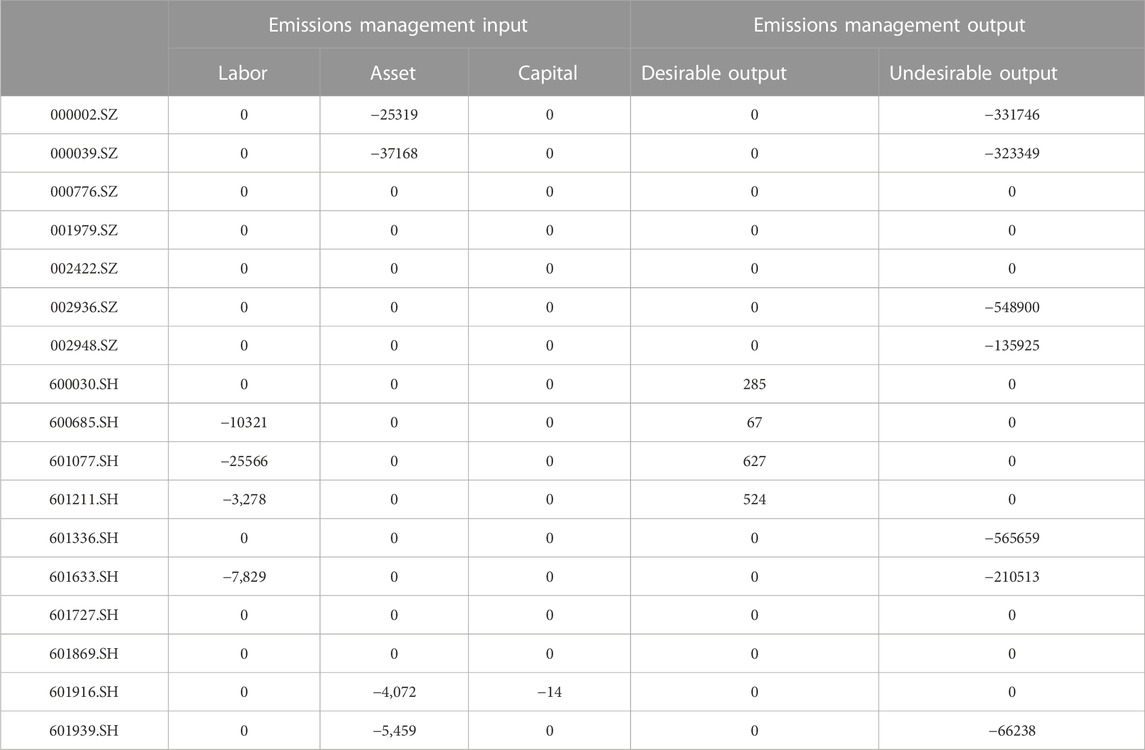
TABLE 3. Values of input-output adjustments in different corporates.
Table 3 offers a clear illustration that the crux of enhancing the efficiency of carbon emissions management is addressing the issues of input redundancy and the insufficiency of desirable output. Among the corporates, a scant few do not necessitate any adjustments to their inputs and outputs in 2021. The majority, however, must prioritize reducing input in carbon emissions management and tackle the issue of excessive emission of undesirable output.
With regard to the redundancy of the three input indicators—labor, capital, and environmental pollution control investment—labor input redundancy emerges as the most significant issue. The data suggest that one corporate’s labor input needs to be reduced by a considerable amount, specifically 25,566 units. This startling figure underscores the critical need for corporates to reassess their use of labor in the context of carbon emissions management.
This redundancy can often be attributed to an overabundance of input and the excessive consumption of resources, which is a symptom of sub-optimal planning and execution in the corporates’ production processes. Such an imbalance in the input structure can lead to substantial wastage of resources, both human and material. This is particularly concerning in a world where resource conservation and efficient usage are paramount to sustainable development and environmental protection.
Furthermore, this escalation in input, particularly in relation to environmental pollution control investment, does not correspond to a commensurate decrease in pollution levels. This disconnect implies that despite increased efforts and resources being directed towards managing carbon emissions, the desired results—in this case, reduced pollution—are not being achieved. This situation leads to a serious redundancy of pollution emissions.
In essence, the current state of affairs indicates a pressing need for these corporates to revisit their strategies and operational processes. The goal should be to optimize their use of labor and other resources, and ensure that investments in environmental pollution control are effective in actually reducing pollution. This could involve a range of measures, from implementing more efficient technologies to restructuring labor practices, all aimed at improving the overall efficiency of carbon emissions management.
To validate the efficiency of the carbon emission governance evaluation results presented in this article, Figure 10 illustrates the varying ranges of carbon emissions management efficiency. This delineation takes into account the inclusion of carbon emissions at distinct stages as undesirable outputs. By examining the research findings, notable discrepancies in the efficiency values, predicated on different carbon emission measurements, become apparent. This further substantiates the influence of the diverse indicators proposed in this article on the outcomes of efficiency evaluations. As a result, conducting assessments of carbon emission governance based on indicator integration becomes crucial to prevent any potential loss of pertinent information.

FIGURE 10. Different scopes of carbon emissions management efficiency.
Furthermore, to validate the thumb principle of the DEA model and assess the indispensability of indicator fusion, Figure 11 demonstrates the efficiency evaluation outcomes obtained through indicator integration. The graphic represents that carbon emission efficiency values for all corporations predominantly cluster around 1 without indicator integration. Nonetheless, a distinct divergence in efficiency values emerges after employing indicator integration, leading to a heightened level of differentiation. This enhanced differentiation is advantageous for decision-makers conducting efficiency evaluations and analysis, as it provides a more nuanced understanding of the performance variations among the corporations.
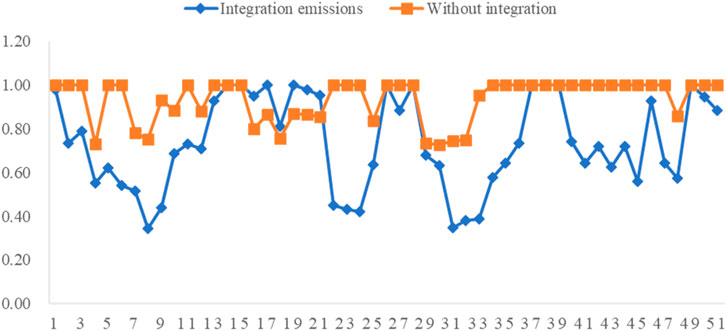
FIGURE 11. Different scopes of carbon emissions management efficiency.
Based on the carbon emissions management data from 2019 to 2021, the efficiency evaluation of carbon emissions management in 17 corporates of China was performed on the basis of indicator information integration by the ER approach with weight calculation method and DEA-Malmquist index. Additionally, the efficiency of different corporate-level carbon emissions management was further evaluated from the three scopes of efficiency evaluation and dynamic efficiency change. The main conclusions are summarized as follows:
Firstly, the analysis of carbon emissions management in various corporations in China revealed a lower level of comprehensive efficiency in this aspect. The examination of data further indicated that the comprehensive efficiency of carbon emissions management in these corporations has not witnessed significant improvement and remains unstable. The fluctuations in comprehensive efficiency are closely correlated with changes in pure technical efficiency, thereby suggesting a strong relationship between them. Furthermore, the analysis of scale benefits reveals an ongoing existence of an unsustainable input-output structure within each corporation, primarily stemming from inadequate investments in carbon emissions management, resulting in insufficient output.
Secondly, when examining the input-output structure, it becomes evident that redundancy exists within the majority of corporations, particularly in terms of labor input in carbon emissions management. Moreover, an analysis of the output reveals that the structure of desirable output is predominantly reasonable, but there exists significant redundancy in undesirable output. Besides optimizing input allocation, it is crucial to implement measures aimed at effectively reducing the emission of undesirable pollution output while ensuring a reasonable output structure.
Thirdly, in order to accurately assess the changes in comprehensive efficiency and pure technical efficiency of carbon emissions management over various time periods, the findings indicate notable distinctions between these two metrics. However, despite these variations, neither the overall efficiency nor the pure technical efficiency demonstrate a significant upward trend within these corporations in China. In other words, the positive impact of the current input-output structure and technical factors on the comprehensive efficiency of carbon emissions management has not yielded significant results over time.
Drawing upon the aforementioned conclusions, the study’s outcomes constitute a significant asset for scholars, corporations, and policymakers alike, as they strive collectively towards enhancing carbon emissions management, advancing sustainable development, and addressing the challenges posed by climate change. The identified imperative for critically reassessing and adapting current strategies becomes self-evident, with the overarching objective of optimizing efficiency, fostering sustainable growth, and making substantial contributions to broader endeavors aimed at mitigating climate change:
(1) From an academic standpoint, these findings shed light on the intricate dynamics among the input-output structure, technical efficiency, and comprehensive efficiency in the domain of carbon emissions management. This enriches the existing scholarly knowledge base and enables scholars to enhance their comprehension of carbon emissions management, particularly within the unique economic landscape of China. To deepen this understanding, future research can explore these relationships in greater detail, employing sophisticated econometric techniques or conducting longitudinal studies to track and analyze these patterns over an extended timeframe.
(2) From the policy perspective, these findings provide corporations and policymakers with valuable insights to identify areas for improvement and formulate more impactful strategies for carbon emissions management. The noticeable absence of a significant upward trend in both overall and pure technical efficiency signifies ample opportunities for enhancement in these domains. Potential avenues to pursue this enhancement could involve leveraging cutting-edge technologies, optimizing operational processes, or allocating resources to capacity development initiatives. By capitalizing on these opportunities, policymakers and corporations can effectively address the challenges posed by carbon emissions and make substantial strides towards achieving sustainability objectives.
(3) From the corporations perspective, the study also emphasizes the significance of maintaining a balanced input-output structure, presenting explicit guidance in this regard. An overemphasis on investment, particularly in labor, may lead to the inefficient utilization of resources and suboptimal outcomes. Conversely, underinvestment may result in insufficient output. Consequently, corporations must strive for an optimal equilibrium, ensuring the efficient allocation of resources while aligning output with sustainability goals. The identified redundancy in undesirable output serves as a clear indication for the implementation of stricter pollution control measures. This may involve the adoption of more advanced pollution control technologies, improvements in waste management practices, or the enforcement of more stringent internal policies pertaining to pollution control. Such measures would contribute towards achieving greater environmental stewardship and sustainable business practices.
This study is limited by the fact that data on corporate carbon emissions is available only for a relatively short time span. Consequently, the analysis primarily focuses on the efficiency of corporate carbon emissions in the past 3 years. However, future research could expand to encompass long-term assessments of carbon emission efficiency and the exploration of carbon emission prediction studies.
The datasets presented in this article are not readily available because the owner of the data repository expressly prohibits the dissemination of the data beyond the authors. Unauthorized distribution, transmission, or any form of circulation of the data is strictly forbidden under the terms of the data repository agreement. Requests to access the datasets should be directed to for further inquiries, please get in touch with S-RH (Email: sirui.han@polyu.edu.hk). S-RH will be pleased to provide additional information or clarification as necessary.
F-FY: Conceptualization, Formal Analysis, Writing–original draft. S-RH: Investigation, Methodology, Validation, Writing–original draft, Writing–review and editing. H-TL: Supervision, Validation, Writing–review and editing.
The author(s) declare financial support was received for the research, authorship, and/or publication of this article. This research was supported by the National Natural Science Foundation of China (Nos 72301071 and 72001043), the Natural Science Foundation of Fujian Province of China (Nos 2022J01178, and 2020J05122), Hong Kong SustainTech Foundation, PolyU Project of Strategic Importance (No. P0039723), PolyU AF Competitive Grants (No. P0046075), and PolyU Start-up Fund for RAPs under the Strategic Hiring Scheme (No. P0044542).
The authors gratefully acknowledge research support from Hao Wu.
The authors declare that the research was conducted in the absence of any commercial or financial relationships that could be construed as a potential conflict of interest.
All claims expressed in this article are solely those of the authors and do not necessarily represent those of their affiliated organizations, or those of the publisher, the editors and the reviewers. Any product that may be evaluated in this article, or claim that may be made by its manufacturer, is not guaranteed or endorsed by the publisher.
Ali, M., Abbas, B., Mohammad-Bagher, F., Ahmad, S., and Yahia, Z. M. (2022). A new model for the use of renewable electricity to reduce carbon dioxide emissions. Energy 238, 121602. doi:10.1016/j.energy.2021.121602
Chen, L., Wang, Y. M., Lai, F. J., and Feng, F. (2017). An investment analysis for China’s sustainable development based on inverse data envelopment analysis. J. Clean. Prod. 142, 1638–1649. doi:10.1016/j.jclepro.2016.11.129
Cheng, Z., Li, L., Liu, J., and Zhang, H. (2018). Total-factor carbon emission efficiency of China's provincial industrial sector and its dynamic evolution. Renew. Sustain. Energy Rev. 94, 330–339. doi:10.1016/j.rser.2018.06.015
Cheng, Z. H., Li, L. S., and Liu, J. (2017). The emissions reduction effect and technical progress effect of environmental regulation policy tools. J. Clean. Prod. 149, 191–205. doi:10.1016/j.jclepro.2017.02.105
Costa-Campi, M. T., Garcia-Quevedo, J., and Martínez-Ros, E. (2017). What are the determinants of investment in environmental R and D? Energy Policy 104, 455–465. doi:10.1016/j.enpol.2017.01.024
Fare, R., Grosskopf, S., Lindgren, B., and Roos, P. (1992). Productivity change in Swedish pharmacies 1980–1989: a nonparametric Malmquist approach. J. Prod. Analysis 3, 85–102. doi:10.1007/BF00158770
Golany, B. A., and Roll, Y. (1989). An application procedure for DEA. Omega 17 (3), 237–250. doi:10.1016/0305-0483(89)90029-7
Hang, Y., Wang, Q. W., Zhou, D. Q., and Zhang, L. (2019). Factors influencing the progress in decoupling economic growth from carbon dioxide emissions in China's manufacturing industry. Resour. Conservation& Recycl. 146, 77–88. doi:10.1016/j.resconrec.2019.03.034
Hong, J., Feng, B., Wu, Y. R., and Wang, L. B. (2016). Do government grants promote innovation efficiency in China’s high-tech industries? Technol. Innov. 57, 4–13. doi:10.1016/j.technovation.2016.06.001
Liang, W., Gan, T., and Zhang, W. (2019). Dynamic evolution of characteristics and decomposition of factorsinfluencing industrial carbon dioxide emissions in China: 1991–2015. Struct. Change Econ. Dyn. 49, 93–106. doi:10.1016/j.strueco.2018.09.009
Lin, B. Q., and Agyeman, S. D. (2020). Assessing Sub-Saharan Africa’s low carbon development through thedynamics of energy-related carbon dioxide emissions. J. Clean. Prod. 274, 122676. doi:10.1016/j.jclepro.2020.122676
Makkonen, T., and Repka, S. (2016). The innovation inducement impact of environmental regulations on maritime transport: a literature review. Int. J. Innovation Sustain. Dev. 10, 69–80. doi:10.1504/IJISD.2016.073413
Meng, F., Su, B., Thomson, E., Zhou, D., and Zhou, P. (2016). Measuring China’s regional energy and carbon emission efficiency with DEA models: a survey. Appl. Energy 183, 1–21. doi:10.1016/j.apenergy.2016.08.158
Qu, S., Xu, Y., Ji, Y., Feng, C., Wei, J., and Jiang, S. (2022). Data-driven robust data envelopment analysis for evaluating the carbon emissions efficiency of provinces in China. Sustainability 14, 13318. doi:10.3390/su142013318
Ramón, F., Begoña, F., and Adelaida, L. B. (2016). A three-stage DEA model to evaluate learning-teaching technical efficiency: key performance indicators and contextual variables. Expert Syst. Appl. 48, 89–99. doi:10.1016/j.eswa.2015.11.022
Samuel, A., and Christian, N. (2019). Reducing carbon dioxide emissions; Does renewable energy matter? Sci. Total Environ. 693, 133288. doi:10.1016/j.scitotenv.2019.07.094
Samuel, O. D., Okwu, M. O., Amosun, S. T., Verma, T. N., and Afolalu, S. A. (2019). Production of fatty acid ethyl esters from rubber seed oil in hydrodynamic cavitation reactor: study of reaction parameters and some fuel properties. Industrial Crops Prod. 141, 111658. doi:10.1016/j.indcrop.2019.111658
Seiford, L. M., and Zhu, J. (2002). Modeling undesirable factors in efficiency evaluation. Eur. J. Operational Res. 142, 16–20. doi:10.1016/S0377-2217(01)00293-4
Sheng, Y., Wu, Y. R., Shi, X. P., and Zhang, D. D. (2015). Energy trade efficiency and its determinants: a Malmquist index approach. Energy Econ. 50, 306–314. doi:10.1016/j.eneco.2015.05.019
Song, M. L., Peng, J., Wang, J. L., and Dong, L. (2018). Better resource management: an improved resource and environmental efficiency evaluation approach that considers undesirable outputs. Resour. Conservation Recycl. 128, 197–205. doi:10.1016/j.resconrec.2016.08.015
Tailon, M., Alisson, C. B., Francisca, M. S., and Adriano, M. S. (2021). Fossil fuels consumption and carbon dioxide emissions in G7 countries: empirical evidence from ARDL bounds testing approach. Environ. Pollut. 291, 118093. doi:10.1016/j.envpol.2021.118093
Wang, E. X., and Wu, C. Y. (2011). Spatial-temporal differences of provincial eco-efficiency in China based on supper efficiency DEA model. Chin. J. Manag. 3, 443–450. doi:10.3969/j.issn.1672-884X.2011.03.018
Wang, S. J., and Ma, Y. Y. (2018). Influencing factors and regional discrepancies of the efficiency of carbon dioxide emissions in Jiangsu, China. Ecol. Indic. 90, 460–468. doi:10.1016/j.ecolind.2018.03.033
Wang, Y. M., Liu, J., and Taha, M. S. (2008). An integrated AHP–DEA methodology for bridge risk assessment. Comput. Industrial Eng. 54, 513–525. doi:10.1016/j.cie.2007.09.002
Wang, Y. M., and Luo, Y. (2010). Integration of correlations with standard deviations for determining attribute weights in multiple attribute decision making. Math. Comput. Model. 51, 1–12. doi:10.1016/j.mcm.2009.07.016
Wang, Y. M., Yang, J. B., and Xu, D. L. (2006). Environmental impact assessment using the evidential reasoning approach. Eur. J. Operational Res. 174 (3), 1885–1913. doi:10.1016/j.ejor.2004.09.059
Wen, L., and Shao, H. Y. (2019). Influencing factors of the carbon dioxide emissions in China's commercialdepartment: a non-parametric additive regression model. Sci. Total Environ. 668, 1–12. doi:10.1016/j.scitotenv.2019.02.412
Yan, D., Lei, Y., Li, L., and Song, W. (2017). Carbon emission efficiency and spatial clustering analyses in China’s thermal power industry: evidence from the provincial level. J. Clean. Prod. 156, 518–527. doi:10.1016/j.jclepro.2017.04.063
Yang, L. H., Liu, J., Wang, Y. M., and Martínez, L. (2019). New activation weight calculation and parameter optimization for extended belief rule-based system based on sensitivity analysis. Knowl. Inf. Syst. 60 (2), 837–878. doi:10.1007/s10115-018-1211-0
Ye, F. F., Yang, L. H., and Wang, Y. M. (2019a). A new environmental governance cost prediction method based on indicator synthesis and different risk coefficients. J. Clean. Prod. 212, 548–566. doi:10.1016/j.jclepro.2018.12.029
Ye, F. F., Yang, L. H., and Wang, Y. M. (2019b). Fuzzy rule based system with feature extraction for environmental governance cost prediction. J. Intelligent Fuzzy Syst. 37, 2337–2349. doi:10.3233/JIFS-182628
Yu, S. W., Gao, S. W., and Sun, H. (2016). A dynamic programming model for environmental investment decision-making in coal mining. Appl. Energy 166, 273–281. doi:10.1016/j.apenergy.2015.09.099
Zarezade, M., and Mostafaeipour, A. (2016). Identifying the effective factors on implementing the solar dryers for Yazd province, Iran. Renew. Sustain. Energy Rev. 57, 765–775. doi:10.1016/j.rser.2015.12.060
Zhang, M., Li, L., and Cheng, Z. (2021b). Research on carbon emission efficiency in the Chinese construction industry based on a three-stage DEA-Tobit model. Environ. Sci. Pollut. Res. 28, 51120–51136. doi:10.1007/s11356-021-14298-3
Zhang, X. S., Jiang, Q. Q., Khattak, S. I., Ahmad, M., and Rahman, Z. U. (2021a). Achieving sustainability and energy efficiency goals: assessing the impact of hydroelectric and renewable electricity generation on carbon dioxide emission in China. Energy Policy 155, 112332. doi:10.1016/j.enpol.2021.112332
Keywords: evidential reasoning, indicator information integration, carbon emissions management, efficiency evaluation, improvement strategy
Citation: Ye F-F, Han S-R and Lu H-T (2023) Carbon emissions management efficiency evaluation based on indicator information integration and DEA-Malmquist index. Front. Environ. Sci. 11:1301091. doi: 10.3389/fenvs.2023.1301091
Received: 24 September 2023; Accepted: 31 October 2023;
Published: 10 November 2023.
Edited by:
Zhangqi Zhong, Guangdong University of Foreign Studies, ChinaReviewed by:
Yantuan Yu, Guangdong University of Foreign Studies, ChinaCopyright © 2023 Ye, Han and Lu. This is an open-access article distributed under the terms of the Creative Commons Attribution License (CC BY). The use, distribution or reproduction in other forums is permitted, provided the original author(s) and the copyright owner(s) are credited and that the original publication in this journal is cited, in accordance with accepted academic practice. No use, distribution or reproduction is permitted which does not comply with these terms.
*Correspondence: Si-Rui Han, c2lydWkuaGFuQHBvbHl1LmVkdS5oaw==
Disclaimer: All claims expressed in this article are solely those of the authors and do not necessarily represent those of their affiliated organizations, or those of the publisher, the editors and the reviewers. Any product that may be evaluated in this article or claim that may be made by its manufacturer is not guaranteed or endorsed by the publisher.
Research integrity at Frontiers
Learn more about the work of our research integrity team to safeguard the quality of each article we publish.