 Minggui Zheng
 Jingsheng Ni
 Donghong Wen
95% of researchers rate our articles as excellent or good
Learn more about the work of our research integrity team to safeguard the quality of each article we publish.
Find out more
ORIGINAL RESEARCH article
Front. Environ. Sci. , 04 January 2024
Sec. Environmental Economics and Management
Volume 11 - 2023 | https://doi.org/10.3389/fenvs.2023.1293462
This article is part of the Research Topic Changes in the Approach to Energy Concerns and their Impact on the Economy and the Environment View all 6 articles
Introduction: The fossil energy sector is an important part of international trade, and the flow of products between sectors will bring about the flow of embodied carbon. There are relatively few studies on embodied carbon in the fossil energy sector, which are mostly concentrated in other sectors and are not well integrated with GVC. Combining embodied carbon with GVC provides a better view of the allocation of environmental responsibility in trade. At the same time, it can also help different countries to improve the environment with the help of GVC.
Methods: This research is based on the World Input–Output Database. First, by using multi-regional input–output, this paper measures fossil energy trade embodied carbon (FEE) data of 39 countries from 2000 to 2014; second, using structural decomposition analysis, we find what factors affect FEE. Finally, we analyze theimpact of global value chain (GVC) on the FEE.
Results: This study obtained the following conclusions: 1) different GVCs have different effects on the embodied carbon in trade. Simple forward, complex forward, and simple backward to embedded play a positive role. The complex backward GVC has a negative impact; 2) high-income countries can get greater positive environmental effects through GVC, and middle-income countries cannot obtain or obtain less environmental effects; and 3) the backward GVC affects the FEE by affecting the proportion of fossil energy consumption.
Discussion: The results show that the FEE shall be jointly responsible for the world’s countries, and different countries should make different contributions to the world’s environmental protection comprehensively considering factors such as the economic development level of various countries. This proposes relevant policy suggestions in China.
With the continuous deepening of international trade, the degree of participation of countries in the global value chain (GVC) is deepening, and the polarization of their positions on the GVC is becoming increasingly evident. In the process of polarization, it not only brings inequality in economic benefits but also brings about issues of environmental inequality. This problem is more evident in industrial production, especially in industries that cause severe pollution. In order to better distinguish carbon emission responsibilities, it is necessary to conduct segmented research on industries. However, in previous studies, most of the perspectives have focused on studying countries or the overall industry, and there is a relative lack of research on industries with differentiation, making it difficult to define the division of responsibilities in carbon emissions in detail. Therefore, this article studies the fossil energy industry, hoping to fill the gap in this field of research.
Fossil energy trade is the key trade department under the angle of the GVC. The development of fossil energy embodied carbon (FEE)-related research has good theory and practical significance. On the other hand, the world energy trade pattern is being adjusted from the second energy structure to the upcoming energy structure transformation and development. In this process, the world energy trade pattern is mainly oil, coal, natural gas, and new energy. After the transformation of the energy structure in the future, the consumption attributes of fossils gradually weaken, but the raw material attributes are still difficult to be replaced. Therefore, research on FEE has a good long-term application prospect.
From the perspective of the industrial chain, the fossil energy industry has extremely distinct upstream and downstream differences. Taking the petroleum industry as an example, the crude oil-exporting countries in the upstream of the petroleum industry chain are usually dominated by countries with abundant petroleum resources. Due to the relatively fixed resource endowment, exporting countries usually do not undergo significant changes, and carbon emissions during the crude oil extraction process can only be generated within the corresponding countries. From the perspective of the middle and lower reaches of the industrial chain, the export of products such as compounds, rubber, fibers, and fuels is related to the country’s economic development and position in the GVC. This leads to different positions on the GVC, which can affect the division of carbon emission responsibilities in the fossil energy industry. There is relatively little research on this issue, which makes it difficult to distinguish the carbon emission responsibilities of participating fossil energy-exporting countries upstream and downstream in the GVC.
This study used world input–output data to calculate the FEE of world fossil energy export trade from 2000 to 2014, empirically analyzed the impact of different GVCs on FEE, divided national income levels, analyzed the environmental effects obtained by countries at different levels in the GVC, and combined with intermediary models, further explored the path of GVC’s impact on the environment. This article mainly studies the following questions: 1) What are the differences in the environmental impacts of different ways of GVC embedding? 2) How do countries with different income levels experience different environmental effects in the GVC? 3) Is the impact of the GVC on the environment achieved by affecting the energy structure?
Compared with previous studies, the contribution of this study is as follows: 1) In terms of research perspectives, it is the first time to directly link department FEE with the GVC and use a structural decomposition model to decompose other influencing factors. Through empirical testing, the final results are obtained. 2) In terms of research methods, innovative mediation models are used to combine EEC with energy structure, analyze the impact path of the GVC, and fill the gaps in relevant mechanisms in this field. 3) In terms of research conclusions, in addition to the original division of emission responsibilities based on the national level, a more detailed supplement was provided on how different countries should assume environmental responsibility through the GVC, which is a further combination of theory and practice and contributes to the further development of this field.
The rest of the present study is structured as follows: Section 2 reviews relevant literature and proposes assumptions. Section 3 calculates FEE and decomposes the factors affecting FEE. Section 4 constructs an empirical model and explains variables. Section 5 analyzes empirical results and testing for robustness and heterogeneity. Section 6 further studies the impact of different GVCs and investigates the impact pathways. Section 7 summarizes conclusions and provides suggestions.
From the perspective of the GVC, there are many references available for research on environmental impacts, and initially, only a summary study was conducted on export carbon emissions (Su and Ang, 2010; SU et al., 2010). From further research results, it can be seen that there is a relatively close relationship between the development of the GVC and carbon emissions (Kanemoto et al., 2012). This connection is mainly reflected in the separation of production and consumption in upstream and downstream countries when trade dependent on the GVC occurs, which leads to carbon emissions in the production process remaining domestically rather than flowing with products (Gallego and Lenzen, 2005). The more the foreign demand, the more the domestic production and emissions increase (Meng et al., 2018). This issue has attracted increasing attention (Peters and Hertwich, 2008; Kanemoto et al., 2012; Long et al., 2018; Kim and Tromp, 2021). Meanwhile, some scholars have used structural decomposition models to study what factors affect carbon emissions (Su and Ang, 2012; Wang et al., 2017; Zhou et al., 2018; Dietzenbacher et al., 2020). The above research did not effectively combine the GVC with carbon emissions for research but rather conducted relatively independent research on carbon emissions in the context of the GVC and did not delve into how different positions on the GVC would affect carbon emissions.
Subsequent research, based on previous studies, delved into the relationship between the GVC and carbon emissions and found a relatively close relationship (Zhong et al., 2021; Ji et al., 2022a; Shi et al., 2022). Scholars had found that there is a “U”-shaped relationship between the GVC and the per capita carbon emissions (Wang et al., 2019), together with the economic growth factors, and the participation of the GVC will promote economic development in the long run and reduce the per capita carbon emissions (Shi et al., 2022a).
From the above research, it is not difficult to see that currently, in order to combine the GVC with the environment for research, the focus is on how to measure the degree of environmental impact. Embodied carbon is usually measured, and the current mainstream methods include the Intergovernmental Panel on Climate Change (IPCC), the life cycle assessment (LCA), and multi-regional input–output (MRIO). The IPCC needs to set the future environmental situation in advance to explore carbon emissions (van Vuuren et al., 2017a) and provide a basis for environmental policies through research through different situations in the same situation (van Vuuren et al., 2017b). The LCA studies the impact of the environment from the perspective of the product production process and is widely used in the construction industry for empirical research (Li et al., 2021; Morris et al., 2021; Pakdel et al., 2021; Xu et al., 2022). The MRIO obtains the trading embodied carbon by calculating the trade data between different countries and different departments (Su et al., 2013; Li et al., 2022); this method is widely used in the calculation of implicit carbon and often combines research with social network analysis (Lv et al., 2019; Wang L. et al., 2020; Pan et al., 2022a; Zhu et al., 2022; Zhao et al., 2023). There are also some scholars who studied from the perspective of national heterogeneity, and they reached a conclusion that developed countries will reduce carbon emissions in the GVC, while developing countries will increase emissions (Liu and Zhao, 2021; Jin et al., 2022; Wang S. et al., 2022). According to the perspective of industrial heterogeneity, other scholars found that there was a great difference in carbon emissions at different stages of the industrial chain (Sun et al., 2019; Takayabu et al., 2019; Liu et al., 2020; Yi et al., 2022). In addition, we noticed that the value chain embedded will affect the energy structure (Jin et al., 2022a; Ji et al., 2022b). The energy structure of the upstream state will be optimized, and the downstream countries will worsen (Pan et al., 2022b). While some researchers found there is a “U"-shaped relationship between China’s GVC and energy strength (Wang S. et al., 2020), with the increase in GVC participation, the energy intensity of the industry will show an upward trend, but when it reaches the turning point, it will show a downward trend. This trend is consistent with the previous discussion on the relationship between the GVC and per capita carbon emissions and also raises concerns about how the GVC affects the environment (Wang et al., 2019).
From the theoretical basis, at present, the mainstream theory affected by trade under the GVC vision can be divided into the following two types: pollution haven hypothesis and pollution halo hypothesis. Scholars who support the hypothesis of pollution haven believe that under the perspective of the GVC, the environment of developing countries will deteriorate and become a “polluted paradise” of developed countries. Some scholars found that China has become a polluted paradise in other countries to trade with China. Moreover, other scholars found that foreign investment will affect China’s energy structure, and the changes in the energy structure exacerbated China’s environmental pollution. The study confirms the “pollution paradise” hypothesis (Jin et al., 2022b; Zhang, 2022). The pollution halo hypothesis corresponds to the pollution paradise hypothesis. Scholars who support the pollution halo believe that trade has a positive effect on the environment, while some scholars have found that FDI has a positive effect on the environment (Hille et al., 2019; Demena and Afesorgbor, 2020). This viewpoint has also been proven in some developed regions (Zhu et al., 2016).
Based on the above analysis, we propose the following hypothesis:
H1. The impact of different GVC embedding methods on FEE varies; when segmenting GVC, there may be negative effects.
H2. There are differences in the environmental effects obtained by countries with different natures in the GVC, and high-income countries can obtain more environmental effects.
H3. Energy structure plays a mediating role in GVC embedding, affecting FEE by influencing the proportion of fossil energy consumption.
In the MRIO model, assuming that there are M countries in the world trade, each country has the same number of N industrial sectors, and the products produced by each department include intermediate and final products. The calculation formula is expressed as follows:
In formula (2),
Among them, the element
The structural decomposition analysis (SDA) method is often associated with MRIO and can be used for the analysis of environmental impact factors. On this basis, demand Y is divided into the following four parts: scale effect Q, structural effect S, technical effect T, and economic development quality level G. The influencing factors of export trade embodied carbon changes can be decomposed as follows:
The changes from FEE from the basis to the reporting period can be decomposed as follows:
Furthermore, according to the two pole decomposition methods, the analysis of the influencing factors is as follows:
As shown in Formula 7, the decomposition affects the implicit carbon factors that affect the export of global stone energy departments and analyze from the perspective of scale effect, structural effect, technical effect, and economic development quality level.
This article mainly uses the World Input–Output Database (WIOD) 2016. The database contains the input–output and environmental account data of 56 departments in 43 countries or regions. The fossil energy department is selected for analysis. The GVC data are derived from the relevant database of the University of Foreign Economic and Trade (http://gvcdb.uibe.edu.cn/). Other data mainly come from the World Development Indicators (WDI) database (https://databank.world-bank.org/) and the UN Comtrade database (https://comtradeplus.un.org/). The data need to be screened first of all in order to match the national and regional data of the WIOD with those of the WDI database. Due to the missing data of some indicators in the WDI database corresponding to some countries in the WIOD, they are deleted. These deleted countries include Taiwan (TWN), Cyprus (CYP), the Netherlands (NLD), and Luxembourg (LUX), and a total of 39 countries are selected. Second, in order to match departmental data, according to the global value chain database code comparison table, the products of major trade categories 27, 28, and 84 are selected as the corresponding trade data of the WIOD fossil energy department. The selection criteria mainly refer to the relevant databases of the University of International Business and Economics and the United Nations database (https://unstats.un.org/unsd/). The specific product codes selected are shown in Table 1.
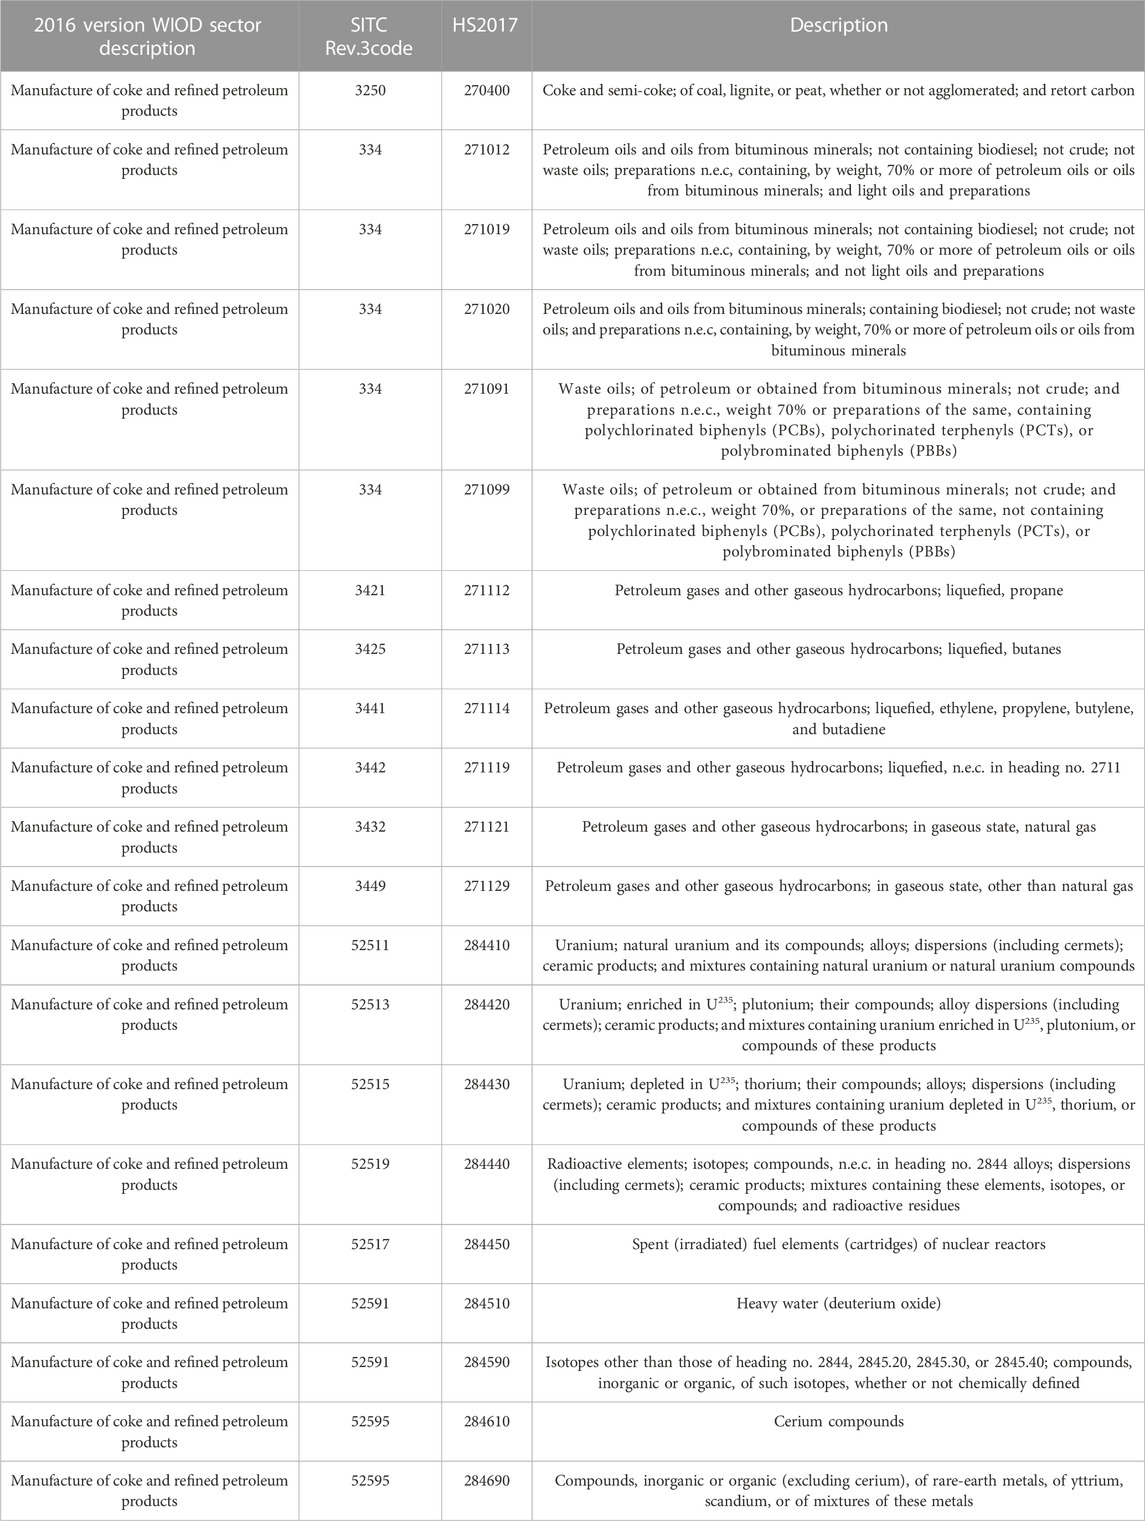
TABLE 1. Product code table.
Referring to the research method in the work of Jin et al. (2022), based on 15 years’ data from 39 countries, in this article, a panel regression model was constructed, and the specific benchmark regression model was established as follows:
Among them,
(1) Dependent variable
Based on the WIOD data and MRIO, embodied carbon data for 56 sectors in 39 countries are calculated. The fossil energy sector is selected, the trade embodied carbon data of total output are calculated, and then, they are matched with the fossil energy trade data. Embodied carbon is divided by export trade volume. Finally, the FEE is obtained.
(2) Independent variable
The GVC embedding index is selected to measure country participation (Wang Z. et al., 2022). The GVC embedding index is used as a measure of a country’s participation in the international division of labor (Wang et al., 2022). After decomposing the product value added into 16 parts, the forward value chain embedding index and the backward value chain embedding index are calculated separately. The calculation formula is expressed as follows:
(3) Control variables
Combining the structural decomposition model, control variables are selected from the following four perspectives: the scale effect, structural effect, technological effect, and economic development quality level. Among them, the scale effect is measured by GDP (constant price in 2010), and the logarithm is taken to reduce the impact of heteroscedasticity; the structural effect utilizes the proportion of service industry employment to total employment to measure the degree of structural optimization in economic development; the technological effect is measured by the ratio of FDI to national GDP; and the quality level of economic development is expressed by the ratio of carbon dioxide emissions to the purchasing power parity index of GDP.
The descriptive statistics of study variables are shown in Table 2.

TABLE 2. Variable descriptive statistics.
Referring to the work of Ye et al. (2020), we use Fisher criteria to avoid the pseudo regression problem From Table 3, it can be seen that there is no unit root problem, and the data are zero-order single integers. The next step of compression can be carried out.
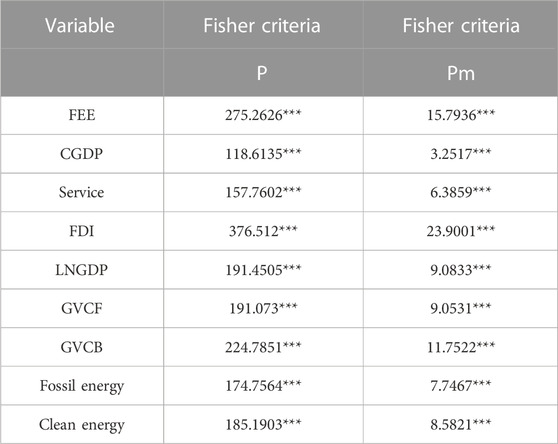
TABLE 3. Panel unit root test.
This study conducts benchmark regression based on different methods of the GVC to further analyze in detail the impact of the GVC on the FEE. After conducting the Hausman test, the benchmark regression uses random effects. Cross-sectional dependency, autocorrelation, and heteroscedasticity tests are performed on the benchmark regression, the benchmark regression model is adjusted, and generalized least squares (FGLS) are used for regression.
Regression of FEE is carried out using the GVC, and the benchmark regression results are shown in Table 4. Columns (1) and (2) are regression for the forward GVC and FEE, respectively, and the results show that the impact of the forward GVC on FEE is significantly negative at the 1% level. Columns (3) and (4) are regression for the backward GVC and FEE, respectively, and the results are also significantly negative. The benchmark regression results indicate that the GVC will reduce the FEE. According to the preliminary proof of hypothesis 1, there are differences in the environmental impact of different GVCs, but in the absence of segmentation, the main difference is in the size of the impact, with the impact of the backward GVC being greater.
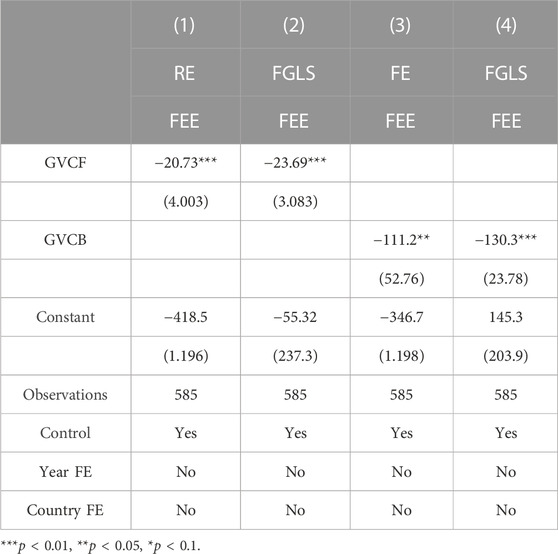
TABLE 4. Benchmark regression results.
No matter how the country participates in the GVC, overall, the domestic environment will be improved to a certain extent. The utility of backward embedding is much higher than that of forward embedding. The reason for this is that the two embedding methods represent different meanings, and the participation modes represented are also different. The backward GVC mainly represents relatively extensive production in the fossil energy industry, such as oil extraction and asphalt extraction, which can lead to environmental degradation. Forward embedding is mainly focused on relatively high-end industries, such as extraction.
In order to test the robustness of the research conclusion, considering the impact of the 2008 global economic crisis, the data from 2000 to 2008 were chosen for retesting. Columns (1) and (2) of Table 5 are variable lag tests, while (3) and (4) columns are data tests from 2000 to 2008. The results show no significant changes and are robust.
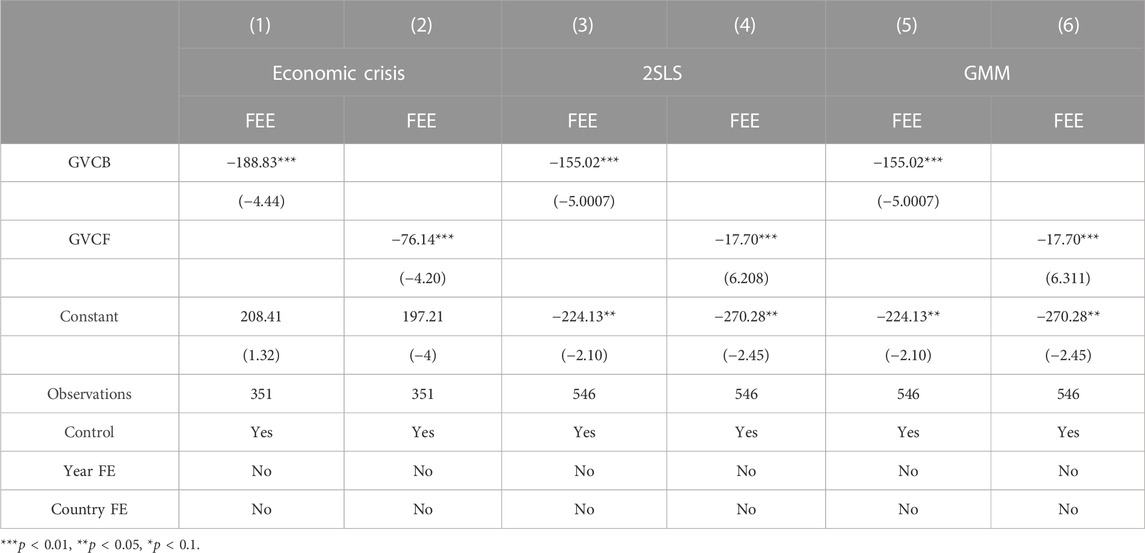
TABLE 5. Robust test.
In order to overcome the endogeneity problems that may exist in the research process, the instrumental variable estimation selects the GVC that lags behind one period. First, in response to the issue of overrecognition, the instrumental variable estimation is an embedded index lagging one period, so it is not considered. Second, the weak instrumental variable estimation test was conducted and passed. On the basis of the above, the two-stage least squares method and generalized method of moments are selected for testing. The results are shown in columns (5)–(8) of Table 5. Through robustness testing, it can be seen that the embedding of the GVC has a significant positive effect on the environment, and the utility of backward embedding is still significantly higher than that of forward embedding. This indicates that in sectors with relatively severe pollution, the effect of improving the backward GVC is more significant, and this feature is more significant in the early stages of economic development, such as before the economic crisis. This is consistent with the conclusion in benchmark regression, demonstrating the robustness of the study.
The significant differences in income levels among different countries in international trade are considered. According to the classification of high-income and low-income countries in the database of the University of International Business and Economics, the regression results are shown in Table 6. From the results, it can be seen that there is a significant difference between high-income countries and low- and middle-income countries. From the perspective of the GVC, the forward GVC has a significant effect on the environment of high-income countries, while the backward GVC has a certain environmental effect on low- and middle-income countries. After introducing the quadratic term, the results changed to some extent, with higher-income countries having a greater environmental effect of the forward GVC and middle- and low-income countries experiencing a significant U-shaped relationship instead of a disappearance of the environmental effect of the backward embedding after introducing the quadratic term. This conclusion proves hypothesis 2 that the environmental effects of different countries in the GVC vary, and high-income countries can achieve better environmental effects.
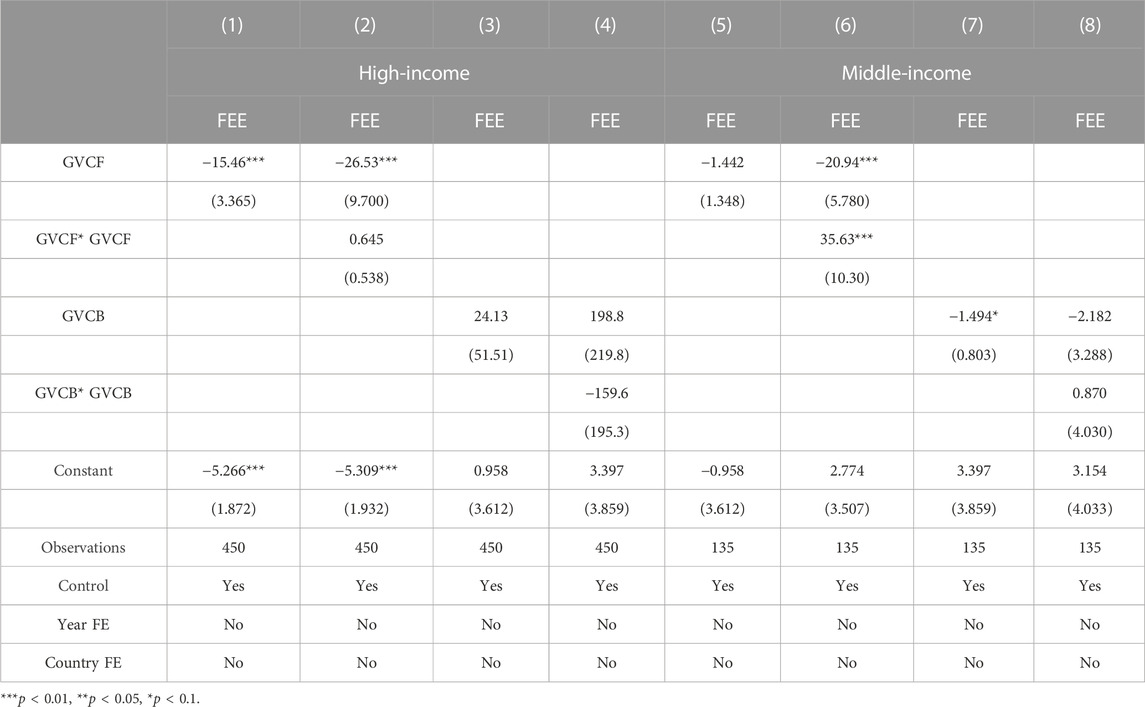
TABLE 6. Heterogeneity analysis.
This result indicates that for high-income countries, due to their high level of economic and industrial development, the environmental benefits of the backward GVC have disappeared, and they mainly rely on the forward GVC to improve the environment. This also indicates that high-income countries have shifted their future focus on embedding as the main industry to other countries. In low- and middle-income countries, there is an interesting phenomenon that when only one term is considered, the backward GVC has environmental effects. After adding the quadratic term, it is actually positive embedding with environmental effects. Based on the carbon Kuznets curve (CKC) and the characteristics of fossil energy development, it can be inferred that in the early stage of development, low- and middle-income countries, due to their own industrial structure and development level limitations, are dominant in industries with the backward GVC; at this point, enhancing the backward GVC will bring environmental effects. However, in the long run, when a country undergoes industrial transformation, due to the influence of existing industries, there will be a “U"-shaped relationship when the fossil energy industry is further improved, that is, forward GVC improvement, and the environment will deteriorate. This indicates that low- and middle-income countries should pay attention to energy transformation and actively expand energy development beyond fossil energy.
To further investigate the impact of GVC embedding on FEE, this article further subdivides the core explanatory variables into complex and simple calculation methods and divides the embedding methods into four types for further research. The research results are shown in Table 7. Simple forward, complex forward, and simple backward embeddings have positive environmental impacts, while complex backward embeddings can bring negative environmental impacts. Among them, forward embedding is consistent with the previous conclusion, while backward embedding is different. This result further confirms hypothesis 1, indicating that there are differences in the impact of the GVC on the environment under different calculation methods. This difference is not only a difference in the size of the influence coefficient but also a change in the direction of influence after subdivision.
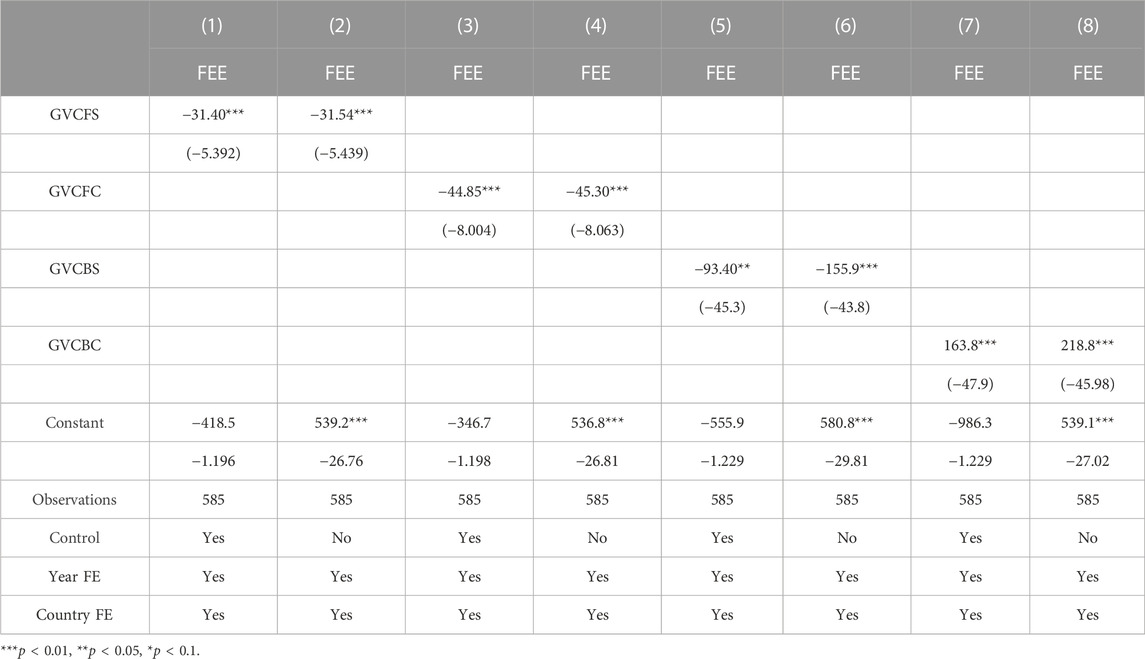
TABLE 7. Subdivision benchmark regression results of the impact of subdividing the GVC on FEE.
This phenomenon is analyzed according to different embedding methods, where the backward simple embedding method represents the ratio of foreign added value imported for the production of intermediate products to the final product. It should be noted that this part of intermediate products only underwent one cross-border production. The complex backward embedding method represents the difference between the domestic added value and foreign absorbed value in the imported intermediate goods that produce the final product and the ratio of the final product. From the further analysis of the meaning represented by the indicators, it is not difficult to find that the simple backward positive environmental effect can be understood as that the more the imported products are used to produce domestic final consumption, the stronger the improvement effect on the environment, and the improvement effect on the environment is much higher than that of positive embedding. This indicates that in order to improve the domestic environment, transferring the intermediate goods required for domestic final demand production to foreign countries will yield good results. From a complex backward perspective, the larger the gap in the added value between domestic and international production, export, or domestic consumption of intermediate goods, the worse the domestic environment. To improve the environment, it is necessary to further narrow down the differences in domestic and international development, thereby minimizing the degree of backward complexity embedding as much as possible.
The Energy structure is selected as the mediating variable. The energy structure is divided into the proportion of fossil energy consumption and the proportion of clean energy consumption. Among them, the WDI database provides the proportion of fossil energy consumption, but data on the proportion of clean energy consumption are missing. Therefore, the corresponding energy account is used in the WIOD to calculate the proportion of clean energy consumption. The energy structure M is added to the benchmark model, and the following model is built (Zhao et al., 2010; Shi et al., 2022b):
When the coefficients
According to models (12)–(14), the intermediary effect of the energy structure between the segmented GVC and FEE is discussed. Based on the different meanings represented by the GVC, the proportion of fossil energy and clean energy consumption was selected as intermediary variables, and the regression results are shown in Table 8. Among them, columns (1) and (2) use the proportion of fossil energy consumption as the dependent variable and the GVC as the independent variable for regression; columns (3) and (4) use the proportion of clean energy consumption as the dependent variable and the GVC as the independent variable for regression, and columns (5)–(8) add intermediary variables to the explanatory variables to analyze FEE.
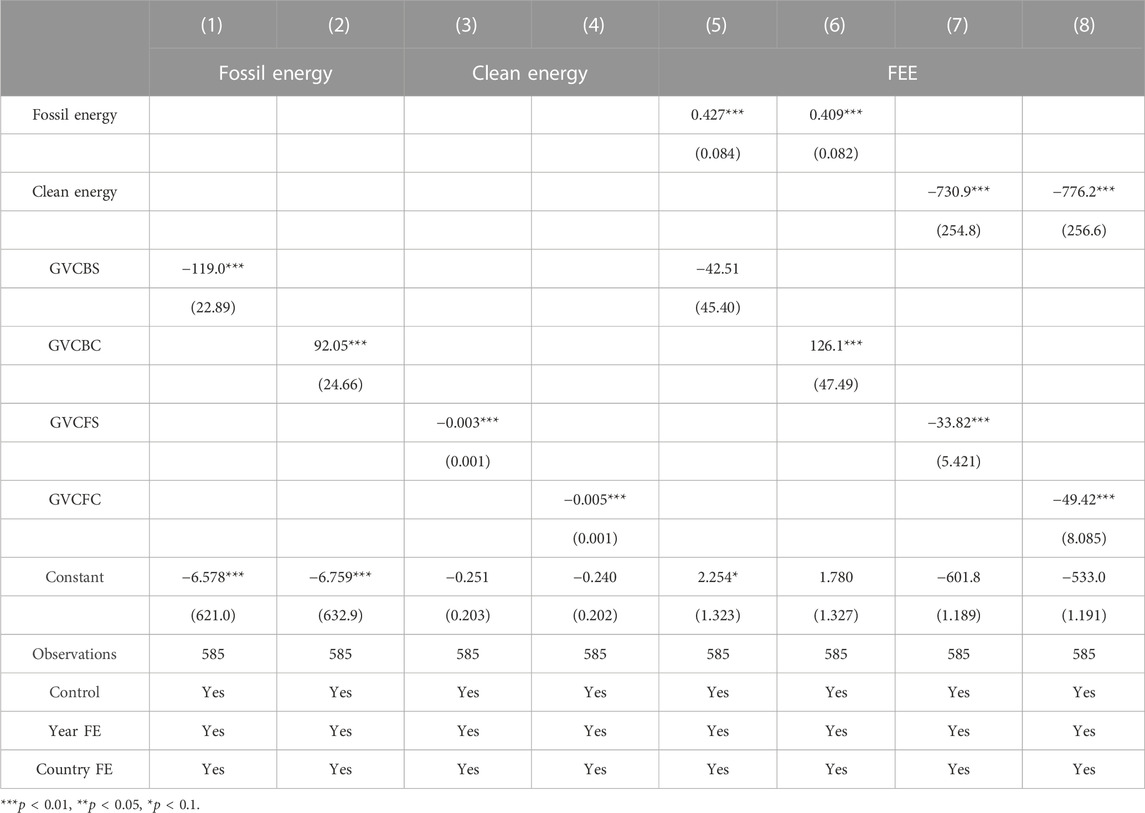
TABLE 8. Intermediary effect test.
First, the regression results in Table 4 show a significant relationship between the GVC and FEE. Second, from columns (1) to (4) of Table 8, it can be seen that there is a significant relationship between the GVC and energy structure. From the perspective of coefficient size, the impact of the backward GVC on the energy structure is much greater than that of the forward GVC. From the perspective of the impact direction, the complex backward GVC has a negative impact, which is consistent with Table 4. Finally, from columns (5)–(8) of Table 8 , it can be seen that after the forward GVC is embedded in the energy structure as an intermediary variable, the explanatory power of the core explanatory variable is not weakened, and there is no intermediary effect. The backward GVC affects the implied carbon intensity of trade through the path of energy structure. After adding the proportion of fossil energy consumption, the simple backward GVC becomes insignificant, indicating a complete intermediary effect. This result confirms hypothesis 3 that the GVC further affects the environment by influencing the energy structure.
Analyzing the mechanism of GVC embedding affecting the environment, combined with the results, it can be concluded that one of the pathways of the backward GVC affecting the environment is the impact on the domestic energy usage structure, mainly manifested in the impact on the proportion of fossil energy consumption. The explanation for this phenomenon is that the backward GVC is mainly reflected in lower-end industries, which have a significant impact on the environment. At the same time, due to the locking in the GVC position, the environmental utility of this part is relatively fixed, and it will have a significant impact through the GVC. This phenomenon is mainly reflected in the simple backward GVC, as this part is mainly used for importing intermediate products to produce the final product. When this part is transferred to foreign countries, there is no need to engage in the production of polluting intermediate products domestically, resulting in a decrease in the proportion of domestic fossil energy use and an improvement in the environment.
This article uses the WIOD and corresponding environmental accounts from 2000 to 2014 to calculate the trade-implied carbon data of fossil energy sectors in 39 countries. It examines the impact of the GVC on the FEE and draws the following conclusions: (1) from the perspective of the GVC on FEE, the GVC has a positive environmental effect. However, after subdividing the calculation methods, it was found that the complex backward GVC increased the implied carbon intensity of trade. The higher the embedding degree, the more the FEE and the further the deterioration of the environment; (2) the results of heterogeneity analysis show that high-income countries can better reduce the FEE and achieve greater environmental effects in the GVC, but low- and middle-income countries are unable to obtain or have little environmental effects in the GVC; and (3) the mediation effect test results show that the backward GVC further affects the implied carbon intensity of export trade through the path of energy structure.
Based on the above conclusions, the following countermeasures and suggestions are proposed to address China’s current requirements for reducing carbon emissions and China’s own requirements for high-quality economic development: 1) The level of participation in the global value chain should be deepened, and value chain embedding should be fully utilized in reducing the implied carbon intensity of trade. Based on the regression results mentioned earlier and combined with the actual development of international trade, in the GVC, focusing on enhancing industrial upgrading to drive the forward GVC may be far less effective than enhancing the environmental utility of existing relatively low-end industries, which is more evident in the fossil energy sector. Taking China as an example, the current economic development in China is gradually shifting to the digital economy industry as the main focus in order to improve the environment. However, at the same time, attention needs to be paid to the development of departments such as energy collection and smelting in order to achieve better environmental benefits. At the same time, based on further analyses, it will be interesting to find that as a low- and middle-income country, China will face a “U-shaped” relationship in order to improve the environment through the forward GVC. When the environment improves to a certain extent, the continued increase in the forward GVC will lead to environmental degradation. This indicates that improving the environment through the GVC requires selecting appropriate paths, not only increasing the forward GVC but also paying attention to the backward GVC and also paying attention to the degree. Excessive pursuit of the forward GVC can actually lead to environmental degradation. 2) We should focus on developing the economy and enhancing China’s position in the world economy. According to the analysis of national heterogeneity, from the perspective of the global value chain, high-income countries can obtain greater environmental effects from the global value chain. As a low- and middle-income country, China has achieved relatively low returns in the process of embedding in the global value chain. In order to further improve China’s environmental protection, it is necessary to fully develop the economy and better utilize value chain embedding to obtain environmental benefits, rather than achieving environmental protection by reducing the speed of economic development. (3) The domestic energy use structure should be optimized. Backward simple value chain embedding has an impact on the implied carbon of fossil energy trade by influencing the energy structure. Therefore, it is urgent to optimize the domestic energy utilization structure and reduce the proportion of fossil energy consumption. At the same time, attention should be paid to expanding the scope of energy trade, which can not only protect energy security but also leverage the positive environmental effects of value chain embedding on neighboring countries. Taking China’s Belt and Road policy as an example, it mainly provides cooperation platforms for countries along the Belt and Road to help them achieve mutual benefit and common development. China plays an extremely important role in providing funds for countries along the Road to build. Through cooperation with countries along the route, China can give priority to countries that export implied carbon to China and achieve the transformation from an outflow country to an inflow country of implied carbon in fossil energy trade, so as to achieve the dual carbon goals.
The raw data supporting the conclusion of this article will be made available by the authors, without undue reservation.
The authors confirm that this study was conducted in accordance with the local legislation and institutional requirements.
MZ: funding acquisition, project administration, resources, and writing–review and editing. JN: data curation, methodology, and writing–original draft. DW: project administration, supervision, and writing–review and editing.
The authors declare financial support was received for the research, authorship, and/or publication of this article. This research was supported by Chinese National Funding of Social Sciences (No. 22XGL003).
The authors are indebted to the reviewers and editors.
The authors declare that the research was conducted in the absence of any commercial or financial relationships that could be construed as a potential conflict of interest.
All claims expressed in this article are solely those of the authors and do not necessarily represent those of their affiliated organizations, or those of the publisher, the editors, and the reviewers. Any product that may be evaluated in this article, or claim that may be made by its manufacturer, is not guaranteed or endorsed by the publisher.
Demena, B. A., and Afesorgbor, S. K. (2020). The effect of FDI on environmental emissions: evidence from a meta-analysis. Energy Policy 138, 138111192. doi:10.1016/j.enpol.2019.111192
Dietzenbacher, E., Kulionis, V., and Capurro, F. (2020). Measuring the effects of energy transition: a structural decomposition analysis of the change in renewable energy use between 2000 and 2014. Appl. Energy 258114040, 114040. doi:10.1016/j.apenergy.2019.114040
Gallego, B., and Lenzen, M. (2005). A consistent input-output formulation of shared producer and consumer responsibility. Econ. Syst. Res. 17 (4), 365–391. doi:10.1080/09535310500283492
Hille, E., Shahbaz, M., and Moosa, I. (2019). The impact of FDI on regional air pollution in the Republic of Korea: a way ahead to achieve the green growth strategy? Energy Econ. 81, 81308–81326. doi:10.1016/j.eneco.2019.04.004
Ji, X., Liu, Y., Wu, G., Su, P., Ye, Z., and Feng, K. (2022a). Global value chain participation and trade-induced energy inequality. Energy Econ. 112, 112106175. doi:10.1016/j.eneco.2022.106175
Ji, X., Liu, Y., Wu, G., Su, P., Ye, Z., and Feng, K. (2022b). Global value chain participation and trade-induced energy inequality. Energy Econ. 112, 112106175. doi:10.1016/j.eneco.2022.106175
Jin, Z., Duan, H., Wang, J., Yang, M., Guo, Y., and Cui, X. (2022). Heterogeneous impacts of GVCs participation on CO2 intensity: evidence from developed and developing countries/regions. Adv. Clim. change Res. 13 (2), 187–195. doi:10.1016/j.accre.2022.01.002
Jin, Z., Wang, J., Yang, M., and Tang, Z. (2022a). The effects of participation in global value chains on energy intensity: evidence from international industry-level decomposition. Energy Strategy Rev. 39100780, 100780. doi:10.1016/j.esr.2021.100780
Jin, Z., Wang, J., Yang, M., and Tang, Z. (2022b). The effects of participation in global value chains on energy intensity: evidence from international industry-level decomposition. Energy Strategy Rev. 39100780, 100780. doi:10.1016/j.esr.2021.100780
Kanemoto, K., Lenzen, M., Peters, G. P., Moran, D. D., and Geschke, A. (2012). Frameworks for comparing emissions associated with production, consumption, and international trade. Environ. Sci. Technol. 46 (1), 172–179. doi:10.1021/es202239t
Kim, T., and Tromp, N. (2021). Analysis of carbon emissions embodied in South Korea's international trade: production-based and consumption-based perspectives. J. Clean. Prod. 320, 320128839. doi:10.1016/j.jclepro.2021.128839
Li, Q., Wu, S., and Li, S. (2022). Weighing China's embodied CO2 emissions and value added under global value chains: trends, characteristics, and paths. J. Environ. Manag. 316, 316115302. doi:10.1016/j.jenvman.2022.115302
Li, X., Xie, W., Jim, C. Y., and Feng, F. (2021). Holistic LCA evaluation of the carbon footprint of prefabricated concrete stairs. J. Clean. Prod. 329129621, 129621. doi:10.1016/j.jclepro.2021.129621
Liu, C., and Zhao, G. (2021). Can global value chain participation affect embodied carbon emission intensity? J. Clean. Prod. 287125069, 125069. doi:10.1016/j.jclepro.2020.125069
Liu, H., Zong, Z., Hynes, K., and De Bruyne, K. (2020). Can China reduce the carbon emissions of its manufacturing exports by moving up the global value chain? Res. Int. Bus. Finance 51101101, 101101. doi:10.1016/j.ribaf.2019.101101
Long, R., Li, J., Chen, H., Zhang, L., and Li, Q. (2018). Embodied carbon dioxide flow in international trade: a comparative analysis based on China and Japan. J. Environ. Manag. 209, 209371–209381. doi:10.1016/j.jenvman.2017.12.067
Lv, K., Feng, X., Kelly, S., Zhu, L., and Deng, M. (2019). A study on embodied carbon transfer at the provincial level of China from a social network perspective. J. Clean. Prod. 225, 2251089–2251104. doi:10.1016/j.jclepro.2019.03.233
Meng, B., Peters, G. P., Wang, Z., and Li, M. (2018). Tracing CO2 emissions in global value chains. Energy Econ. 73, 7324–7342. doi:10.1016/j.eneco.2018.05.013
Morris, F., Allen, S., and Hawkins, W. (2021). On the embodied carbon of structural timber versus steel, and the influence of LCA methodology. Build. Environ. 206108285, 108285. doi:10.1016/j.buildenv.2021.108285
Pakdel, A., Ayatollahi, H., and Sattary, S. (2021). Embodied energy and CO2 emissions of life cycle assessment (LCA) in the traditional and contemporary Iranian construction systems. J. Build. Eng. 39102310, 102310. doi:10.1016/j.jobe.2021.102310
Pan, A., Xiao, T., and Dai, L. (2022a). The structural change and influencing factors of carbon transfer network in global value chains. J. Environ. Manag. 318, 318115558–115558. doi:10.1016/j.jenvman.2022.115558
Pan, A., Xiao, T., Dai, L., and Shi, X. (2022b). Global transfer of embodied energy: from source to sink through global value chains. Sustain. Prod. Consum. 31, 3139–3151. doi:10.1016/j.spc.2022.01.030
Peters, G. P., and Hertwich, E. G. (2008). CO2 embodied in international trade with implications for global climate policy. Environ. Sci. Technol. 42 (5), 1401–1407. doi:10.1021/es072023k
Shi, Q., Shan, Y., Zhong, C., Cao, Y., and Xue, R. (2022). How would GVCs participation affect carbon intensity in the “Belt and Road Initiative” countries? Energy Econ. 111, 111106075. doi:10.1016/j.eneco.2022.106075
Shi, Q., Zhao, Y., Qian, Z., Zheng, L., and Wang, S. (2022a). Global value chains participation and carbon emissions: evidence from Belt and Road countries. Appl. Energy 310, 310118505. doi:10.1016/j.apenergy.2021.118505
Shi, Q., Zhao, Y., Qian, Z., Zheng, L., and Wang, S. (2022b). Global value chains participation and carbon emissions: evidence from Belt and Road countries. Appl. Energy 310, 310118505. doi:10.1016/j.apenergy.2021.118505
Su, B., and Ang, B. W. (2010). Input–output analysis of CO2 emissions embodied in trade: the effects of spatial aggregation. Ecol. Econ. 70 (1), 10–18. doi:10.1016/j.ecolecon.2010.08.016
Su, B., and Ang, B. W. (2012). Structural decomposition analysis applied to energy and emissions: some methodological developments. Energy Econ. 34 (1), 177–188. doi:10.1016/j.eneco.2011.10.009
Su, B., Ang, B. W., and Low, M. (2013). Input–output analysis of CO2 emissions embodied in trade and the driving forces: processing and normal exports. Ecol. Econ. 88, 88119–88125. doi:10.1016/j.ecolecon.2013.01.017
Su, B., Huang, H. C., Ang, B. W., and Zhou, P. (2010). Input-output analysis of CO2 emissions embodied in trade: the effects of sector aggregation. Energy Econ. 32 (1), 166–175. doi:10.1016/j.eneco.2009.07.010
Sun, C., Li, Z., Ma, T., and He, R. (2019). Carbon efficiency and international specialization position: evidence from global value chain position index of manufacture. Energy policy 128, 128235–128242. doi:10.1016/j.enpol.2018.12.058
Takayabu, H., Kagawa, S., Fujii, H., Managi, S., and Eguchi, S. (2019). Impacts of productive efficiency improvement in the global metal industry on CO2 emissions. J. Environ. Manag. 248, 248109261–109261. doi:10.1016/j.jenvman.2019.109261
van Vuuren, D. P., Riahi, K., Calvin, K., Dellink, R., Emmerling, J., Fujimori, S., et al. (2017a). The Shared Socio-economic Pathways: trajectories for human development and global environmental change. Glob. Environ. change 42, 42148–42152. doi:10.1016/j.gloenvcha.2016.10.009
van Vuuren, D. P., Stehfest, E., Gernaat, D. E. H. J., Doelman, J. C., van den Berg, M., Harmsen, M., et al. (2017b). Energy, land-use and greenhouse gas emissions trajectories under a green growth paradigm. Glob. Environ. Change 42, 42237–42250. doi:10.1016/j.gloenvcha.2016.05.008
Wang, H., Ang, B. W., and Su, B. (2017). Assessing drivers of economy-wide energy use and emissions: IDA versus SDA. Energy policy 107, 107585–107599. doi:10.1016/j.enpol.2017.05.034
Wang, J., Rickman, D. S., and Yu, Y. (2022). Dynamics between global value chain participation, CO2 emissions, and economic growth: evidence from a panel vector autoregression model. Energy Econ. 109105965, 105965. doi:10.1016/j.eneco.2022.105965
Wang, J., Wan, G., and Wang, C. (2019). Participation in GVCs and CO2 emissions. Energy Econ. 84104561, 104561. doi:10.1016/j.eneco.2019.104561
Wang, L., Yue, Y., Xie, R., and Wang, S. (2020). How global value chain participation affects China's energy intensity. J. Environ. Manag. 260, 260110041. doi:10.1016/j.jenvman.2019.110041
Wang, S., Wang, X., and Chen, S. (2022). Global value chains and carbon emission reduction in developing countries: does industrial upgrading matter? Environ. Impact Assess. Rev. 97106895, 106895. doi:10.1016/j.eiar.2022.106895
Wang, S., Wang, X., and Tang, Y. (2020). Drivers of carbon emission transfer in China—an analysis of international trade from 2004 to 2011. Sci. Total Environ. 709135924, 135924. doi:10.1016/j.scitotenv.2019.135924
Wang, Z., Wei, S., Yu, X., and Zhu, K. (2022). Global value chains over business cycles. J. Int. Money Finance 126102643, 102643. doi:10.1016/j.jimonfin.2022.102643
Xu, J., Teng, Y., Pan, W., and Zhang, Y. (2022). BIM-integrated LCA to automate embodied carbon assessment of prefabricated buildings. J. Clean. Prod. 374133894, 133894. doi:10.1016/j.jclepro.2022.133894
Ye, C., Ye, Q., Shi, X., and Sun, Y. (2020). Technology gap, global value chain and carbon intensity: evidence from global manufacturing industries. Energy policy 137, 137111094. doi:10.1016/j.enpol.2019.111094
Yi, X., Lu, Y., He, G., Li, H., Chen, C., and Cui, H. (2022). Global carbon transfer and emissions of aluminum production and consumption. J. Clean. Prod. 362, 362132513. doi:10.1016/j.jclepro.2022.132513
Zhang, Y. (2022). Analysis of China's energy efficiency and influencing factors under carbon peaking and carbon neutrality goals. J. Clean. Prod. 370133604, 133604. doi:10.1016/j.jclepro.2022.133604
Zhao, L., Yang, Y., Wang, C., Lv, Y., and Xue, J. (2023). Patterns of embodied pollutant emissions along the global light industrial chain: a complex network perspective. J. Clean. Prod. 384135559, 135559. doi:10.1016/j.jclepro.2022.135559
Zhao, X., Lynch, J. G., and Chen, Q. (2010). Reconsidering baron and kenny: myths and truths about mediation analysis. J. Consumer Res. 37 (2), 197–206. doi:10.1086/651257
Zhong, Z., Guo, Z., and Zhang, J. (2021). Does the participation in global value chains promote interregional carbon emissions transferring via trade? Evidence from 39 major economies. Technol. Forecast. Soc. Change 169120806, 120806. doi:10.1016/j.techfore.2021.120806
Zhou, D., Zhou, X., Xu, Q., Wu, F., Wang, Q., and Zha, D. (2018). Regional embodied carbon emissions and their transfer characteristics in China. Struct. change Econ. Dyn. 46, 46180–46193. doi:10.1016/j.strueco.2018.05.008
Zhu, H., Duan, L., Guo, Y., and Yu, K. (2016). The effects of FDI, economic growth and energy consumption on carbon emissions in ASEAN-5: evidence from panel quantile regression. Econ. Model. 58, 58237–58248. doi:10.1016/j.econmod.2016.05.003
Keywords: embodied carbon, input–output model, GVC, SDA, intermediary effect
Citation: Zheng M, Ni J and Wen D (2024) Has GVC participation exacerbated inequality of the embodied carbon in fossil energy industry export trade?. Front. Environ. Sci. 11:1293462. doi: 10.3389/fenvs.2023.1293462
Received: 13 September 2023; Accepted: 08 December 2023;
Published: 04 January 2024.
Edited by:
Erginbay Uğurlu, İstanbul Aydın University, TürkiyeReviewed by:
Xiaoqing Wang, Ocean University of China, ChinaCopyright © 2024 Zheng, Ni and Wen. This is an open-access article distributed under the terms of the Creative Commons Attribution License (CC BY). The use, distribution or reproduction in other forums is permitted, provided the original author(s) and the copyright owner(s) are credited and that the original publication in this journal is cited, in accordance with accepted academic practice. No use, distribution or reproduction is permitted which does not comply with these terms.
*Correspondence: Jingsheng Ni, NjEyMDIyMDM5M0BtYWlsLmp4dXN0LmVkdS5jbg==
Disclaimer: All claims expressed in this article are solely those of the authors and do not necessarily represent those of their affiliated organizations, or those of the publisher, the editors and the reviewers. Any product that may be evaluated in this article or claim that may be made by its manufacturer is not guaranteed or endorsed by the publisher.
Research integrity at Frontiers
Learn more about the work of our research integrity team to safeguard the quality of each article we publish.