 Xuan Zou1
 Yao He
94% of researchers rate our articles as excellent or good
Learn more about the work of our research integrity team to safeguard the quality of each article we publish.
Find out more
ORIGINAL RESEARCH article
Front. Environ. Sci. , 08 December 2023
Sec. Environmental Policy and Governance
Volume 11 - 2023 | https://doi.org/10.3389/fenvs.2023.1288873
Environmental supervision is significantly disrupted by local economic development and typically characterized by a lack of independence in China. This paper investigates the impacts and mechanisms of the vertical management reform of environmental protection department in China on urban air quality. We construct a principal–agent model suitable for explaining the interactions between the central and local governments and elaborate the intrinsic mechanism of EVM on strengthening environmental supervision. Using manually collected data, we conduct EVM as a quasi-experiment and construct a time-varying difference-in-difference (DID) model. Our empirical results show that the EVM significantly strengthens regional environmental supervision and reduces urban air pollution, bringing abatement in the PM2.5 concentration. The mechanism shows that EVM increases enterprises’ green innovation and attracts new entrants, further promoting industrial upgrading. Our study provides a new perspective on environmental governance and urban air quality in emerging countries such as China.
The acceleration of industrialization in China has prompted economic growth, but excessive industrial emissions have damaged the environment (Cole et al., 2011). Haze and pollution-related disputes and accidents have raised serious concerns among both the public and government (Vanrooij, 2010; Chung et al., 2022). In China, air pollution is a particularly serious problem. According to the Communique on the State of China’s Ecological Environment released in 2021, 35.7% of China’s cities exceeded ambient air quality standards in 2020. The annual average urban PM2.5 concentration was 35g/m3 in 2020, which is much higher than the World Health Organization’s annual average guideline value of 10 g/m3 for PM2.5 concentration. Air pollution governance, as a typical public good, has negative externalities. The government should regulate this negative externality behavior by administrative means (Sandholm, 2005). There has been a growing awareness that economic growth should not be compromised, and the conducive environmental institutional factor plays a crucial role in economic growth (Shen, et al., 2023; Tao et al., 2023). Based on these considerations, the Chinese government has become concerned about the severe air pollution in recent years and emphasized the environmental system restructure and strengthened environmental supervision. In this paper, we investigate the environmental governance effects of this reform driven by the central government. The prominent feature of this reform is to centralize the rights of environmental supervision. Under the guidance of this reform, the grassroots environmental departments play a key role in the environmental system, which has not been explored to the extent of the effects of the environmental governance. Focusing on this, we attempt to identify the governance effect of centralized environmental supervision and provide the influence path behind this reform.
A lot of research has evaluated the performance of environmental regulation and attempted to actively solve the problem of environmental pollution in China (Lelieveld et al., 2015; Olabi and Abdelkareen, 2022). Chen and Dagestani (2023a) showed that the smart city pilot policies in China have a positive effect on the green urban development. Chen (2023) empirically tested the two control zones as China’s first air pollution regulation resulted in a decrease in employment and inhibited the firm entry in targeted areas and sectors. Van Der Kamp et al. (2017) and Hao et al. (2020) pointed out that the previous environmental decentralization management caused local authorities to slow down or block the implementation of centrally mandated governance reforms, especially when these may negatively affect local development goals, which may inhibit the environmental governance. The influences affecting government environmental regulation are complex, including the pollution abatement costs and heterogeneous firms in the jurisdiction (Spulber, 1998). Building on the aforementioned studies, this paper adds to the discussion on the potential reasons of China’s environmental challenges from the perspective of environmental administrative organization construction.
For the administrative governance mechanism of air pollution, some economists have made discussions on local officials’ behaviors. The promotion incentives of local officials (Zhao et al., 2022), the political connections (Chen and Dagestani, 2023b), and the length of the tenure of officials (Eaton and Kostka, 2013) also affect the efficiency of local governments for environmental governance. Research has documented the trans-regional environmental externalities with environmental decentralization (Fell and Kaffine, 2014; Zhang. et al., 2018), while a related study on centralization is inadequate. Compared with previous research, our study uses the vertical management reform of the environmental protection department (EVM) as a typical case of environmental centralization and focuses on the air pollution reduction effect.
Furthermore, we attempt to offer a new perspective on the well-documented ineffective environmental regulation in China. Our theoretical analysis reveals that due to the incentive incompatibility between the central and local governments, Chinese local governments are less keen on environmental protection than the central government, and the centralization of environmental supervision driven by EVM internalized the negative environmental externalities. We offer a normative empirical investigation for an authentic causal relationship between reform and urban air quality in China. We use the variations in the reform timings of different cities adopting the EVM to conduct a time-varying difference-in-difference (DID) regression as the baseline empirical model. Our empirical results reveal that, after the reform, cities experienced constant decreases in the PM2.5 concentration. The primary potential threat of the DID strategy is that the cities may not be randomly selected for the reform. We attempt to address this concern in the following way: first, a key DID identifying assumption is the parallel trend assumption before the reform. Hence, we follow a dynamic event study approach to estimate year-wise changes in the urban air condition before and after this reform, ensuring the pre-treatment balance. Then, the placebo test is conducted to exclude the chance of unobservable factors affecting our empirical results. This paper not only focuses on the impact of EVM but also finds the heterogeneous performance of air reduction effects of the environmental vertical reform. First, we find the heterogeneous performance of air pollution reduction effects of EVM moderated by regional environmental governance. Furthermore, we find that the reforms can alleviate air pollution for cities that have district-wide heating. Finally, from the perspective of local government behaviors, we also find out that the local officials with high risk aversion will be less willing to curb environmental pollution. We provide a strong basis for decision-making to improve and optimize the implementation effects of the environmental protection system, as well as a reference for emerging economies.
Furthermore, we also rule out alternative explanations that might give rise to our results. We attempt to explore the mechanisms to explain the air quality effect using the micro-enterprise data and find out that EVM improves enterprise green innovation performance. We further study influence mechanisms and find that the implementation of EVM can effectively improve the productivity of new entrants. From the perspective of the industrial sector, we explore the mechanisms through which EVM promote the upgradation of the industrial structure, opening up the black box of how policy works and, thus, providing a reference for how to open up influence channels and achieve air pollution reduction. The analysis provides policymakers a basis to appraise the social impact of environmental centralization reforms.
The rest of this paper is organized as follows: Section 2 introduces the background of EVM; Section 3 provides a conceptual framework and puts forward theoretical hypotheses; Section 4 provides about data; Section 5 exhibits empirical design; Section 6 presents a robustness check; Section 7 provides the heterogeneity analysis, while Section 8 discusses further analysis; and Section 9 provides the conclusions and policy implications. Figure 1 depicts the theoretical framework of this paper.
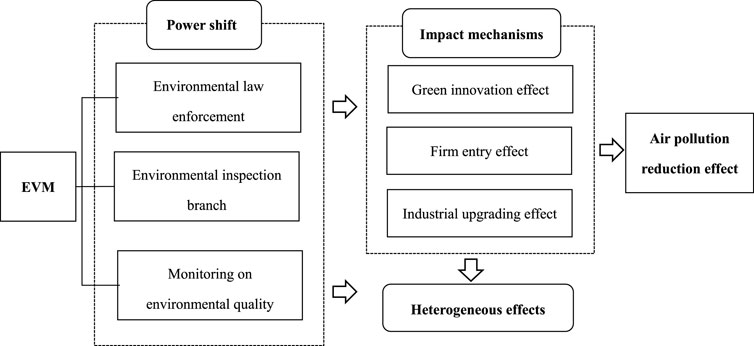
FIGURE 1. Theoretical framework of this paper.
China’s local environmental protection departments formerly practiced a hierarchical management system. In the territorial environmental system, the environmental departments are both led by its superior department in the vertical line and the government in the horizontal line, known as “dual management.” The dual management is considered from three dimensions: first, the local governments have sufficient authority to determine personnel allocations, funding collection, and cadre recruitments of local environmental protection bureaus (EPBs). Moreover, there are vague boundaries in the divisions of responsibilities and decision-making procedures among local governments at different levels.
To maintain the imperative political cohesion in the implementation process, EVM was launched. Environmental departments under this reform are removed from the leadership of the horizontal line. Specifically, the control of personnel allocations, funding collection, and cadre recruitments were shifted back to the vertical line to secure their instruction binding. The feature of this restructure of the environmental system is that the county-level EPBs are adjusted to be dispatched agencies of the municipal EPBs1, centralizing the environmental system in their jurisdictions. Furthermore, the pilot of the environmental vertical reform was distributed in the northeast, east, and west of China. Approximately 200 grassroot environmental agencies have carried out the environmental vertical reform before the full rollout of vertical environmental protection. We focus on these pilot cities and attempt to investigate the air emission reduction effect of the reform. Figure 2 shows the institution rearrangement of EVM.
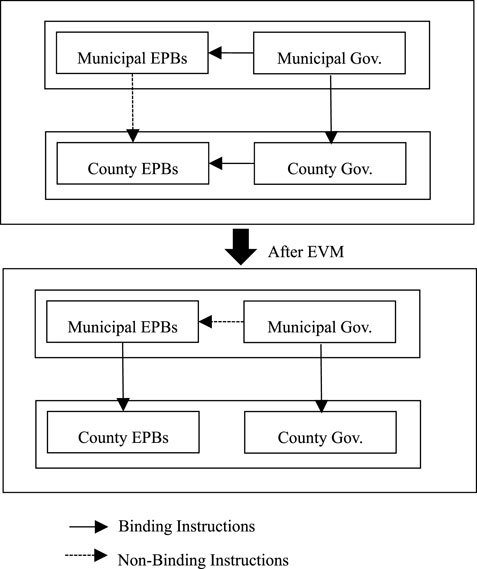
FIGURE 2. Institutional rearrangement of EVM.
In practice, the implementation of EVM often faces information asymmetry. Based on the ordinary principal–agent model between the central and local governments, we introduce the degree of local environmental governance efforts and identify the environmental governance effect of EVM. In order to analyze the problem, we propose three hypotheses: (1) local governments, as agents, face long-term environmental protection tasks and economic growth during local officials’ tenure. The local officials are risk-averse. We set their risk aversion function as the absolute risk aversion utility function
The central government cannot observe the effort of local governments on different tasks, but it can observe the performance generated by local governments. The social welfare generated by local governments in environment protection is
The social benefits generated by local governments in the economic growth are represented as
In Eqs 1 (2), A denotes the technical level, and
The total social welfare generated by local governments is equal to the welfare generated by environmental protection plus the welfare generated by economic growth:
The local officials who received the performance rewards during their tenure are a linear function of the total social welfare:
Local governments need to pay corresponding costs to accomplish the tasks given by the upper government:
where
Therefore, the actual revenue received by the local government is
The local government is risk-averse, and the absolute risk-averse utility function is
Local governments satisfy the incentive compatibility constraint:
The central government is risk-neutral. Its expected utility is equal to the expected revenue. The social welfare generated by the central government is the social welfare by the local government minus the corresponding expenditures paid to the local government:
The central government can evaluate the political performance of local governments, reflecting by the fact that local governments will maximize their deterministic equivalent income. So the incentive compatibility constraint is
Thus, the principal–agent problem between local and central governments based on dual objectives is transformed into solving the optimization problem:
The optimal degree of effort and incentive coefficient are obtained by solving for
We use
Eq. 15 shows that the optimal level of local environmental governance efforts is related to the initial factor endowment of local environmental governance, the marginal costs of environmental governance, the degree of local risk aversion, and the marginal conversion rate of the goal between economic growth and environmental protection.
For Eq. 15, we use MATLAB to further analyze the relevant factors affecting the optimal degree of efforts of local environmental governance. First, we establish that the relative importance of environmental governance is higher than that of economic development. After the 18th National Congress, ecological civilization construction has become an important task for local governments. Therefore, the marginal conversion rate of the local government to make a choice between economic development and environmental protection is
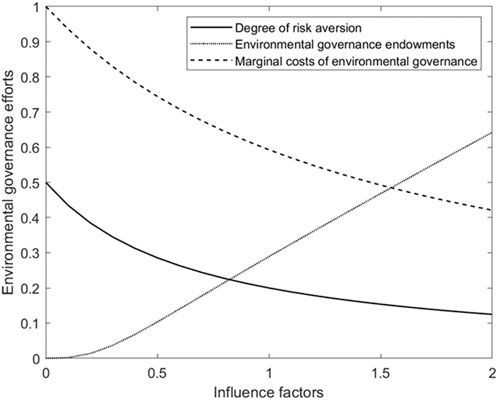
FIGURE 3. Factors affecting local environmental governance efforts.
Controlling other factors, we test how the degree of environmental governance endowment influences local governments’ environmental governance. It can be observed that a higher environmental governance endowment promotes the degree of the local government’s environmental governance efforts. We can observe that the high marginal costs of local environmental governance result in the local governments becoming less willing to put efforts into the environmental governance. EVM has effectively reduced the marginal costs of environmental governance for local governments by centralizing environmental supervision authority in the upper environmental departments. The decrease in the cost of environmental governance strengthens not only the degree of local environmental governance efforts but also the conversion rate of local governments between environmental protection and economic development goal choices. Admittedly, local environmental governance efforts are related to the type of local officials. The local officials tend to be more concerned about the political risks which may affect their careers.
The theoretical model constructed here illustrates the necessity and scientificity of EVM in the doctrine.
We further elaborate the soundness of the aforementioned theoretical analysis based on the existing literature and ultimately propose mechanism hypotheses.
First, the prominent impact channel through which EVM affects urban air quality induces the green innovation of polluting enterprises. According to the compliance cost hypothesis, the high cost of complying with stringent and tedious environmental legislation will inhibit achieving pollution control objectives (Barbera and McConnell, 1990) and increase corporations’ environmental expenditure, which discourage innovation (Song and Han, 2022; Dagestani, 2023). Compared with these market-based regulations, policy-oriented instruments may encourage innovative behavior, offsetting the cost of environmental regulation (Dagestani. et al., 2023). EVM as a typical policy-based environmental regulation strengthens the environmental supervision and improves the independence of environmental law enforcement, which enhances the environmental information disclosure standards. The transparent environmental information disclosure will be encouraged in heavy-pollution industries to strictly comply with environmental standards and promote green technological advances (Dagestani and Qing, 2022; Dagestani and Qing, 2022). The increase in the intensity of environmental regulations can force polluting firms to improve their productivity and alleviate the pressure on their survival (Guo et al., 2021).
Second, EVM attracts the enterprises to enter and improves the productivity of new entrants. Strengthening regional environmental regulation acts as the automatic screening mechanism, where potential entrants with low productivity may be constrained by high abatement costs and choose to exit the market (Cui and Li, 2023). Furthermore, the increased environmental performance assessment has a more pronounced inhibitory effect on the entry of inefficient firms. Therefore, the coping strategies adopted by polluting firms based on the survival motive will further complicate the question of the location choice of firms (Asturias. et al., 2023). Moreover, strengthening the environmental regulations improves the condition of local infrastructure and decreases the entry cost. The lower-entry barriers attract the new entrants. The EVM offers polluting enterprises the option of either paying a cost pondered by the unit of pollutant emitted or investing in pollution control sectors and technologies. When the benefits of improved innovation offset compliance costs, firms’ performance, such as their productivity, will increase. Therefore, based on these analyses, we seek to understand the extent to which the growth in new firm entry resulted from the cities adopting EVM versus non-EVM cities.
Finally, EVM promotes industrial upgrading. Many economists contend that the strengthening environmental regulation and optimizing the environmental organization have a strong connection with the upgrading industrial structure (Luan et al., 2021; Jakobsen et al., 2022). In the EVM pilot areas, the environmental costs faced by the high-emission industries are higher than those of the clean industries. Firms with profit maximization goals will adapt to the change and reduce investment in high-emission industries and increase investment in clean industries, which will promote the industrial structure of upgrading restructuring (Hu et al., 2020).
Based on the aforementioned analysis, three hypotheses of impact mechanisms can be formulated as follows:
H1. EVM promotes the green innovation of polluting enterprises in China, which is conducive to improving air quality.
H2. EVM attracts the new entrants of industrial firms and increases the productivity of new entrants, thus ameliorating urban air quality.
H3. EVM favors the industrial upgrading and reduces air pollution.
Figure 4 shows the methodological flow of this paper to generalize the following empirical assessment.
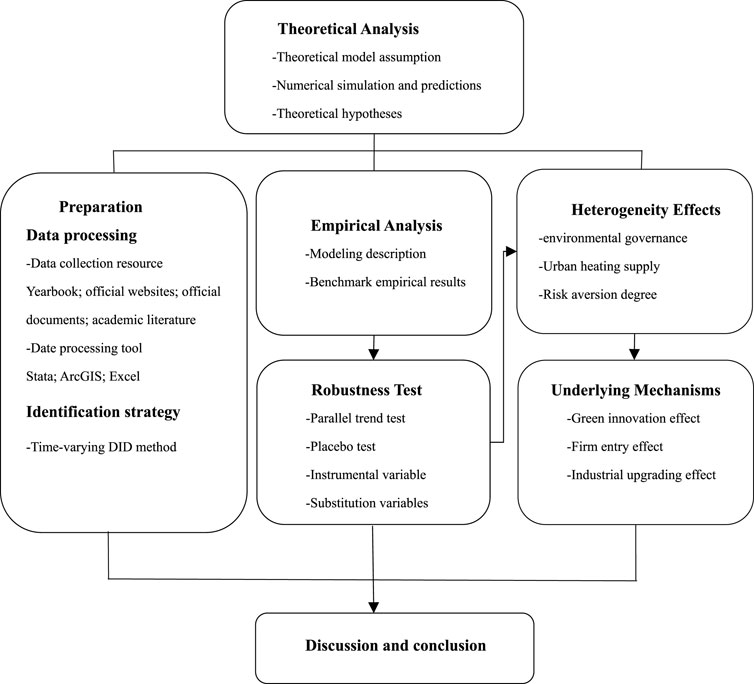
FIGURE 4. Methodological flow of this paper.
The explanatory variable is the implementation of the pilot of the environmental protection vertical management reform at the prefecture level. Before this reform began to gradually spread across the country in 2016, a number of grassroot environmental protection administrative organizations in China had already carried out environmental protection vertical reform. This paper selected 2000–2011, which is the innovation stage of China’s environmental protection administrative system. We checked the official website of each prefecture-level city environmental protection bureau and county environmental protection sub-bureau and manually collected the pilot samples during 2000–2011. In terms of organizing the resulting vertical management reform pilot, China’s northeastern region, central region, and coastal areas have conducted the reform pilot. From the sample distribution, the problem of sample selection bias is effectively minimized.
The core explanatory variable is the degree of air pollution. We measure air pollution using the PM2.5 concentration, which comes from the 0.01o*0.01o grid data on the ground-level PM2.5 concentration, obtained from the University of Washington ACAG website2. The raster data were parsed down to the prefecture-level city using ArcGIS software in conjunction with vector maps of administrative areas.
Control variables at the level of urban economic activity: ① local economic level (dn): it is measured by the nighttime lighting data. The data formation before 2013 is DMSP/OLS, and after 2013, it is NPP-VIIRS. We transformed the data after 2013, following Hsu FC et al. (2015). According to the theory of the environmental Kuznets curve, the level of economic development affects the level of environmental pollution; ② population density (lnpop): it is measured by the number of people per unit area of administrative region and taken in the logarithm, reflecting the impact of population concentration on air pollution. The coefficient (lnpop) is expected to be positive because more dynamic and concentrated economic activities will consume more energy and fuels and increase emissions of pollutant gases; ③ Index of Regional Innovation and Entrepreneurship in China (IRIEC) (innov): it is derived from the indicator data constructed by the Enterprise Big Data Research Center of Peking University, reflecting the regional innovation. The coefficient is expected to be negative because the improvement in regional innovation and entrepreneurship is conducive to the technological advance, thus achieving emission reduction; ④ the value added to the secondary industry as a proportion of GDP (sec): industrial production may increase the emission of pollutant gases and deteriorate air quality. The coefficient is expected to be positive because a high share of industrial production will increase emissions of pollutant gases and worsen air quality; and ⑤ foreign direct investment (fdi): the coefficient is positive. According to the “pollution paradise” hypothesis, developing countries are prone to become a “pollution shelter.” The introduction of foreign direct investment may deteriorate the local environment.
In particular, considering the correlation between the meteorological condition and air pollution, we further control the important meteorological condition. Control variables for urban weather conditions: these data at the average city-year level come from the National Climate Center of China. ① Average temperature (degrees Celsius) (tem): it is measured by the urban annual average temperature. The coefficient is expected to be negative. The higher the average urban temperature, the stronger the air convection activity and the higher the diffusion degree of pollutants, which is conducive to improving the air quality. ② Average humidity (hum): it is calculated by the percentage of water vapor pressure compared to the saturated water vapor pressure. The coefficient is expected to be positive. The lower the relative urban humidity, the easier it is for the respirable particles in the air to settle and spread, which is conducive to improve the air pollution. ③ Sunshine hours (sundr): it means the average number of hours of sunshine per city in per year. The coefficient is expected to be negative because long sunshine hours are less weakening of solar radiation, inhibiting ozone generation and improving the air condition.
Table 1 presents the descriptive statistics of some key control variables at the city level.
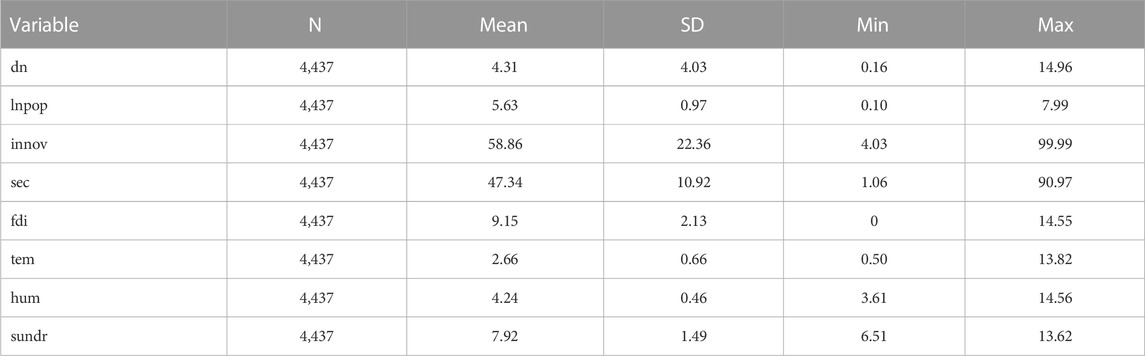
TABLE 1. Summary statistics.
Taking advantage of the panel data, we use a two-way fixed-effects model to investigate the impact of EVM on urban air pollution. Furthermore, it is appropriate to construct a quasi-experiment of the pilot policy of the environmental vertical reform and adopt the time-varying difference-in-difference (DID) method to focus on how the deviations from the level relate to changes in policy (Callaway and Sant’Anna, 2019). This identification strategy will minimize the endogenous problems as much as possible. We model this relationship using the econometric model as follows:
In Eq. 16,
The empirical benchmark regressions results are given in Table 2. Column (1) only controls for city fixed effects and year fixed effects. Column (2) controls for variables on economic characteristics at the city–year level. Column (3) further controls for weather control variables at the city–year level. Furthermore, the current PM2.5 concentration does not have an impact on the historical environmental vertical reform decision. We lag one-period explanatory variables in order to alleviate the reverse causality problem. In columns (4)–(6), the regression coefficients are still significant.
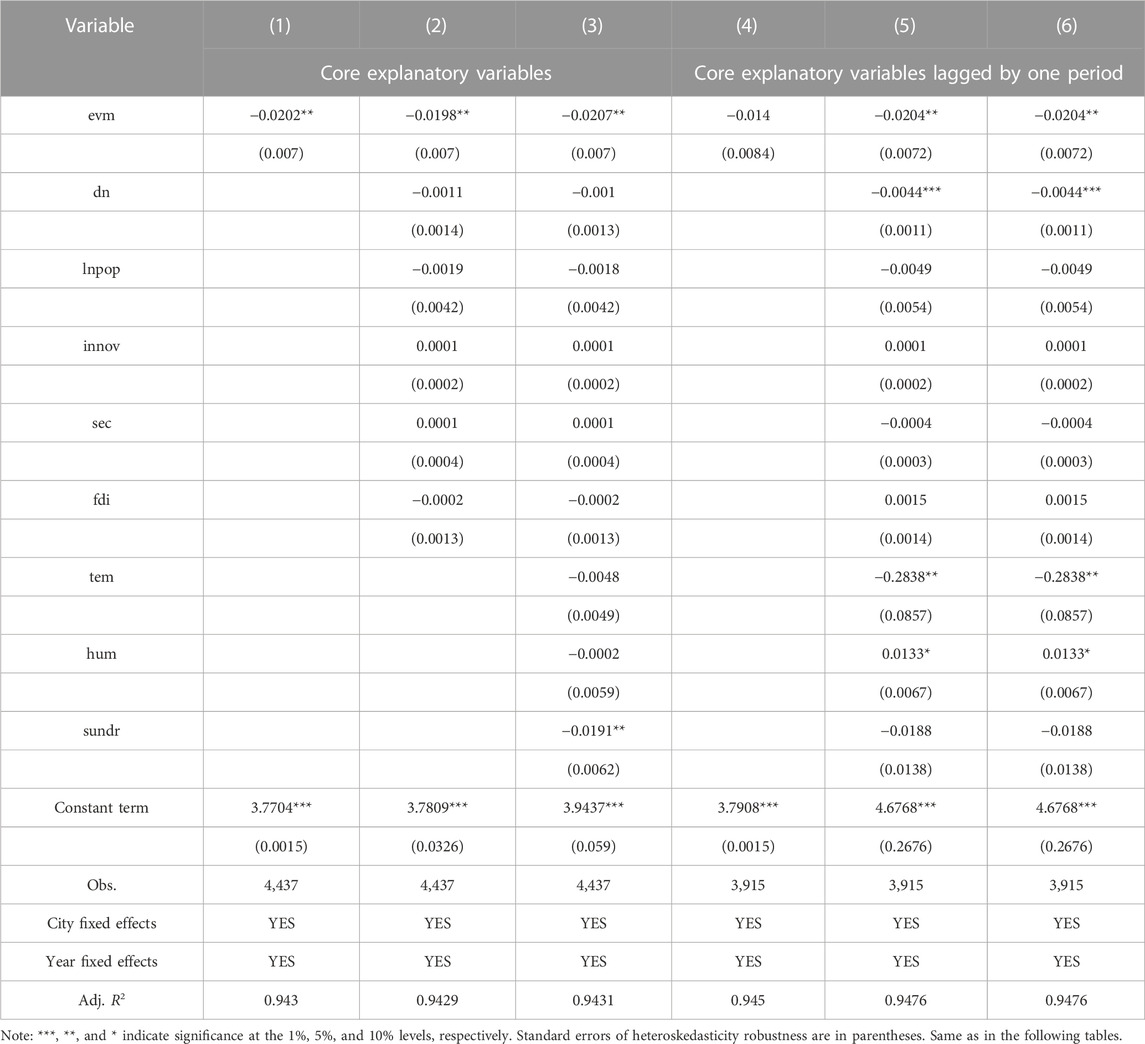
TABLE 2. Baseline regression results.
All regression results have negative coefficients and are statistically significant at 1%. After controlling all the effects in column (3), we can see that the PM2.5 concentration decreases by approximately 2.07% points in the pilot cities that have adopted the environmental vertical reforms. The baseline results illustrates that EVM has improved air quality in the jurisdiction.
The hypothetical premise of applying the DID method is to pass the parallel trend test, which requires that the trend in the outcome variables of the pilot cities and non-pilot cities is the same before the policy occurred. Referring to the studies by Amore and Minichilli (2018) and He et al. (2020a), we use the event study method to examine whether the benchmark model satisfies the parallel trend assumption, as shown in Equation 17.
There tends to be a time lag in policy implementation. Based on this, we use the period before the policy as the base period. Table 3 demonstrates the empirical results of the coefficient (
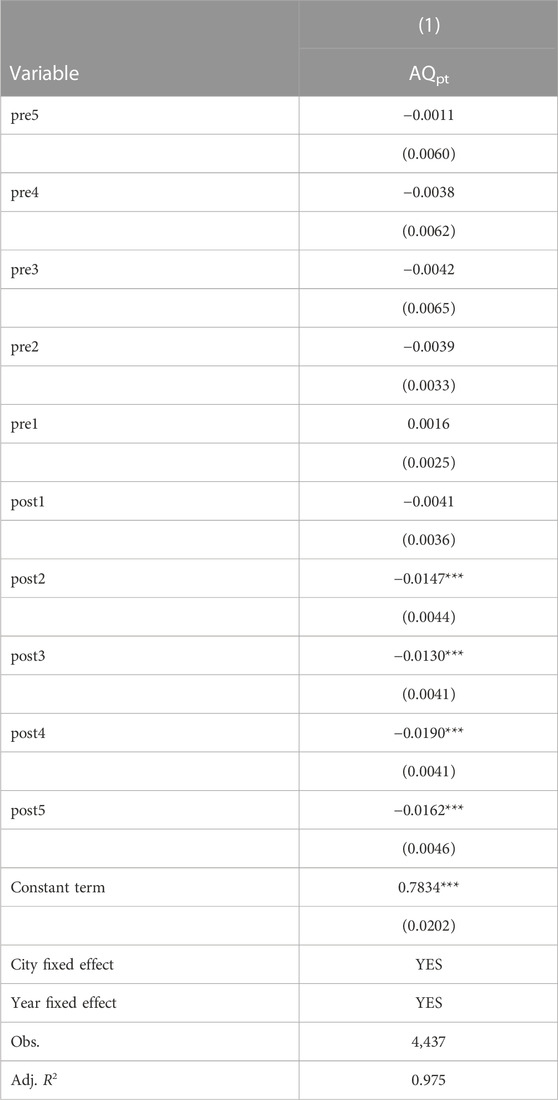
TABLE 3. Event study results.
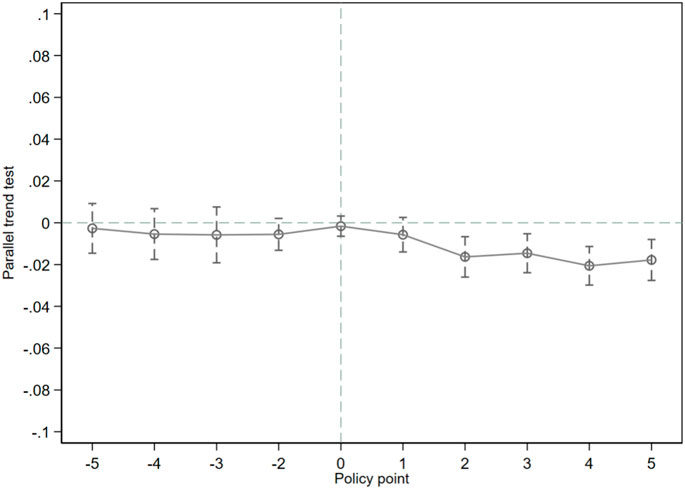
FIGURE 5. Parallel trend test.
In Table 3 and Figure 5, we can conclude that none of the coefficients before the reform is significant and the coefficients are close to 0. The trend of the outcome variables before the reform in the treatment group and control group is the same, satisfying the parallel trend. Furthermore, after the base period (the x-axis is greater than or equal to 1), the coefficients are significantly negative, indicating EVM may effectively reduce air pollution.
Although we added adequate control variables at the city levels that can affect the air pollution, the DID strategy may still be confounded by other unobservable policies that affect local air pollution and, thus, lead to estimation bias. Following Ferrara et al. (2012) and Wang et al. (2013), we use the placebo test to rule out such effects. The specific strategies are as follows: first, we randomly select city p in year t, where the environmental vertical reform occurs. Then, we randomly generate variable
The placebo test results are shown in Figure 6, where the distribution of the coefficients follows a normal distribution with 0 as the mean, which is far from the estimated coefficient in the benchmark regression results (−0.0207), thus indicating that the coefficients are not significant, ruling out the possibility that other factors interfere with the EVM policy effect. Our identification is unbiased, and no unobserved characteristics affect our empirical results. It further verifies that the environmental vertical reform has improved the air quality within the jurisdiction.
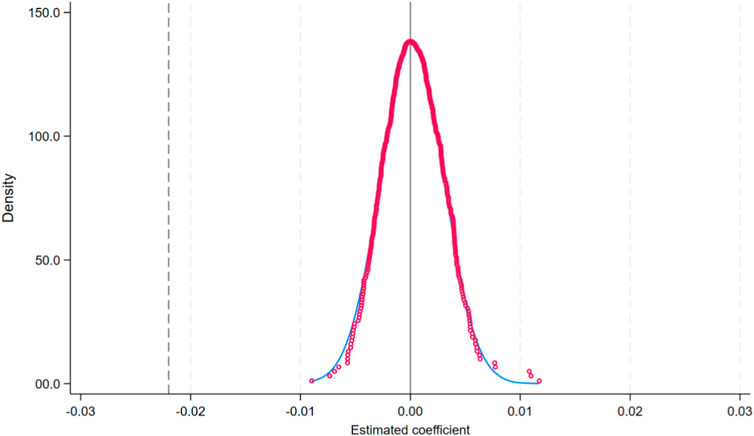
FIGURE 6. Placebo test.
Our empirical analysis relies on a DID estimate to assess the impact of the EVM reform, given that selection into EVM is not exogenous but reflects initial high air pollution. However, it is worth noting that the selection of pilot cities for the environmental vertical reform may not be random and likely to be measured with errors (Deryugina et al., 2019). The more polluted areas are more likely to attract the central government’s attention to their environmental governance (He et al., 2020b). We aim to find an appropriate instrumental variable for the core explanatory variable. In practice, the meteorological conditions which slow down the dispersion of pollutants in the air likely lead to the adoption of stricter environmental regulation. Hence, there will be less incentives for local environmental management agencies and more likely to attract the attention of the central government to become pilot cities for the environmental protection reform. Referring to the studies by Broner et al. (2012) and Hering and Poncet (2014), we instrument the environmental policy using the ventilation coefficient (VC), which reflects the meteorological conditions that influence the speed of dispersion of air pollutants. The mathematical formula for determining the ventilation coefficient is as follows:
where
Table 4 reports the results of the 2SLS regression, where columns (1) (2) are without control variables. According to columns (1) (3), it can be found that the F-values of the first-stage regressions are all greater than 10 and statistically significant at 1%, which indicates that the VC indicators is not a weak instrumental variable. The results of the second stage of columns (2) (4) show that the environmental vertical reform presents a significant negative effect on air pollution. In particular, after the inclusion of control variables, the PM2.5 concentration in the jurisdiction will decrease by 0.1602 units.
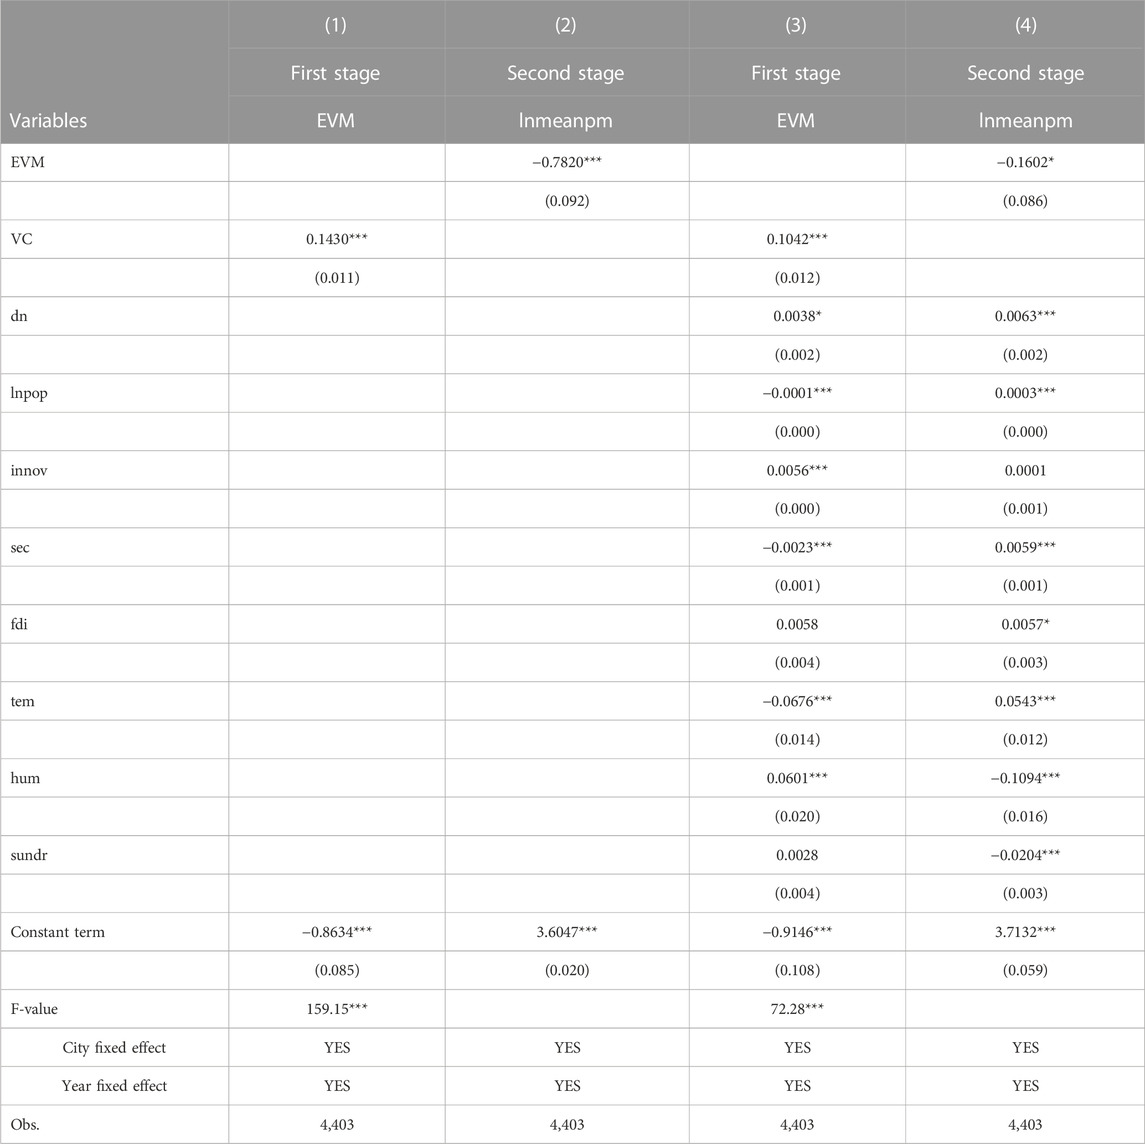
TABLE 4. 2SLS regression results.
Furthermore, in order to measure the strength of government environmental governance, we select the frequency of vocabulary on air pollution environmental protection in local government work reports as an instrumental variable. Specifically, we manually collect the government work reports of 133 cities from 2003 to 2016 and conduct the textual analysis. The total number of words appearing in the work reports relates to air pollution, i.e., “carbon dioxide, sulfur dioxide, PM2.5, PM10, air, emission reduction, and low carbon.” We calculate the proportion of the total number of words in the whole text. The more frequent use of environmental protection words can reflect the high degree of willingness of the local government environmental governance. Meanwhile, the government work report is often released at the beginning of the year. Annual air pollution cannot affect the already pre-determined work report (Wei et al., 2017), guaranteeing its exogeneity. Meanwhile, we replaced the core explanatory variables and explained variables to further ensure the accuracy of benchmark regression results, which is shown in Appendix A.
Table 5 demonstrates the 2SLS regression results. According to columns (1) (3), it can be found that the F-values of the first-stage regressions are all greater than 10 and statistically significant at 1%, which indicates that it is not a weak instrumental variable. The estimation results of the second stage of columns (2) (4) show that the reform presents a significant negative effect on air pollution. The PM2.5 concentration in the jurisdiction will decrease by 0.3166 units after the occurrence of the local environmental vertical reform.
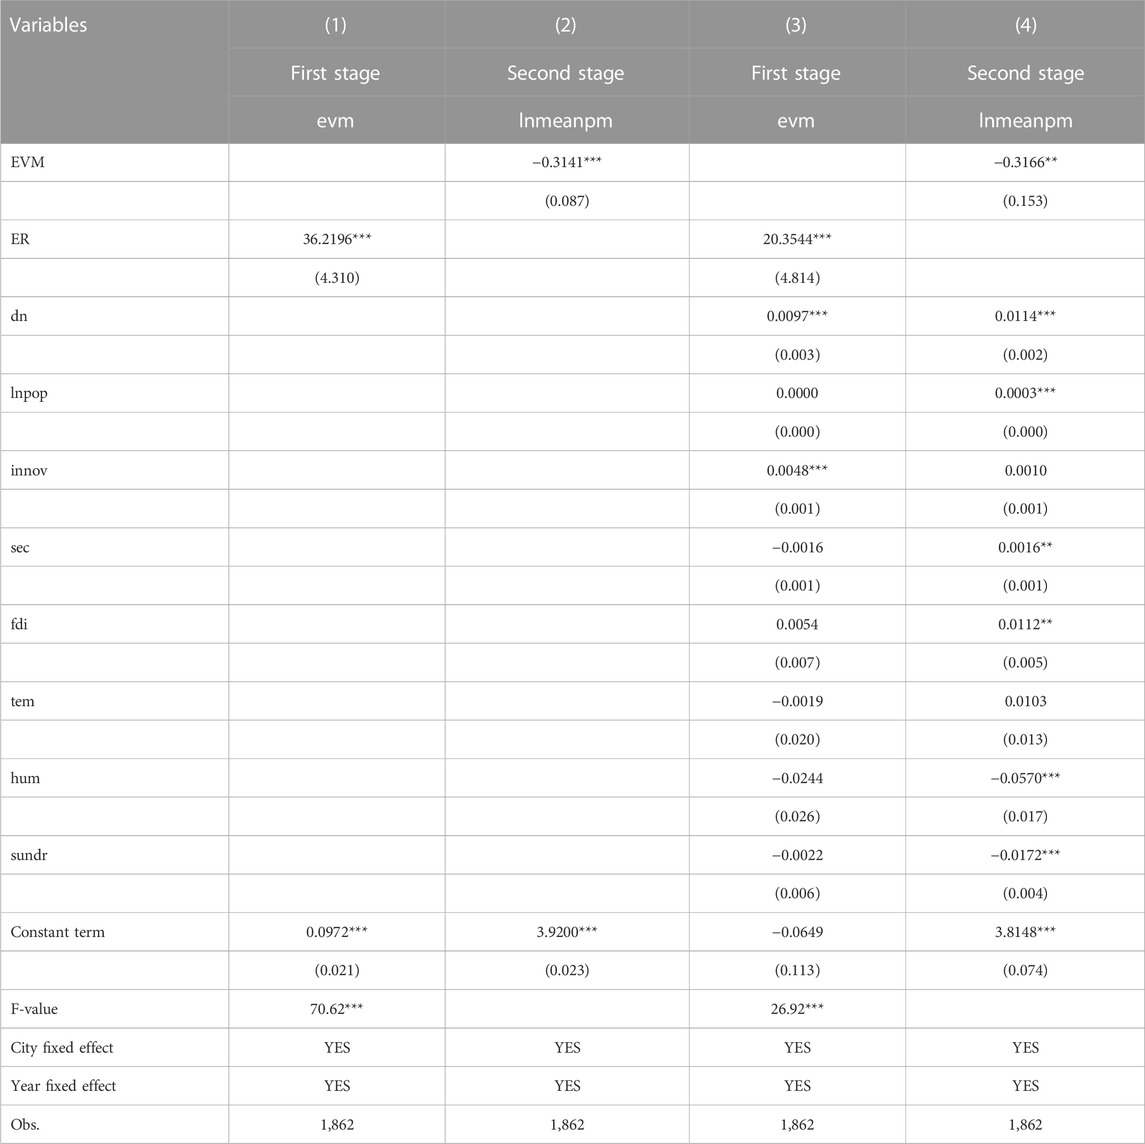
TABLE 5. 2SLS regression results.
Since 2002, the central environmental administration has set up six regional inspection centers in north, east, south, northeast, and northwest of China, aiming to focus on strengthening regional supervision. Hence, we aim to explore differences in the environmental governance impacts of EVM on regions with different environmental factor endowments.
The results given in Table 6 show that the environmental vertical reform has improved the air quality in north, east, and northwest of China but did not improve air quality as expected in the northeast of China. The possible reasons for this are related to the fact that the northeast region was originally a typical heavy industrial area and a traditional energy-rich area with high energy consumption, while continued climate change and increased social activity disturbances exerted long-term systematic pressure on its environmental management.

TABLE 6. Heterogeneity analysis.
China’s current large-scale urban heating sources mainly use coal as the raw material. The burning of fossil fuels caused by winter heating often deteriorates air quality. The “Qinling–Huaihe” Line as China’s north–south geographical boundary is actually still very different from China’s real heating line. China’s primary consideration for heating is temperature. The current heating standards are that the minimum temperature is less than or equal to 5° for more than 90 days to take centralized heating in the area. At present, there are still many cities located south of the “Qinhuai” line that have collective heating or regional heating, while there is no heating north of the “Qinhuai” line. In this paper, we review the heating situation of each prefecture-level city and classify the existing prefecture-level cities into three categories according to the heating situation, namely, all heating (ah), no collective heating (nh), and partial heating (ph), to empirically examine the effect of heating on air quality.
Columns (1), (2), and (3) of Table 7 show that cities with no collective heating have no significant reform effect on their air improvement effect. For both partially heated and unheated cities, the environmental vertical reform significantly reduces PM2.5 concentrations. It can be inferred that EVM has effectively improved air quality in heating cities and achieved the policy implementation objectives.
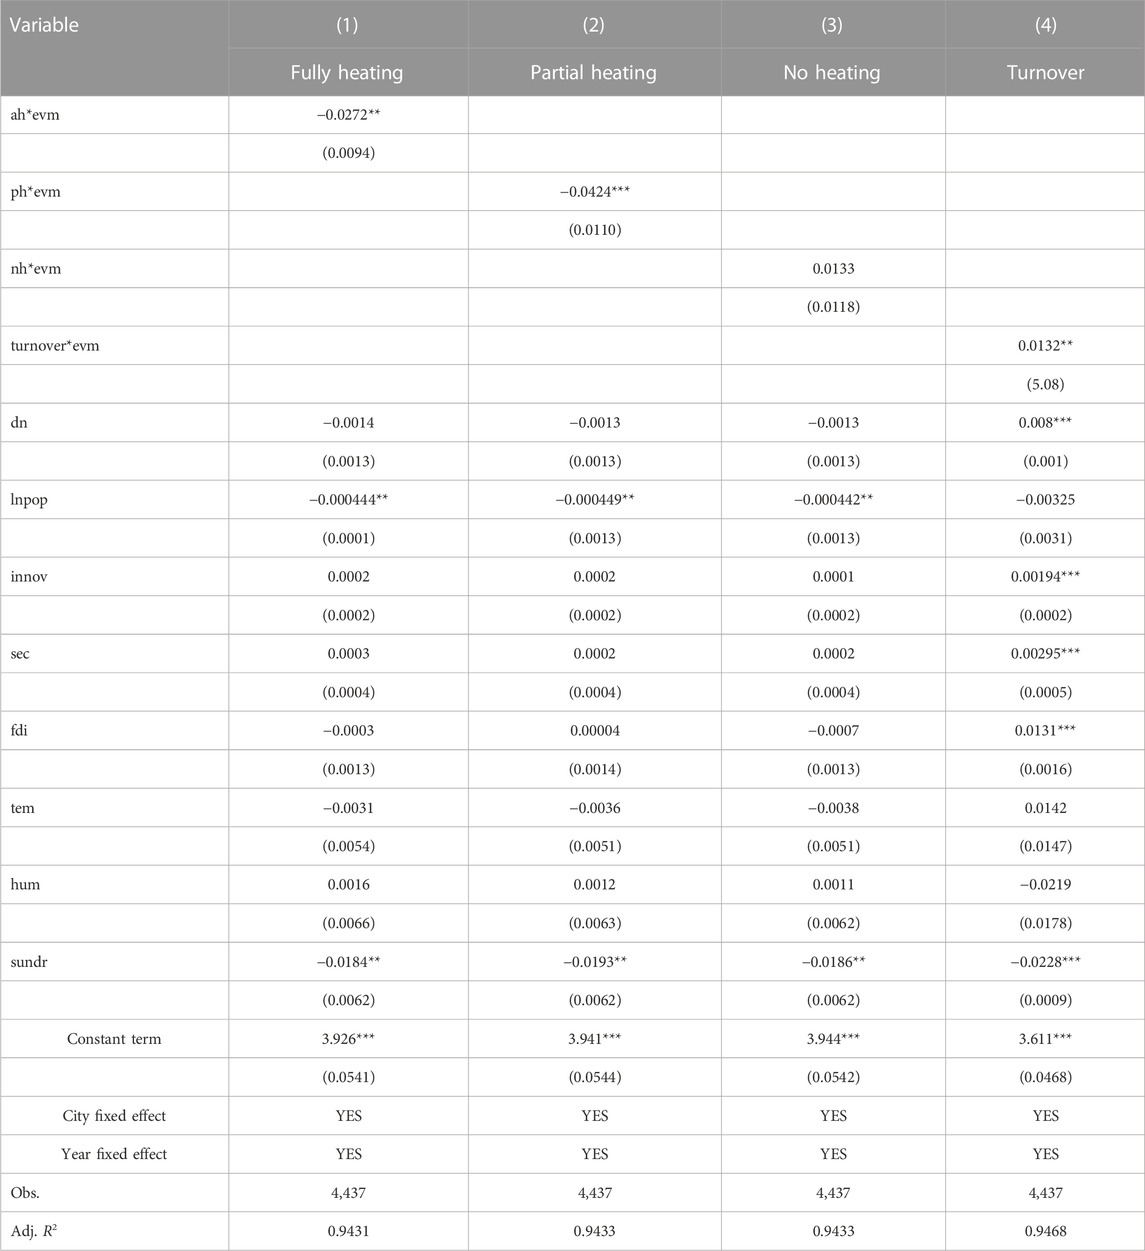
TABLE 7. Heterogeneity analysis.
Political incentives are a key factor influencing the decision-making behavior of local government officials, and the political risk is crucial for the policy supporters in evaluating policy insinuations (Zhang et al., 2023). When the central government increases its monitoring efforts during the change of officials, local officials will strengthen their risk aversion and formulate more conservative and stable development plans. We examine whether the degree of risk aversion of local officials affects the air governance results. We collect the list of municipal party secretaries in offices of each city in the past years. The dummy variable (turnover) is used to measure the turnover of officials, in which if the change in municipal party secretaries occurs in the first-half year, it is considered that the turnover of officials occurs in that year; if the change occurs in the latter half year, the next year will be defined as the year of the change in officials to examine the moderating effect of the degree of risk aversion of the local government on the air pollution governance of the environmental protection reform.
As shown in column (4) of Table 7, the regression results show that EVM during the official replacement period did not improve air quality in the jurisdiction. Based on the pursuit of political status, the higher the degree of risk aversion of local officials, in order to stabilize economic development, the willingness of regional environmental governance declines, exacerbating the increase in local air pollution. When local environmental willingness conflicts with economic willingness, the local environmental officials will prioritize economic development, and the environmental protection hierarchical management blocks the implementation of higher-level environmental protection and alienates the environmental responsibility to solve the problem.
We use the micro-enterprise data to further explore EVM on the behavior firms. Furthermore, it can make up for the selection bias that may be caused by the city-level data. First, we examine the impact on the green innovation behavior of incumbent firms, using patent application data on listed companies in heavy pollution industries3 to measure the impact of their green innovation behavior. We selected three major categories (alternative energy production, energy conservation, and waste management) to measure green patents, according to the “Green List of the International Patent Classification” published by the World Intellectual Property Organization (WIPO). Referring to the study by Fleming and Sorenson (2004), substantive and strategic innovations are further distinguished. The number of invention patents is utilized to measure substantive innovations. Strategic innovations are measured using the number of utility model and design patents. To measure green innovation at the city level, the firm-level data are aggregated to the city level, according to their location.
The results in given columns (2) and (3) of Table 7 show that the coefficients of both strategic and substantive green innovation performance are significant at the 1% level. Furthermore, it can be seen that the role of substantive green innovation performance is more significant. We can conclude that the reform induces the green innovation activities of listed companies in the heavy pollution industry. It can indicate that EVM has played a “push effect,” and more heavily polluted cities in China were more responsive to the enforcement of EVM, perhaps as the result of an emphasis on heavy industries in those locations (Yuan., et al., 2022). The incumbent enterprises have to face more stringent environmental monitoring efforts and high sewage costs (Ding et al., 2022), and have the motivation to take the initiative to promote green innovation activities. The empirical result verifies hypothesis 1.
The choice of city location by new entrants usually has the ex-ante selection effect (Arimoto et al., 2014), reflecting a city’s locational advantage. The productivity of entering firms in the city is utilized to measure whether the city’s location advantage has been enhanced after EVM. We define the new entrants as firms that appear in the database for the first time and are established within 2 years4. Referring to the study by Melitz and Polanec (2015), the productivity growth of a city is decomposed into the contributions of new firms, incumbent firms, and exiting firms:
In Eq. 19,
Furthermore, we use the database of Chinese industrial enterprises from 2006 to 2015 to test this firm entry effect and derive the methodology proposed by Brandt et al. (2012) to match the data on industrial enterprises. Before matching, the caliber of the national economic industry classification code is unified with reference to the study by Brandt et al. (2012), and the regional administrative code is unified with the latest GB/T2260-2007. We follow Levinshohn and Petrin (2003) to measure the total factor productivity of industrial firms using the LP method. Consistent with most studies, the weighted average of total factor productivity of industrial firms in the jurisdiction is used to measure the city-level productivity.
As can be seen in column (4) of Table 7, the EVM enhances the productivity of new entrants in the jurisdiction. Moreover, the selection effect of the entrants reflects the improvement of the city’s environmental infrastructure and the improvement of urban location advantage, further attracting new entrants. The empirical result verifies hypothesis 2.
We further explore how EVM acts on the industrial structure. The overall industrial structure upgrading index is constructed to reflect the structural changes among industries. The index follows the evolution rule of the industrial structure of the Petty–Clark law. The specific formula is shown in Eq. 20, where Snpt denotes the output value of the nth industry of city p in year t.
The regression results are shown in column (1) of Table 8. The coefficient is significantly positive, indicating that the environmental system reform promotes the upgrading of the industrial structure. This may be due to the fact that the environmental protection reform has taken away the power of environmental supervision from grassroot environmental protection departments. The unification of regional environmental regulatory standards has effectively prevented local governments from forming the strategic behavior of “race to the bottom" (Ascani et al., 2023), thus promoting the whole industrial structure upgrade. The empirical result verifies hypothesis 3.
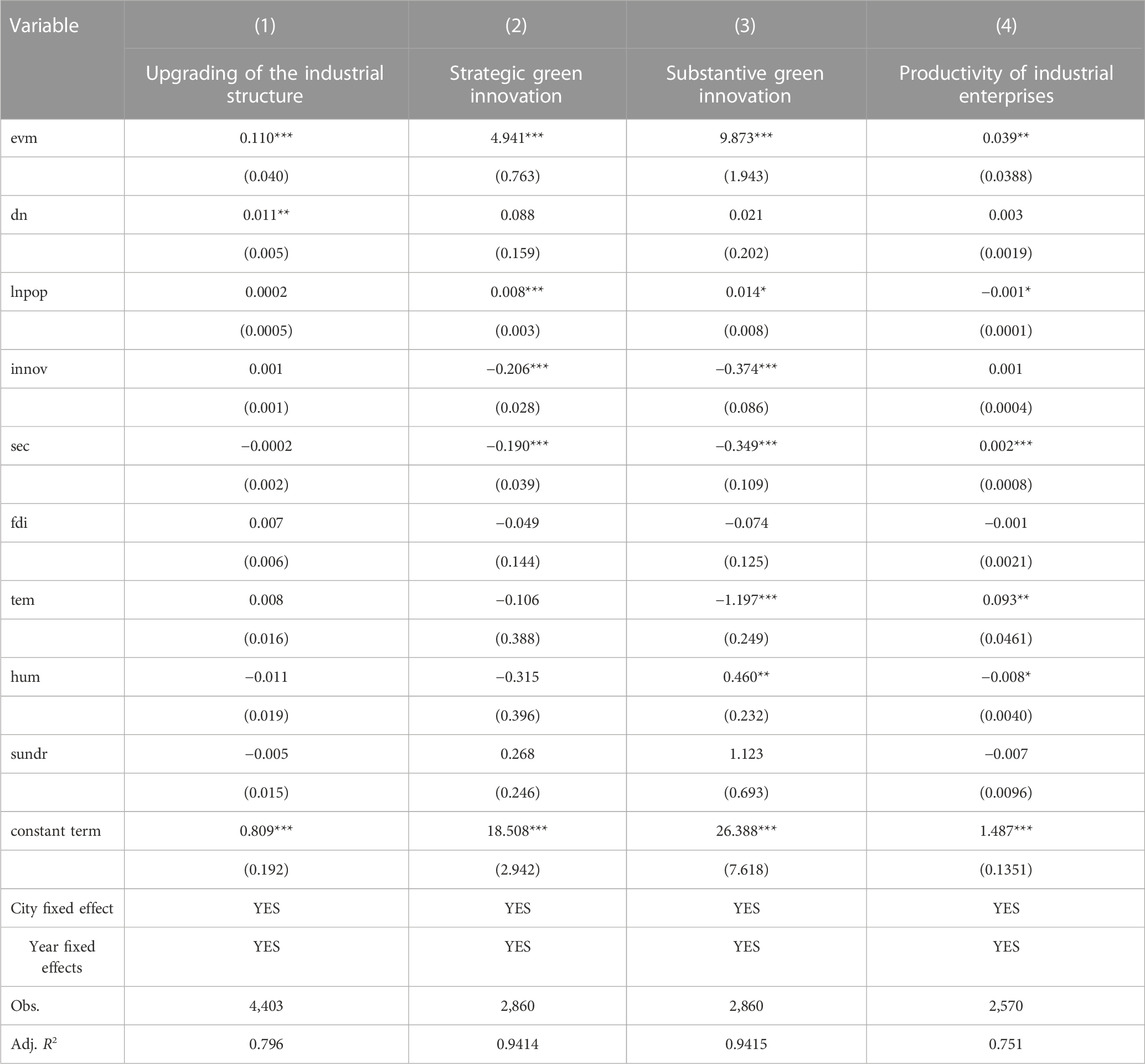
TABLE 8. Impact mechanisms.
The implementation of the EVM has significantly strengthened environmental supervision in China. Under the air pollution control targets, it is crucial to seek pathways to promote the involvement of both enterprises and governments in reducing emissions. Taking the implementation of EVM as a typical case, exploring the impact of strengthening environmental supervision driven by the government on urban air quality can inform policy formulation. This study systematically assesses the impact of EVM on urban air quality based on panel data from 261 cities in China, combining the time-varying DID method. Heterogeneities and impact mechanisms are further investigated. Several main conclusions are drawn. First, after implementing EVM, the PM2.5 concentration decreased by 2.07% per year, and this empirical result passed a series of robustness tests. Second, the green innovation, firm entry, and industrial upgrading effects are important mechanisms through which EVM generates the air reduction effect. Third, the EVM contributes more to air pollution reduction in stricter environmental governance and cities with heating supply. Furthermore, the high risk-aversion degree of local officials will inhibit the air pollution reduction effect of EVM.
The following policy implications are proposed. First, empirical evidence indicates that EVM has contributed to the air pollution reduction effect. Therefore, in response to global warming, governments should enhance the environmental supervision at the grassroot level. The central government should actively monitor the environmental enforcement efforts of local governments and conduct proper inspection actions to ensure that local governments will not interfere with the environmental supervision behaviors of local environmental protection departments. Second, compared with the short-term special environmental pollution activities, the EVM is politically binding and acts as a deterrent to local air pollution control. The centralization of environmental governance should be further strengthened, and the supervisory capacity of higher-level environmental protection departments should be enhanced and synchronized with that of grassroot EPBs. The independence of EPBs in law enforcement should be further enhanced and break the phenomenon of “environmental protection giving way to local interests.” Finally, green innovation is an essential channel for EVM to ameliorate air pollution. The government should take the cost of innovation into consideration when planning to implement the environmental centralizing reform.
The preliminary judgment of this paper is that EVM has already significantly improved the air quality in China. There is still much research that can be done in the future. On the theoretical shelf, we discussed the principal–agent relationship between the central government and local governments with the inconsistency of social development goals, while the governance of environmental pollution requires joint prevention and control among local governments. Therefore, there is still much room for exploring the gaming behaviors of air pollution governance among local governments, especially the responsibility sharing of environmental pollution governance among neighboring governments. Furthermore, considering the resident level, the cost-benefit analysis of individual health assessment brought by the environmental performance of EVM and the design of the regional balanced health financial transfer system, which requires more accurate data, is also a topic worthy of further research.
The original contributions presented in the study are included in the article/Supplementary Material; further inquiries can be directed to the corresponding author.
XZ: writing–review and editing. YH: data curation, methodology, software, and writing–original draft. JZ: writing–original draft.
The author(s) declare financial support was received for the research, authorship, and/or publication of this article. This study received the following grants: Project of Hunan Provincial Natural Science Foundation, “Research on Coordination and Optimization Mechanism of Vertical Management Reform of Environmental Department and Fiscal Decentralization and Supporting Policies under the Objective of Regional Green Development” (Grant No. 2022JJ30181).
This research was Supported by Research Center for Hubei Business Service and Development, Key Research Base of Humanities and Social Science of Hubei Province.
The authors declare that the research was conducted in the absence of any commercial or financial relationships that could be construed as a potential conflict of interest.
All claims expressed in this article are solely those of the authors and do not necessarily represent those of their affiliated organizations, or those of the publisher, the editors, and the reviewers. Any product that may be evaluated in this article, or claim that may be made by its manufacturer, is not guaranteed or endorsed by the publisher.
1In China, there are four vertical levels in sub-national jurisdictions: the provincial, municipal, county, and township levels.
2Specifically, https://sites.wustl.edu/acag/datasets/surface-pm2-5/
3According to “Listed Companies Environmental Verification Industry Classification Management Directory” issued by the Ministry of Ecology and Environment in 2008 for the identification of heavy polluting industries, which contains 14 industry categories, namely, thermal power, iron and steel, cement, electrolytic aluminum, coal, metallurgy, building materials, mining, chemicals, petrochemicals, pharmaceuticals, light industry, textiles, and tannery.
4Considering that the criteria for database were adjusted in 2011 to a main business revenue standard of 20 million yuan and above, the fact that an enterprise did not appear in the database in previous years could be due to the fact that its annual main business revenue did not meet the standard. This means that enterprises appearing in the database for the first time are not necessarily newly established.
5The earliest list was published in 2007.
Amore, M. D., and Minichilli, A. (2018). Local political uncertainty, family control, and investment behavior. J. Financial Quantitative Analysis 53 (4), 1781–1804. doi:10.1017/s002210901800025x
Arimoto, Y., Nakajima, K., and Okazaki, T. (2014). Sources of productivity improvement in industrial clusters: the case of the prewar Japanese silk-reeling industry. Regional Sci. Urban Econ. 46, 27–41. doi:10.1016/j.regsciurbeco.2014.02.004
Ascani, A., Nair, L. B., and Iammarino, S. (2023). Racing to the bottom or seeking legitimacy? National environmental performance and the location strategies of Chinese MNEs. J. Int. Manag. 29, 100993. doi:10.1016/j.intman.2022.100993
Asturias, J., Hur, S., Kehoe, T. J., and Ruhl, K. J. (2023). Firm entry and exit and aggregate growth. Am. Econ. J. Macroecon. 15 (1), 48–105. doi:10.1257/mac.20200376
Barbera, A. J., and McConnell, V. D. (1990). The impact of environmental regulations on industry productivity: direct and indirect effects. J. Environ. Econ. Manag. 18, 50–65. doi:10.1016/0095-0696(90)90051-y
Brandt, L., Van Biesebroeck, J., and Zhang, Y. (2012). Creative accounting or creative destruction? Firm-level productivity growth in Chinese manufacturing. J. Dev. Econ. 97 (2), 339–351. doi:10.1016/j.jdeveco.2011.02.002
Broner, F., Bustos, P., Carvalho, V. M., Atkin, G., and Hanna, E. H. R. (2012). Sources of comparative advantage in polluting industries. Natl. Bureau Econ. Res., w18337. doi:10.3386/w18337
Callaway, B., and Sant’Anna, P. H. C. (2019). Difference-in-Differences with multiple time periods. J. Econ. 225 (2), 200–230. doi:10.1016/j.jeconom.2020.12.001
Chen, P., and Dagestani, A. A. (2023a). Greenwashing behavior and firm value - from the perspective of board characteristics. Corp. Soc. Responsib. Environ. Manag. 30, 2330–2343. doi:10.1002/csr.2488
Chen, P., and Dagestani, A. A. (2023b). Urban planning policy and clean energy development Harmony-evidence from smart city pilot policy in China. Renew. Energy 210, 251–257. doi:10.1016/j.renene.2023.04.063
Chen, P., Dagestani, A. A., and Kim., S. K. (2023). Corporate social responsibility and green exploratory innovation - the moderating role of three environmental regulations. Technol. Analysis Strategic Manag., 1–13. doi:10.1080/09537325.2023.2196585
Chen, Y. (2023). Environmental regulation, local labor market, and skill heterogeneity. Regional Sci. Urban Econ. 101, 103898. doi:10.1016/j.regsciurbeco.2023.103898
Chung, C. Y., Yang, J., Yang, X., and He, J. (2022). Long-term effects of ambient air pollution on lung cancer and COPD mortalities in China: a systematic review and meta-analysis of cohort studies. Environ. Impact Assess. Rev. 97, 106865. doi:10.1016/j.eiar.2022.106865
Cole, M. A., Elliott, R. J. R., and Zhang, J. (2011). Growth, foreign direct investment, and the environment: evidence from Chinese cities. J. Regional Sci. 51, 121–138. doi:10.1111/j.1467-9787.2010.00674.x
Cui, C., and Li, L.S.-Z. (2023). Trade policy uncertainty and new firm entry: evidence from China. J. Dev. Econ. 163, 103093. doi:10.1016/j.jdeveco.2023.103093
Dagestani, A. A., and Qing, L. (2022). The impact of environmental information disclosure on Chinese firms' environmental and economic performance in the 21st century: a systematic review. IEEE Eng. Manag. Rev. 50, 203–214. doi:10.1109/emr.2022.3210465
Dagestani, A. A., Qing, L., and Abou Houran, M. (2022). What remains unsolved in sub-african environmental exposure information disclosure: a review. J. risk financial Manag. 15, 487. doi:10.3390/jrfm15100487
Dagestani, A. A., Shang, Y., Schneider, N., Cifuentes-Faura, J., and Zhao, X. (2023). Porter in China:A quasi-experimental view of market-based environmental regulation effects on firmperformance. Energy Econ. 126, 106966. doi:10.1016/j.eneco.2023.106966
Deryugina, T., Heutel, G., Miller, N. H., Molitor, D., and Reif, J. (2019). The mortality and medical costs of air pollution: evidence from changes in wind direction. Am. Econ. Rev. 109 (12), 4178–4219. doi:10.1257/aer.20180279
Ding, X., Appolloni, A., and Shahzad, M. (2022). Environmental administrative penalty, corporate environmental disclosures and the cost of debt. J. Clean. Prod. 332, 129919. doi:10.1016/j.jclepro.2021.129919
Eaton, S., and Kostka, G. (2013). “Does cadre turnover help or hinder China's green rise? Evidence from Shanxi province,” in Chinese environmental governance: dynamics, challenges, and prospects in a changing society (Berlin, Germany: Springer), 83–110.
Fell, H., and Kaffine, D. T. (2014). Can decentralized planning really achieve first-best in the presence of environmental spillovers. J. Environ. Econ. Manag. 68 (1), 46–53. doi:10.1016/j.jeem.2014.04.001
Ferrara, E. L., Chong, A., and Duryea, S. (2012). Soap operas and fertility: evidence from Brazil. Am. Econ. J. Appl. Econ. 4 (4), 1–31. doi:10.1257/app.4.4.1
Fleming, L., and Sorenson, O. (2004). Science as a map in technological search. Strategic Manag. J. 25 (8-9), 909–928. doi:10.1002/smj.384
Guo, J., Wang, Y., and Yang, W. (2021). China’s anti-corruption shock and resource reallocation in the energy industry. Energy Econ. 96, 105182. doi:10.1016/j.eneco.2021.105182
Hao, Y., Chen, Y. F., Liao, H., and Wei, Y. M. (2020). China's fiscal decentralization and environmental quality: theory and an empirical study. Environ. Dev. Econ. 25 (2), 159–181. doi:10.1017/s1355770x19000263
He, G., Wang, S., and Zhang, B. (2020a). Watering down environmental regulation in China. Q. J. Econ. 135, 2135–2185. doi:10.1093/qje/qjaa024
He, P., Sun, Y., Zhang, Y., and Li, T. (2020b). COVID–19’s impact on stock prices across different sectors—an event study based on the Chinese stock market. Emerg. Mark. Finance Trade 56, 2198–2212. doi:10.1080/1540496x.2020.1785865
Hering, L., and Poncet, S. (2014). Environmental policy and exports: evidence from Chinese cities. J. Environ. Econ. Manag. 68 (2), 296–318. doi:10.1016/j.jeem.2014.06.005
Hsu, F. C., Baugh, K. E., Ghosh, T., Zhizhin, M., and Elvidge, C. D. (2015). DMSP-OLS radiance calibrated nighttime lights time series with intercalibration. Remote Sens. 7 (2), 1855–1876. doi:10.3390/rs70201855
Hu, Y., Ren, S., Wang, Y., and Chen, X. (2020). Can carbon emission trading scheme achieve energy conservation and emission reduction? Evidence from the industrial sector in China. Energy Econ. 85, 104590. doi:10.1016/j.eneco.2019.104590
Jakobsen, S., Uyarra, E., Njøs, R., and Fløysand, A. (2021). Policy action for green restructuring in specialized industrial regions. Eur. Urban Regional Stud. 29, 312–331. doi:10.1177/09697764211049116
Lelieveld, J., Evans, J. S., Fnais, M., Giannadaki, D., and Pozzer, A. (2015). The contribution of outdoor air pollution sources to premature mortality on a global scale. Nature 525 (7569), 367–371. doi:10.1038/nature15371
Levinsohn, J., and Petrin, A. (2003). Estimating production functions using inputs to control for unobservables. Rev. Econ. Stud. 70 (2), 317–341. doi:10.1111/1467-937x.00246
Luan, B., Zou, H., Chen, S., and Huang, J. (2021). The effect of industrial structure adjustment on China’s energy intensity: evidence from linear and nonlinear analysis. Energy 218, 119517. doi:10.1016/j.energy.2020.119517
Melitz, M. J., and Polanec, S. (2015). Dynamic olley-pakes productivity decomposition with entry and exit. Rand J. Econ. 46, 362–375. doi:10.1111/1756-2171.12088
Olabi, A. G., and Abdelkareem, M. A. (2022). Renewable energy and climate change. Renew. Sustain. Energy Rev. 158, 112111. doi:10.1016/j.rser.2022.112111
Sandholm, W. H. (2005). Negative externalities and evolutionary implementation. Rev. Econ. Stud. 72 (3), 885–915. doi:10.1111/j.1467-937x.2005.00355.x
Shen, B., Yang, X., Xu, Y., Ge, W., Liu, G., Su, X., et al. (2023). Can carbon emission trading pilot policy drive industrial structure low-carbon restructuring: new evidence from China. Environ. Sci. Pollut. Res. 30, 41553–41569. doi:10.1007/s11356-023-25169-4
Song, W., and Han, X. (2022). Heterogeneous two-sided effects of different types of environmental regulations on carbon productivity in China. Sci. Total Environ. 841, 156769. doi:10.1016/j.scitotenv.2022.156769
Spulber, D. F. (1988). Optimal environmental regulation under asymmetric information. J. public Econ. 35 (2), 163–181. doi:10.1016/0047-2727(88)90052-7
Tao, M., Abd, A., Lim, T., Zheng, Y., and Wen, Le (2023). Do China's anti-corruption efforts improve corporate productivity? A difference-in-difference exploration of Chinese listed enterprises. Socio-Economic Plan. Sci. 87, 101594. doi:10.1016/j.seps.2023.101594
Van Der Kamp, D., Lorentzen, P., and Mattingly, D. (2017). Racing to the bottom or to the top? Decentralization, revenue pressures, and governance reform in China. World Dev. 95, 164–176. doi:10.1016/j.worlddev.2017.02.021
Van Rooij, B. (2010). The people vs. pollution: understanding citizen action against pollution in China. J. Contemp. China 19 (63), 55–77. doi:10.1080/10670560903335777
Wang, J. (2013). The economic impact of special economic zones: evidence from Chinese municipalities. J. Dev. Econ. 101, 133–147. doi:10.1016/j.jdeveco.2012.10.009
Wei, W., Guo, C., Chen, J., and Zhang, Z., 2017. Textual topic evolution analysis based on term co-occurrence: a case study on the government work report of the State Council (1954–2017), 2017 12th International Conference on Intelligent Systems and Knowledge Engineering (ISKE), November, 2017, Nanjing, China, pp.1–6.
Yuan, F., Zhai, Y., Sun, X., and Dong, Y. (2022). Air pollution mitigation: evidence from China’s central environmental inspection. Environ. Impact Assess. Rev. 96, 106835. doi:10.1016/j.eiar.2022.106835
Zhang, B., Chen, X., and Guo, H. (2018). Does central supervision enhance local environmental enforcement? Quasi-experimental evidence from China. J. Public Econ. 164, 70–90. doi:10.1016/j.jpubeco.2018.05.009
Zhang, S., Shinwari, R., Zhao, S., and Abd, A. (2023). Energy transition, geopolitical risk, and natural resources extraction: a novel perspective of energy transition and resources extraction. Resour. Policy 83, 103608. doi:10.1016/j.resourpol.2023.103608
Zhao, S., Tian, W., and Dagestani, A. A. (2022). How do R&D factors affect total factor productivity: based on stochastic frontier analysis method. Econ. Anal. Lett. 1 (2), 28–34. doi:10.58567/eal01020005
Adding the robustness check of benchmark results. We replace the substitution of explanatory variables and explained variables to ensure the accuracy of our empirical tests.
(1) Substitution of explanatory variables.
We measure the continuity indicators to replace the core explanatory variables. Based on the list of national controlling points5 published by China’s Ministry of Ecology and Environment, Eq. 15 is used to measure the intensity of environmental vertical monitoring in air governance of each city.
As shown in columns (1)–(3) of Table A, the environmental protection reform from the pilot stage in a number of prefecture-level cities to the full-scale implementation nationwide has played a significant role in the improvement of air quality. This suggests that the environmental protection reform, by centralizing the power of environmental monitoring and making grassroot environmental protection departments accountable to higher-level authorities, has been effective in combating air pollution as a whole.
(2) Substitution of explained variables.
Sulfur dioxide is also an important source of air pollution, and its main source of emissions comes from industrial production, while the final implementation of the environmental protection reform is aimed at industrial enterprises. At the same time, sulfur dioxide emissions as an environmental protection assessment index are included in the performance assessment of officials. Therefore, the article uses the unit sulfur dioxide emissions to measure the degree of air pollution, from the perspective of industrial pollution to examine the air pollution reduction effect of environmental protection reform. A specific calculation method is to use the sulfur dioxide emissions of the year municipalities divided by the total GDP of the year municipalities to obtain the sulfur dioxide emissions per unit of GDP.
As shown in columns (4)–(6) of Table A, the environmental protection reform from the pilot stage in many prefecture-level cities to the full-scale implementation nationwide has played a significant role in the improvement of urban air quality. This suggests that the environmental protection reform, by centralizing the power of environmental monitoring and making grassroot environmental protection departments accountable to higher-level authorities, has been effective in combating air pollution as a whole.
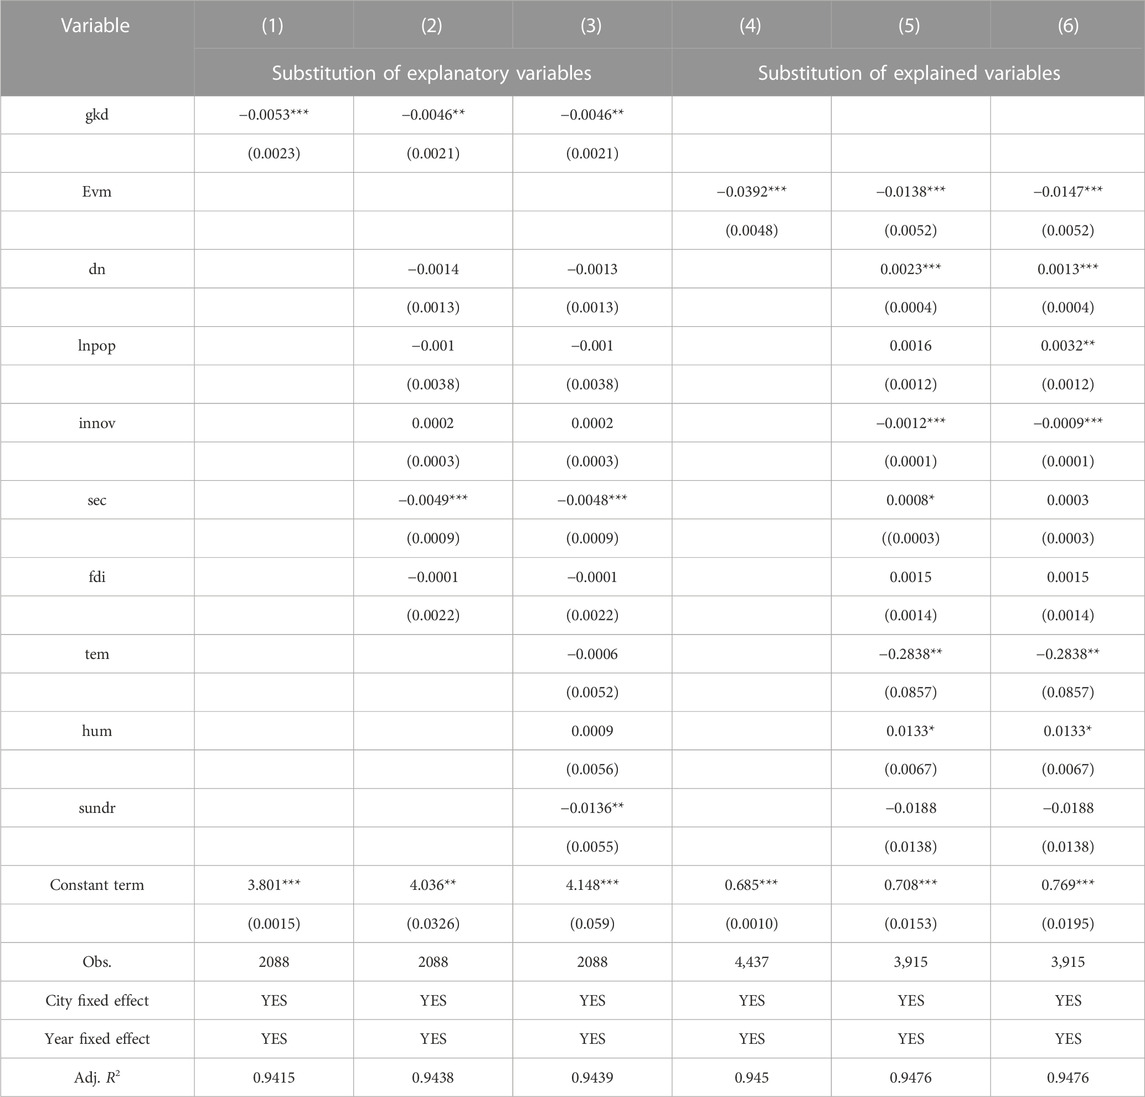
TABLE A. Substitution of variables.
Keywords: environmental vertical reform, air pollution, local governance, green innovation, industrial upgrading effect
Citation: Zou X, He Y and Zhang J (2023) Can environmental supervision improve air quality? Quasi-experimental evidence from China. Front. Environ. Sci. 11:1288873. doi: 10.3389/fenvs.2023.1288873
Received: 05 September 2023; Accepted: 08 November 2023;
Published: 08 December 2023.
Edited by:
pengyu chen, Inner Mongolia University, ChinaReviewed by:
Zhongzhu Chu, Shanghai Jiao Tong University, ChinaCopyright © 2023 Zou, He and Zhang. This is an open-access article distributed under the terms of the Creative Commons Attribution License (CC BY). The use, distribution or reproduction in other forums is permitted, provided the original author(s) and the copyright owner(s) are credited and that the original publication in this journal is cited, in accordance with accepted academic practice. No use, distribution or reproduction is permitted which does not comply with these terms.
*Correspondence: Jincheng Zhang, MjAyMjAxMDgwMTY5QHN0dS56dWVsLmVkdS5jbg==
Disclaimer: All claims expressed in this article are solely those of the authors and do not necessarily represent those of their affiliated organizations, or those of the publisher, the editors and the reviewers. Any product that may be evaluated in this article or claim that may be made by its manufacturer is not guaranteed or endorsed by the publisher.
Research integrity at Frontiers
Learn more about the work of our research integrity team to safeguard the quality of each article we publish.