 Dimaghi Schwamback
 Magnus Persson1
 Ronny Berndtsson
 Jamil A. A. Anache
95% of researchers rate our articles as excellent or good
Learn more about the work of our research integrity team to safeguard the quality of each article we publish.
Find out more
ORIGINAL RESEARCH article
Front. Environ. Sci. , 01 December 2023
Sec. Soil Processes
Volume 11 - 2023 | https://doi.org/10.3389/fenvs.2023.1286929
This article is part of the Research Topic Vegetation-soil-hydrology Interactions and Ecohydrological Processes View all 15 articles
Introduction: Runoff measurement and monitoring is a laborious, time-consuming, and costly task. Additionally, common runoff monitoring usually primarily provide water level, requiring information on the stage-discharge relation. Automatic equipment such as flow meter tipping bucket (TB) is a potential option to simplify and provide continuous runoff monitoring in small catchments. However, a proper description of how to size and adapt the design under different flow conditions is still lacking.
Methodology: In this paper we present a novel standardized framework for the design of TB that can be used for low-cost and real-time runoff monitoring under many different conditions. The framework consists of an estimation of the runoff peak rate using the rational equation and a volumetric capacity estimate of the cavity based on runoff rate, operation speed, and inclination angle of TB when at resting position. The proposed framework was implemented in a case study where four TBs were designed for continuous runoff monitoring from experimental plots (100 m2) with different land use (sugarcane, soybean, and bare soil).
Results: During field tests (five months), the designed TBs had a recovery rate of actual runoff ranging from 61% to 81% and were able to capture features poorly studied (starting/ending time and peak flow) that have potential importance in hydrological models.
Discussion: The proposed framework is flexible and can be used for different environmental conditions to provide continuous runoff data records.
Changes in Land Use and Land Cover (LULC) are important sources of increasing sediment discharge and surface flow, which may have strong impact on downstream areas (Ebabu et al., 2023). In this context, in-situ studies are important to, e.g., reduce nutrient losses (Zhang et al., 2020), improve the efficiency of agricultural production (Benedetti et al., 2019), and promote sustainable development (Tarolli and Straffelini, 2020). However, experimental studies are scarce due to local heterogeneities and uncertainties in hydrological and pedological measurements (Beven and Germann, 2013; Anache et al., 2017), but mainly due to cost and laborious processes involved in erosion monitoring. From the list of 23 unsolved problems that aim to orient hydrological research worldwide, Blöschl et al. (2019) highlight the importance of developing and using innovative technologies to measure surface and subsurface flow properties in a range of spatial and temporal scales under affordable investment.
The runoff volume for a given area can be quantified using different technologies, such as mass and pressure sensors, volumetric boxes, spillways, and tipping bucket flow meter (TBs). Using TBs is an option for automatic and direct monitoring of surface flow in small study areas, such as bounded experimental plots and hillslopes (Wang et al., 2020) and small hydrographic basins (Peyrard et al., 2016), due to its low construction cost, durability, easy installation, and high mobility (Bashagakule et al., 2018; Shimizu et al., 2018). It is based on a simple principle, consisting of two symmetrical cavities. The collected flow is directed to one of the cavities that fills until it reaches its maximum capacity (nominal volume), shifting the gravity center towards the rotating axis, releasing the water, and allowing the second cavity to fill. Coupling TBs with a reed switch and datalogger allows automation and continuous readings with a high temporal resolution (usually 10 min but also as detailed as per minute), aiding in identifying the start, end, and peak of the flow (Corona et al., 2013; Zabret et al., 2018).
The first tipping bucket flow meter record used for measuring runoff in experimental plots (hillslope for runoff measurement) dates back to 1928 (Nebol’sin, 1928). Since then, TBs have been used as a hydrological monitoring tool with different monitoring applications: quantification of runoff in plots (Johnston, 1942; Whipkey, 1965; Calder and Kidd, 1978; Hollis and Ovenden, 1987; Khan and Ong, 1997; Klik et al., 2004; Nehls et al., 2011; Corona et al., 2013; Elder et al., 2014; Langhans et al., 2019; Wang et al., 2020), experimental basins (Chow, 1976; Kim et al., 2005; Peyrard et al., 2016) and green roofs (Perales-Momparler et al., 2017); quantification of subsurface runoff (Peyrard et al., 2016; Lamb et al., 2019; Wang et al., 2020); and quantification of internal precipitation or stemflow (Takahashi et al., 2010; Iida et al., 2012; Shimizu et al., 2018; Zabret et al., 2018). The volumetric capacity of a TB varies greatly from 15 mL (Somavilla et al., 2019) up to 12 L (Edwards et al., 1974), based on the flow expected to be measured. There are many different constructing designs of TBs that differ based on the cavity shape (rectangular, circular, or triangular), rotating angle (180° or 360°), and number of cavities (two or multiple ones).
Errors in TBs can be categorized as systematic or random (Shimizu et al., 2018; Iida et al., 2020). Systematic errors refer to design flaws and operation practices. These can be predicted and minimized through proper design framework and maintenance practices, e.g., regular lubrication. Random errors occur in unexpected situations, such entry of animals and flow inlet clogging. Following this definition, the under or oversizing of TBs is one example of a systematic error source that can be minimized. TBs with a too-low storage capacity under high runoff events will have a high error due to the kinetic effect of the increased flow through the water inlet (Shimizu et al., 2018). Similarly, TBs with a too-high storage capacity under runoff events with low intensity may not tip, also resulting in large measurement errors. The ideal design of TB will increase the accuracy of such monitoring equipment.
As highlighted by the vast number of studies, TBs are well-tested and established monitoring techniques. However, to the best of our knowledge, no previous studies have presented a standard or given detailed description of the sizing and construction of TBs that allows replicability under different environmental conditions. Previous research described TBs as a unique art craft, instead of trying to adapt it into a broader potential monitoring technique. Thus, this paper aims to present a novel standardized framework for the design of flow meter TBs, allowing the replication and implementation of TBs for low-cost and real-time runoff monitoring under any environmental condition. The proposed methodology was validated in the design of four TBs for the runoff monitoring in experimental plots in contrasting LULC commonly found in the Southeast region of Brazil (sugarcane, soybean, and bare soil). The designed TBs for the case study were calibrated and employed in the runoff monitoring during the rainy season.
The TB gauge consists of two connected cavities (Figure 1). When one of the cavities reaches a critical volume (nominal volume), the center of mass of the structure is shifted by gravity towards the side of the filled cavity, directing the water volume downwards, discarding it, and the other cavity starts to fill.
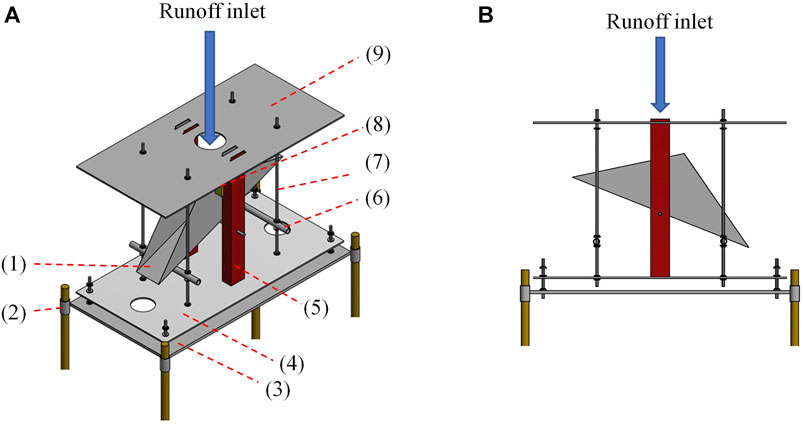
FIGURE 1. Illustration of the tipping bucket used to quantify runoff in perspective (A) and side (B) view where: (1) cavity; (2) anchoring rod on the ground; (3) fixed supporting plate; (4) mobile supporting plate; (5) vertical bar to support the reed switch and the upper plate; (6) height control bar; (7) support rod of the height control bar; (8) reed switch and cable connecting to the datalogger; and (9) upper plate.
The proposed design framework for TBs is meant to quantify runoff and reduce errors arising from improper design. The framework consists of the following steps: calculation of design flow, calculation of the nominal volume, choice of the structural design, and calibration and validation. In Figure 2 we summarize the proposed framework, and a more detailed description of each step is given below.
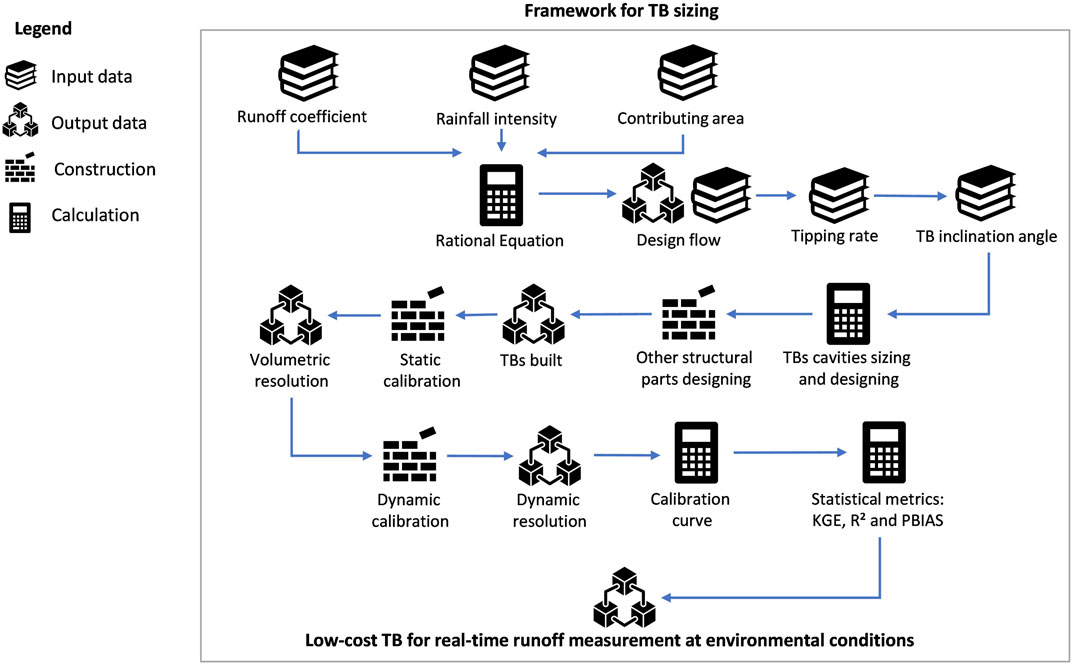
FIGURE 2. Schematic of proposed methodology for TB design.
The TB design flow,
where:
The runoff coefficient is the ratio between runoff and rainfall, varying between 0 (completely permeable) and 1 (completely impermeable), depending on many complex factors, such as soil composition and compaction, antecedent moisture, ground slope, infiltration, root system, surface land cover, etc. Compared to the other input variables, this is the most difficult to estimate from in-situ data and therefore, it is common to use average values based on land cover and ground slope. When the study area is composed of sections with different characteristics (land cover or soil type), it is necessary to create a composite runoff coefficient weighted on the area of each respective land use (Eq. 2). Supplementary Material A gives a list of C factors for urban and rural watersheds. Further information is given by Chin (2012) and Chow et al. (1988):
where:
The second variable, rainfall intensity, is ideally found using data from a nearby rain gauge. However, if not possible, rainfall intensity data through third-party sources (environmental or national databases) can be used and later interpolated to where the study case is located. Once having a reliable dataset, we suggest the creation of a histogram to enable the visualization of the rainfall intensity. It is important to define an ideal range of performance because using a bucket with too low storage capacity during an intense runoff rate can lead to significant measurement errors caused by the kinetic effect of increased water flow through the inlet. Conversely, a too-large bucket during low-intensity runoff events may not even tip, resulting in inaccurate measurements. In order to have an optimum storage capacity, we suggest adopting rainfall intensities in Eq. 1 that correspond to between 70% and 90% of the accumulated occurrences recorded in the rainfall histogram, depending on how uniform the rainfall is.
The last variable is the runoff area. There is no limitation regarding the size of the area where the TB will be employed. However, we recommend that the estimated design flow should be less than 10 L per min. A higher flow rate will require a bigger TB cavity and/or higher tipping velocity, resulting in higher monitoring errors. Flow portioning devices before the TB can be used, see Pinson et al. (2004) or Supplementary Material B.
The nominal volume is estimated by Eq. 3, which considers the design flow (estimated previously by Eq. 1), operation speed (number of tippings per time unit), and inclination angle of TB at resting position. Based on previous operation tests investigating the relationship between errors and operation speed, the optimum operating speed should be between three and four tippings per minute (Schwamback et al., 2022).
where Q is the runoff rate (mL/min); V is the cavity volumetric capacity (mL);
Lastly, we suggest an inclination angle between 25% and 35%. The higher the inclination angle, the higher the storage capacity, and thus, higher runoff rate can be covered by raising the inclination angle. Once the volume of the TB cavity is defined, it is possible to define the dimensions, shape (cylindrical or rectangular, Figure 3), and construction material (Table 1). We recommend the use of PVC tubes in projects that require cavities with storage capacity below 270 mL since it is an easy working material and inexpensive material. In projects with larger cavity volume, galvanized steel sheet is recommended since it has a greater resistance to high impact during tipping.

FIGURE 3. Sizing cylindrical (A, B) and rectangular (C, D) tipping bucket cavity.
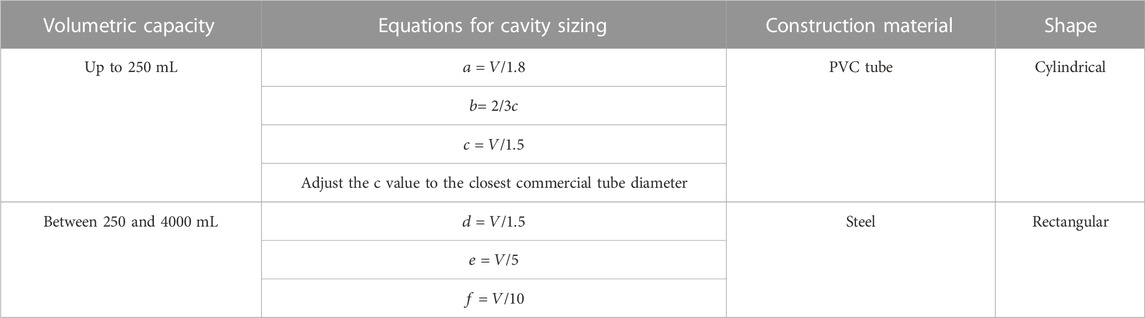
TABLE 1. Indication of sizing equations, construction material, and shape for cavity construction based on the cavity volumetric capacity. The dimensions are given in mm and the letters in the equations show design presented in Figure 3.
The equipment structure consists of two parts connected by threaded rods. The first part (fixed structure) is a rectangular base built-in metallic profile, in which the corners are fixed to the ground by steel bars (see Figure 1). The bars placed in the ground serve as a foundation for the equipment, inhibiting unevenness due to the tipping kinetic action. The second part of the structure (movable structure) is a steel plate, on which the vertical support bars of the upper plate are welded and the height control bars are threaded. The mobile plate makes it easy to remove the equipment to carry out maintenance and calibration tests in the laboratory.
Two pairs of threaded rods are installed at each corner, connecting the lower and upper plates. A metallic cylinder linking each pair of rods allows the adjustment of the height of each bucket when in operation. The smaller the height between the plate and the bucket, the greater the nominal capacity in the opposite cavity. Thus, the purpose of the bars is to adjust the nominal volume and, consequently, tipping speed, as necessary. The equipment has then a useable capacity of 30% higher volume, enabling possible adjustments, if necessary, by lifting or lowering the height control bar.
We suggest the automatization of tipping counting using a reed switch, a low-cost electronic device. The reed switch is proposed to be attached to one of the supporting bars of the TB structure while the magnet will be fixed to the central portion of the bucket. Each time the tipping bucket device releases water, the fixed magnet will pass close to the reed switch, creating a magnetic field and joining its two internal metallic filaments, allowing the passage of current and registering the tipping time as a pulse signal. The electrical signal (pulse) can be recorded and stored by any commercial or low-cost (Arduino or Raspberry) datalogger.
Calibration should be performed in two steps: static (volumetric) and dynamic. Static calibration consists of determining the volume of water necessary for the center of mass to be shifted towards the filling cavity, leading to its tipping. The volume determined in this step corresponds to the volumetric resolution or nominal volume (NV) of the equipment used during the dynamic calibration. The dynamic calibration consists of creating adjustment curves to correct errors between the flow rates estimated by the equipment through a constant flow input (Shedekar et al., 2016).
During the construction of the calibration curve, it is important to mimic real field conditions. Among these conditions, a high concentration of sediments can change the density of the water, as well as accumulate in the cavities of the equipment, in both cases resulting in malfunctions and measurement errors. This point was already brought forward by Barfield and Hirschi (1986) while indicating that the effect of sediments is significant, but can be neglected when the concentration is lower than 20 g/L. We suggest investigating the expected soil loss rate of the monitored area where the TB will be employed to come up with the best approach for runoff monitoring, such as: disregarding soil presence, construction of calibration curve using water rich in soil particles, or correcting factor of water density.
To determine the volumetric resolution, a graduated pipette, and a suction pear can be used. The water must drip slowly so that the kinetic effect does not interfere with the process until one of the cavities tips and the volume is identified. The procedure must be performed several times (we suggest 10) in each cavity and then the average between the replicates is applied to determine the equipment’s volumetric resolution. Once the volumetric capacity is determined, dynamic calibration during equipment motion with continuous water entry is required. Connect the TB to a constant flow water outlet, like a public water supply system’s refilled column, to generate motion. The test should include varied flow intensities associated with return periods using local IDF curves, up to a maximum level set by the designer. Adjust the inflow rate to reach the desired sampling point and measure it using simple methods like gravimetry. The reed switch on the TB, coupled with a datalogger, automatically counts and records tip numbers. Simulated flow is calculated as the product of tips and volumetric cavity resolution. Correlation between simulated and reference flow rates can be determined using standard mathematical models such as linear, polynomial, potential, inverse flow rates over time, and quadratic. More information regarding calibration process, and errors sources is given by Schwamback et al. (2022).
Surface runoff monitoring took place in experimental plots of 100 m2 (20 m long and 5 m wide), implemented in 2011 at the São José farm in Itirapina county, Central region of the State of São Paulo, Brazil (Figure 4). The area was chosen once it has been continuously monitored since 2011, but only containing information of runoff after rainfall events and the use the TB would provide a continuous detailed characterization of surface processes. Based on the above-described TB design criteria, four TBs were built and installed at experimental plots on four LULC: sugarcane (TB1), soybean (TB2), and bare soil built in 2011 (TB3) and 2020 to study the long-term environmental exposure effects on soil loss (TB4). The expected flow rate influenced on the designed TB that varied on volumetric capacity and construction material, while more details are given on session 3.1.1. Even though the plots were built in triplicates, only one TB was installed at the outlet of each LULC. The TB field test occurred during the rainy season (779 mm) between November 15th, 2021 and April 19th, 2022. Once runoff starts, the flow is orientated through metallic boards to a PVC tube connected to the tipping bucket flow meters, similar to the field monitoring process used by Bashagaluke et al. (2018) and Sun et al. (2014). The reed switches previously installed on the TBs (Figure 1), coupled to a datalogger (Campbell Scientific Inc CR1000 and measuring at 10 min interval) used on the nearby weather station and a 12 V battery powered by a solar panel, allowed the counting and automatic recording of the number of tips. After measurements, the water was stored in 310 L boxes to compute the equipment recovery rate (PBIAS) used for the measurement validation.
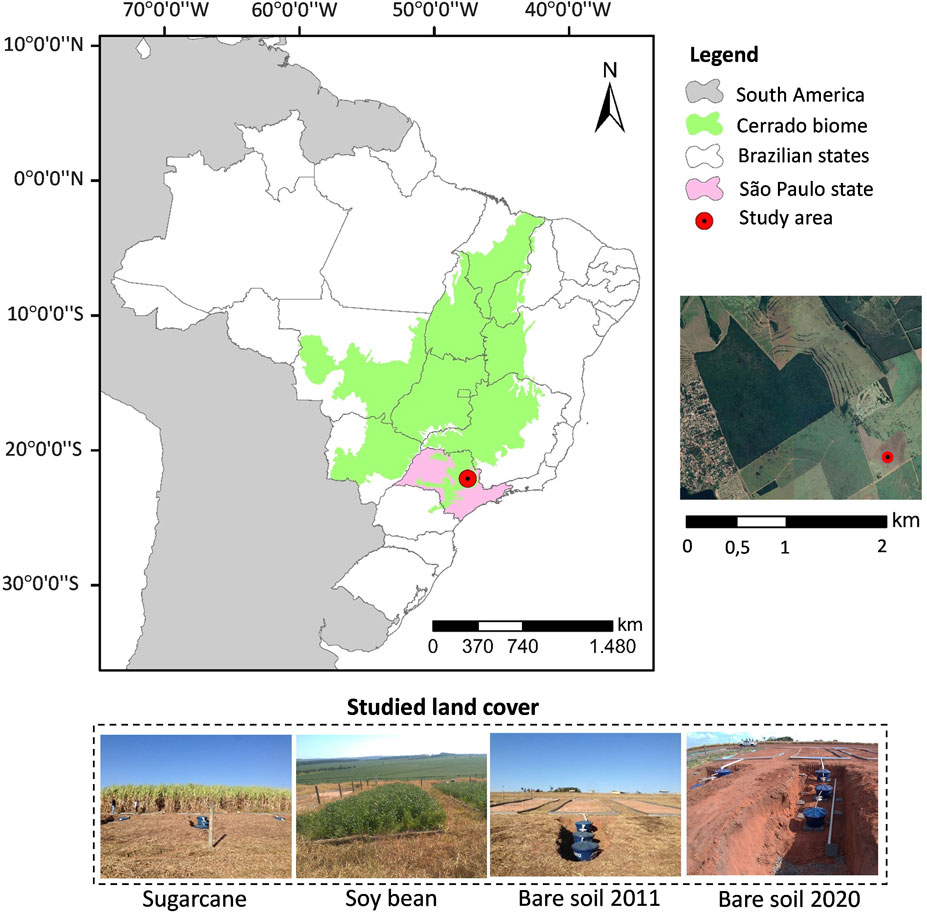
FIGURE 4. Location of experimental study areas covered with sugarcane (TB1), soy bean (TB2), and bare soil constructed in 2011 (TB3) and 2020 (TB4), where tipping buckets (TB) were installed.
Runoff peak flows at the experimental plots were estimated by Eq. 1 based on local information of rainfall intensity, runoff coefficient, and contributing area, while the volumetric capacity of the TB cavity was estimated by Eq. 3 employing the runoff peak, cavity inclination angle, and tipping rate (see Table 2).
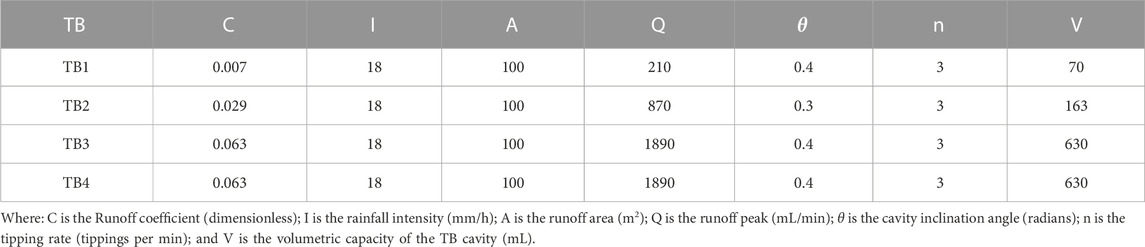
TABLE 2. Input information used to estimate runoff peak (Q) and volumetric capacity of the TB cavity (V) based on Eq. 1 and Eq. 3 for each of the four investigated TBs designed for the case study.
Rainfall intensity was determined using field data collected between November 2011 and October 2018 at an automatic station located in the study area. Data were divided into independent precipitation events with a minimum interval between events of 60 min (Molina-Sanchis et al., 2016), resulting in 1845 independent events. Using histograms made it possible to understand the intensity variation for the study area, in which a higher occurrence of low (less than 1.8 mm/h) and medium (1.8–7.8 mm/h) intensity events was observed. Based on this, the TBs were designed to collect runoff resulting from these rainfall-intensity events. The intensity of 3 mm/10 min (18 mm/h) was adopted as the standard intensity for sizing the tipping bucket cavities, which represented approximately 85% of the accumulated occurrences recorded in the period. Under this flow intensity, we expected a tipping rate of about three tippings per minute. The second variable required to estimate runoff was the coefficient that relates rainfall to runoff generation considering the LULC and soil class. We adopted the surface flow coefficients estimated by Anache et al. (2019) derived from a previous study where we intended to employ the TBs. Finally, the last variable was the contribution area, here 100 m2. After estimating TB4 volumetric cavity, it was increased by 20% (V = 756 mL) based on the preliminary field observations that runoff was higher in that plot than in its neighboring one where C value was estimated (TB3).
The cavities of the TB1 and TB2 were constructed using PVC tubes, 50 and 75 mm in diameter, respectively, cut in half. Due to the high storage capacity needed, the cavities of the TB3 and TB4 were made from galvanized steel sheets, a material resistant to the high impact during water disposal.
Supplementary Material C presents the technical drawings, sizing, and materials used in the construction of TB1, TB2, and TB3. Most parts were constructed using metal (stainless steel) since we were balancing durability, versatility, and cost. Different materials can also be used in the construction, such as plastic and wood (Shiraki et al., 2019), and future studies may be addressed to asses if the material influence on the equipment performance. It is estimated that about $500.00 was spent to purchase materials and build the four tipping bucket flow meters presented. In Supplementary Material D we give some considerations regarding the sizing, installation, operation, and maintenance. Figure 5 shows photographs of the tipping buckets after construction. After taking the photographs, the TBs were painted to prevent corrosion.
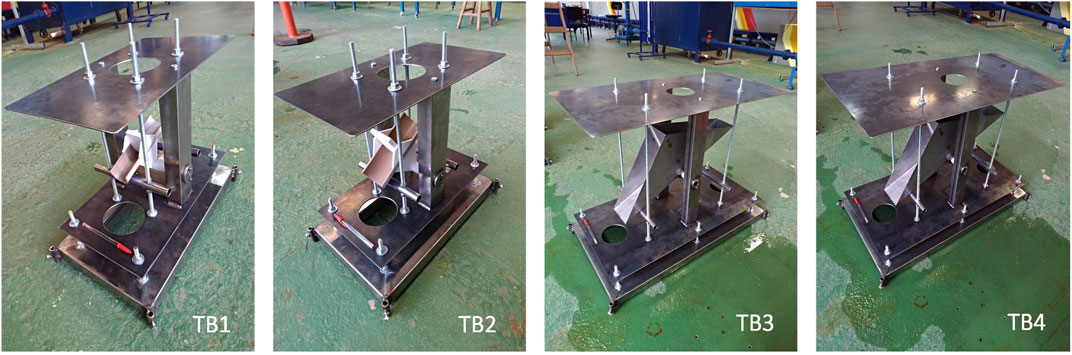
FIGURE 5. Photographs of the designed TBs.
By constructing a histogram of the sediment concentration from data collected in the study area from 2011 to 2017, it was noted that the highest concentration recorded in the period was 10.2 g/L, while most of the monitored events (95%) had a concentration of below 3.0 g/L (Youlton et al., 2016). Since the concentrations of sediments previous monitored were below 20 g/L (Anache et al., 2019), the presence of sediments was neglected (Barfield and Hirschi, 1986) and, thus, water from the public supply system was used for calibration and testing instead of a mixture of water and soil.
After performing the procedure related to static calibration of TBs designed for the case study, it was found that the nominal volume was 64.16 mL, 139.86 mL, 660.95 mL, and 792.33 for TB1, TB2, TB3, and TB4, respectively. In Supplementary Material E is given the mean and standard deviation of observations for each cavity and global analysis (both cavities) of TBs designed. During the dynamic calibration process, positive errors were registered indicating an underestimation of reference flows. The highest mean PBIAS (21.4%) observed in TB4, followed by TB3 (13.6%) TB2 (9.3%), and TB1 (5.7%) indicated a positive correlation (Pearson’s correlation of 0.78), but statistically insignificant (p-value of 0.22), between the TBs nominal volumes and the PBIAS index after curve implementation. It means that as it expands the cavity size, the greater the residual flow underestimation. The inverse correlation between size and accuracy is expressed through the decline of different statistical metrics used available in Supplementary Material F. Besides cavity size, operating speed also plays an important contributing factor in errors (Figure 6), with high errors under extremely low and intense flow rates, as observed by Sun et al. (2014) who sized and calibrated TBs for runoff measurements with a nominal resolution of 2.5 L. It is believed that under low flow rates, the surface tension of the water influences the displacement along the surface of the cavity (Sun et al., 2014), while at high flow rates, the slow and subtle shift, ideal in the gravity center, is affected by the rapid entry of water under turbulent flow (Iida et al., 2012). Another error source that contributes to the registered discrepancies between reference and measured flow comes from the water left in the cavities after one replicate ends and that is not sufficient to tip, as also already highlighted by Nehls et al. (2011).
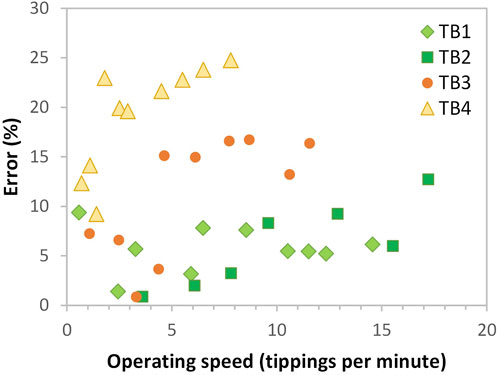
FIGURE 6. Percent error at different operating speed during dynamic calibration of TBs.
After implementing the calibrationcurves (Supplementary Material G), we observed an underestimation ranging from 0.079% (TB1) to 1.612% (TB4). The calibration performance obtained here (Supplementary Material H) are similar to those obtained by Somavilla et al. (2019), Yahaya et al. (2009), and Sun et al. (2014) when applying linear curves to reduce error during the calibration of TBSs of different size. Khan and Ong (1997) carried out the calibration process of a tipping bucket with a volumetric capacity of approximately 3 L and obtained a coefficient of determination of 0.99 with a residual overestimation error of 2%. Similarly, Sun et al. (2014) calibrated a TB with a capacity of 2.5 L, finding a good linear correlation (R2 equal to 0.99) between reference and measured flows and a low mean error (2.1%). It is important to note that the nominal volume of TB4 (660.95 mL) is smaller than those studies mentioned, which would then be expected to have a lower error, as it happened (1.4%), proving its efficiency.
The main purpose of the performed field tests was to evaluate the applicability of the proposed design methodology in runoff monitoring. During the sizing of the TBs constructed for this study case, we designed them considering an operating rate of three tippings per minute (Table 2) to cover 85% of the accumulated runoff intensity. Figure 7 shows the accumulated frequency of operating velocity during the field test. Schwamback et al. (2022) investigated sources of errors in TBs and identified that operating velocity is not linearly correlated to TB errors, but that there is an optional operating zone between two and four tippings per minute. The field test showed that considering the designed operating velocity, most TBs were within the criteria of covering 85% of the accumulated runoff: TB1 (97%), TB2 (93%), TB3 (86%), and TB4 (67%), demonstrating that TBs are operating within a good velocity range and were well sized. During the field test, TB4 operated under a mean velocity higher than expected. TB4 was designed using a runoff coefficient from a similar area (C factor = 0.063) to which we added a 20% increase in volumetric capacity as a safety factor based on initial field monitoring. After runoff data collection, the area where TB4 was installed proved to actually have a runoff coefficient of 0.098. The underestimation of C was the main source of flow underestimation that led to the high operating velocity shown in Figure 8, highlighting the importance of having reliable input data. Considering this new C factor, the TB4 volumetric capacity needs to be increased from 792 mL to 1225 mL (54% higher) and it can be easily reach by lowering the height control bar (Figure 1), which will raise the inclination angle of the cavity at rested position (θ) from the actual 23° (0.4 radians) to 29° (0.5 radians).
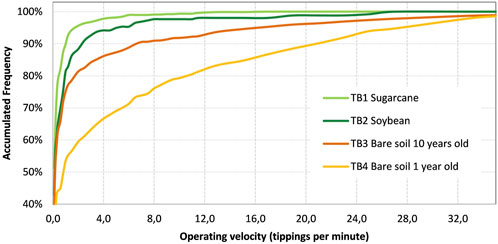
FIGURE 7. Accumulated frequency of TBs’ operating velocity during annual field test.
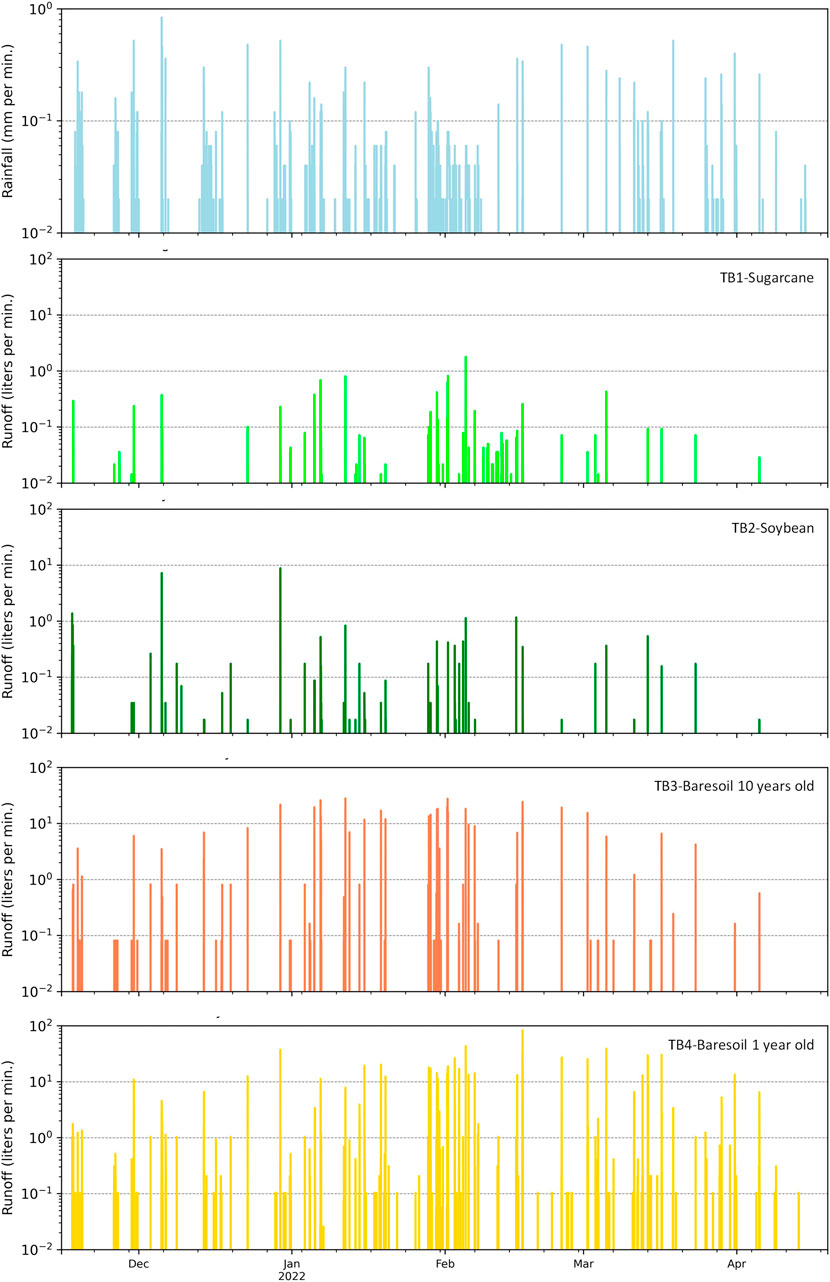
FIGURE 8. Real-time runoff observed by large TBs during rainy season.
The use of TBs for surface runoff monitoring aims to create runoff hydrographs providing information regarding the peak, volume, and duration of runoff events. Figure 8 presents the real-time runoff by the TBs while Figure 9 provides the same information downscaled to selected events, enabling a clearer view of the peak flow rate and the starting and ending periods. Besides single event analysis, the long-term monitoring of runoff at different land covers employing TBs enable the study of vegetation on hydrological features at a longer scale (Figure 10; Supplementary Material J). Based on 84 runoff curves assembled, the experimental plot planted with soybean has a three times higher mean runoff volume, shorter runoff duration, and peak time compared to sugarcane-covered plots. This can be explained by that the soybean plot has a superficial root system, has short life span and went through yearly harvesting and replanting, disturbing the soil. On the other hand, sugarcane has a deeper root system, slow vegetative development, and besides being harvested yearly, is replanted in contour lines every 4 years. Comparing the hydrological behavior of unvegetated plots, TB3 is monitoring runoff in a plot kept exposed to the environment since 2011 while TB4 monitored a plot recently exposed (installed in 2020). Runoff duration and peak time are longer in TB4 than TB3, while peak volume and total volume are higher in TB3, indicating flush runoff characteristics in TB3 even under the same design and slope. Bare soil exposed to precipitation and constant solar radiation over 10 years modified the pedological characteristics of the area, causing: pore clogging, dragging of the surface layers of the soil, and particle breakdown. Such alterations have a direct impact on the infiltration capacity of the soil and, consequently, on the total drained volume (Table 3) and runoff duration (Figure 8; Figure 10).
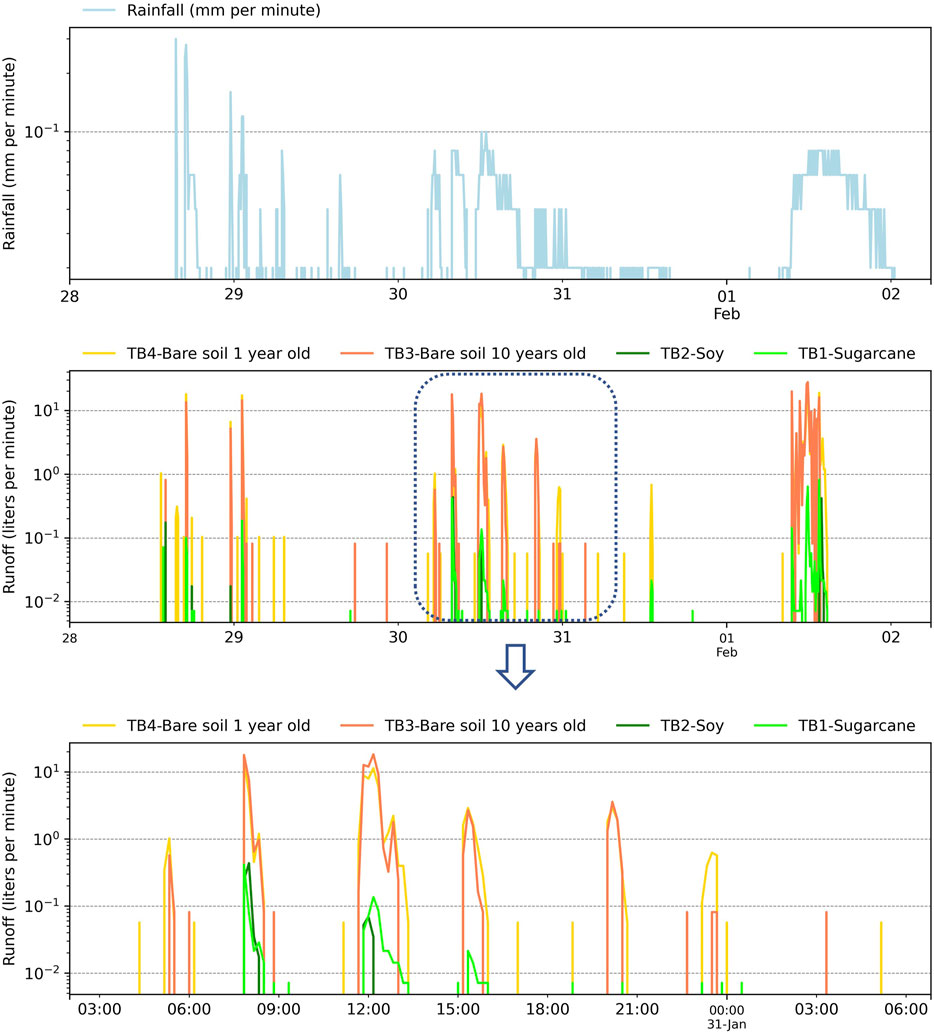
FIGURE 9. Real-time runoff observed by large TBs at event scale.

FIGURE 10. Runoff ensemble curves (grey color) monitored at experimental plots covered with sugarcane (A), bare soil since 2011 (B) and 2020 (C), and soybean (D). Inside each plot, we zoomed in for a better visualization of the mean runoff distribution (red color).
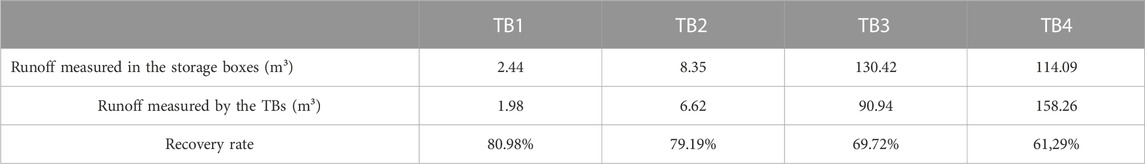
TABLE 3. TBs recovery rate at measuring annual runoff during field test.
Despite our application in experimental plots, the monitoring of peak time, duration, and intensity of runoff hydrographs describe the environmental influence (land cover, slope, climate, infiltration capacity, soil proprieties, among others) on water flow dynamics in a certain studied area providing broader insights. Flow peak time, for instance, reveals when the highest water flow occurs, enabling calibration of flood prediction models in large basins (Zhai et al., 2021) and identification of shifts in overland flow due to changes in land cover (Guzha et al., 2018; Procházka et al., 2019) or climate change (Saraswat et al., 2016). The duration of hydrographs provides insight into the persistence of runoff, essential for assessing the risk of soil erosion and the design of effective erosion control strategies (Bettoni et al., 2023). Meanwhile, intensity data helps in gauging the erosive power of rainfall and, consequently, informs the development of soil conservation policies aimed at mitigating the impacts of erosion (Bettoni et al., 2023). In essence, a comprehensive understanding of flow peak time, duration, and intensity is the linchpin for informed decision-making in hydrology studies and the formulation of effective soil conservation measures under current or future conditions of changes in land cover and climate.
From the comparison between the volumes measured by the TBs and those stored in the boxes, it was possible to estimate the TBs recovery rate during the field test period (Table 3), which varied between 69% and 98%. As already expected, the accuracy is directly related to the volumetric capacity of the TB. There are many different possible errors source that might explain the mismatch between runoff data, such as: kinetic effect during water entry, continuous entry of water into the TB cavity when it is already in motion, loss of lubrication, entry of animals and leaves, flow inlet clogging, etc. Despite the TBs being a robust and low-cost equipment, there are still limitations and difficulties in carrying out data collection in the field, e.g., there was a need for constant checking of the equipment operation at the monitoring site, to ensure that they were working properly.
The proposed TB framework can be easily applied to other land uses, slopes, soil types, and hillslopes of other sizes, once it is possible to collect and drive the runoff to pass through the TB (Table 4; Table 5). Table 4 shows the volumetric capacity of the tipping cavity when designed for different common land uses under the same standardization characteristics (rainfall and drainage area) found in the case study. Table 5 gives the estimated TB volumetric capacity for bare soil under common rainfall intensity rates when applied to different plot sizes, demonstrating the adaptability of the TB solution for multiple-scale rainfall simulations. Nonetheless, the use of smaller plots would prevent high sediment mass under intense rainfall, which may affect the accuracy of the equipment.
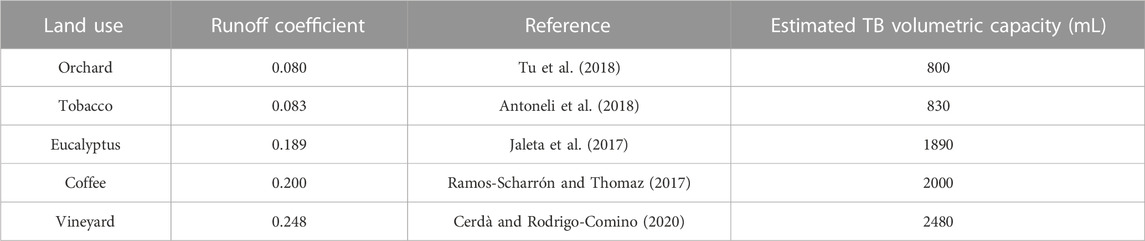
TABLE 4. Estimated TBs volumetric capacity for other land uses under an average rainfall intensity of 18 mm h−1 and drainage area of 100 m2.
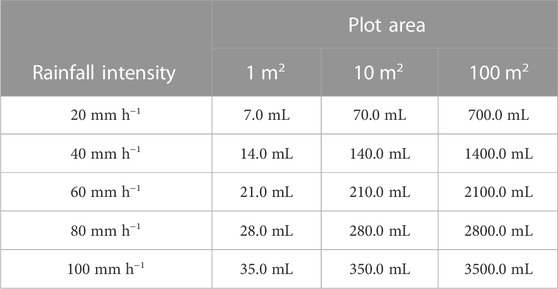
TABLE 5. Estimated TBs volumetric capacity (mL) for bare soil (C = 0.063) (Anache et al., 2019) under different simulated rainfall intensities and drainage areas.
Although using empirical methods provides satisfactory estimations regarding water resources, in situ monitoring is indispensable for calibration and validation. Among the existing alternatives, such as Parshall flumes, level, and mass sensors, spillway, and storage boxes, tipping bucket flow meters (TBs) are considered a low-cost construction and installation alternative, easy to operate, which allow measurements with high temporal resolution and data accuracy. Nonetheless, those who intend to use this monitoring equipment have so far not had a detailed methodology to design and calibrate the TBs.
Our main contribution was to provide a novel standardized framework for the design of TB that can be easily performed for TBs under any land cover, rainfall, and contributing area. The methodology consists in first estimating the runoff peak rate by the rational equation and later estimating the nominal volume of the cavity based on runoff rate, operation speed, and inclination angle of TB when at resting position. Based on the standardized framework we provided, hydrologists can design a low-cost TB specific for the environmental conditions they face and collect real-time runoff data.
The proposed methodology was implemented in a case study where four TBs were designed for continuous runoff monitoring in experimental plots under commonly found and contrasting LULC in the southeast region of Brazil (soy, sugarcane, and bare soil). Due to the different runoff coefficients, each TB had a specific volumetric resolution for each LULC: 64.16 mL (TB1—sugarcane), 139.86 mL (TB2—soy), 660.95 mL (TB3—bare soil) and 792.33 mL (TB4—bare soil). Besides the case study, we also provided extensive examples of the applicability for sizing the TB other LULC, runoff contributing, and rainfall intensity.
The proposed equipment consists of instruments for continuous monitoring of runoff in remote areas without access to high-voltage electricity. They were tested in the field over 5 months and enabled the capture of runoff features (starting/ending time and flow rate) poorly studied. During the field test the designed TBs demonstrated excellent capacity to represent occurring runoff hydrographs, with a recovery rate between 81% and 61% of total occurring runoff. The continuous monitoring of the runoff in contrasting environments (natural and agricultural LULCs) will provide information about runoff behavior and human disturbance along a detailed timescale. Lastly, the methodology proposed can be easily reproduced to construct tipping buckets consistent with other surface or subsurface flow conditions, such as stem, green roof, and paved surfaces.
The original contributions presented in the study are included in the article/Supplementary Material, further inquiries can be directed to the corresponding author.
DS: Conceptualization, Data curation, Formal Analysis, Investigation, Methodology, Project administration, Visualization, Writing–original draft. MP: Formal Analysis, Funding acquisition, Investigation, Supervision, Writing–review and editing. RB: Supervision, Writing–review and editing. JA: Conceptualization, Methodology, Writing–review and editing. EW: Funding acquisition, Resources, Supervision, Writing–review and editing.
The author(s) declare financial support was received for the research, authorship, and/or publication of this article. This study was funded in part by the São Paulo Research Support Foundation (FAPESP, grants 2015/03806-1, 2019/24292-7 and 2021/14016-2), the Brazilian National Council for Scientific and Technological Development (CNPq, grant numbers 165101/2018-0), and lastly by the Coordination for the Improvement of Higher Education Personnel (CAPES, Finance Code 001).
The authors acknowledge the Graduate Program in Hydraulic Engineering and Sanitation-PPGSHS at the University of São Paulo (EESC-USP) and Department of Building and Environmental Technology at Lund University for the scientific support and the Arruda Botelho Institute (IAB) for allowing the development of this study on its private land.
The authors declare that the research was conducted in the absence of any commercial or financial relationships that could be construed as a potential conflict of interest.
All claims expressed in this article are solely those of the authors and do not necessarily represent those of their affiliated organizations, or those of the publisher, the editors and the reviewers. Any product that may be evaluated in this article, or claim that may be made by its manufacturer, is not guaranteed or endorsed by the publisher.
The Supplementary Material for this article can be found online at: https://www.frontiersin.org/articles/10.3389/fenvs.2023.1286929/full#supplementary-material
Anache, J. A. A., Wendland, E., Rosalem, L. M. P., Youlton, C., and Oliveira, P. T. S. (2019). Hydrological trade-offs due to different land covers and land uses in the Brazilian Cerrado. Hydrol. Earth Syst. Sci. 23, 1263–1279. doi:10.5194/hess-23-1263-2019
Anache, J. A. A., Wendland, E. C., Oliveira, P. T. S., Flanagan, D. C., and Nearing, M. A. (2017). Runoff and soil erosion plot-scale studies under natural rainfall: a meta-analysis of the Brazilian experience. Catena 152, 29–39. doi:10.1016/j.catena.2017.01.003
Antoneli, V., Lenatorvicz, H. H., Bednarz, J. A., Pulido-Fernández, M., Brevik, E. C., Cerdà, A., et al. (2018). Rainfall and land management effects on erosion and soil properties in traditional Brazilian tobacco plantations. Hydrol. Sci. J. 63, 1008–1019. doi:10.1080/02626667.2018.1472379
Barfield, B. J., and Hirschi, M. C. (1986). Tipping bucket flow measurements on erosion plots. Trans. ASAE 29, 1600–1604. doi:10.13031/2013.30360
Bashagakule, J. B., Logah, V., Opoku, A., Tuffour, O., Sarkodie-Addo, J., Quansah, C., et al. (2018). New method for runoff estimation under different soil management practices. Biorxiv. Org. 86, 1–23. doi:10.1101/424069
Bashagaluke, J. B., Logah, V., Opoku, A., Sarkodie-Addo, J., and Quansah, C. (2018). Soil nutrient loss through erosion: impact of different cropping systems and soil amendments in Ghana. PLoS One 13, e0208250. doi:10.1371/journal.pone.0208250
Benedetti, I., Branca, G., and Zucaro, R. (2019). Evaluating input use efficiency in agriculture through a stochastic frontier production: an application on a case study in Apulia (Italy). J. Clean. Prod. 236, 117609. doi:10.1016/J.JCLEPRO.2019.117609
Bettoni, M., Maerker, M., Bosino, A., Conedera, M., Simoncelli, L., and Vogel, S. (2023). Land use effects on surface runoff and soil erosion in a southern Alpine valley. Geoderma 435, 116505. doi:10.1016/j.geoderma.2023.116505
Beven, K., and Germann, P. (2013). Macropores and water flow in soils revisited. Water Resour. Res. 49, 3071–3092. doi:10.1002/wrcr.20156
Blöschl, G., Bierkens, M. F. P., Chambel, A., Cudennec, C., Destouni, G., Fiori, A., et al. (2019). Twenty-three unsolved problems in hydrology (UPH) – a community perspective. Hydrol. Sci. J. 64, 1141–1158. doi:10.1080/02626667.2019.1620507
Calder, I. R., and Kidd, C. H. R. (1978). A note on the dynamic calibration of tipping-bucket gauges. J. Hydrol. 89, 383–386. doi:10.1016/0022-1694(78)90013-6
Cerdà, A., and Rodrigo-Comino, J. (2020). Is the hillslope position relevant for runoff and soil loss activation under high rainfall conditions in vineyards? Ecohydrol. Hydrobiol. 20, 59–72. doi:10.1016/j.ecohyd.2019.05.006
Chow, T. L. (1976). Overland flow and subsurface stormflow studies. Can. J. Soil Sci. 56, 197–202. doi:10.4141/cjss76-028
Corona, R., Wilson, T., D’Adderio, L. P., Porcù, F., Montaldo, N., and Albertson, J. (2013). On the estimation of surface runoff through a new plot scale rainfall simulator in sardinia, Italy. Procedia Environ. Sci. 19, 875–884. doi:10.1016/J.PROENV.2013.06.097
Ebabu, K., Taye, G., Tsunekawa, A., Haregeweyn, N., Adgo, E., Tsubo, M., et al. (2023). Land use, management and climate effects on runoff and soil loss responses in the highlands of Ethiopia. J. Environ. Manage. 326, 116707. doi:10.1016/j.jenvman.2022.116707
Edwards, I. J., Jackon, W. D., and Fleming, P. M. (1974). Tipping bucket gauges for measuring run-off from experimental plots. Agric. Meteorol. 13, 189–201. doi:10.1016/0002-1571(74)90046-6
Elder, K., Marshall, H. P., Elder, L., Starr, B., Karlson, A., Robertson, J., et al. (2014). “Design and installation of a tipping bucket snow lysimeter,” in International Snow Science Workshop 2014 Proceedings, Banff, Canada (Montana State University Libraryskip navigation), 817–824. Available at: http://arc.lib.montana.edu/snow-science/item/2157.
Guzha, A. C., Rufino, M. C., Okoth, S., Jacobs, S., and Nóbrega, R. L. B. (2018). Impacts of land use and land cover change on surface runoff, discharge and low flows: evidence from East Africa. J. Hydrol. Reg. Stud. 15, 49–67. doi:10.1016/j.ejrh.2017.11.005
Hollis, G. E., and Ovenden, J. C. (1987). A tipping bucket flowmeter for roadside gully runoff. Hydrol. Process. 1, 391–396. doi:10.1002/hyp.3360010407
Iida, S., Shimizu, T., Kabeya, N., Nobuhiro, T., Tamai, K., Shimizu, A., et al. (2012). Calibration of tipping-bucket flow meters and rain gauges to measure gross rainfall, throughfall, and stemflow applied to data from a Japanese temperate coniferous forest and a Cambodian tropical deciduous forest. Hydrol. Process. 26, 2445–2454. doi:10.1002/hyp.9462
Iida, S., Shimizu, T., Shinohara, Y., Takeuchi, S., and Kumagai, T. (2020). The necessity of sensor calibration for the precise measurement of water fluxes in forest ecosystems. Cham: Springer, 29–54. doi:10.1007/978-3-030-26086-6_2
Jaleta, D., Mbilinyi, B. P., Mahoo, H. F., and Lemenih, M. (2017). Effect of Eucalyptus expansion on surface runoff in the central highlands of Ethiopia. Ecol. Process. 6, 1–8. doi:10.1186/s13717-017-0071-y
Khan, A. A. H., and Ong, C. K. (1997). Design and calibration of tipping bucket system for field runoff and sediment quantification. J. Soil Water Conserv. 52, 437–443.
Kim, H. J., Sidle, R. C., and Moore, R. D. (2005). Shallow lateral flow from a forested hillslope: influence of antecedent wetness. CATENA 60, 293–306. doi:10.1016/J.CATENA.2004.12.005
Klik, A., Sokol, W., and Steindl, F. (2004). Automated erosion wheel: a new measuring device for field erosion plots. J. Soil Water Conserv. 59, 116–121.
Lamb, K. J., MacQuarrie, K. T. B., Butler, K. E., Danielescu, S., Mott, E., Grimmet, M., et al. (2019). Hydrogeophysical monitoring reveals primarily vertical movement of an applied tracer across a shallow, sloping low-permeability till interface: implications for agricultural nitrate transport. J. Hydrol. 573, 616–630. doi:10.1016/J.JHYDROL.2019.03.075
Langhans, C., Diels, J., Clymans, W., Van den Putte, A., and Govers, G. (2019). Scale effects of runoff generation under reduced and conventional tillage. Catena 176, 1–13. doi:10.1016/j.catena.2018.12.031
Molina-Sanchis, I., Lázaro, R., Arnau-Rosalén, E., and Calvo-Cases, A. (2016). Rainfall timing and runoff: the influence of the criterion for rain event separation. J. Hydrol. Hydromechanics 64, 226–236. doi:10.1515/johh-2016-0024
Nehls, T., Rim, Y. N., and Wessolek, G. (2011). Technical note on measuring run-off dynamics from pavements using a new device: the weighable tipping bucket. Hydrol. Earth Syst. Sci. 15, 1379–1386. doi:10.5194/hess-15-1379-2011
Perales-Momparler, S., Andrés-Doménech, I., Hernández-Crespo, C., Vallés-Morán, F., Martín, M., Escuder-Bueno, I., et al. (2017). The role of monitoring sustainable drainage systems for promoting transition towards regenerative urban built environments: a case study in the Valencian region, Spain. J. Clean. Prod. 163, S113–S124. doi:10.1016/J.JCLEPRO.2016.05.153
Peyrard, X., Liger, L., Guillemain, C., and Gouy, V. (2016). A trench study to assess transfer of pesticides in subsurface lateral flow for a soil with contrasting texture on a sloping vineyard in Beaujolais. Environ. Sci. Pollut. Res. 23, 14–22. doi:10.1007/s11356-015-4917-5
Pinson, W. T., Yoder, D. C., Buchanan, J. R., Wright, W. C., and Wilkerson, J. B. (2004). Design and evaluation of an improved flow divider for sampling runoff plots. Appl. Eng. Agric. 20, 433–438. doi:10.13031/2013.16489
Procházka, J., Pokorný, J., Vácha, A., Novotná, K., and Kobesová, M. (2019). Land cover effect on water discharge, matter losses and surface temperature: results of 20 years monitoring in the Šumava Mts. Ecol. Eng. 127, 220–234. doi:10.1016/j.ecoleng.2018.11.030
Ramos-Scharrón, C. E., and Thomaz, E. L. (2017). Runoff development and soil erosion in a wet tropical montane setting under coffee cultivation. L. Degrad. Dev. 28, 936–945. doi:10.1002/ldr.2567
Saraswat, C., Kumar, P., and Mishra, B. K. (2016). Assessment of stormwater runoff management practices and governance under climate change and urbanization: an analysis of Bangkok, Hanoi and Tokyo. Environ. Sci. Policy 64, 101–117. doi:10.1016/j.envsci.2016.06.018
Schwamback, D., Anache, J. A. A., and Wendland, E. C. (2022). Calibration and error investigation of large tipping bucket flow meters. CATENA 209, 105834. doi:10.1016/J.CATENA.2021.105834
Shedekar, V. S., King, K. W., Fausey, N. R., Soboyejo, A. B. O., Harmel, R. D., and Brown, L. C. (2016). Assessment of measurement errors and dynamic calibration methods for three different tipping bucket rain gauges. Atmos. Res. 178–179, 445–458. doi:10.1016/j.atmosres.2016.04.016
Shimizu, T., Kobayashi, M., Iida, S., and Levia, D. F. (2018). A generalized correction equation for large tipping-bucket flow meters for use in hydrological applications. J. Hydrol. 563, 1051–1056. doi:10.1016/j.jhydrol.2018.06.036
Shiraki, K., Dulnakij, K., Kunita, K., Negi, K., and Sun, J. (2019). Specification of modified handmade tipping buckets flow meters and their calibration system. J. F. Sci. 17, 23‒32.
Somavilla, A., Gubiani, P. I., and Zwirtz, A. L. (2019). Tipping bucket prototype for automatic quantification of surface runoff rate in plots. Rev. Bras. Cienc. do Solo 43, 1–7. doi:10.1590/18069657rbcs20180096
Sun, T., Cruse, R. M., Chen, Q., Li, H., Song, C., and Zhang, X. (2014). Design and initial evaluation of a portable in situ runoff and sediment monitoring device. J. Hydrol. 519, 1141–1148. doi:10.1016/j.jhydrol.2014.08.048
Takahashi, M., Giambelluca, T. W., Mudd, R. G., DeLay, J. K., Nullet, M. A., and Asner, G. P. (2010). Rainfall partitioning and cloud water interception in native forest and invaded forest in Hawai’i Volcanoes National Park. Hydrol. Process. 25, 448–464. doi:10.1002/hyp.7797
Tarolli, P., and Straffelini, E. (2020). Agriculture in hilly and mountainous landscapes: threats, monitoring and sustainable management. Geogr. Sustain 1, 70–76. doi:10.1016/J.GEOSUS.2020.03.003
Tu, A., Xie, S., Yu, Z., Li, Y., and Nie, X. (2018). Long-term effect of soil and water conservation measures on runoff, sediment and their relationship in an orchard on sloping red soil of southern China. PLoS One 13, e0203669. doi:10.1371/journal.pone.0203669
Wang, S., Fu, Z., Chen, H., Nie, Y., and Xu, Q. (2020). Mechanisms of surface and subsurface runoff generation in subtropical soil-epikarst systems: implications of rainfall simulation experiments on karst slope. J. Hydrol. 580, 124370. doi:10.1016/J.JHYDROL.2019.124370
Whipkey, R. Z. (1965). Subsurface stormflow from forest slopes. Hydrol. Sci. J. 10, 74–85. doi:10.1080/02626666509493392
Yahaya, O., Olufayo, A. A., Akinro, A. O., and Mogaji Kehinde, O. (2009). Development and calibration of an automatic Runoff-meter. J. Eng. Appl. Sci. 4, 8–16.
Youlton, C., Wendland, E., Anache, J. A. A., Poblete-Echeverría, C., and Dabney, S. (2016). Changes in erosion and runoff due to replacement of pasture land with sugarcane crops. Sustain 8, 685–712. doi:10.3390/su8070685
Zabret, K., Rakovec, J., and Šraj, M. (2018). Influence of meteorological variables on rainfall partitioning for deciduous and coniferous tree species in urban area. J. Hydrol. 558, 29–41. doi:10.1016/J.JHYDROL.2018.01.025
Zhai, X., Zhang, Y., Zhang, Y., Guo, L., and Liu, R. (2021). Simulating flash flood hydrographs and behavior metrics across China: implications for flash flood management. Sci. Total Environ. 763, 142977. doi:10.1016/j.scitotenv.2020.142977
Zhang, W., Li, H., Pueppke, S. G., Diao, Y., Nie, X., Geng, J., et al. (2020). Nutrient loss is sensitive to land cover changes and slope gradients of agricultural hillsides: evidence from four contrasting pond systems in a hilly catchment. Agric. Water Manag. 237, 106165. doi:10.1016/J.AGWAT.2020.106165
Keywords: overland flow, in-situ monitoring, hillslope hydrology, land use and land cover, device
Citation: Schwamback D, Persson M, Berndtsson R, Anache JAA and Wendland EC (2023) Adaptive design of tipping bucket flow meters for continuous runoff measurement. Front. Environ. Sci. 11:1286929. doi: 10.3389/fenvs.2023.1286929
Received: 31 August 2023; Accepted: 14 November 2023;
Published: 01 December 2023.
Edited by:
Jing Liu, University of Birmingham, United KingdomReviewed by:
Holger Rupp, Helmholtz Association of German Research Centres (HZ), GermanyCopyright © 2023 Schwamback, Persson, Berndtsson, Anache and Wendland. This is an open-access article distributed under the terms of the Creative Commons Attribution License (CC BY). The use, distribution or reproduction in other forums is permitted, provided the original author(s) and the copyright owner(s) are credited and that the original publication in this journal is cited, in accordance with accepted academic practice. No use, distribution or reproduction is permitted which does not comply with these terms.
*Correspondence: Dimaghi Schwamback, ZGltYWdoaXNAZ21haWwuY29t
Disclaimer: All claims expressed in this article are solely those of the authors and do not necessarily represent those of their affiliated organizations, or those of the publisher, the editors and the reviewers. Any product that may be evaluated in this article or claim that may be made by its manufacturer is not guaranteed or endorsed by the publisher.
Research integrity at Frontiers
Learn more about the work of our research integrity team to safeguard the quality of each article we publish.