 Depeng Kong1
 Hong Zhang
94% of researchers rate our articles as excellent or good
Learn more about the work of our research integrity team to safeguard the quality of each article we publish.
Find out more
ORIGINAL RESEARCH article
Front. Environ. Sci., 08 November 2023
Sec. Environmental Informatics and Remote Sensing
Volume 11 - 2023 | https://doi.org/10.3389/fenvs.2023.1284028
This article is part of the Research TopicUnderstanding of Big Data and Artificial Intelligence in Promoting the Environmental GovernanceView all 6 articles
Solving outstanding environmental issues, reducing carbon emissions, and promoting green development are necessary ways to achieve carbon neutrality and carbon peak goals. It is also an important issue faced by society today. This paper uses the Kaya identity combined with the logarithmic mean Divisia index (LMDI) decomposition method to analyze the factors affecting carbon emissions, and uses the Pearson correlation coefficient to screen out eight highly correlated features to construct an extended STIRPAT model. In order to further improve the accuracy of the model in predicting carbon emissions, this paper introduces the Adaboost algorithm from machine learning to enhance the STIRPAT model. Finally, scenario analysis is used to predict and analyze carbon emissions in Shandong Province from 2020 to 2050. The results show that: 1) The main factors affecting urban carbon emissions from 1998 to 2019 are economic growth effects, followed by energy structure effects and energy consumption effects. 2) Under three different development scenarios, Shandong Province can achieve carbon peak between 2030–2035, but there are differences in peaking time and peak values.
In recent decades, environmental challenges have taken center stage in global discourse, with climate change and carbon emissions at the forefront. Countries worldwide are facing the repercussions of rapid industrialization, with China being no exception. In a landmark commitment, during the 75th United Nations General Assembly in 2020, President Xi Jinping outlined an ambitious agenda for China to peak its CO2 emissions before 2030 and achieve carbon neutrality by 2060. This pledge comes at a crucial juncture as China navigates the shift from rapid economic expansion to high-quality, sustainable development. The task at hand not only involves aligning environmental aspirations with sustainable development frameworks but also tackling pressing environmental issues and advancing green development (Zhang and Da, 2015; Lamb et al., 2016; Mi et al., 2017).
The quest for carbon peaking is a critical stepping stone towards the overarching objective of carbon neutrality, a topic that has garnered substantial attention from both academia and policymakers in recent times (Jones et al., 2008; Hepburn et al., 2021; Sun et al., 2017). Research in this realm primarily diverges into exploring the factors driving carbon emissions and prognosticating future emissions trajectories (Steenhof, 2007; Whitmarsh et al., 2010). This study aims to fill the existing knowledge voids, particularly by amalgamating advanced machine learning algorithms to improve the accuracy of predictive models.
The body of literature on carbon emissions is extensive and diverse. For dissecting the factors influencing emissions, the amalgamation of the Kaya identity and the Logarithmic Mean Divisia Index (LMDI) decomposition method has proven instrumental, shedding light on key drivers such as energy consumption, economic indicators, and demographic transitions (Ang and Liu, 2001; Wang et al., 2005). Numerous other methodologies, from structural decomposition analysis to gray correlation degree models, have been employed, unearthing fundamental determinants like economic scale, population size, energy consumption, technological advancement, and energy structure (Liu et al., 2007; Mi et al., 2015; Fan and Zhou, 2019; Hepburn et al., 2021). On the predictive landscape, models like STIRPAT have been a cornerstone, with a burgeoning inclination towards the integration of artificial intelligence. Yet, the collaboration of ensemble algorithms such as Adaboost with these models remains a largely unexplored domain, opening doors for innovative research endeavors (Chen et al., 2022).
Central to our investigation is the query: “How can the synergy of the Adaboost algorithm with conventional models like STIRPAT enhance the precision of carbon emission forecasts?”. Building on this, we hypothesize that the fusion of Adaboost and STIRPAT will deliver superior predictive accuracy, transcending traditional models (Ojaghlou and Uǧurlu, 2023).
Our research methodology melds the conventional with the cutting-edge. The STIRPAT model, a bulwark in emissions forecasting, is augmented with the Adaboost algorithm, a reputable ensemble machine learning technique celebrated for its iterative learning and model optimization prowess (Ates, 2015; York et al., 2003). This distinctive amalgamation epitomizes the essence of our innovation, heralding a refined instrument for carbon emissions forecasting (Ojaghlou et al., 2023; Li and Lin, 2015). While previous endeavors have seen the integration of STIRPAT with neural networks (Zhang and Da, 2015) and support vector machines (Li et al., 2016), our approach, leveraging the Adaboost algorithm, blazes a new trail in the field.
Post this introduction, This paper selects the Kaya identity combined with the logarithmic mean Divisia index method to analyze the factors affecting urban carbon emissions. Pearson correlation coefficients are used to screen out seven highly correlated variables to construct an extended STIRPAT model. In order to further improve the STIRPAT model, this paper introduces the Adaboost algorithm from machine learning to enhance the model and builds an Adaboost-STIRPAT model. Regarding the prediction of carbon emissions, establishing various prediction models and conducting scenario analysis based on the model is the mainstream method currently used in academia to predict carbon emissions (Wang and Watson, 2010; Zhang et al., 2009). Finally, scenario analysis is conducted on this basis to predict and analyze Jiangsu Province’s carbon emissions and carbon peaking from 2020 to 2050.
The Kaya identity was first proposed by a Japanese scholar at the IPCC forum. It decomposes the factors affecting carbon emissions into energy consumption (E), per capita GDP (G), population (P), and carbon emissions (C) (Kaya and Yokobori, 1997).
where C/E is the energy structure intensity, measuring the amount of carbon emissions generated per unit of energy consumption; E/G is the energy consumption intensity, measuring the amount of energy consumption per unit of GDP; G/P is the economic growth effect, calculating the per capita GDP of the region; P is the population scale effect, which is the total population of the region.
Recently, Hwang et al. (2020) evaluated the causal relations between Kaya identity factors and their decomposed features with ODIAC-based fossil fuel CO2 flux. They found significant multicollinearity among the decomposed features. Moreover, Kaya identity factors showed no significant mediating effect on their decomposed features, indicating the weak influence of changes in decomposed features on actual CO2 emissions. To validate this finding and further improve the model, we followed Hwang et al.’s approach by incorporating six features into the traditional STIRPAT model, constructing an extended STIRPAT model. It is crucial to clarify the sequential use of the Kaya identity followed by the STIRPAT model in our study. While the Kaya identity offers a foundational understanding of the factors influencing carbon emissions, it does not provide a complete predictive framework. The STIRPAT model, on the other hand, is known for its comprehensive predictive capabilities, making it a suitable extension after the factor analysis using the Kaya identity. In essence, the Kaya identity excels in dissecting the nuances of carbon emissions, while the STIRPAT model provides a holistic forecasting tool. The confluence of both methodologies in this study ensures a thorough understanding of carbon emission drivers, followed by precise forecasting using an enhanced model.
In order to further calculate the contribution of each factor to carbon emissions, the LMDI additive model is introduced to decompose the Kaya identity (Ang and Liu, 2001). The LMDI additive model has the advantages of complete decomposition, no residuals, easy to use, and easy to understand. It has been widely used in studies on the analysis of factors affecting carbon emissions (Wang et al., 2000; Kumar and Jain, 2010; Zhang and Ang, 2001; Ang, 2004). Set the carbon emissions in the reporting period t as Ct, the carbon emissions in the base period as
where Δc, Δe, Δg, and Δp represent the changes in carbon emissions caused by the energy structure intensity effect, energy consumption intensity effect, economic growth effect, and population scale effect, respectively. The calculation formulas for the contribution of each influencing factor are as follows:
Where
The formula for calculating carbon emissions in this paper comes from the IPCC carbon emission accounting framework (Eggleston et al., 2006).
where Ei is the energy consumption of energy i, γi is the carbon emission coefficient of energy i, and Ci is the carbon emission of energy i. The regional energy consumption data comes from the provincial carbon emission inventory published by the CEADs (China Emission Accounts and Datasets) from 1997 to 2019. Among them, the units of coke oven gas and natural gas are cubic meters (cu.m). In order to ensure consistent statistical units, they are converted into standard coal. The specific conversion standards are 1 × 10⁴cu.m coke oven gas is equivalent to 5928.5 kg standard coal, and 1 × 10⁴cu.m natural gas is equivalent to 12143 kg standard coal. The carbon emission coefficients come from the list of carbon emission coefficients of 15 major energies announced by the IPCC (Table 1).
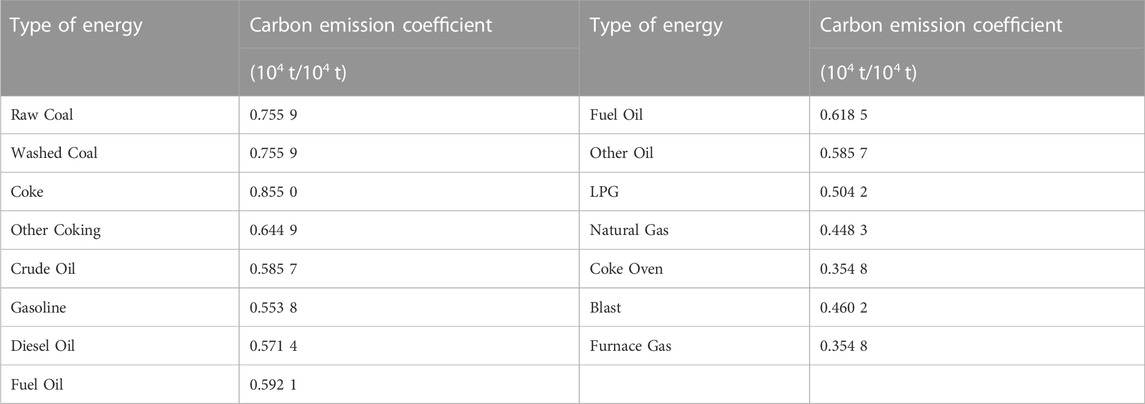
TABLE 1. Carbon emission coefficients of 15 major energies.
Finally, the carbon emissions of each region over the years can be obtained by adding up the carbon emissions of these 15 major energies.
Taking 1997 as the base year, the factors affecting regional carbon emissions are decomposed based on the LMDI model to obtain the contribution of each factor to the carbon emissions in the region, as shown in Figure 1. The regional per capita GDP, total population data, and other data such as urban population, population with higher education, and proportion of secondary industry used later in this paper are all from Shandong Statistical Yearbook (1997–2020) and CSMAR (China Stock Market & Accounting Research Database).
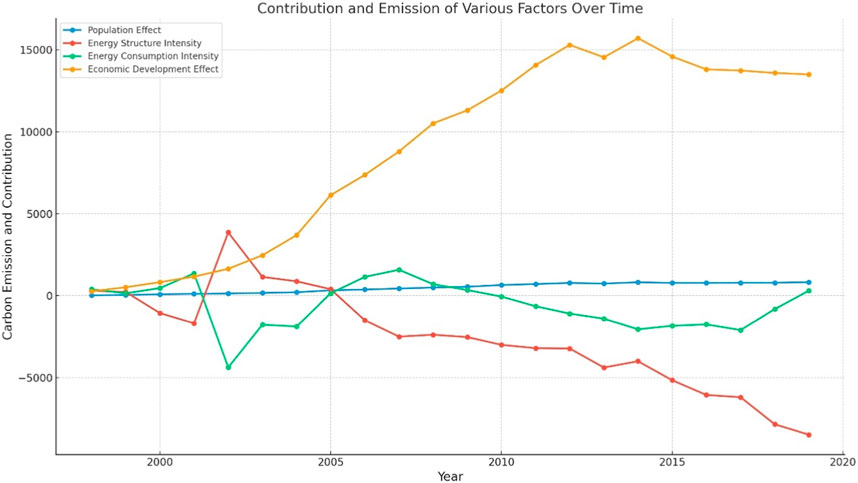
FIGURE 1. Contribution of each factor to carbon emissions.
Figure 1 shows that the population scale effect contributed on average about 483.16 units to carbon emissions over the period examined. Its contribution ranged from a minimum of 23.83 (in 1998) to a maximum of 825.74 (in recent years). This indicates that over time, population growth played an increasingly important role in carbon emissions in Shandong Province. The average contribution of energy structure intensity was approximately −2566.38, implying that it reduced carbon emissions for most of the period. Its contribution ranged from −8482.91 to 3860.20, reflecting the major transformations in Shandong’s energy structure over this timeframe. The average contribution of energy consumption intensity was −601.20, suggesting that overall, improvements in energy efficiency had some effect in decreasing carbon emissions. However, its contribution ranged from −4381.67 to 1580.12, indicating differing effects across time periods. The economic development effect contributed on average 8912.29 to carbon emissions, with its contribution increasing year-on-year from 270.10 to 15708.17, consistent with Shandong’s sustained economic growth. Taken together, these data clearly show that the primary driver of Shandong’s carbon emissions was the economic development effect, while energy consumption intensity and energy structure intensity mitigated emissions in some years. The increase in Shandong’s carbon emissions was mainly due to rapid economic growth, with population growth also being a significant factor. To achieve sustainable development, Shandong should further improve energy efficiency, optimize its energy structure, and seek low-carbon economic growth models.
By sorting out existing literature and combining with LMDI factor decomposition, this paper selects energy structure intensity, energy consumption intensity, per capita GDP, population scale, urbanization rate, proportion of secondary industry, population with higher education, etc. as alternative features for screening. It is crucial to note that we use the term “features” to refer to the individual measurable properties or attributes of our dataset that are input to our machine learning model. While “features” and “variables” can often be used interchangeably, we have chosen “features” to emphasize their role in the predictive modeling process. In the feature selection process, we employed the Pearson correlation coefficient to determine the linear relationship between each potential feature and the target feature, which in this case is carbon emissions. The Pearson correlation coefficient quantifies the degree to which two features are linearly related. It provides a value between −1 and 1, where values close to 1 indicate a strong positive correlation, values close to −1 indicate a strong negative correlation, and values close to 0 suggest a weak or no linear relationship (Bland and Altman, 1995). In our study, features with a high absolute value of the Pearson correlation coefficient were considered as they are likely to provide more information about carbon emissions, enhancing the predictive capability of our model. The calculation results are shown in Table 2.
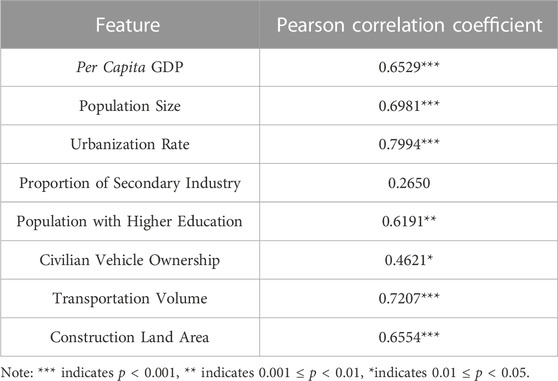
TABLE 2. Pearson correlation coefficients of various features.
The results indicate that urbanization rate, population size, transportation volume, per capita GDP, construction land area, and the population with higher education are all significantly and positively correlated with carbon emissions. Specifically, the urbanization rate showed the strongest relationship. This suggests that economic growth, urban development, and increased transportation are major contributors to carbon emissions in the studied region. The finally selected features are shown in Table 3.
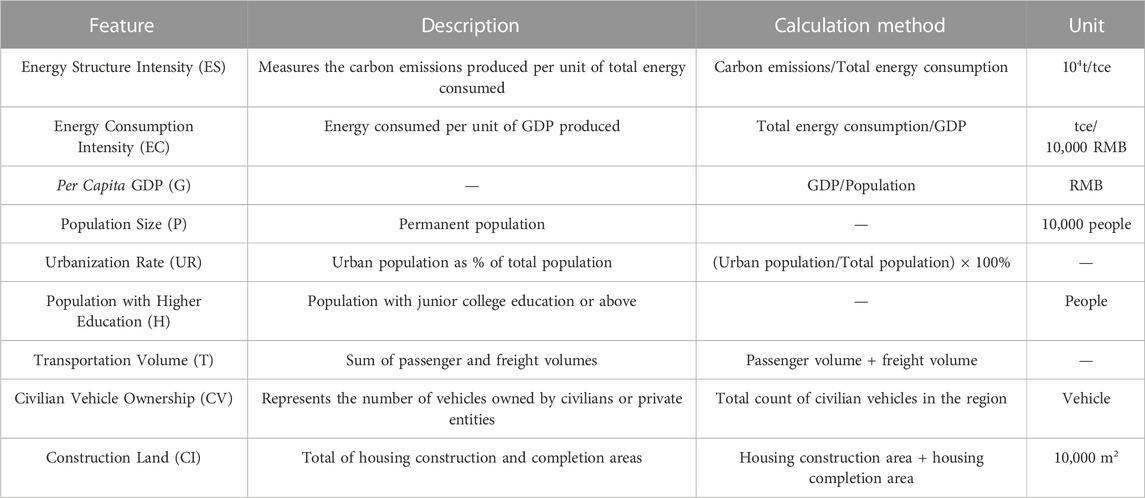
TABLE 3. Features comprehensively screened by LMDI model and Pearson correlation coefficient method.
The STIRPAT model originated from the IPAT model, a classical model for assessing the environmental impacts of human activities (Ojaghlou et al., 2023). Its basic form is:
where I is the environmental status, P is the population scale, A is the economic development level, and T is the technological level. However, this formula is too simple and can only assess the impact of individual factors on the environment. Therefore, Dietz and Rosa (1994) proposed the STIRPAT model based on the IPAT model, extending it as (Ojaghlou and Uǧurlu, 2023):
Taking logarithms on both sides:
where ɑ is the model coefficient, a, b, c, d are estimated coefficients, and e is the error coefficient. In order to make the model closer to the reality of Chinese cities and improve its predictive ability, this paper expands the original STIRPAT model, and its expression is:
Taking logarithms on both sides:
where I is carbon emissions, ES is energy structure intensity, EC is energy consumption intensity, G is per capita GDP, P is population scale, UR is urbanization rate, H is population with higher education, T is transportation volume, CV is the number of civilian cars, CI is construction land scale, a is the model coefficient, and b, c, d, f, g, h, i, j, k are estimated coefficients, representing the percentage change in carbon emissions caused by 1% change in energy structure intensity, energy consumption intensity, per capita GDP, population scale, urbanization rate, population with higher education, transportation volume, the number of civilian cars and construction land scale, respectively. For the training of our model, the dataset comprised a total of 23 samples. We employed an 80–20 split, where 80% of the data was used for training and the remaining 20% was reserved for validation. This split ensures that the model is not overfitted to the training data and can generalize well to unseen data. The optimization objective function used for the model training was the Mean Squared Error (MSE), which measures the average squared differences between predicted and actual values. This choice of objective function is consistent with regression-based models where the aim is to minimize the discrepancies between predictions and ground truth. Hyperparameter tuning was carried out using a grid search approach. We explored a range of values for the learning rate (from 0.001 to 0.1) and the regularization parameter (from 0.1 to 1). The final selection of hyperparameters was based on the performance on the validation set, ensuring a balance between model accuracy and complexity. Parameter selection was guided by a combination of theoretical understanding and empirical results. Sensitivity analysis was conducted for key parameters to ascertain their impact on the model’s predictive accuracy. Those that significantly improved validation performance were retained in the final model configuration.
Ridge regression is a biased regression estimation method for collinear data analysis. There are collinearity problems in the STIRPAT model. Ridge regression is commonly used to fit the regression coefficients when using the STIRPAT model to predict carbon emissions. The key to ridge regression parameter fitting is the selection of the hyperparameter α. This paper selects the parameter α in two ways.
First, determine the value of α when the coefficients and R2 are relatively stable through figures.
It can be seen from Figures 2, 3 that when the value range of α is 0–10, the fitting parameter R2 fluctuates greatly. When narrowing the value range of α and adjusting it to 0–0.1, the fitting parameter R2 becomes more stable with smaller fluctuations and is close to 1, indicating a good fitting effect. Therefore, the value range of α is preliminarily determined to be between 0 and 0.1.
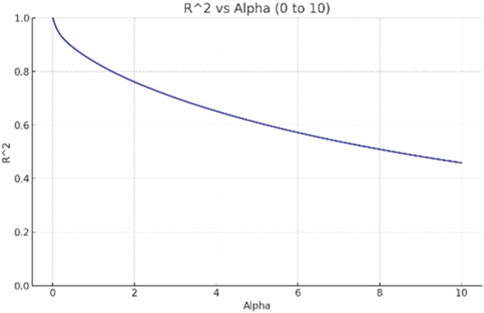
FIGURE 2. R2 change when α is 0–10.
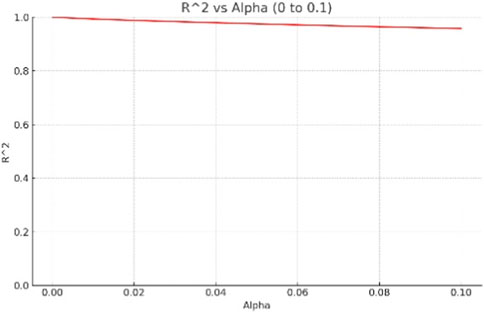
FIGURE 3. R2 change when α is 0–0.1.
It can be seen from Figures 4, 5 that when the value of α is between 0 and 0.1, the fluctuation of the coefficients is large. Therefore, narrow down the value range of the parameter α. When α is between 0.005 and 0.01, the fluctuation of the coefficients becomes stable. Therefore, the value range of α is further determined to be between 0.005 and 0.01.
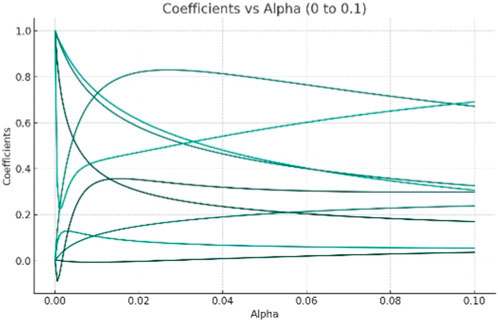
FIGURE 4. Coefficient change when α is 0–0.1.
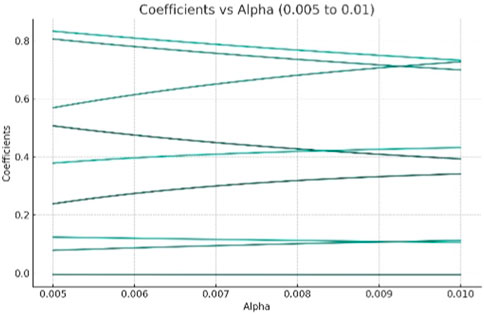
FIGURE 5. Coefficient change when α is 0.005–0.01.
Next, in order to further determine the value of α, cross validation is used to calculate the corresponding α when R2 is maximum. After calculation, when α is 0.005, the corresponding R2 is maximum, which is 0.9878, and α = 0.005 is also within the range of 0.005–0.01 determined by the image method. Therefore, the hyperparameter α is finally determined to be 0.005.
After determining the hyperparameter α to be 0.005, the prediction coefficients can be fitted by ridge regression, and finally the carbon emission prediction model for Shandong Province is obtained:
It is calculated that when α is 0.005, the prediction model R2 is 0.9878, and the prediction results are shown in Figure 6. It can be seen from the figure that the overall prediction effect of the model is good. But as the years increase, the prediction effect of this model gradually deteriorates. It can also be inferred from the maximum R2 of 0.9878 obtained from cross validation that the accuracy of the model in predicting future carbon emissions is limited. Therefore, in order to obtain more accurate prediction results, this paper introduces the Adaboost algorithm from machine learning to enhance the STIRPAT model.
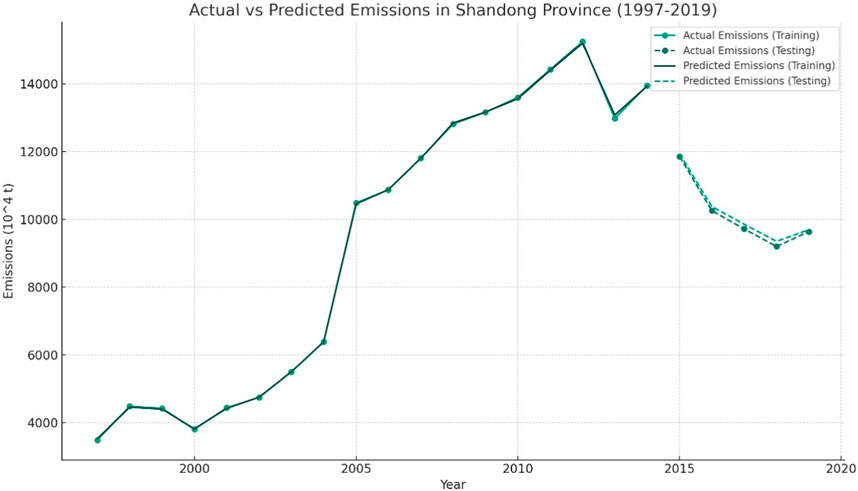
FIGURE 6. Trend of actual and predicted values of Shandong’s carbon emissions from 1997 to 2019.
Adaboost is a very typical algorithm in the boosting algorithm family. The core of this algorithm is to continuously modify the weights of multiple basic learners through repeated learning and training, eventually promoting the weak learners to strong learners. Many studies have used the Adaboost algorithm to predict carbon emissions and achieved good prediction results. However, there has been no research using Adaboost to boost the extended STIRPAT model domestically or abroad. This paper hopes to make some explorations in this area.
To identify the accuracy of the prediction model, this paper makes predictions using the Adaboost-STIRPAT model and the extended STIRPAT model with parameters determined by ridge regression fitting, respectively. R2 and MSE are used as evaluation metrics in this paper. R2 is the goodness of fit and can measure the prediction effect of the model. The closer the absolute value of R2 is to 1, the better the prediction effect of the model. MSE is the mean square error, representing the average of the squares of the differences between observed and predicted values. The smaller the MSE, the better the model’s prediction effect.
It can be seen from Tables 4, 5 that after enhancement by the Adaboost algorithm, the prediction accuracy of the original model has increased. The fitting coefficient R2 of the model rises from 0.9934 to 0.9945, and the mean absolute error MAE drops from 0.0015 to 0.0013. Therefore, the Adaboost-STIRPAT model has a stronger prediction capability and enhances the original model.
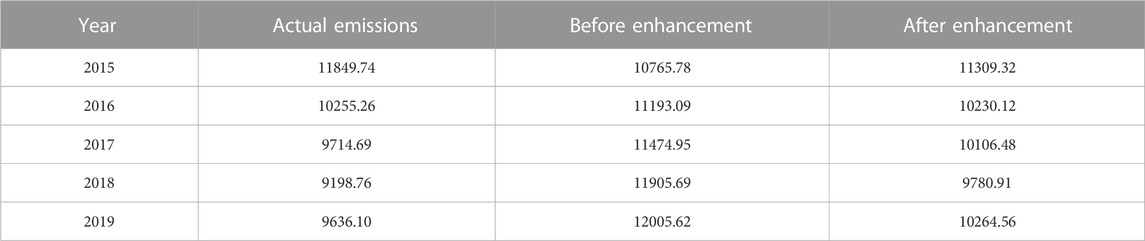
TABLE 4. Comparison of prediction results before and after Adaboost enhancement.
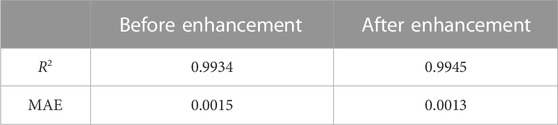
TABLE 5. Comparison of evaluation indicators before and after Adaboost enhancement.
Based on the enhanced Adaboost-STIRPAT model, taking 2019 as the base year, this paper predicts and analyzes the changes of various characteristic values of Shandong Province from 2020 to 2050, and predicts Shandong Province’s carbon emissions from 2020 to 2024 and its carbon peaking situation. Considering the impact of the epidemic, the changes in the rates of various characteristics of Shandong Province from 2020 to 2024 are greatly affected by the epidemic. Therefore, the characteristic values during 2020–2024 will be predicted and analyzed separately.
Energy structure intensity: According to the structural targets in Shandong Province’s 14th Five-Year Plan for Energy Conservation and Emission Reduction, Shandong Province plans to carry out a series of energy structure adjustments. First, the proportion of coal power, clean energy and external power in total social power consumption will be optimized from 68%, 15% and 17% to 60%, 20% and 20%. This means coal as the main energy source will decrease, while the proportion of clean energy and external power will increase. In addition, the consumption proportion of coal is expected to decline to within 60%, and the consumption proportion of non-fossil energy will increase to around 13%. More importantly, the share of renewable energy power generation is also expected to increase to around 19%. Considering these factors, Shandong Province’s low, medium and high decline rates of energy structure intensity for 2020–2024 are set at −0.83%, 0.17%, 1.17%, with the annual change rate set at 0.03%.
Energy consumption intensity: According to Shandong Province’s 14th Five-Year Plan for Energy Conservation and Emission Reduction, Shandong Province has set the overall goal of “reducing the energy consumption per unit of GDP by about 15.5% in 2025 compared to 2020.” The key areas of Shandong Province’s energy consumption—industry, construction, transportation - have been greatly affected by the epidemic, and the sectoral energy consumption has also declined rapidly. Therefore, Shandong Province’s low, medium and high decline rates of energy consumption intensity for 2020–2024 are set at 2.6%, 2.8% and 3.0%, respectively, with the annual change rate set at 0.02%.
Per capita GDP: According to Shandong Province’s 14th Five-Year Plan for National Economic and Social Development, Shandong aims to achieve the goals of “an average annual GDP growth of around 5.5%” and “an average annual growth of per capita disposable income of around 5.5%” during the 14th Five-Year period. Therefore, Shandong Province’s medium growth rate of per capita GDP for 2020–2025 is set above 5.5%, with the low and high growth rates set at 5.3% and 5.7%, respectively. Considering the impact of the epidemic on economic development, the annual change rate of per capita GDP is set at −0.01%.
Population size: According to the 2022 Shandong Statistical Yearbook, Shandong Province’s permanent resident population reached 101.7 million in 2021, a net increase of 0.05 million from 2020, with a growth rate of 0.05%. Therefore, Shandong Province’s low, medium and high population growth rates for 2020–2024 are set at 0.045%, 0.050% and 0.055%, respectively. In addition, Shandong Province’s natural population growth rate was 0.02% in 2021, a significant decrease from the previous year. Therefore, it is expected that the growth rate of Shandong’s population size will continue to slow down, and the annual change rate of population size is set at −0.05%.
Urbanization rate: According to Shandong Province’s 14th Five-Year Plan for National Economic and Social Development, Shandong Province’s registered urbanization rate reached around 61.8% in 2020. At the same time, the plan is to achieve an urbanization rate of around 65% for the permanent resident population by 2025, with a cumulative growth rate of 3.2% over the 5 years. Considering the limited impact of the epidemic on the level of regional urbanization, Shandong Province’s low, medium and high urbanization growth rates for 2020–2024 are set at 3.0%, 3.2% and 3.4%, respectively, with the annual change rate of urbanization set at 0.02%.
Population with higher education: According to data from the China Statistical Yearbook 2022, Shandong Province had 16.4763 million people with a college degree or above in 2021, compared to 14.6034 million in 2020, a growth rate of 12.8%. Therefore, Shandong Province’s low, medium and high growth rates of population with higher education for 2020–2024 are set at 10.80%, 12.80%, 14.80%, respectively, with the annual change rate set at 0.2%.
Number of civil vehicles: According to the Notice of the People’s Government of Shandong Province on Printing and Distributing the Development Plan of Comprehensive Transportation of Shandong Province in the 14th Five-Year Plan Period, Shandong Province will strengthen the promotion of new energy and clean energy buses in urban public transportation and taxis. In particular, by 2025, except for emergency rescue vehicles, new energy vehicles will account for 100% of newly added and updated public transit vehicles; clean energy and new energy vehicles will account for 80% of newly added and updated taxis. This reflects Shandong Province’s firm commitment to green and sustainable transportation. Based on this, we predict that from 2020–2024, driven by policies and technological advances, the number of new energy civil vehicles in Shandong Province will experience significant growth. Considering the government’s goals and current market trends, we set Shandong Province’s low, medium and high growth rates of the number of civil vehicles for 2020–2024 at 6.5%, 7%, and 7.5%, respectively, with the annual change rate set at 0.15%.
Transportation volume: According to the 2022 Shandong Province National Economic and Social Development Statistical Bulletin, affected by the epidemic, the growth of freight traffic in Shandong Province was 12.11%, while passenger traffic volume decreased by 14.10%. With policy adjustments at the end of 2022, Shandong Province’s transportation industry recovered rapidly. In the first half of 2023, Shandong Province’s highway passenger volume increased by 43.8% over the same period last year. Due to the huge impact of the epidemic on the transportation industry, especially large fluctuations during 2020–2023, separate change rates are set for 2020, 2021, and 2022. The low, medium and high decline rates for these 3 years are set at 26%, 27%, and 28%, respectively, with the annual change rate set at −2%. The low, medium and high growth rates for 2023 and 2024 are set at 25%, 30%, and 35%, respectively, with the annual change rate set at 2%.
Area of construction land: According to the 2021 Shandong Province National Economic and Social Development Statistical Bulletin, the construction industry was less affected by the epidemic. The completed area of various buildings in Shandong Province’s construction industry increased by 4.28% over the previous year. Therefore, Shandong Province’s low, medium and high growth rates of construction land area for 2020–2024 are set at 3.5%, 4%, and 4.5%, respectively, with the annual change rate set at 0.05%.
Energy structure intensity: Shandong Province has set forth ambitious targets for carbon reduction. As delineated in the province’s Carbon Peaking Implementation Plan, by 2030, they aim to slash carbon dioxide emissions per unit of GDP by over 68% compared to 2005. This ambitious target necessitates substantial alterations to the prevailing energy structure. To date, a myriad of measures has been instated. For instance, a landmark goal has been set to peak oil consumption for land transportation before 2030. Such strategies underscore the province’s commitment to promoting clean and renewable energy sources. Given these concerted efforts and specific targets, our projection suggests a consistent decline in Shandong Province’s energy structure intensity from 2025 to 2050. Consequently, we’ve forecasted low, medium, and high adjustment rates at −0.28%, −0.32%, and −0.43%, respectively, with an overarching annual change rate of −0.03%.
Energy consumption intensity: A paramount goal in Shandong Province, as articulated in the Methods for Carbon Peaking Implementation, is the aspiration to dramatically reduce “carbon dioxide emissions per unit of GDP by 2030.” Concurrently, there’s an objective to peak oil consumption for land transportation ahead of 2030. Reflecting on historical data, in 2017 and 2018, the province achieved commendable reductions in emissions per unit of GDP, decreasing by 5.3% and 6%, respectively. While these strides are commendable, it is anticipated that urban carbon reduction potential will soon reach its zenith, thereby escalating carbon reduction pressures. To encapsulate these dynamics, our projections for Shandong’s energy consumption intensity from 2025 to 2050 are segmented into three scenarios: low at −1.8%, medium at −2.9%, and high at −3.3%. These rates pivot around an annual change rate of −0.03%.
Per capita GDP: A paramount goal in Shandong Province, as articulated in the Methods for Carbon Peaking Implementation, is the aspiration to dramatically reduce “carbon dioxide emissions per unit of GDP by 2030.” Concurrently, there’s an objective to peak oil consumption for land transportation ahead of 2030. Reflecting on historical data, in 2017 and 2018, the province achieved commendable reductions in emissions per unit of GDP, decreasing by 5.3% and 6% respectively. While these strides are commendable, it is anticipated that urban carbon reduction potential will soon reach its zenith, thereby escalating carbon reduction pressures. To encapsulate these dynamics, our projections for Shandong’s energy consumption intensity from 2025 to 2050 are segmented into three scenarios: low at −1.8%, medium at −2.9%, and high at −3.3%. These rates pivot around an annual change rate of −0.03%.
Population size: Shandong’s demographic landscape is evolving. Recent data from the 7th National Population Census indicates a 5.99% growth in the permanent resident population over the past decade, averaging an annual growth of 0.58%. However, a closer look reveals emerging challenges: declining birth rates, with a notable drop in 2020 and 2021, and a nearing negative natural growth rate. Coupled with an expanding elderly demographic, our population growth rate forecasts for 2025 to 2050 oscillate between −0.11% for a low scenario, 0.023% for a medium scenario, and 0.45% for a high scenario, with an overarching annual change rate of −0.01%.
Urbanization rate: Urban development in Shandong is on a steadfast trajectory. As per the New Urbanization Planning (2021–2035), the province envisions an urbanization rate of 68% by 2025, scaling up to 75% by 2030. Yet, post-2025, urban expansion is expected to taper off, with saturation anticipated between 2025 and 2035. Given this anticipated shift, our urbanization growth rate projections from 2025 to 2050 span three scenarios: low at 1.3%, medium at 2.5%, and high at 3.7%. Importantly, urbanization is projected to stabilize beyond the 85% mark.
Population with higher education: Educational attainments in Shandong are ascending. Data from the 7th National Population Census Bulletin (No.5) highlights that in 2020, for every 100,000 residents, 14,384 had acquired university education or above. This marked a significant 65.45% rise from 2010. Mirroring this trend, our growth rate forecasts for the population with higher education in Shandong from 2025 to 2050 are pegged at 8.61% for a low scenario, 10.71% for a medium scenario, and 12.81% for a high scenario. These rates converge at an annual change rate of 0.01%.
Number of civil vehicles: Economic growth and enhanced living standards in Shandong have catalyzed the demand for civil vehicles. Historical data between 2017 and 2019 underscores this trend, revealing steady growth rates of 10.3% and 9.65% respectively. Yet, future trajectories hint at potential shifts, influenced by global and national emission reduction mandates and the burgeoning allure of new energy vehicles. As traditional fuel vehicles face potential deceleration, new energy vehicles are poised for a surge. To encapsulate this dynamic, our growth rate projections for civil vehicles in Shandong from 2025 to 2050 are categorized into three scenarios: low at −8.5%, medium at −9.5%, and high at −10.5%. These projections align with an annual growth rate of −0.1%.
Transportation volume: Post-2025, as the shadow of the epidemic recedes, Shandong’s transportation sector is set for rejuvenation. Reflecting on 2018 data, there was a notable 3.22% uptick in passenger volume compared to 2017, and freight volume swelled by 8.34% in the same period. With these insights, our growth rate projections for Shandong’s transportation volume from 2025 to 2050 span three scenarios: low at 4.0%, medium at 5.0%, and high at 6.0%. Each of these scenarios is underpinned by an annual change rate of 0.1%.
Area of construction land: The area of construction land in Shandong, relatively insulated from the epidemic’s disruptions, is projected to maintain its growth momentum from 2020 to 2024. In light of this, our growth rate forecasts for the area of construction land in Shandong from 2025 to 2050 are delineated into three scenarios: low at 3.75%, medium at 4.25%, and high at 4.75%. These rates pivot around an annual change rate of 0.05%.
In summary, the setting of the changes in characteristic values is shown in Tables 6–8.
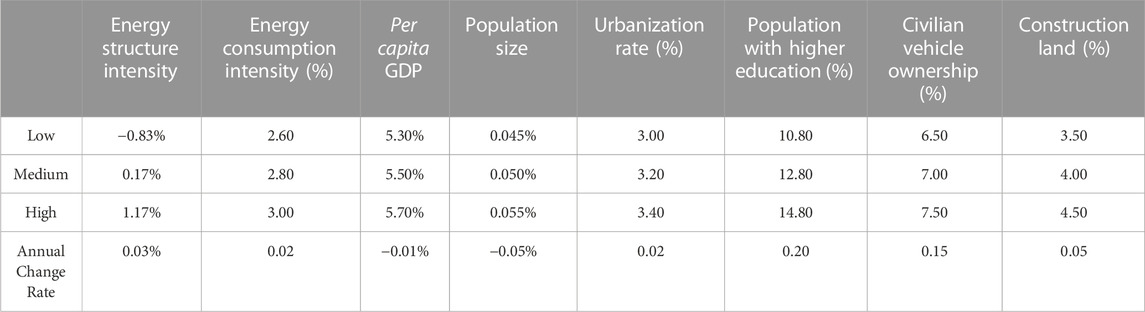
TABLE 6. Changes in characteristic values from 2020 to 2024.
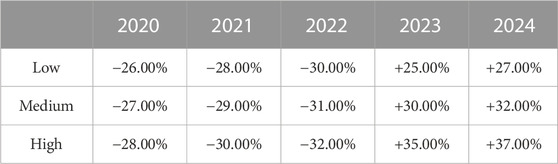
TABLE 7. Changes in transportation volume from 2020 to 2024.
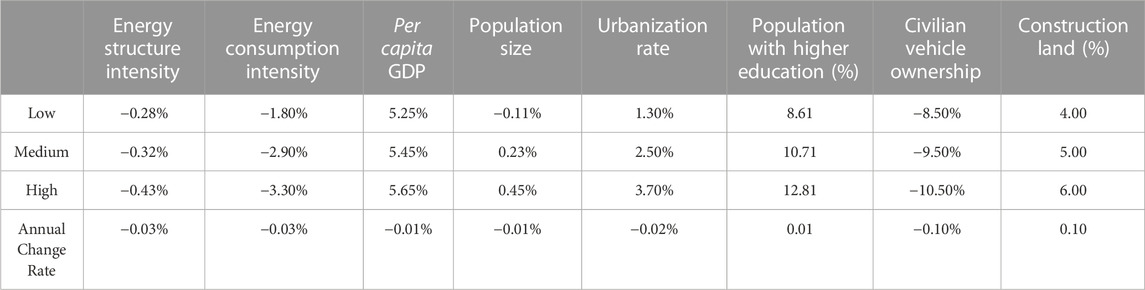
TABLE 8. Changes in characteristic values from 2025 to 2050.
Based on the different changes in the characteristic values, three major scenarios were ultimately determined:
Low-carbon energy-saving scenario: In this scenario, environmental protection is the top priority for the whole society, and carbon emission control and reduction are seen as the core task. Various policies and measures are aimed at reducing carbon emissions through innovation and technological progress, rather than purely pursuing economic growth. Clean energy will be vigorously promoted in urban and rural areas, energy efficiency will be improved, and high-polluting industries will be restricted or transformed. The expected results are as follows: energy structure intensity: high; energy consumption intensity: high; per capita GDP: low; population size: low; urbanization rate: low; population with higher education: low; number of civil vehicles: high; transportation volume: low; area of construction land: low.
Intermediate development scenario: In the intermediate development scenario, society strikes a balance between carbon emission control and economic development. Various policies and measures attempt to achieve continuous environmental protection without sacrificing economic growth. In this scenario, neither high-speed economic growth will be excessively pursued, nor will there be complete reliance on low-carbon technologies and policies. The characteristic values and their changes are at intermediate levels among the three scenarios.
Free development scenario: In the free development scenario, economic growth and urban development are the core tasks, while environmental protection and carbon emission control are relatively secondary. In this scenario, the government and society are mainly concerned with how to achieve rapid economic growth and urbanization through various means, rather than how to reduce carbon emissions. Energy structure intensity: low; energy consumption intensity: low; per capita GDP: high; population size: high; urbanization rate: high; population with higher education: high; number of civil vehicles: low; transportation volume: high; area of construction land: high.
In summary, the characteristic value changes corresponding to the three different scenarios are shown in Table 9.
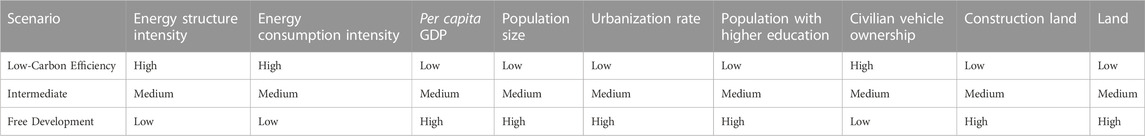
TABLE 9. Characteristic value changes corresponding to different scenarios.
Under the three different scenarios, Shandong Province’s carbon emissions prediction from 2020 to 2050 and the prediction of carbon peaking time are shown in Figure 7 and Table 10.
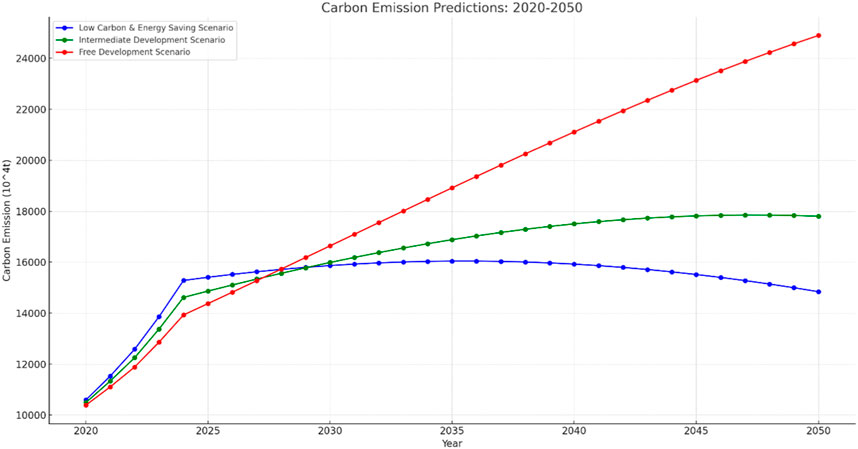
FIGURE 7. Predicted carbon emissions values under three scenarios from 2020 to 2050.
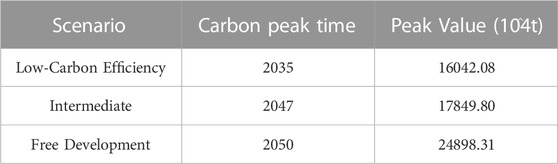
TABLE 10. Prediction of carbon peaking time and peak value under three scenarios.
The carbon emission projections for Shandong Province from 2025 to 2050, as reflected in the three scenarios, delineate the province’s anticipated trajectory in terms of carbon footprint. This trajectory, influenced by policy decisions, strategic choices, and external economic factors, represents the province’s future in terms of sustainable development and environmental impact.
Low Carbon and Energy Saving Scenario: The projection for this scenario paints a promising picture for the province’s sustainability objectives. The carbon emissions are expected to peak in 2035 with an estimated emission of 16042.08 × 104tons. This suggests that with aggressive carbon reduction and sustainable measures, Shandong Province can potentially attain its carbon neutrality goals earlier than other scenarios. The projection underscores the benefits of stringent environmental policies, a pivot towards renewable energy sources, and a commitment to reducing the province’s carbon footprint.
Intermediate Development Scenario: This scenario, which is based on a balanced approach between economic growth and environmental sustainability, projects the carbon emissions peak in 2047, with an estimated emission of 17849.80 × 104tons. The 12-year delay, when compared to the low carbon scenario, highlights the challenges of maintaining a fine balance between development and environmental considerations. While the province can still achieve its sustainability goals, the path might be longer and require more resources.
Free Development Scenario: The most concerning of all, this scenario shows a continuous rise in emissions up to 2050, with no clear peak in sight. The estimated emission for 2050 stands at 24898.31 × 104tons. Such a trajectory is indicative of a development model primarily fueled by fossil fuels, limited environmental regulations, and an emphasis on rapid industrialization without significant considerations for carbon emissions. This direction could have long-term environmental, economic, and social repercussions for Shandong Province.
In essence, the projections emphasize the profound impact of policy decisions on the province’s carbon emissions. While the path of least resistance, represented by the Free Development Scenario, might offer rapid economic growth, it comes at the cost of environmental degradation. On the other hand, a commitment to sustainability, as seen in the Low Carbon & Energy Saving Scenario, can ensure long-term benefits for the province, both in terms of the environment and sustainable economic growth. The choices made today will shape Shandong’s future, and it is crucial to opt for a path that ensures both prosperity and sustainability.
Our research has bridged a critical gap in urban carbon emissions forecasting by innovatively integrating the Adaboost algorithm with the STIRPAT model. The enhanced Adaboost-STIRPAT model not only offers superior prediction accuracy but also provides a versatile framework applicable to various cities nationwide.
This paper uses the Kaya identity combined with the logarithmic mean Divisia index method to analyze the factors affecting urban carbon emissions, and uses the Pearson correlation coefficient to screen out seven highly correlated features to construct an extended STIRPAT model. In order to further improve the STIRPAT model, this paper introduces the Adaboost algorithm from machine learning to enhance the model and builds an Adaboost-STIRPAT model, which improves the traditional method of predicting carbon emissions using STIRPAT models and can obtain more accurate prediction results. It is also suitable for carbon emission predictions in various cities across the country. Finally, scenario analysis is carried out based on the enhanced Adaboost-STIRPAT model to predict and analyze Shandong Province’s carbon emissions and carbon peaking situation from 2020 to 2025. The study found that:
(1) The main factors affecting Shandong’s carbon emissions from 1998 to 2019 are economic growth effects, followed by energy structure effects and energy consumption effects.
(2) Per capita GDP has the greatest impact on carbon emissions, followed by energy consumption intensity, and then population scale.
(3) Using R2 and MAE as evaluation indicators, it is verified that the Adaboost-STIRPAT model has stronger predictive ability than the original STIRPAT model.
(4) Under three different development scenarios, Shandong can achieve carbon peak between 2030–2035, but there are differences in peaking time and peak values. The low-carbon energy-saving scenario and intermediate development scenario both peaked in carbon in 2032, but the low-carbon energy-saving scenario has a smaller peak value; The free development scenario is expected to peak in carbon in 2035, with a larger peak value.
The policy implications of our findings are manifold. Recognizing the significant impacts of economic growth effects, especially per capita GDP, on carbon emissions underscores the need for sustainable economic policies. Balancing economic growth with environmental conservation becomes paramount. The insights into energy structure and consumption effects further emphasize the necessity for a transition towards cleaner energy sources and promoting energy-efficient practices.
Our scenario analyses offer a roadmap for policymakers in Shandong Province and potentially other regions with similar characteristics. The differences in carbon peaking times and values across scenarios highlight the critical role of proactive policy interventions. For instance, aggressively pursuing the low-carbon energy-saving scenario could lead to earlier and lower carbon peaks, paving the way for a more sustainable future. Furthermore, as nations worldwide strive to set and achieve carbon neutrality targets, our study can serve as a foundational reference. The guidance on emission trends under various scenarios can aid policymakers in setting realistic carbon peaking target timeframes, aligning with global climate goals.
While our research has achieved significant milestones in carbon emissions forecasting, it also opens avenues for future studies. Incorporating more granular data, exploring other machine learning techniques, and expanding the model to other provinces or countries can yield even more comprehensive insights. We envision a future where such predictive models, backed by robust policies, lead the way to a global sustainable urban future.
The original contributions presented in the study are included in the article/Supplementary Material, further inquiries can be directed to the corresponding author.
DK: Writing–original draft. ZD: Data curation, Visualization, Writing–original draft. JT: Writing–review and editing. HZ: Formal analysis, Writing–original draft, Writing–review and editing.
The authors declare that no financial support was received for the research, authorship, and/or publication of this article.
The authors declare that the research was conducted in the absence of any commercial or financial relationships that could be construed as a potential conflict of interest.
The reviewer GZ declared a shared affiliation with the authors DK and ZD to the handling editor at the time of review.
All claims expressed in this article are solely those of the authors and do not necessarily represent those of their affiliated organizations, or those of the publisher, the editors and the reviewers. Any product that may be evaluated in this article, or claim that may be made by its manufacturer, is not guaranteed or endorsed by the publisher.
The Supplementary Material for this article can be found online at: https://www.frontiersin.org/articles/10.3389/fenvs.2023.1284028/full#supplementary-material
Ang, B. W. (2004). Decomposition analysis for policymaking in energy:. Energy policy 32 (9), 1131–1139. doi:10.1016/s0301-4215(03)00076-4
Ang, B. W., and Liu, F. L. (2001). A new energy decomposition method: perfect in decomposition and consistent in aggregation. Energy 26 (6), 537–548. doi:10.1016/s0360-5442(01)00022-6
Ates, S. A. (2015). Energy efficiency and CO2 mitigation potential of the Turkish iron and steel industry using the LEAP (long-range energy alternatives planning) system. Energy 90, 417–428. doi:10.1016/j.energy.2015.07.059
Bland, J. M., and Altman, D. G. (1995). Statistics notes: calculating correlation coefficients with repeated observations: Part 1—correlation within subjects. BMJ 310 (6977), 446. doi:10.1136/bmj.310.6977.446
Chen, J., Xu, C., Gao, M., and Li, D. (2022). Carbon peak and its mitigation implications for China in the post-pandemic era. Sci. Rep. 12 (1), 3473. doi:10.1038/s41598-022-07283-4
Dietz, T., and Rosa, E. A. (1994). Rethinking the environmental impacts of population, affluence and technology. Hum. Ecol. Rev. 1 (2), 277–300.
Eggleston, H. S., Buendia, L., Miwa, K., Ngara, T., and Tanabe, K. (2006). 2006 IPCC guidelines for national greenhouse gas inventories.
Fan, J. S., and Zhou, L. (2019). Impact of urbanization and real estate investment on carbon emissions: evidence from China's provincial regions. J. Clean. Prod. 209, 309–323. doi:10.1016/j.jclepro.2018.10.201
Hepburn, C., Qi, Y., Stern, N., Ward, B., Xie, C., and Zenghelis, D. (2021). Towards carbon neutrality and China's 14th Five-Year Plan: clean energy transition, sustainable urban development, and investment priorities. Environ. Sci. Ecotechnology 8, 100130. doi:10.1016/j.ese.2021.100130
Hwang, Y. S., Um, J. S., Hwang, J. H., and Schlüter, S. (2020). Evaluating the causal relations between the Kaya identity index and ODIAC-based fossil fuel CO2 flux. Energies 13 (22), 6009. doi:10.3390/en13226009
Jones, K. E., Patel, N. G., Levy, M. A., Storeygard, A., Balk, D., Gittleman, J. L., et al. (2008). Global trends in emerging infectious diseases. Nature 451 (7181), 990–993. doi:10.1038/nature06536
Kaya, Y., and Yokobori, K. (1997). Environment, energy, and economy: strategies for sustainability, 4. Tokyo: United Nations University Press.
Kumar, U., and Jain, V. K. (2010). Time series models (Grey-Markov, Grey Model with rolling mechanism and singular spectrum analysis) to forecast energy consumption in India. Energy 35 (4), 1709–1716. doi:10.1016/j.energy.2009.12.021
Lamb, A., Green, R., Bateman, I., Broadmeadow, M., Bruce, T., Burney, J., et al. (2016). The potential for land sparing to offset greenhouse gas emissions from agriculture. Nat. Clim. change 6 (5), 488–492. doi:10.1038/nclimate2910
Li, G., Fang, C., Wang, S., and Sun, S. (2016). The effect of economic growth, urbanization, and industrialization on fine particulate matter (PM2. 5) concentrations in China. Environ. Sci. Technol. 50 (21), 11452–11459. doi:10.1021/acs.est.6b02562
Li, K., and Lin, B. (2015). Impacts of urbanization and industrialization on energy consumption/CO2 emissions: does the level of development matter? Renew. Sustain. Energy Rev. 52, 1107–1122. doi:10.1016/j.rser.2015.07.185
Liu, L. C., Fan, Y., Wu, G., and Wei, Y. M. (2007). Using LMDI method to analyze the change of China's industrial CO2 emissions from final fuel use: an empirical analysis. Energy Policy 35 (11), 5892–5900. doi:10.1016/j.enpol.2007.07.010
Mi, Z., Meng, J., Guan, D., Shan, Y., Liu, Z., Wang, Y., et al. (2017). Pattern changes in determinants of Chinese emissions. Environ. Res. Lett. 12 (7), 074003. doi:10.1088/1748-9326/aa69cf
Mi, Z. F., Pan, S. Y., Yu, H., and Wei, Y. M. (2015). Potential impacts of industrial structure on energy consumption and CO2 emission: a case study of Beijing. J. Clean. Prod. 103, 455–462. doi:10.1016/j.jclepro.2014.06.011
Ojaghlou, M., and Uǧurlu, E. (2023). Urbanization and climate change: Environmental Kuznets Curve (EKC) and STIRPAT analysis for Turkey. Econ. Sociol. 16 (1), 244–255. doi:10.14254/2071789X.2023/16-1/16
Ojaghlou, M., Ugurlu, E., Kadłubek, M., and Thalassinos, E. (2023). Economic activities and management issues for the environment: an environmental kuznets curve (EKC) and STIRPAT analysis in Turkey. Resources 12 (5), 57. doi:10.3390/resources12050057
Steenhof, P. A. (2007). Decomposition for emission baseline setting in China's electricity sector. Energy Policy 35 (1), 280–294. doi:10.1016/j.enpol.2005.11.024
Sun, W., Wang, C., and Zhang, C. (2017). Factor analysis and forecasting of CO2 emissions in Hebei, using extreme learning machine based on particle swarm optimization. J. Clean. Prod. 162, 1095–1101. doi:10.1016/j.jclepro.2017.06.016
Wang, C., Chen, J., and Zou, J. (2005). Decomposition of energy-related CO2 emission in China: 1957–2000. Energy 30 (1), 73–83. doi:10.1016/j.energy.2004.04.002
Wang, T., and Watson, J. (2010). Scenario analysis of China’s emissions pathways in the 21st century for low carbon transition. Energy Policy 38 (7), 3537–3546. doi:10.1016/j.enpol.2010.02.031
Whitmarsh, L., O'Neill, S., and Lorenzoni, I. (2010). Engaging the public with climate change: communication and behaviour change[J].
York, R., Rosa, E. A., and Dietz, T. (2003). STIRPAT, IPAT and ImPACT: analytic tools for unpacking the driving forces of environmental impacts. Ecol. Econ. 46 (3), 351–365. doi:10.1016/s0921-8009(03)00188-5
Zhang, F. Q., and Ang, B. W. (2001). Methodological issues in cross-country/region decomposition of energy and environment indicators. Energy Econ. 23 (2), 179–190. doi:10.1016/s0140-9883(00)00069-4
Zhang, M., Mu, H., Ning, Y., and Song, Y. (2009). Decomposition of energy-related CO2 emission over 1991–2006 in China. Ecol. Econ. 68 (7), 2122–2128. doi:10.1016/j.ecolecon.2009.02.005
Keywords: carbon emission prediction, machine learning, Adaboost, STIRPAT model, scenario analysis
Citation: Kong D, Dai Z, Tang J and Zhang H (2023) Forecasting urban carbon emissions using an Adaboost-STIRPAT model. Front. Environ. Sci. 11:1284028. doi: 10.3389/fenvs.2023.1284028
Received: 27 August 2023; Accepted: 20 October 2023;
Published: 08 November 2023.
Edited by:
Jiexun Li, Western Washington University, United StatesReviewed by:
Ying Zhu, Xi’an University of Architecture and Technology, ChinaCopyright © 2023 Kong, Dai, Tang and Zhang. This is an open-access article distributed under the terms of the Creative Commons Attribution License (CC BY). The use, distribution or reproduction in other forums is permitted, provided the original author(s) and the copyright owner(s) are credited and that the original publication in this journal is cited, in accordance with accepted academic practice. No use, distribution or reproduction is permitted which does not comply with these terms.
*Correspondence: Hong Zhang, emhhbmdoMjAyMUBkbHV0LmVkdS5jbg==
Disclaimer: All claims expressed in this article are solely those of the authors and do not necessarily represent those of their affiliated organizations, or those of the publisher, the editors and the reviewers. Any product that may be evaluated in this article or claim that may be made by its manufacturer is not guaranteed or endorsed by the publisher.
Research integrity at Frontiers
Learn more about the work of our research integrity team to safeguard the quality of each article we publish.