 Kuldeep Sharma1,2*
 Joshua Chun Kwang Lee1
 Aurore Porson3Krishnamoorthy Chandramouli1,4Nigel Roberts3Douglas Boyd5Huqiang Zhang1Dale Melvyn Barker1
- 1Centre for Climate Research Singapore, Meteorological Services Singapore, Singapore, Singapore
- 2Climate Hydrology Division, National Institute of Hydrology, Roorkee, India
- 3Met Office Reading, Department of Meteorology, University of Reading, Reading, United Kingdom
- 4Center for Climate Systems Modeling (C2SM), ETH Zurich, Zurich, Switzerland
- 5Met Office, Exeter, United Kingdom
A common issue faced by the downscaled regional ensemble prediction systems is the under-dispersiveness of the ensemble forecasts, often attributed to the lack of spread under the initial conditions from the global ensemble. In this study, a novel method that adopts an adaptive approach to selecting global ensemble members for regional downscaling has been developed. Instead of using a fixed set of pre-selected global ensemble members, the adaptive selection performs a sampling algorithm and selects the global ensemble members, which maximizes a fractions skill score (FSS)-based displacement between ensemble members. The method is applied to a convective-permitting ensemble prediction system over the western Maritime Continent, referred to as SINGV-EPS. SINGV-EPS has a grid spacing of 4.5 km and is a 12-member ensemble that is driven by the European Centre for Medium-Range Weather Forecasts (ECMWF) 51-member global ensemble. Month-long trials were conducted in June 2020 to assess the impact of adaptive selection on the ensemble forecast spread and rainfall verification scores. In both fixed pre-selection and adaptive selection experiments, SINGV-EPS was still under-dispersive. However, adaptive selection improved the ensemble spread and reduced the root-mean-square error (RMSE) of the ensemble mean in wind, temperature, and precipitation fields. Further verification of the rainfall forecasts showed that there was a reduction in the Brier score and a higher hit rate in the relative operating characteristic (ROC) curve for all rainfall thresholds when adaptive selection was applied. Additionally, the ensemble mean forecasts from adaptive selection experiments are more accurate beyond 24 h, with a higher FSS for all rainfall thresholds and neighborhood lengths. These results suggest that the adaptive selection is superior to the fixed pre-selection of global ensemble members for downscaled regional ensemble prediction.
1 Introduction
Singapore is situated in Southeast Asia, a region often affected by heavy rainfall that can lead to floods and landslides. While the prediction of heavy rainfall in this tropical region by atmospheric models is beneficial for flood planning, it is extremely challenging due to complex interactions of deep convection with the large-scale motions and underlying air–sea interactions. Local land–sea breeze circulations, surface heating during the day, and delayed rainfall response to deep convection (Mori et al., 2004; Yamanaka, 2016) play a significant role in governing the diurnal cycle in this region (Yang and Slingo, 2001). High-resolution numerical weather prediction (NWP) systems still struggle to accurately predict the location, intensity, and spatio-temporal extent of rainfall associated with deep convection.
The accuracy of NWP forecasts can be restricted by (i) initial condition errors: an inaccurate representation of the initial atmospheric state due to, for example, a lack of observations and/or limitations of data assimilation; (ii) model errors: errors in the model formulation arising from the need to discretize the atmospheric governing equations and conduct crude parameterization of the unresolved physical processes. For regional NWP, another source of error arises from the lateral boundary conditions. These errors are difficult to quantify as they evolve spatially and temporally. In a chaotic atmospheric system, they can grow exponentially, leading to large forecast uncertainties. Over Southeast Asia, which is dominated by deep convection and highly non-linear, these uncertainties are particularly large, and it is not trivial to estimate them.
The probabilistic approach using convective-permitting ensembles attempts to provide an estimate of the forecast uncertainty (Gebhardt et al., 2008; Schwartz et al., 2010; Schwartz et al., 2014; Clark et al., 2011; Migliorini et al., 2011; Clark et al., 2016; Cafero et al., 2019; Porson et al., 2020). These ensemble prediction systems typically have a grid spacing that is less than 5 km, which allows convective parametrizations to be switched off, or reduced, as deep convection starts to be resolved explicitly by the dynamical core of the atmospheric model, thus reducing the parametrization-related biases (Weusthoff et al., 2010; Ferret et al., 2021 and references therein). Due to the increasing computing power, many operational centers have implemented and run various types of convective-permitting ensemble prediction systems (Clark et al., 2011; Bouttier et al., 2012; Schumacher et al., 2013; Schumacher and Clark, 2014; Hagelin et al., 2017; Zhang, 2018; Frogner et al., 2019; Porson et al., 2020; Ono et al., 2021; Wastl et al., 2021). These systems differ in terms of the number of ensemble members and the approach to capturing the various sources of uncertainties. Despite providing useful forecast guidance, many operational centers and studies report an issue with under-dispersiveness of the ensemble (Buizza et al., 2005; Raftery et al., 2005; Hohenegger et al., 2008; Gebhardt et al., 2011; El-Ouartassy et al., 2022; Lakatos et al., 2023; Manikanta et al., 2023), where the spread of the ensemble members is too small to fully capture the forecast uncertainty.
Typically, convective-permitting ensemble prediction systems are downscaled using the initial and boundary conditions from a global ensemble. However, the convective-permitting ensemble often has fewer members than the global ensemble because of higher computational costs in running convective-permitting ensemble forecasts. Therefore, the driving global ensemble members need to be chosen somehow. Existing approaches include using a fixed selection of a subset of the global ensemble to drive the convective-permitting ensemble, assuming each ensemble member represents an equally likely outcome. However, this pre-selection limits the range of the resulting probability distribution function and may not fully capture the uncertainty under initial conditions originating from the global ensemble. Instead, an adaptive approach may be adopted when selecting the members to better represent the uncertainty in the global ensemble.
In collaboration with the United Kingdom Met Office, Meteorological Service Singapore has implemented a basic convective-permitting ensemble prediction system over Singapore and the surrounding region, referred to as SINGV-EPS (Porson et al., 2019). Preliminary investigations showed that SINGV-EPS also suffers from under-dispersiveness, assessed by comparing the ensemble spread with the corresponding root-mean-square error (RMSE) of the ensemble mean (Fortin et al., 2014). The main aim of this study is to obtain the optimal spread from the reduced number of global ensemble members driving SINGV-EPS, which should lead to improvements in the spread–error relationship of the SINGV-EPS forecasts. We explore an approach that uses an adaptive selection of members so that at each forecast time, different members are selected, such that the ‘displacement’ between the selected ensemble members is optimized. We focus solely on uncertainties arising from the specification of initial and boundary conditions; sensitivity experiments using perturbed model physics were also conducted, but results are omitted because that is not the focus of this paper. We attempt to answer the following questions in this study:
1. How does the spread/uncertainty of SINGV-EPS change when the ECMWF members are adaptively selected?
2. How does the change in spread/uncertainty impact the forecast skill of SINGV-EPS?
The remainder of the article is organized as follows: the details and description of experiments are discussed in Section 2. The data used for the analysis and evaluation methods are discussed in Section 3. The results are discussed in Section 4. The summary and conclusions are presented in Section 5.
2 Experiment setup
2.1 SINGV-EPS description
SINGV-EPS is downscaled using the initial and lateral boundary conditions from the European Centre for Medium-Range Weather Forecasts (ECMWF) global model ensemble analysis and forecast (0.2° horizontal resolution; ∼18 km, with 137 vertical levels), operating on a 364 × 342 horizontal grid with a grid spacing of 4.5 km and 80 vertical levels over the western Maritime Continent (see Figure 1A for domain). It spans from 94.75° to 109.35°E and 5°S to 8.05°N. It is initialized twice a day at 00:00 UTC and 12:00 UTC, with forecast lead times up to 36 h. The dynamical core is based on the Met Office Unified Model framework, which solves a non-hydrostatic, deep atmosphere equation set using semi-implicit, semi-Lagrangian time stepping methods. The formulation of SINGV-EPS is based on a regional ensemble version referred to as MOGREPS-UK (Hagelin et al., 2017). However, SINGV-EPS uses a different science configuration, including differing parametrization scheme settings, compared to MOGREPS-UK. SINGV-EPS uses a tropical configuration, while MOGREPS-UK uses a midlatitude configuration. The main differences are discussed in Bush et al. (2020)—the first Regional Atmosphere and Land configuration tailored for the tropical region (RAL1-T).
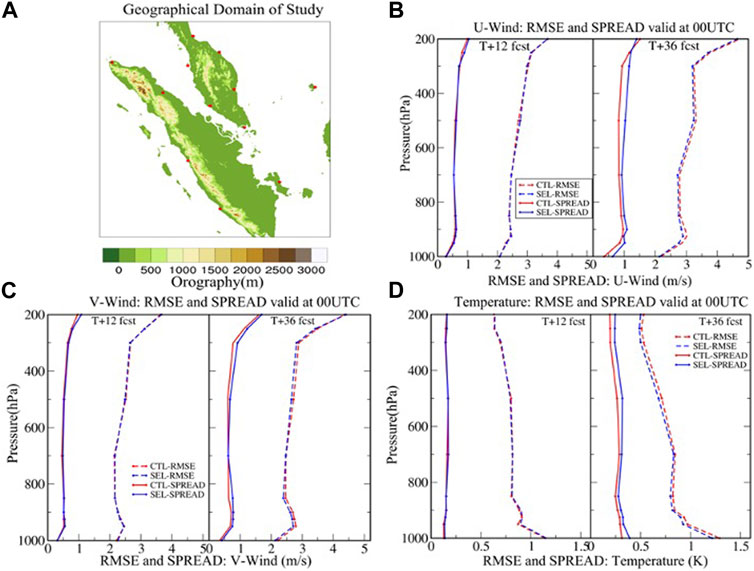
FIGURE 1. (A) Geographical domain of interest showing the terrain elevation (m; contours) and the distribution of 12 radiosonde locations used for verification (red); the vertical profile of ensemble spread and RMSE of the ensemble mean for 12-h (T + 12) and 36-h forecasts (T + 36) of (B) zonal wind, (C) meridional wind, and (D) temperature fields.
SINGV-EPS does not implement additional ensemble perturbations apart from the initial and lateral boundary perturbations inherited from the global ECMWF ensemble (Buizza and Palmer, 1995; Buizza et al., 1999; Palmer et al., 2009; Leutbecher et al., 2017), which uses an ensemble of data assimilation approaches to generate ensemble perturbations. The global ECMWF ensemble contains 51 members (50 members and 1 control), and SINGV-EPS currently uses a pre-selection of 12 members (11 members and 1 control).
2.2 Adaptive selection of ensemble members
As mentioned in Section 1, it is possible to adopt an adaptive approach in selecting members to better represent the uncertainty under initial conditions. This can be achieved by applying a sampling approach based on the fractions skill score (FSS; Gilleland et al., 2020; Roberts, N., 2008; Roberts and Lean, 2008; Skok, G., 2015; Skok and Roberts, 2016; Skok and Roberts, 2018). FSS compares two gridded fields and measures the degree of correspondence as a function of the spatial scale. The forecast and observation fields are re-gridded and converted into binary fields based on the values in each grid cell being higher or lower than a certain threshold. A neighborhood length N (number of grid cells) is defined and used to convert regularly gridded fields into fractions based on the number of grid cells within neighborhoods of size N × N have cell values exceeding the threshold. FSS is then expressed as
where
and
Here, MSE is the mean square error, MSE(N) is the MSE between the observed and modeled fractions, and MSE(N)ref is the maximum possible error from the two fields. O(N) and M(N) are the fields of fractions for neighborhood length N for observations and models, respectively; Nx and Ny are the numbers of neighborhoods in the full domain along the longitude and latitude axes, respectively. FSS is usually computed for a series of varying neighborhood sizes (L) and differing thresholds.
FSS can be used to estimate spatial agreement between ensemble member pairs for different neighborhood sizes, thereby providing an overall measure of spatial ensemble agreement for different neighborhood sizes from all member–member comparisons (Dey et al., 2014). The method selected to adopt here uses FSS as a direct measure of spatial distance. Following the approach of Skok (2015), Skok and Roberts (2016), and Skok and Roberts (2018), the proxy for the spatial distance (
where L is an odd number representing the neighborhood radius in model grid points that defines the neighborhood size
(i) For a two-dimensional atmospheric field (e.g., surface zonal wind) from the ECMWF global ensemble member (
(ii) FSS is calculated for the
(iii) Using Eq. 4, the displacement
(iv) The displacement
(v) The mean displacement
After repeating for all ensemble members, the ensemble members are then ranked according to
2.3 Simulation period
We conducted month-long simulations in June 2020 using SINGV-EPS. June typically occurs as the transition month between the inter-monsoon period and the southwest monsoon period for Singapore, so late afternoon thunderstorms are common due to the convective heating over land and relatively near-surface lighter winds throughout the domain. This allows for sufficient events within the month to compute precipitation verification statistics (Section 4). The forecasts are initialized at 12:00 UTC (8 p.m. local time), and we discard the first 12 h of the forecast due to spin-up. SEL and CTL refer to experiments using SINGV-EPS with and without adaptive selection of members, respectively.
3 Data and methods
3.1 Radiosonde observations
Daily wind and temperature data from 00:00 UTC radiosonde profiles in June 2020 have been used for verification. The data are available from approximately 12 locations scattered around Sumatra and the Malaysian Peninsula (Figure 1A). Although they are sparsely distributed within the domain of interest, the radiosondes are still useful for comparison with vertical profiles of SINGV-EPS forecasts, particularly over land.
3.2 ERA5 reanalysis
ERA5 (reference) is a fifth-generation ECMWF global atmospheric retrospective reanalysis dataset available from 1959, with a horizontal resolution of 0.25° × 0.25°. The data on 6-hourly instantaneous wind and temperature have been used to evaluate model forecast errors. The model forecasts have been interpolated into the reanalysis grid for verification. While ERA5 may not be able to represent the winds associated with high-resolution, local storms in the tropics (Campos et al., 2022), it is still the best available dataset over the Southeast Asia region (Bell et al., 2021) for verifying domain-wide fields.
3.3 GPM-IMERG rainfall
The Global Precipitation Measurement Mission (GPM) is a joint mission between NASA and JAXA, which provides next-generation rainfall products (Hou et al., 2008). The rainfall product obtained from the Integrated Multi-satellitE Retrievals for GPM (Final; GPM-IMERG HHv06B; Huffman et al., 2019) has been used for the verification of precipitation forecasts. The spatial resolution and temporal resolution of GPM-IMERG data are 0.1 and 30 min, respectively. Several studies have evaluated the quality of the GPM product over different regions. Some have highlighted an underestimation of heavy rainfall events and rainfall over oceanic regions (Kahn and Maggioni, 2019; Tan et al., 2019). For the Maritime Continent region, studies have shown that GPM is a reliable satellite-derived precipitation dataset, e.g., during the Malaysian flood event in 2014–2015 (Tan et al., 2019) and in representing the diurnal variation in rainfall over Singapore (De Silva et al., 2021).
4 Results and discussion
4.1 Ensemble spread and RMSE: horizontal wind, temperature, and rainfall
It is a common practice to compare the ensemble spread and RMSE of the ensemble mean. For a perfectly reliable and large ensemble, the two quantities should be approximately the same (Leutbecher and Palmer, 2008). As mentioned previously, SINGV-EPS was found to be severely under-dispersive, partly due to the simplicity of its initial implementation. Figures 1B, C display the 12-h forecasts of zonal and meridional wind RMSE values with respect to radiosonde observations, and the corresponding ensemble spread, averaged over 30 forecasts in June 2020. We note that the ensemble spread of the 12-h forecasts from CTL and SEL is virtually indistinguishable, with negligible differences except those higher than 300 hPa. The RMSE values from CTL and SEL are also similar. Comparing the ensemble spread and RMSE of the 12-h forecasts, the RMSE value is notably larger than its ensemble spread, indicating severe under-dispersiveness of SINGV-EPS. For longer lead times (36-h forecasts), we note that there is an increase in the ensemble spread and a reduction in RMSE when adaptive selection is applied. The results are similar for temperature; the application of adaptive selection resulted in an increase in the ensemble spread and a reduction in RMSE for 36-h forecasts (Figure 1D). The improvement in spread and reduction in RMSE for zonal wind, meridional wind, and temperature fields are statistically insignificant at the 12-h lead time but significant at the 90% confidence level at the 36-h lead time for zonal winds and temperature fields (not shown).
Next, we assess the spatial distributions of RMSE with respect to ERA5 reanalysis and ensemble spread for 500-hPa zonal winds of the 36-h forecasts. Figures 2A–D show that the ensemble spread in the 36-h forecasts is too small compared to RMSE over the full SINGV-EPS domain for both CTL and SEL. The higher values of RMSE are observed over Sumatra and off the eastern coast of the Malay Peninsula. However, the ensemble spread appears somewhat uniform (less than 3 m/s) in both experiments. Figure 2E shows domain-averaged RMSE, ensemble spread, and spread–error ratio from CTL and SEL as a function of forecast lead time. We note that SINGV-EPS is under-dispersive (spread–error ratio less than 1) within the 12–36-h forecast lead time window since the ensemble spread increases at roughly the same rate as RMSE during this window. However, as the lead time increases, the difference in ensemble spread and RMSE between SEL and CTL becomes more pronounced; the use of adaptive selection in SEL clearly improves the ensemble spread and reduces RMSE of the ensemble mean. The improvement in the ensemble spread for 850-hPa zonal winds is statistically insignificant at 12-h forecast lead time but significant at the 90% confidence level at longer lead times (18 h and beyond). The reduction in RMSE is statistically insignificant at the 12-h and 18-h forecast lead times but significant at the 85% confidence level for longer lead times (24 h and beyond; not shown). These results were similar for 500-hPa meridional winds and precipitation forecasts verified against GPM data (Supplementary Figures S1, S2). In the following Section 4, we focus on the verification of precipitation forecasts since it has a closer relationship with deep convection and a high impact on the weather in the region.
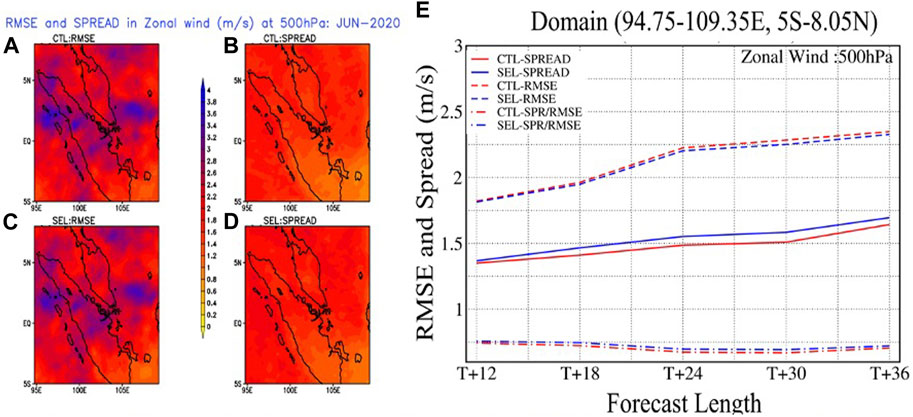
FIGURE 2. Spatial variation in ensemble spread and RMSE of the ensemble mean for 36-h forecasts of 500 hPa zonal wind for (A, B) CTL and (C, D) SEL; and (E) time evolution of domain-averaged ensemble spread (SPREAD), root-mean-square error of ensemble mean (RMSE), and spread–error ratio (SPR/RMSE).
4.2 Probabilistic forecast verification
4.2.1 Brier score
The Brier score (BS; Brier, 1950) measures the average squared difference of the forecast probability of an event and the actual outcome (0 if absent; 1 if present). A smaller BS value implies that the forecast probabilities match closer to the observed outcomes obtained from observations. Figure 3 shows that there is generally an increase in BS with lead time across all four thresholds, indicating a deterioration in ensemble forecast skill with lead time. This result is not surprising since the forecast errors are expected to increase with lead time in a chaotic atmospheric system. The difference of SEL and CTL is more apparent for lower thresholds of rainfall and is only clear after a lead time of 30 h for higher rainfall thresholds. The smaller BS value in SEL compared to that in CTL suggests that applying adaptive selection in SINGV-EPS can improve the ensemble-derived forecast probability products. The reduction in BS is statistically significant at the 90% confidence level at longer forecast lead times (30 h and beyond) for rainfall thresholds of 1 and 2 mm/6 h (not shown).

FIGURE 3. Brier score for rainfall (RF) threshold exceeding 1, 2, 4, and 8 mm/6 h for forecasts from CTL (red) and SEL (blue) as a function of forecast lead time.
4.2.2 Relative operating characteristic curve
ROC represents the efficiency of a forecast system in which the hit rate (HR) is plotted as a function of the false alarm rate (FAR). It highlights the capability of an ensemble prediction system to distinguish occurrences and non-occurrences (Buizza et al., 2005). An ROC curve that bows toward the top left corner (larger area under the ROC curve; AUC) indicates that HR is high and FAR is low, which is desirable. A curve aligned along the diagonal indicates that there is no distinction between HR and FAR, and therefore, the model has no skill. Typically, a model is considered skillful if the AUC value is larger than 0.5 (Mason and Graham, 1999). Figure 4A shows that the ROC curve derived from 36-h forecasts from SEL (for an accumulated rainfall threshold of 2 mm/6 h) bows closer to the top left corner compared to that from CTL. The improvement in ROC is statistically significant at the 90% confidence level for the 36-h forecast (not shown). Figure 4B shows that forecasts from both CTL and SEL are skillful, but in general, the AUC value for CTL is smaller than that for SEL across all lead times and rainfall thresholds. It implies that HR is higher and FAR is lower in the ensemble forecasts when adaptive selection is applied in SINGV-EPS.

FIGURE 4. (A) Relative operating characteristic (ROC) curve for rainfall (RF) thresholds exceeding 2 mm/6 h for 36-h forecasts from CTL (red) and SEL (blue); (B) area under the curve (AUC) for rainfall thresholds exceeding 1, 2, 4, and 8 mm/6 h as a function of forecast lead time.
4.3 Deterministic forecast verification
Apart from performing probabilistic forecast verification of the ensemble, the ensemble mean rainfall forecast skill is also further evaluated using FSS (Roberts and Lean, 2008). It varies from 0 (worst) to 1 (best) with respect to a reference dataset (usually an observational dataset). Typically, a forecast is considered skillful if the FSS value is larger than 0.5. The FSS value of the ensemble forecast mean from CTL and SEL have been computed with respect to GPM data (accumulated 6-h rainfall). Figures 5A–D show the FSS value for different lead times and thresholds as a function of increasing neighborhood length. We note that the FSS value is larger than 0.5 for rainfall thresholds of 1 and 2 mm at all lead times across all neighborhood lengths in CTL and SEL. The FSS value does not differ substantially between CTL and SEL when the forecast lead time is shorter. However, at longer lead times (beyond 24 h), the ensemble mean forecasts from SEL are more accurate, with a higher FSS value at all rainfall thresholds and neighborhood lengths. This suggests that the application of adaptive selection in SINGV-EPS led to an improvement in the ensemble mean rainfall forecast.
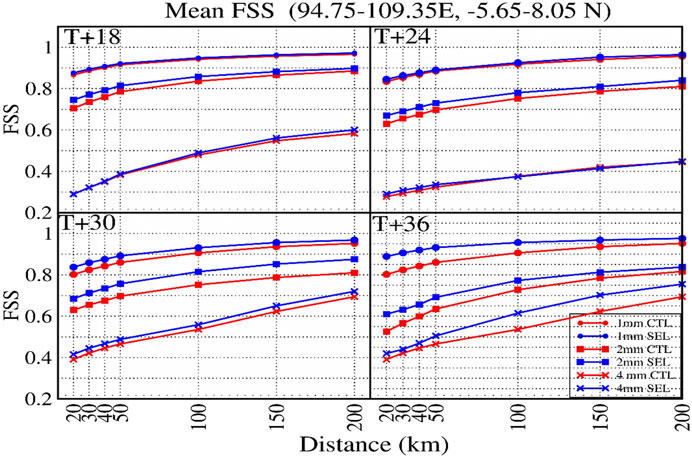
FIGURE 5. Mean fractions skill (FSS) score of 18-h, 24-h, 30-h, and 36-h forecasts from CTL (red) and SEL (blue) for rainfall thresholds exceeding 1, 2, and 4 mm/6 h as a function of the FSS spatial scale (in km).
5 Summary
In this study, we test a novel method of adaptively selecting global ensemble members to drive a regional convective-permitting ensemble prediction system over the western Maritime Continent, referred to as SINGV-EPS. In the control experiment, SINGV-EPS is downscaled using the first 11 odd-numbered global ensemble members (plus the control member), while in the adaptive selection experiment, the 11 global ensemble members (plus the control member) are selected based on a displacement-based algorithm to improve the spread of the initial conditions of SINGV-EPS and therefore the spread in the forecasts. The experiments were conducted in June 2020, a period where convection activity is prevalent. The results are summarized as follows:
(a) A comparison of SINGV-EPS forecasts with radiosonde observations and ERA5 reanalysis data showed that SINGV-EPS is under-dispersive. Applying adaptive selection increased the ensemble spread and reduced the RMSE values of the ensemble mean for zonal wind, meridional wind, and temperature fields. This difference becomes more pronounced for longer forecast lead times, shown for up to 36 h.
(b) A comparison of SINGV-EPS forecasts with satellite-derived precipitation showed that applying adaptive selection also improved the ensemble forecasts of precipitation. With adaptive selection, the Brier score was reduced for all rainfall thresholds, particularly for longer lead times. The relative operating characteristic curve had a larger deviation from a discriminant with no skill, indicating that the ensemble forecasts had a higher hit rate and lower false alarm rate for all rainfall thresholds. The fractions skill score of the ensemble mean was also larger when adaptive selection was applied. This was consistent across all rainfall thresholds, spatial scales, and lead times.
Future research will focus on addressing the inherent under-dispersiveness in SINGV-EPS, through sensitivity studies either with initial and boundary condition perturbations, model physics perturbations, or other post-processing techniques, such as bias correction methods. To this end, various methods used in Tenant (2015), McCabe et al. (2016), and Porson et al. (2020) may be suitable candidates for testing. Further work is currently underway to perform centering of SINGV-EPS on a deterministic high-resolution data assimilation analysis, which should complement the efforts to improve the dispersiveness of the ensemble.
Data availability statement
The ERA5 data and GPM data used in this study are freely available upon registration of their respective websites. The convective ensemble model forecast data are based on the Unified Model framework. The Met Office Unified Model is available for use under license. For further information on how to apply for a license, visit https://www.metoffice.gov.uk/research/modelling-systems/unified-model. Requests to access the datasets should be directed to https://gpm.nasa.gov/data, https://cds.climate.copernicus.eu/cdsapp#!/dataset/reanalysis-era5-pressure-levels?tab=overview.
Author contributions
KS: conceptualization, formal analysis, methodology, validation, visualization, and writing–original draft. JL: funding acquisition, methodology, and writing–review and editing. AP: conceptualization, software, supervision, and writing–review and editing. KC: formal analysis, validation, visualization, and writing–review and editing. NR: investigation, methodology, supervision, and writing–review and editing. DoB: data curation, resources, software, and writing–review and editing. HZ: funding acquisition, project administration, supervision, and writing–review and editing. DaB: funding acquisition, project administration, supervision, and writing–review and editing.
Funding
The author(s) declare financial support was received for the research, authorship, and/or publication of this article. This research has been supported by the National Environment Agency—Singapore.
Conflict of interest
The authors declare that the research was conducted in the absence of any commercial or financial relationships that could be construed as a potential conflict of interest.
Publisher’s note
All claims expressed in this article are solely those of the authors and do not necessarily represent those of their affiliated organizations, or those of the publisher, the editors, and the reviewers. Any product that may be evaluated in this article, or claim that may be made by its manufacturer, is not guaranteed or endorsed by the publisher.
Supplementary material
The Supplementary Material for this article can be found online at: https://www.frontiersin.org/articles/10.3389/fenvs.2023.1281265/full#supplementary-material
References
Bell, B., Hersbach, H., Simmons, A., Berrisford, P., Dahlgren, P., Horányi, A., et al. (2021). The ERA5 global reanalysis: preliminary extension to 1950. Q. J. R. Meteorological Soc. 147, 4186–4227. doi:10.1002/qj.4174
Bouttier, F., Vié, B., Nuissier, O., and Raynaud, L. (2012). Impact of stochastic physics in a convection-permitting ensemble. Mon. Weather Rev. 140, 3706–3721. doi:10.1175/MWR-D-12-00031.1
Brier, W. V. (1950). Verification of forecasts expressed in terms of probability. Mon. Weather Rev. 78, 1–3. doi:10.1175/1520-0493(1950)078<0001:vofeit>2.0.co;2
Buizza, R., Hollingsworth, A., Lalaurette, F., and Ghelli, A. (1999). Probabilistic predictions of precipitation using the ECMWF ensemble prediction system. Weather Forecast 14, 168–189. doi:10.1175/1520-0434(1999)014<0168:PPOPUT>2.0.CO;2
Buizza, R., Houtekamer, P. L., Pellerin, G., Toth, Z., Zhu, Y., and Wei, M. (2005). A comparison of the ECMWF, MSC, and NCEP global ensemble prediction systems. Mon. Weather Rev. 133, 1076–1097. doi:10.1175/MWR2905.1
Buizza, R., and Palmer, T. N. (1995). The singular-vector structure of the atmospheric global circulation. J. Atmos. Sci. 52, 1434–1456. doi:10.1175/1520-0469(1995)052<1434:TSVSOT>2.0.CO;2
Bush, M., Allen, T., Bain, C., Boutle, I., Edwards, J., Finnenkoetter, A., et al. (2020). The first Met Office unified model–JULES regional atmosphere and land configuration, RAL1. Geosci. Model. Dev. 13, 1999–2029. doi:10.5194/gmd-13-1999-2020
Cafaro, C., Frame, T. H. A., Methven, J., Roberts, N., and Bröcker, J. (2019). The added value of convection-permitting ensemble forecasts of sea breeze compared to a Bayesian forecast driven by the global ensemble. Q. J. R. Meteorological Soc. 145, 1780–1798. doi:10.1002/qj.3531
Campos, R. M., Gramcianinov, C. B., de Camargo, R., and da Silva Dias, P. L. (2022). Assessment and calibration of ERA5 severe winds in the atlantic ocean using satellite data. Remote Sens. (Basel) 14, 4918. doi:10.3390/rs14194918
Clark, A. J., Kain, J. S., Stensrud, D. J., Xue, M., Kong, F., Coniglio, M. C., et al. (2011). Probabilistic precipitation forecast skill as a function of ensemble size and spatial scale in a convection-allowing ensemble. Mon. Weather Rev. 139 (5), 1410–1418. doi:10.1175/2010MWR3624.1
Clark, P., Roberts, N., Lean, H., Ballard, S. P., and Charlton-Perez, C. (2016). Convection-permitting models: a step-change in rainfall forecasting. Mater. Apps 23, 165–181. doi:10.1002/met.1538
Da Silva, N. A., Webber, B. G. M., Matthews, A. J., Feist, M. M., Stein, T. H. M., Holloway, C. E., et al. (2021). Validation of GPM IMERG extreme precipitation in the maritime continent by station and radar data. Earth Space Sci. 8, 1738. doi:10.1029/2021EA001738
Dey, S. R. A., Leoncini, G., Roberts, N. M., Plant, R. S., and Migliorini, S. (2014). A spatial view of ensemble spread in convection permitting ensembles. Mon. Weather Rev. 142, 4091–4107. doi:10.1175/MWR-D-14-00172.1
El-Ouartassy, Y., Korsakissok, I., Plu, M., Connan, O., Descamps, L., and Raynaud, L. (2022). Combining short-range dispersion simulations with fine-scale meteorological ensembles: probabilistic indicators and evaluation during a 85 Kr field campaign. Atmos. Chem. Phys. 22, 15793–15816. doi:10.5194/acp-22-15793-2022
Ferrett, S., Frame, T. H. A., Methven, J., Holloway, C. E., Webster, S., Stein, T. H. M., et al. (2021). Evaluating convection-permitting ensemble forecasts of precipitation over Southeast Asia. Weather Forecast 36, 1199–1217. doi:10.1175/WAF-D-20-0216.1
Fortin, V., Abaza, M., Anctil, F., and Turcotte, R. (2014). Why should ensemble spread match the RMSE of the ensemble mean? J. Hydrometeorol. 15, 1708–1713. doi:10.1175/JHM-D-14-0008.1
Frogner, I. L., Andrae, U. L. F., Bojarova, J., Callado, A., Escribà, P. A. U., Feddersen, H., et al. (2019). HarmonEPS—the HARMONIE ensemble prediction system. Weather Forecast 34, 1909–1937. doi:10.1175/WAF-D-19-0030.1
Gebhardt, C., Theis, S., Krahe, P., and Renner, V. (2008). Experimental ensemble forecasts of precipitation based on a convection-resolving model. Atmos. Sci. Lett. 9, 67–72. doi:10.1002/asl.177
Gebhardt, C., Theis, S., Paulat, M., and Bouallègue, Z. B. (2011). Uncertainties in COSMO-DE precipitation forecasts introduced by model perturbations and variation of lateral boundaries. Atmos. Res. 100, 168–177. doi:10.1016/j.atmosres.2010.12.008
Gilleland, E., Skok, G., Brown, B. G., Casati, B., Dorninger, M., Mittermaier, M. P., et al. (2020). A novel set of geometric verification test fields with application to distance measures. Mon. Weather Rev. 148, 1653–1673. doi:10.1175/MWR-D-19-0256.1
Hagelin, S., Son, J., Swinbank, R., McCabe, A., Roberts, N., and Tennant, W. (2017). The Met Office convective-scale ensemble, MOGREPS-UK. Q. J. R. Meteorological Soc. 143, 2846–2861. doi:10.1002/qj.3135
Hohenegger, C., Walser, A., Langhans, W., and Schär, C. (2008). Cloud-resolving ensemble simulations of the August 2005 Alpine flood. Q. J. R. Meteorological Soc. 134, 889–904. doi:10.1002/qj.252
Hou, A. Y., Skofronick-Jackson, G., Kummerow, C. D., and Shepherd, J. M. (2008). “Global precipitation measurement,” in Precipitation: advances in measurement, estimation and prediction (Berlin, Heidelberg: Springer Berlin Heidelberg), 131–169. doi:10.1007/978-3-540-77655-0_6
Huffman, G. J., Bolvin, D. T., and Nelkin, E. J. (2019). Integrated multi-satellitE Retrievals for GPM (IMERG) technical documentation. NASA/GSFC Code, 612, 69.
Khan, S., and Maggioni, V. (2019). Assessment of level-3 gridded global precipitation mission (GPM) products over oceans. Remote Sens. (Basel) 11, 255. doi:10.3390/rs11030255
Lakatos, M., Lerch, S., Hemri, S., and Baran, S. (2023). Comparison of multivariate post-processing methods using global ECMWF ensemble forecasts. Q. J. R. Meteorological Soc. 149, 856–877. doi:10.1002/qj.4436
Leutbecher, M., Lock, S., Ollinaho, P., Lang, S. T. K., Balsamo, G., Bechtold, P., et al. (2017). Stochastic representations of model uncertainties at ECMWF: state of the art and future vision. Q. J. R. Meteorological Soc. 143, 2315–2339. doi:10.1002/qj.3094
Leutbecher, M., and Palmer, T. N. (2008). Ensemble forecasting. J. Comput. Phys. 227, 3515–3539. doi:10.1016/j.jcp.2007.02.014
Manikanta, V., Nikhil Teja, K., Das, J., and Umamahesh, N. V. (2023). On the verification of ensemble precipitation forecasts over the Godavari River basin. J. Hydrol. (Amst) 616, 128794. doi:10.1016/j.jhydrol.2022.128794
Mason, S. J., and Graham, N. E. (1999). Conditional probabilities, relative operating characteristics, and relative operating levels. Weather Forecast. 14, 713–725. doi:10.1175/1520-0434(1999)014<0713:CPROCA>2.0.CO;2
McCabe, A., Swinbank, R., Tennant, W., and Lock, A. (2016). Representing model uncertainty in the Met Office convection-permitting ensemble prediction system and its impact on fog forecasting. Q. J. R. Meteorological Soc. 142, 2897–2910. doi:10.1002/qj.2876
Migliorini, S., Dixon, M., Bannister, R., and Ballard, S. (2011). Ensemble prediction for nowcasting with a convection-permitting model—I: description of the system and the impact of radar-derived surface precipitation rates. Tellus A Dyn. Meteorology Oceanogr. 63, 468. doi:10.1111/j.1600-0870.2010.00503.x
Mori, S., Jun-Ichi, H., Tauhid, Y. I., Yamanaka, M. D., Okamoto, N., Murata, F., et al. (2004). Diurnal land–sea rainfall peak migration over sumatera island, Indonesian maritime continent, observed by TRMM satellite and intensive rawinsonde soundings. Mon. Weather Rev. 132, 2021–2039. doi:10.1175/1520-0493(2004)132<2021:DLRPMO>2.0.CO;2
Ono, K., Kunii, M., and Honda, Y. (2021). The regional model-based mesoscale ensemble prediction system, MEPS, at the Japan meteorological agency. Q. J. R. Meteorological Soc. 147, 465–484. doi:10.1002/qj.3928
Palmer, T. N., Buizza, R., Doblas-Reyes, F., Jung, T., Leutbecher, M., Shutts, G. J., et al. (2009). 598 stochastic parametrization and model uncertainty. Available at: http://www.ecmwf.int/publications/.
Porson, A. N., Carr, J. M., Hagelin, S., Darvell, R., North, R., Walters, D., et al. (2020). Recent upgrades to the Met Office convective-scale ensemble: an hourly time-lagged 5-day ensemble. Q. J. R. Meteorological Soc. 146, 3245–3265. doi:10.1002/qj.3844
Porson, A. N., Hagelin, S., Boyd, D. F. A., Roberts, N. M., North, R., Webster, S., et al. (2019). Extreme rainfall sensitivity in convective-scale ensemble modelling over Singapore. Q. J. R. Meteorological Soc. 145, 3004–3022. doi:10.1002/qj.3601
Raftery, A. E., Gneiting, T., Balabdaoui, F., and Polakowski, M. (2005). Using bayesian model averaging to calibrate forecast ensembles. Mon. Weather Rev. 133, 1155–1174. doi:10.1175/MWR2906.1
Roberts, N. (2008). Assessing the spatial and temporal variation in the skill of precipitation forecasts from an NWP model. Meteorol. Appl. 15, 163–169. doi:10.1002/met.57
Roberts, N. M., and Lean, H. W. (2008). Scale-selective verification of rainfall accumulations from high-resolution forecasts of convective events. Mon. Weather Rev. 136, 78–97. doi:10.1175/2007MWR2123.1
Schumacher, R. S., and Clark, A. J. (2014). Evaluation of ensemble configurations for the analysis and prediction of heavy-rain-producing mesoscale convective systems. Mon. Weather Rev. 142, 4108–4138. doi:10.1175/MWR-D-13-00357.1
Schumacher, R. S., Clark, A. J., Xue, M., and Kong, F. (2013). Factors influencing the development and maintenance of nocturnal heavy-rain-producing convective systems in a storm-scale ensemble. Mon. Weather Rev. 141, 2778–2801. doi:10.1175/MWR-D-12-00239.1
Schwartz, C. S., Kain, J. S., Weiss, S. J., Xue, M., Bright, D. R., Kong, F., et al. (2010). Toward improved convection-allowing ensembles: model physics sensitivities and optimizing probabilistic guidance with small ensemble membership. Weather Forecast 25, 263–280. doi:10.1175/2009WAF2222267.1
Schwartz, C. S., Romine, G. S., Smith, K. R., and Weisman, M. L. (2014). Characterizing and optimizing precipitation forecasts from a convection-permitting ensemble initialized by a mesoscale ensemble Kalman filter. Wea. Forecast. 29, 1295–1318. doi:10.1175/WAF-D-13-00145.1
Skok, G. (2015). Analysis of Fraction Skill Score properties for a displaced rainband in a rectangular domain. Meteorol. Appl. 22, 477–484. doi:10.1002/met.1478
Skok, G., and Roberts, N. (2016). Analysis of Fractions Skill Score properties for random precipitation fields and ECMWF forecasts. Q. J. R. Meteorological Soc. 142, 2599–2610. doi:10.1002/qj.2849
Skok, G., and Roberts, N. (2018). Estimating the displacement in precipitation forecasts using the <scp>Fractions Skill Score</scp>. Q. J. R. Meteorological Soc. 144, 414–425. doi:10.1002/qj.3212
Tan, J., Huffman, G. J., Bolvin, D. T., and Nelkin, E. J. (2019). Diurnal cycle of IMERG V06 precipitation. Geophys Res. Lett. 46, 13584–13592. doi:10.1029/2019GL085395
Tennant, W. (2015). Improving initial condition perturbations for MOGREPS-UK. Q. J. R. Meteorological Soc. 141, 2324–2336. doi:10.1002/qj.2524
Wastl, C., Wang, Y., Atencia, A., Weidle, F., Wittmann, C., Zingerle, C., et al. (2021). C-LAEF: convection-permitting limited-area ensemble forecasting system. Q. J. R. Meteorological Soc. 147, 1431–1451. doi:10.1002/qj.3986
Weusthoff, T., Ament, F., Arpagaus, M., and Rotach, M. W. (2010). Assessing the benefits of convection-permitting models by neighborhood verification: examples from MAP D-PHASE. Mon. Weather Rev. 138, 3418–3433. doi:10.1175/2010MWR3380.1
Yamanaka, M. D. (2016). Physical climatology of Indonesian maritime continent: an outline to comprehend observational studies. Atmos. Res. 178–179, 231–259. doi:10.1016/j.atmosres.2016.03.017
Yang, G.-Y., and Slingo, J. (2001). The diurnal cycle in the tropics. Mon. Weather Rev. 129, 784–801. doi:10.1175/1520-0493(2001)129<0784:TDCITT>2.0.CO;2
Keywords: ensemble spread, adaptive selection, SINGV-EPS, fractions skill score, ensemble verification
Citation: Sharma K, Lee JCK, Porson A, Chandramouli K, Roberts N, Boyd D, Zhang H and Barker DM (2023) Adaptive selection of members for convective-permitting regional ensemble prediction over the western Maritime Continent. Front. Environ. Sci. 11:1281265. doi: 10.3389/fenvs.2023.1281265
Received: 22 August 2023; Accepted: 10 October 2023;
Published: 06 November 2023.
Edited by:
Amit Awasthi, University of Petroleum and Energy Studies, IndiaReviewed by:
Sanjeev Kumar Singh, Indian Institute of Remote Sensing, IndiaAkhilesh Kumar Mishra, National Centre for Medium Range Weather Forecasting, India
Sushant Kumar, National Centre for Medium Range Weather Forecasting, India, in collaboration with reviewer AM
Copyright © 2023 Sharma, Lee, Porson, Chandramouli, Roberts, Boyd, Zhang and Barker. This is an open-access article distributed under the terms of the Creative Commons Attribution License (CC BY). The use, distribution or reproduction in other forums is permitted, provided the original author(s) and the copyright owner(s) are credited and that the original publication in this journal is cited, in accordance with accepted academic practice. No use, distribution or reproduction is permitted which does not comply with these terms.
*Correspondence: Kuldeep Sharma, a3VsZGVlcDc4M0BnbWFpbC5jb20=