 Yinglun Zhu1
 Yingying Xu
94% of researchers rate our articles as excellent or good
Learn more about the work of our research integrity team to safeguard the quality of each article we publish.
Find out more
ORIGINAL RESEARCH article
Front. Environ. Sci., 10 November 2023
Sec. Environmental Economics and Management
Volume 11 - 2023 | https://doi.org/10.3389/fenvs.2023.1277717
Introduction: The green GDP accounting system has become the focus of sustainable development, but a comprehensive accounting of environmental pollution cost and resource depletion cost has not yet been formed.
Methods: This study measures environmental pollution cost and resource loss cost, and establishes the green GDP accounting system based on the SEEA-2012. To analyze the environmental effects brought by the adoption of green GDP accounting system, a BP neural network model including green GDP, traditional GDP and global climate indicators is constructed to predict the global climate changes.
Results: The empirical results show that after the adoption of the green GDP accounting system, the global climate extreme weather can be reduced, the sea level will be lowered, and the climate problem is thus alleviated.
With the rapid growth and material accumulation of the global economy, the problem of environmental pollution has become a focus of the world, thus highlighting the importance of green development. However, the traditional Gross Domestic Product (GDP) accounting method can no longer meet the strategic requirements of sustainable development, which motivates the innovation of green GDP accounting approach (Wang et al., 2014).
As the core indicator of national economic accounting, GDP can well reflect the overall economic situation of a country or region. Nevertheless, the traditional GDP accounting simply sums up social wealth, ignoring the losses caused social factors such as the reduction of natural resources and environmental damage in the production process. Therefore, the traditional GDP accounting cannot reflect the benefits brought by the improvement of ecological and environmental quality (Stjepanović et al., 2017). In the economic activities of human beings for thousands of years, people have ignored the harm of environmental pollution, which has caused great damage and waste to environmental resources (Stjepanović et al., 2017). Therefore, the green GDP accounting system emerged. The concept of green GDP emerged in the early 1990s as a response to the imperfection of traditional GDP measures in considering specific types of economic costs that affect human wellbeing such as the environment. Green GDP considers the impact of natural resources and the natural environment on the output of an economy, thus reflecting the final result of economic activities in a country or region after considering natural resources and environmental factors (Lu et al., 2013).
Green GDP accounting implements the concept of sustainable development and people-oriented, and reflects the economic development and sustainable development capacity of a country or region (Aguilar-Rivera, 2020). Although there is a framework system for green GDP accounting (Chakraborty and Mukhopadhyay, 2014), there are few studies on the economic impact, internal theoretical mechanism and environmental improvement effect of the green GDP accounting system. The main contribution of this study to the literature is that we measure the environmental impact of the green GDP accounting system. Specifically, we calculate the green GDP of four countries based on System of Environmental-Economic Accounting 2012 (SEEA-2012), including the United States (U.S.), China, Switzerland and Africa. Then, the neural network model of green GDP, traditional GDP and global climate is constructed to compare the climate change of these three countries under the two accounting systems. Based on the prediction results, we find that economic development, pollutant emission reduction and environmental damage reduction should be carried out simultaneously for a sustained development. Meanwhile, focusing on energy conservation and emission reduction is more conducive to the sustainable development of the country.
This study is organized as follows. Section 2 reviews related literature. Section 3 introduces the accounting model of green GDP. Section 4 reports the data and model used to measure green GDP and evaluate the impact of green GDP accounting system on climate changes. Section 5 summarizes the results and makes sensitivity analysis. Section 6 concludes this study.
In 1993, the SEEA formally proposed the concept of green GDP, and SEEA2003 refers to the adjustment of resource consumption, environmental degradation and environmental protection expenditure of economic aggregate as green GDP accounting (Edens et al., 2022). In March 2021, the United Nations Statistical Commission (UNSC) formally adopted the SEEA-Economic Accounting. The accounting system of green GDP can be divided into green GDP1.0 stage and green GDP2.0 stage.
In the green GDP1.0 stage, the main feature of it is the subtraction of GDP, that is, environmental and ecological loss costs are deducted on the basis of current GDP. According to the literature, the green GDP1.0 accounting mainly has the following three calculation methods. The first one is from the flow adjustment perspective. Bartelmus (2001) propose that the cost of environmental and resource losses should be included in GDP to reflect the impact of economic development on the environment and resources. The second one is from the stock adjustment perspective. Pearce and Atkinson (1993) propose a sustainable development measurement method based on capital theory, i.e., the “weak sustainability indicator”. This approach considers natural capital as a form of capital and combines it with human and physical capital to calculate the total capital stock for sustainable development. The third one is from the input-output perspective. Chen and Gao (2007) propose an accounting method of green GDP based on the value of ecosystem services. They evaluate the ecosystem services involved in agricultural production in Ansai, and calculate the contribution value of agricultural production to ecosystem services, thus obtaining the green GDP of agricultural production in Ansai. Gatto et al. (2021) construct three new Energy Sector Development Indices from data collected from 38 oil-producing developing and transition economies between 1989 and 2019 to measure basic indicators of environmental pollution. In March 2015, China’s Ministry of Environmental Protection announced the resumption of green GDP, known as green GDP2.0 accounting. With the rapid economic growth in China, the concept of sustainability is deeply rooted in people’s hearts. The innovation of green GDP2.0 lies in the accounts for environmental costs environmental benefits. The widely recognized green GDP2.0 accounting adds one item and reduces three items on the basis of traditional GDP accounting, i.e., green GDP2.0 = traditional GDP - cost of environmental pollution loss - cost of natural resource consumption reduction - cost of environmental governance + benefit of resource and environment improvement (Yu et al., 2019). Wiedmann and Lenzen (2018) also propose a green GDP accounting method based on input-output analysis, i.e., the environmental and social footprints method. This method decomposes economic activities into different industries and valuates the environmental and social impacts of these industries. The value of green GDP is obtained through summing these impacts. The green GDP2.0 improves current green economic accounting system and is theoretically operable.
The research on the green GDP accounting system is relatively mature, and the green GDP accounting system is applied from different perspectives. For example, from the perspective of resource consumption, Pearce and Atkinson (1993) include the consumption of natural resources into GDP accounting and reflect the impact of natural resource consumption on the economy by calculating the economic depreciation value of natural resources. Based on the perspective of ecosystem, Costanza et al. (1997) calculate the value of ecosystem services to reflect the contribution of ecosystem to economy and GDP. There are also many studies based on the social perspective. For instance, Dasgupta and Maler. (2004) propose an economic model based on a non-convex ecosystem, taking into account the nonlinearity and uncertainty of ecosystem, to evaluate the impact of environmental quality on economic growth. Based on the measurement of sustainability and wealth, Arrow et al. (2012) incorporate the value of natural capital and human capital into the accounting of GDP, suggesting that green GDP is a beneficial supplement to the traditional national accounting system. The green GDP accounting also has important implications for the consumption decisions of environmentally friendly products, production decisions of environmental sensitive enterprises, government debt behavior, economic growth, etc. (see, for example Mammadli et al., 2021; Mammadli, 2022; Zeynalova and Namazova, 2022; Sadik-Zada et al., 2023).
According to the literature, the methods used for green GDP accounting are mainly divided into two categories. One is direct measurement, including production method and expenditure method. The production method refers to the total output obtained after deducting intermediate inputs from the output of various industrial sectors, except that the intermediate inputs used to calculate green GDP include both consumed economic assets and natural assets. The expenditure method adds the output value of natural resource consumption to the original accounting. Direct measurement is rarely used at present, and more studies focus on the indirect measurement. The indirect measurement method mainly refers to the addition of resources, environment, society and other indicators on the basis of traditional GDP measurement (Kunanuntakij et al., 2017). According to different accounting ideas, it can be divided into input-output method, emergy analysis method and cost accounting method. Many scholars construct the sustainable development index SDI based on emergy analysis to improve the accounting of green GDP, and calculate the sustainable development of cities, the green development of ecosystems, and the green economic growth of agriculture (e.g., Huang et al., 2006; Zhang et al., 2011; Li et al., 2021; Hu et al., 2022).
Cost accounting methods mainly include environmental pollution cost accounting and natural resource consumption reduction cost calculation. When calculating the cost of environmental pollution, it is mainly divided into air pollution degradation cost, water pollution degradation cost and solid waste land loss cost. At present, there are many studies on the degradation cost of water pollution and air pollution. The estimation of the cost of water environmental degradation includes two methods. The first is the evaluation method based on protection cost, which mainly includes two parts: the opportunity cost of pollution abatement and the reduction cost of eliminating or reducing pollutants. The second is the damage-based water environment degradation assessment method. This method usually adopts the classification calculation method to divide the water pollution loss into several sectors, such as industry, agriculture, fishery, tourism, municipal construction, household consumption and human health, etc. The loss value of each category is calculated and summed to obtain the final loss. The research on the cost of atmospheric environmental degradation mainly focuses on the economic loss of agricultural production reduction and the economic loss of residents’ health. Finally, the calculation of the cost of natural resource consumption is mainly based on the natural resource accounting model of minerals, land, forests and water resources. Natural resources are divided into renewable resources and non-renewable resources, and their consumption reduction cost accounting methods are different. In the literature, the replacement cost method is widely used to measure the consumption reduction cost of renewable resources, and the opportunity cost method or alternative cost method is used to calculate the consumption reduction cost of non-renewable resources.
With the development of artificial intelligence, neural network prediction methods have gradually gained attention. The BP neural network is one of the most representative neural networks, which focus on finding out the nonlinear relationship between various variables through in-depth research on historical data, and continuously adjust the weight of each unit in the network according to the deviation between the output and the expected value, so as to minimize the deviation of the whole network. The BP neural network has been widely used, e.g., to free cash flow prediction, financial risk prediction of enterprises, subway settlement monitoring (Han et al., 2021; Song et al., 2021; Xu and Zhao, 2022).
The research of BP neural network for monitoring environmental problems is still in its infancy. According to the literature, the BP neural network model can calibrate the detection data and has a high degree of accuracy after calibration. Therefore, based on the green GDP accounting system established on the basis of SEEA-2012, this study constructs the neural network model of green GDP, traditional GDP and global climate to explore the economic impact of the green GDP accounting system and its internal mechanism. We further verify whether the adopting of green GDP accounting is conducive to improve the environmental quality.
In this study, we adopt the idea that the green GDP accounting system refers to the accounting system that deducts the cost of natural resource consumption and environmental degradation control from the traditional GDP, which represents the net positive effect of national economic growth and more truly reflects the development status of a country’s green economy and people’s living standards (Kunanuntakij et al., 2017). The setting of the green GDP accounting system in this paper is based on SEEA (2012), which includes natural resources and environment in the accounting system, and establishes the accounting index of green GDP. SEEA accounting system is the product of the current System of National Accounts and sustainable development economic concept, and is the world’s first unified accounting standard for environmental economic system. This accounting system establishes a statistical database of natural resources and environmental indicators on the basis of maintaining the core structure of GDP accounting, which is used to evaluate the relationship among GDP, natural resources and environment, and calculates green GDP by constructing environmental degradation accounts and resource depletion accounts.
Based on the SEEA accounting system, the accounting equation of green GDP can be expressed as:
where
The cost of environmental degradation, also known as the cost of environmental pollution, refers to the value of environmental pollution loss and the cost of environmental protection, mainly including the cost of environmental degradation caused by air pollution, water pollution and soil pollution.
Current studies mainly use carbon emission costs to represent environmental costs, and ignore SO2 emission costs and environmental damage caused by water and solid pollution (Pearce and Atkinson, 1993). Therefore, we choose the air pollution account represented by carbon and SO2 emissions, the water pollution account represented by wastewater discharge, and the solid pollution account represented by solid waste discharge and solid waste storage to measure environmental pollution costs.
Resource depletion costs refer to the value of resources consumed in economic activities. Given the dependence of economic development on fossil energy and water resources, we select fossil energy consumption and water resources consumption to measure resource consumption costs as follows:
Environmental improvement cost refers to the positive economic benefits brought by using waste or improving environmental conditions, including the output value of comprehensive utilization of waste and the ecological benefits of gardens. However, some studies show that the environmental improvement cost has a small impact on the accounting of green GDP (e.g., Shen et al., 2017). Therefore, we adopt the accounting system as shown in Figure 1.
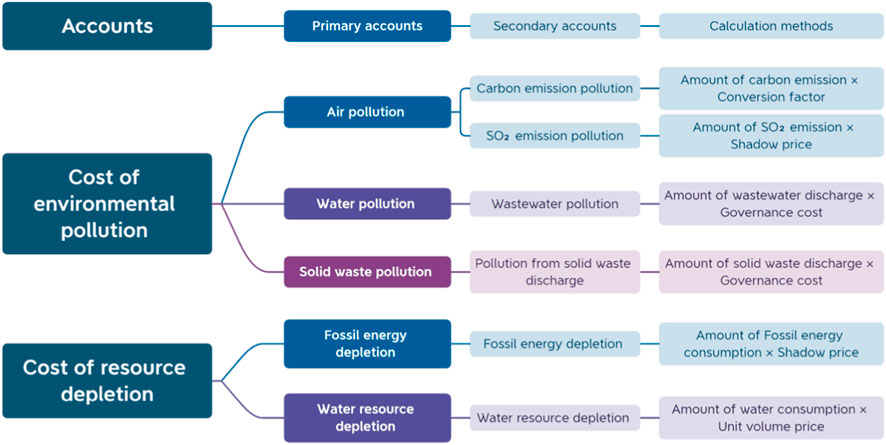
FIGURE 1. Green GDP accounting system.
The measurement of green GDP is processed as follows. Firstly, we measure the physical quantities of various environmental pollution and resource depletion according to industrial data. Then, we convert them into real values expressed in money. Finally, the environmental degradation cost and resource consumption cost are excluded from the traditional GDP to obtain the green GDP.
Environmental degradation cost mainly includes air pollution cost, water pollution cost and solid pollution cost, among which air pollution mainly includes CO2 pollution and SO2 pollution, and the calculation process of carbon emission pollution cost is as follows.
where
where
The cost of water pollution is mainly the cost of treatment caused by wastewater pollution, which is calculated as follows:
where
The cost of solid pollution mainly refers to the cost of treatment caused by solid pollutant discharge pollution, which is calculated by:
where
Resource depletion costs mainly include fossil energy consumption costs and water consumption costs, measured by the following two equations:
where
To measure the expected impact of the adoption of green GDP accounting system on climate mitigation, it is necessary to obtain the trends of temperature, precipitation and sea level height indicators before and after the switch from GDP accounting system to green GDP accounting system. This paper uses the BP neural network to train each country’s GDP, carbon dioxide emissions, sulfur oxide emissions, wastewater production and other six indicators to measure environmental pollution and resource consumption, and use the green GDP accounting system established in this paper to calculate the green GDP of each country. Then, the green GDP and the above indicators are put into the trained BP neural network model to predict the changes of climate indicators after the adoption of the green GDP accounting system.
Therefore, we collected GDP and six indicators measuring environmental pollution and resource consumption, including carbon dioxide emissions, sulfur oxide emissions, wastewater production, solid waste emissions, fossil energy consumption and water consumption from 58 countries. Meanwhile, global climate indicators are also collected. Data sources include but are not limited to the EU, the World Bank, the United Nations and other authoritative organizations or institutions, as shown in Table 1.
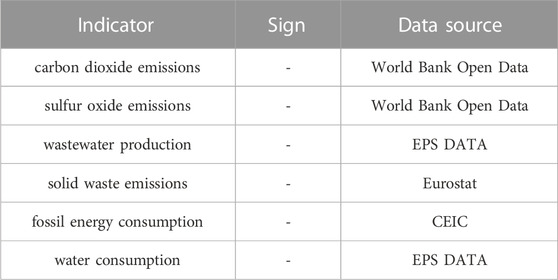
TABLE 1. Indicators of environmental pollution and resource consumption.
In using the BP network, to improve the convergence speed and accuracy of the model, we normalize the data using the range transformation method. For positive indicators such as GDP, they are normalized as follows:
For negative indicators such as carbon dioxide emissions and wastewater emissions, they are normalized as follows:
where
According to the standards of the International Meteorological Organization, the indicators to measure global climate change mainly include temperature change, precipitation change, greenhouse gas concentration change, sea level rise, ocean heat change and ocean acidification. Among them, the change of temperature and precipitation is often the most easily perceived and concerned by people, and the data of global average sea level rise are easy to obtain. Therefore, this paper chooses temperature, precipitation and global mean sea level height as indicators to measure climate change.
This paper studies four representative countries, including the world’s largest developed country, i.e., the United States (U.S.), the largest developing country, i.e., China, an old developed country praised as “a country without garbage pollution”, i.e., Switzerland, and a heavily polluting developing countries, i.e., Egypt. The U.S. is one of the largest economies in the world, and its economic situation and climate change have a global impact. China is one of the countries with the largest population and the fastest economic growth. Its economic situation and climate change also have a great impact on other countries. Additionally, China has a vast territory and diverse climate, which can exhibit representative impacts of climate change on economies. Egypt is a developing country with a high population growth rate and a relatively weak economic strength. Given its geographical location, climate and other factors, the economic and climate change situation in Egypt is quite different from other countries. These countries are located on four continents, i.e., North America, Asia, Europe, and Africa, and can to a certain extend provide a comprehensive understanding of the relationship between climate change and economic development.
BP algorithm is the most widely used learning method in feedforward neural network. BP neural network consists of input layer, hidden layer and output layer. The basic structure is shown in Figure 2.
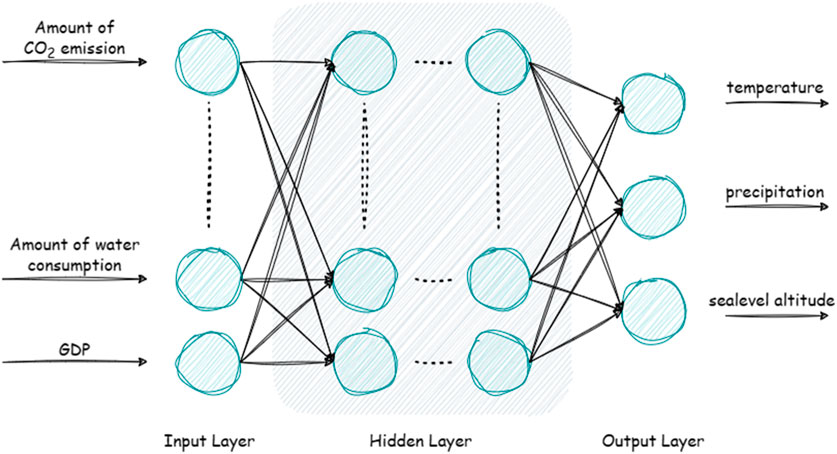
FIGURE 2. Schematic diagram of BP network topology.
The layers of the neural network are connected to each other, and the neurons in each layer are independent from each other. In the process of training with a large amount of data, if there is a large error in the prediction result, to improve the prediction accuracy of the model, the error is set to each level through the method of data signal back propagation to obtain the error signal of each unit, and the threshold and weight of the model are constantly adjusted. Therefore, the algorithm has the ability to self-regulate.
In this paper, three layers of BP neural network are used, including input layer, hidden layer and output layer. The input layer is a structure used to receive external signals. The number of neurons is set to be seven, corresponding to six input variables of the model and GDP. The output layer is the final prediction result. The number of neurons is set to be three, corresponding to the output of temperature, precipitation and sea level height. Generally, increasing the number of hidden layers can improve the accuracy of the system, but will complicate the structure and increase the workload. The number of hidden layers in this paper is three, and there is no unified method to determine the number of neurons in the hidden layer. The most commonly used method is to determine the number based on the following empirical formula combined with trial and error:
This paper selects four representative countries, i.e., China, the United States, Switzerland and Egypt, as research objects to analyze the climate change from 2011 to 2020. In recent years, the global average temperature has continued to rise significantly. However, there are prominent differences in the amount of precipitation in different regions. In some areas, rainfall events are very frequent and intense, resulting in frequent floods, heavy rains and other disasters, e.g., in Asian countries such as China and India, and some African countries. Nevertheless, in some other regions, such as Australia, the southwestern United States, and the Sahara Desert in Africa, precipitation has decreased, leading to increased drought problems. Such irregular precipitation patterns increase disaster risk and water management challenges.
First, we compare the changes in temperature and precipitation before and after replacing GDP with green GDP within selected countries, i.e., the U.S., China, Switzerland and Egypt, based on the BP neural network model. As shown in Figure 3, after using green GDP accounting system instead of traditional GDP accounting system, the fluctuation of average precipitation in the four countries has been greatly reduced. Meanwhile, the fluctuation of temperature has also been reduced to a certain extent. Therefore, the results generally indicate that after adopting the green GDP accounting system, the magnitude of climate change has been reduced, and the global climate extreme weather may be reduced. In addition, the surface temperature is generally reduced to a certain extent, thus indicating that replacing GDP with green GDP can promote climate mitigation. Therefore, green GDP accounting demonstrates the connotation of high-quality development and helps to fundamentally reverse the wrong direction of disruptive development.
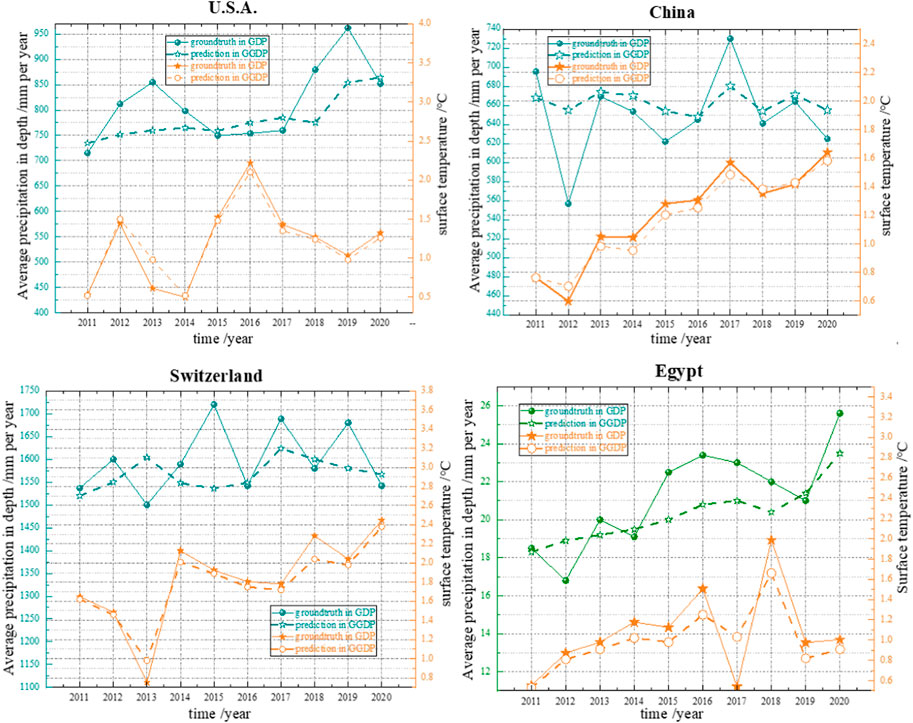
FIGURE 3. Temperature and precipitation change before and after the adoption of green GDP.
Comparing across different countries, we find that China and Egypt experience larger decreases in surface temperature than the U.S. and Switzerland. One possible reason is that after the adoption of green GDP instead of GDP accounting, the economic growth mode and development stage of different countries and regions may be differently affected, which then exhibits an impact on the surface temperature. The other reason is that industrial and agricultural production and life need to consume a lot of energy, water resources, land resources, human resources and material capital. In the process of economic development, it is inevitable to consume resources, produce economic value and bring negative environmental benefits, that is, to invest a lot of resources, obtain a certain economic growth after social production activities, and produce waste affecting the environment. China and Egypt are both developing countries, and their economic development mainly depends on heavy industry and manufacturing, which generate large emissions. The adoption of green GDP accounting system will promote more innovation and technological progress, which is conducive to reducing emissions and resource consumption. Therefore, a stronger reduction in surface temperature is found in these two countries. By contract, the U.S. and Switzerland have more developed and diversified economies that can better adapt to the changes caused by green GDP accounting. Also, these countries pay more attention to environmental protection than most developing countries, thus resulting to a relatively small impact on surface temperature.
In recent years, global warming has caused the surface of the ocean to rise continuously. Water expands as temperatures warm, and melting ice caps and glaciers on land further raise sea levels. We use data from the NOAA/NESDIS/STAR Satellite Altimetry Laboratory to analyze the impact of accounting system on ocean hydrological data represented by global mean sea level. They provide estimates of sea level rise based on measurements from satellite radar altimeters. TOPEX/Poseidon (T/P), Jason-1, Jason-2 and Jason-3 (which have been monitoring the same ground orbit since 1992) and most altimeters in operation since 1991 (including T/P, Jason.1, Jason.2, Jason-3, ERS-2, GFO and Envisat) plots and time series are available. Figure 4 displays the global mean sea level. Based on the BP neural network, we calculate the global mean sea level of the selected countries (China, the U.S., Switzerland and Egypt) after using green GDP instead of GDP during 2011 and 2022, and show the results in Figure 5.
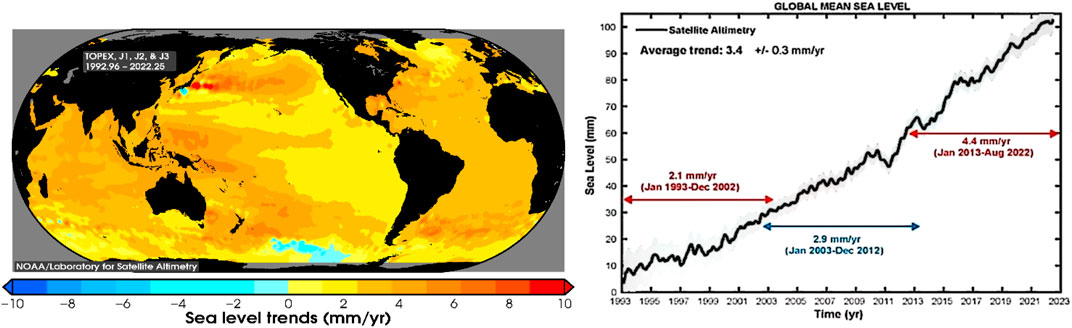
FIGURE 4. Comparisons between countries in impacts on lowering global sea level.
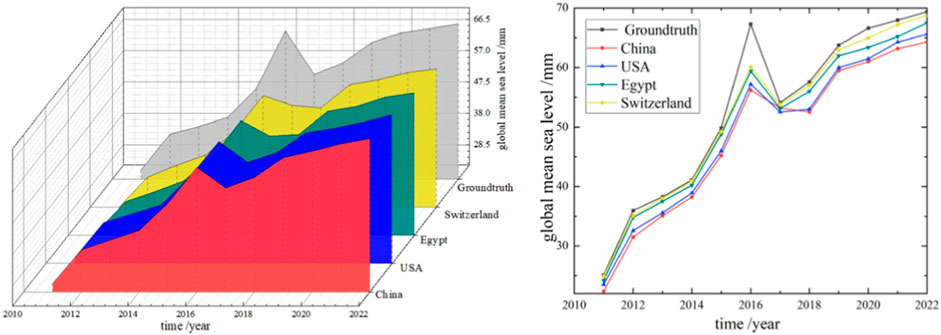
FIGURE 5. Comparisons between countries in impacts on lowering global sea level.
According to Figure 5, the global mean sea level can be reduced after using the green GDP accounting system to replace the traditional GDP accounting system in selected countries. China has the largest potential impact in lowering the global sea level, followed by the U.S., Egypt and Switzerland. Each country has different degrees of adaptation to the green GDP accounting system and progress in environmental protection and emission reduction, thus resulting to various impacts on lowering sea levels. According to the results, it can be speculated that the more positive actions a country has already taken on environmental protection, the smaller its impact on sea level. For a country with a large land area and a low level of economic development, the impact on the global climate after adopting green GDP instead of GDP would be substantial.
Overall, based on the empirical results, replacing the traditional GDP accounting system with the green GDP accounting system can help reduce the emission of pollutants and damage to the environment while developing the economy. On the one hand, adopting a green development system can help reduce global temperature and sea level height. At the same time, it helps to protect Marine biodiversity and prevent the destruction of Marine ecosystems. On the other hand, sustainable development is the inevitable choice of economic development, and resources are always limited and scarce. The green GDP accounting system is helpful to save resources and protect the environment. Therefore, focusing on energy conservation and emission reduction can promote the transformation and innovation of economic development mode, which is more conducive to the sustainable development of the country.
To ensure the robustness of our empirical results, we make corresponding sensitivity analysis. We use the BP neural network model developed in forecasting temperature and precipitation in the U.S. to make sensitivity analysis. Specifically, we reduce and increase the GDP in the U.S. by 5%, respectively, and put changed values into the BP neural network model developed in the empirical study. The forecast results of temperature and precipitation are shown in Figure 6.
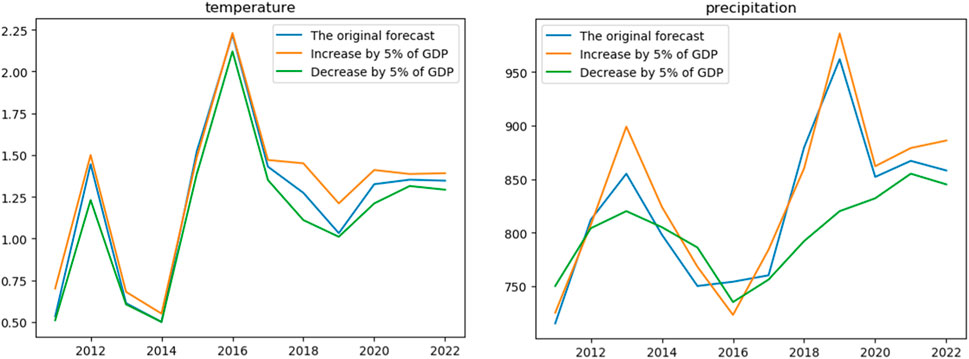
FIGURE 6. Sensitivity analysis (the U.S. as an example).
It can be seen from Figure 6 that when GDP changes by 5% (increase or decrease), both temperature and precipitation change to some extent. Nevertheless, the overall trend remains unchanged with a small deviation within an acceptable range, thus indicating that small changes in numerical values will not have a significant impact on the model results. Therefore, the empirical results are relatively robust.
This paper considers the economic impact of green GDP accounting system and explores whether it is conducive to improving environmental quality. We eliminate the cost of environmental degradation and resource consumption from the traditional GDP accounting system, and construct the green GDP accounting system. Based on the current GDP accounting system, we add air pollution account represented by carbon and sulfur dioxide emissions, water pollution account represented by wastewater emissions, and solid pollution account represented by solid waste emissions and solid waste storage. Based on the green GDP accounting system, we select four representative countries, i.e., China, the U.S., Switzerland and Egypt and build a global climate neural network model to measure the cost of environmental pollution and the cost of resource depletion. The BP neural network is further used to train the traditional GDP accounting and six indicators to measure environmental pollution and resource consumption. Finally, the BP neural network model of green GDP, traditional GDP and global climate is constructed to predict the changes of relevant climate indicators after using the green GDP accounting system.
We have two important findings. First, the green GDP measured in this paper considers costs of carbon dioxide emissions, sulfur oxide emissions, wastewater production and other indicators. After the adoption of the green GDP accounting system, the fluctuating of average precipitation is significantly reduced, thus indicating that the adoption of the green GDP accounting system may reduce extreme climate changes, which will alleviate the climate warming to a certain extent. Second, the adoption of a green GDP accounting system can help reduce global sea level height. Green GDP accounting helps to fundamentally reverse the direction of destructive development. For countries with low levels of economic development, if the green GDP accounting system is adopted instead of the traditional GDP accounting system, it will help them to balance economic and environmental benefits.
The findings in this study have some important implications. First, green GDP2.0 has returned to people’s vision, comprehensively and objectively reflecting the environmental cost of economic activities. The development of green GDP requires a unified supply and demand service platform for energy conservation and environmental protection, and focusing on promoting green and low-carbon development. Technological transformation and innovation should be encouraged to unleash new drivers of growth, and promote green and low-carbon integrated development of industries. Second, in the development of green economy, the government should effectively play the role of leading and controlling green development, accelerate the top-level design and institutional construction of green development, and guide and regulate the mode of production and way of life. Infrastructures for green development should be improved, and carbon emission exchanges and carbon taxes should be refined, to reduce the cost of carbon emissions. Third, currently, there is no standard system for green GDP accounting, so a unified accounting method should be developed to synchronize green GDP accounting with traditional GDP accounting. On this basis, a set of operable green accounting standards can be designed and formulated to provide data support for green GDP accounting and decision-making basis for green economic development. This study can be extended from many aspects. For example, follow-up studies can focus on the application of our green GDP accounting system in practice, and continue to explore how to effectively reduce environmental damage while promoting steady economic growth. Meanwhile, the impact of artificial polymers can be further considered in the green GDP accounting system. This can reflect the negative effects associated with the evaporation of artificial polymers and their return to earth, such as imbalance problems, radiation from polymers and asbestos, and resulting human diseases.
Publicly available datasets were analyzed in this study. This data can be found here: “World Bank Open Data, EPS DATA, Eurostat, CEIC, and EPS DATA”.
YZ: Investigation, Visualization, Writing–revision and editing. YX: Formal Analysis, Investigation, Visualization, Writing–original draft. YL: Conceptualization, Data curation, Formal Analysis, Methodology, Supervision, Writing–original draft.
The author(s) declare financial support was received for the research, authorship, and/or publication of this article. This work was supported by the National Natural Science Foundation of China (grant number 72203019).
The authors declare that the research was conducted in the absence of any commercial or financial relationships that could be construed as a potential conflict of interest.
All claims expressed in this article are solely those of the authors and do not necessarily represent those of their affiliated organizations, or those of the publisher, the editors and the reviewers. Any product that may be evaluated in this article, or claim that may be made by its manufacturer, is not guaranteed or endorsed by the publisher.
Aguilar-Rivera, N. (2020). “Green gross domestic product (Green GDP) and sustainable development,” in Reduced inequalities (Cham: Springer Nature Switzerland AG), 1–15.
Arrow, K. J., Dasgupta, P., Goulder, L. H., Mumford, K. J., and Oleson, K. (2012). Sustainability and the measurement of wealth. Environ. Dev. Econ. 17 (3), 317–353. doi:10.1017/s1355770x12000137
Bartelmus, P. (2001). Accounting for sustainability: greening the national accounts. Oxford: Eolss Publishers, 1721–1735.
Chakraborty, D., and Mukhopadhyay, K. (2014). Water pollution and abatement policy in India. Dordrecht: Springer Publication, 1–21.
Chen, Y., Gao, W., Huang, W. q., Xie, D. f., Jiang, S. y., and Wu, J. j. (2007). Green accounting for agriculture production based on the value of agroecosystem services: a case study of Ansai County. Acta Ecol. Sin. 27 (1), 250–252. doi:10.3321/j.issn:1000-0933.2007.01.030
Costanza, R., d'Arge, R., De Groot, R., Farber, S., Grasso, M., Hannon, B., et al. (1997). The value of the world's ecosystem services and natural capital. Nature 387 (6630), 253–260. doi:10.1038/387253a0
Dasgupta, P., and Mäler, K. G. (2004). The economics of non-convex ecosystems: introduction. Netherlands: Springer, 1–27.
Edens, B., Maes, J., Hein, L., Obst, C., Siikamaki, J., Schenau, S., et al. (2022). Establishing the SEEA ecosystem accounting as a global standard. Ecosyst. Serv. 54, 101413. doi:10.1016/j.ecoser.2022.101413
Gatto, A., Loewenstein, W., and Sadik-Zada, E. R. (2021). An extensive data set on energy, economy, environmental pollution and institutional quality in the petroleum-reliant developing and transition economies. Data Brief 35, 106766. doi:10.1016/j.dib.2021.106766
Han, J. X., Ma, M. Y., and Wang, K. (2021). RETRACTED ARTICLE: product modeling design based on genetic algorithm and BP neural network. Neural Comput. Appl. 33, 4111–4117. doi:10.1007/s00521-020-05604-0
Hu, J., Lyu, J., and Zhang, X. (2022). Evaluating agricultural sustainability and green GDP in China: an emergy analysis. Int. J. Environ. Res. Public Health 19 (24), 16735. doi:10.3390/ijerph192416735
Huang, S. L., Lee, C. L., and Chen, C. W. (2006). Socioeconomic metabolism in Taiwan: emergy synthesis versus material flow analysis. Resour. Conservation Recycl. 48 (2), 166–196. doi:10.1016/j.resconrec.2006.01.005
Kunanuntakij, K., Varabuntoonvit, V., Vorayos, N., Panjapornpon, C., and Mungcharoen, T. (2017). Thailand Green GDP assessment based on environmentally extended input-output model. J. Clean. Prod. 167, 970–977. doi:10.1016/j.jclepro.2017.02.106
Li, Z., Jin, M., and Cheng, J. (2021). Economic growth of green agriculture and its influencing factors in China: based on emergy theory and spatial econometric model. Environ. Dev. Sustain. 23, 15494–15512. doi:10.1007/s10668-021-01307-1
Lu, S. L., Lin, C. I., and Tai, S. H. (2013). “Improved grey forecasting model for Taiwan’s green GDP accounting,” in The 19th international conference on industrial engineering and engineering management: assistive technology of industrial engineering (Berlin Heidelberg: Springer), 1575–1584.
Mammadli, M. (2022). Environmentally responsible business approaches in Azerbaijan. Sustainability 14 (10), 6227. doi:10.3390/su14106227
Mammadli, M., Sadik-Zada, E., Gatto, A., and Huseynova, R. (2021). What drives public debt growth? a focus on natural resources, sustainability and development. Int. J. Energy Econ. Policy 11 (5), 614–621. doi:10.32479/ijeep.10901
Pearce, D. W., and Atkinson, G. D. (1993). Capital theory and the measurement of sustainable development: an indicator of “weak” sustainability. Ecol. Econ. 8 (2), 103–108. doi:10.1016/0921-8009(93)90039-9
Sadik-Zada, E. R., Gatto, A., and Mammadli, M. (2023). “Addressing the nexus between economic growth and environmental pollution in a small petroleum-exporting transition economy,” in Economic growth and environmental quality in a post-pandemic world: new directions in the econometrics of the environmental kuznets curve (London: Routledge).
Shen, X., Wang, G., and Huang, X. (2017). Green GDP accounting and spatio-temporal Pattern in China from 1997 to 2013. J. Nat. Resour. 32 (10), 1639–1650. doi:10.11849/zrzyxb.20160944
Song, S., Xiong, X., Wu, X., and Xue, Z. (2021). Modeling the SOFC by BP neural network algorithm. Int. J. Hydrogen Energy 46 (38), 20065–20077. doi:10.1016/j.ijhydene.2021.03.132
Stjepanović, S., Tomić, D., and Škare, M. (2017). A new approach to measuring green GDP: a cross-country analysis. Entrepreneursh. Sustain. issues 4, 574–590. doi:10.9770/jesi.2017.4.4(13)
Wang, W. X., He, E. J., and Zheng, X. L. (2014). Construction of green GDP accounting system. Adv. Mater. Res. 971, 2301–2304. doi:10.4028/www.scientific.net/amr.971-973.2301
Wiedmann, T., and Lenzen, M. (2018). Environmental and social footprints of international trade. Nat. Geosci. 11 (5), 314–321. doi:10.1038/s41561-018-0113-9
Xu, Y., and Zhao, J. (2022). Can sentiments on macroeconomic news explain stock returns? Evidence from social network data. Int. J. Finance Econ. 27 (2), 2073–2088. doi:10.1002/ijfe.2260
Yu, Y., Yu, M., Lin, L., Chen, J., Li, D., Zhang, W., et al. (2019). National green GDP assessment and prediction for China based on a CA-Markov land use simulation model. Sustainability 11 (3), 576. doi:10.3390/su11030576
Zeynalova, Z., and Namazova, N. (2022). Revealing consumer behavior toward green consumption. Sustainability 14 (10), 5806. doi:10.3390/su14105806
Keywords: GDP, GDP accounting system, BP neural network, carbon emission, climate changes, environmental effect
Citation: Zhu Y, Xu Y and Luo Y (2023) The green GDP accounting system based on the BP neural network: an environmental pollution perspective. Front. Environ. Sci. 11:1277717. doi: 10.3389/fenvs.2023.1277717
Received: 15 August 2023; Accepted: 24 October 2023;
Published: 10 November 2023.
Edited by:
Elkhan Richard Sadik-Zada, Ruhr University Bochum, GermanyReviewed by:
Yadulla Hasanli, Azerbaijan State University of Economics, AzerbaijanCopyright © 2023 Zhu, Xu and Luo. This is an open-access article distributed under the terms of the Creative Commons Attribution License (CC BY). The use, distribution or reproduction in other forums is permitted, provided the original author(s) and the copyright owner(s) are credited and that the original publication in this journal is cited, in accordance with accepted academic practice. No use, distribution or reproduction is permitted which does not comply with these terms.
*Correspondence: Yingying Xu, eHV5aW5nMTIyMUAxMjYuY29t
Disclaimer: All claims expressed in this article are solely those of the authors and do not necessarily represent those of their affiliated organizations, or those of the publisher, the editors and the reviewers. Any product that may be evaluated in this article or claim that may be made by its manufacturer is not guaranteed or endorsed by the publisher.
Research integrity at Frontiers
Learn more about the work of our research integrity team to safeguard the quality of each article we publish.