 Shuli Ying
 Qiquan Fang
95% of researchers rate our articles as excellent or good
Learn more about the work of our research integrity team to safeguard the quality of each article we publish.
Find out more
ORIGINAL RESEARCH article
Front. Environ. Sci. , 19 October 2023
Sec. Environmental Economics and Management
Volume 11 - 2023 | https://doi.org/10.3389/fenvs.2023.1276913
Introduction: Behind China’s booming economy lies a series of environmental and resource consumption issues. After continuous research and exploration, scholars generally agree that green innovation is a crucial way to solve this problem. As the core regions of China’s economic development, studying the green innovation level of the three major urban agglomerations can help understand China’s progress in this area. It can provide beneficial experience and inspiration for other urban agglomerations and the formulation of relevant policies in the future.
Methods: This paper selects the panel data of 40 cities in Beijing-Tianjin-Hebei (BTH), Yangtze River Delta (YRD), and Pearl River Delta (PRD) urban agglomerations from 2010 to 2020 as the research object. The super-efficiency SBM (slack-based measure) model and Malmquist-Luenberger (ML) index are used to measure the green innovation efficiency (GIE) and its dynamic evolution rules, and the Tobit regression model is constructed to analyze the influencing factors of GIE.
Results: The PRD urban agglomeration has the highest GIE level, while the GIE level in BTH and YRD shifted around 2015. Technical efficiency and technological progress together lead to increased GIE, with technological progress having a higher impact than technical efficiency. The regression coefficients of urbanization level, industrial structure, and science and technology level are 0.0078, 0.0071, and 0.0616, respectively, significantly promoting GIE. The coefficients of economic development level, foreign direct investment, environmental regulations, and SO2 emissions are −0.2198, −0.1163, −0.005, and −0.011, respectively, significantly inhibiting GIE. The coefficient of vegetation cover of 0.0228 has no significant effect on GIE.
Conclusions: The overall GIE of the three major urban agglomerations is relatively high. Still, there is spatial variability in GIE among different cities, accompanied by the phenomenon of two-level differentiation. The study suggests that improving GIE requires enhanced interventions at both the city level and the level of influencing factors. This study enriches the theoretical results on the meso-level of GIE and provides theoretical guidance and practical directions for promoting green innovation in urban agglomerations, achieving peaking carbon and carbon neutrality, and promoting green and high-quality development.
Since the reform and opening up, China has made fantastic progress in building its economy. In 2020, China’s GDP exceeded 100 trillion yuan for the first time, reaching 101.6 trillion yuan, a year-on-year growth of 2.3 percent, accounting for 17 percent of the global economy. Regarding international influence, China’s GDP accounted for 16.34 percent of the global total in 2019, placing it as the world’s second-largest economy after the United States (Guo and Li, 2021). China’s carbon emissions reached 9.429 billion tones in 2018, accounting for 27.8% of the world’s total carbon emissions. China faces dual challenges in emission reduction and environmental protection as one of the world’s largest carbon emitters. At the 75th session of the United Nations General Assembly, China proposed the goals of “peaking carbon by 2030”and “carbon neutrality by 2060”. To a certain extent, this calls for a comprehensive energy restructuring and upgrading of China’s economic development model. As the main focus of China’s coordinated regional development, urban agglomerations play a crucial role in promoting economic growth, technological innovation, and social development. BTH, the YRD, and the PRD represent the highest level and direction of urban agglomeration development in China and are the most mature and competitive urban agglomerations, which are the core areas of China’s economic growth. In 2019, the three major urban agglomerations accounted for only 5.18% of the country’s land area. Still, they carried 24.29% of the country’s population, contributed 44% of its GDP, and have become the key driving force and leader of China’s economic development. In 2018, their overall energy consumption accounted for 32.9% of the country’s total energy consumption (Hu et al., 2022). In recent years, rapid economic growth and accelerated industrialization and urbanization have positively impacted the economic development of the three major urban agglomerations. However, they are also facing some challenges. These challenges include insufficient innovative capacity, low resource utilization, high energy consumption, high polluting emissions, greenhouse gas emissions, and unbalanced urban development (Wang et al., 2020). While ensuring economic development, how to realize the efficient use of resources and energy conservation and emission reduction has become a hot topic in the current society. To solve the above problems, accelerating the transition to green development has an irresistible general trend. As a fusion point of innovation drive and green development, green innovation has become an effective means to break through resource and environmental constraints and promote sustainable development (Peng et al., 2021a). As the country’s focus on environmental issues increases. In 2015, the Fifth Plenary Session of the 18th Central Committee of the Communist Party of China put forward for the first time the five development concepts of “innovative, coordinated, green, open, and shared.” The introduction of the “Integrated Reform Plan for Promoting Ecological Progress” in the same year marked a solid step towards green development in China. At the 19th CPC National Congress, we further emphasized the establishment of a sound green, low-carbon, and recycling economic development system. The effectiveness of the implementation of these policies needs to be further studied.
As a critical region for coordinated development, the three major urban agglomerations need to implement policies better, summarize experiences, and explore ways to enhance the GIE to provide valuable expertise for subsequent reforms. Therefore, this paper selects the green innovation input-output panel data of 40 cities in the three major urban agglomerations from 2010 to 2020 to be analyzed. The research questions focus on three aspects: what is the current situation of green innovation in the three major urban agglomerations? What factors influence GIE, and in what direction and to what extent do these factors play a role? Based on the above research, how can we provide suggestions for formulating differentiated green innovation policies to improve GIE? To solve these problems, this study examines the GIE of the three urban agglomerations from both static and dynamic aspects by using the super-efficiency SBM model and the ML index method. It explores the role of the influencing factors on GIE by constructing the Tobit model. This study aims to enrich the research results on green innovation in urban agglomerations and provide a clearer picture of the development level of GIE in cities. It analyses the current status of policy implementation. It explores the direction and degree of influence of each influencing factor to provide a reference basis for the three major coastal urban agglomerations in China to formulate more targeted strategies for improving GIE and to make efforts to achieve the goal of sustainable development.
The research in this paper is as follows: Section 2 related literature review. Section 3 research design, including theoretical framework, formulation of research hypotheses, introduction of research methodology, and selection of indicators and data sources. Section 4 analyses the empirical results from both static and dynamic aspects. Section 5 analyses the direction and degree of influence of factors. Section 6 discusses the reasons for the results and the comparative analysis with the results of related scholars. Section 7 summarizes the conclusions of the paper and puts forward relevant recommendations.
Green innovation was first proposed by Fussler and James, (1996) in 1996. It is defined as a new product and process that brings value to social subjects while significantly reducing environmental pollution. Zeng et al., (2021) pointed out that GIE is stimulated by innovation inputs and outputs, which usually determine the level of green innovation in a region and reflect the capacity of green innovation. Therefore, constructing a scientific and reasonable indicator system is crucial for measuring GIE (Lee and Min, 2015). Existing research mainly selects human and capital as innovation input indicators. For example, the number of R&D personnel and internal expenditure on R&D funds are used as inputs for green innovation. The number of patents, gross domestic product, and revenue from new product sales indicate expected output. Liu et al., (2020), Yan et al., (2021), and Zhang et al., (2022) have chosen R&D personnel and internal expenditure of R&D funds as input indicators to measure the efficiency value. Xu and Zhou, (2021) evaluated the GIE of economic zones by considering inputs from three perspectives: human, capital, and energy.
Green innovation plays an essential role in improving the environment. Constructing a scientific evaluation index system is only part of accurately measuring GIE. What method can accurately measure the efficiency value? Once it becomes the focus of academic research. By combing the literature, we found that the significant GIE measurement methods are parameter-based stochastic frontier analysis and non-parameter-based data envelopment analysis (DEA). The DEA model does not require prior assumptions about the production cost function and can handle multiple inputs and outputs. It overcomes the limitations of SFA and is widely used. For example, He et al., (2023) used a three-stage DEA model to analyze the size of innovation productivity in China’s high-tech industries during the 13th Five-Year Plan period. However, the measurement of inefficiency in traditional DEA models only includes all inputs (outputs) shrinking (increasing) in equal proportions. The problem of variable slackness and radiality is ignored, leading to inaccurate measurements. To improve this problem, Tone, (2001) proposed a non-radial, non-oriented SBM model based on relaxation variables. The SBM model has been widely used in efficiency measurement in subsequent studies. For example, Miao et al., (2021) and (Li et al., 2023) have used the SBM method to measure the GIE of industrial firms in various provinces of China. To solve the inability of SBM to distinguish decision units with an efficiency value of 1, Tone, (2002) introduced the super-efficient SBM model based on previous research. For example, Yang, (2023) used the Super-SBM model to assess the energy efficiency of different provinces in China. Liu et al., (2023) measured the carbon emission efficiency in the YRD region using the Super-SBM model. In addition, Cui and Wang, (2023) used the same method to measure the green financial efficiency in China.
Research perspectives on green innovation have focused on the provincial level, manufacturing companies, and the Yangtze River Economic Belt. For example, Zhao et al., (2021) used the SBM method to measure the GIE of different provinces in China while introducing spatial econometric modeling into the convergence analysis. The study results found that China’s GIE is improving year by year, and regional differences are narrowing over time. Peng et al., (2021b) used the super-efficient SBM model and Malmquist index to assess the GIE of small and medium-sized science and technology enterprises in Hebei Province. It aimed to provide reference opinions for enhancing enterprises’ eco-competitiveness and sustainable development ability. Long et al., (2020) used the super-efficient SBM model to measure the GIE of the Yangtze River Economic Belt. They analyzed its influencing factors, clarified each factor’s direction and degree of influence, and proposed relevant suggestions. It has a guiding significance for the high-quality green development of cities in the Yangtze River Economic Belt.
After fully understanding the current state of green innovation, scholars realized the need to explore further the factors that influence it. What is the direction and extent of each factor? So that we can make targeted recommendations for enhancing GIE. For example, Wang et al., (2023) used the Tobit model to analyze the impact of fiscal decentralization on regional green innovation. Zhao et al., (2022) used the Tobit model to explore how five factors, including green finance and the level of foreign capital utilization, affect the GIE of three major regions in China. Zhou and Shao, (2023) used the Tobit model to analyze the factors influencing GIE in 30 provinces in China.
In summary, academics have researched the efficiency of urban green innovation and achieved some results. However, the following problems still need to be studied in depth. Firstly, fewer studies incorporate capital stock into green innovation input indicators. In selecting input indicators, most existing studies only consider innovation input from the number of R&D personnel and internal expenditure of R&D funds and neglect to pay attention to the indicators of innovation stock. Secondly, most existing literature on GIE focuses on static analyses, with fewer explorations of the dynamic evolutionary characteristics between different points in time. Researchers have yet to find a DEA model that considers undesired output, super-efficiency, and dynamics simultaneously. Finally, the perspectives of existing studies mainly focus on the provincial level, manufacturing enterprises, the Yangtze River Economic Belt, etc., and few studies focus on the urban agglomeration level, with insufficient exemplary and instructive results at the meso-level.
The main contributions of this paper compared to previous studies are at the following levels. Firstly, the level of indicator selection: capital stock indicators are considered in innovation inputs, which makes up for the shortcomings of existing research that ignores the sustainability and inheritability characteristics of green innovation resources. Secondly, the level of research methodology: not only considering the unexpected outputs but also innovatively combining the unexpected super-efficiency SBM model and the ML index model to analyze the GIE of 40 cities in the three major urban agglomerations statically and dynamically. Finally, the level of research perspective: our study focuses on the three major urban agglomerations along the coast of China. It refines the research unit to the 40 prefecture-level cities of the three major urban agglomerations, with the expectation of broadening the study’s perspective and offering a valuable supplement to enrich existing theoretical research. The main contributions of this paper are threefold: firstly, it theoretically broadens the research perspective of GIE. Secondly, based on the existing input indicators, we consider the capital stock indicators and use dynamic and static methods to analyze the current situation of green innovation comprehensively. At the same time, we explore the multiple influencing factors of green innovation, which helps us to deeply understand the effect of green innovation in the three major urban agglomerations and the related influencing mechanisms. Finally, the recommendations for different urban agglomerations can provide a reference for other urban agglomerations or developing countries to decide on green innovation in actual implementation.
Green innovation is a mutually reinforcing circular system (Peng et al., 2021c) that integrates green development and innovation. Promoting green growth involves reducing environmental damage and resource consumption in the production process through technological progress and other means. In turn, green development demand prompts continuous science and technology innovation. The theoretical framework of green innovation consists of two levels: the background factor and the core level of green innovation. Underlying factors include economic, technological, institutional, and natural factors, which act synergistically to form the basis of green innovation. Specifically, the natural factor provides vital natural resources, the economic factor provides basic support for green innovation, the technological factor provides innovative means for green innovation, and the institutional factor provides policy guidance for green innovation. Green innovation generates benefits through technological innovation, including reduced resource use and increased waste reuse, thereby reducing the consumption of natural factors. Green innovation not only promotes green economic growth but also increases the competitiveness of green technologies. In addition, green innovation can contribute to a high level of institutional factors, thus helping firms to engage in innovative activities. Ultimately, social development will be of higher quality and optimized under the guidance of green innovation. The framework diagram is shown in Figure 1.
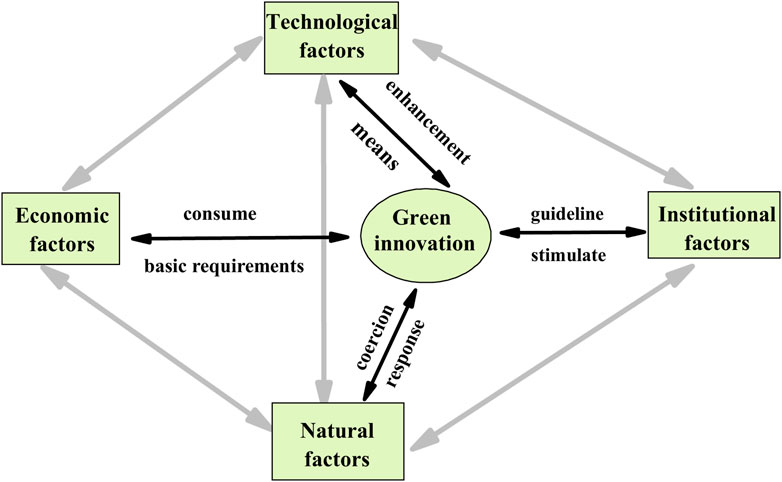
FIGURE 1. Theoretical framework diagram for green innovation efficiency.
Drawing on previous studies, we selected eight indicators in four dimensions: economic, technological, institutional, and natural factors, and analyzed hypotheses about the direction of their expected impact on green innovation.
Generally, people believe that as economic development increases, it is more likely to attract funds to support local green technological innovations and the activities of high-end innovative talents, thus promoting the accumulation of green innovations (Shengrong and Liangwen, 2019). According to the Kuznets curve, as the standard of living rises, people’s concern for environmental protection and sustainability increases (Dinda, 2004), thus changing their consumption habits. Usually, improving living standards is accompanied by better education and information access, which can increase the public’s environmental awareness and thus promote green innovation. In this paper, we select per capita GDP as an indicator for evaluating the economic development of urban agglomerations. Based on this, we propose the following research hypotheses.
H1. Economic development level positively contributes to GIE.
Industrial structure refers to the proportion of primary, secondary, and tertiary industries in the gross regional product. An increase in the ratio of the tertiary industry and a decrease in the proportion of the secondary sector will reduce the pressure of energy consumption and environmental pollution while improving the GIE (Cheng et al., 2019). This paper selects the proportion of tertiary industry in GDP as an indicator for evaluating industrial structure. Based on this, we propose the following research hypotheses.
H2. Industrial structure positively contributes to GIE.
The increase in urbanization level will promote the aggregation of population and resources, thus forming a certain scale effect (Clark, 2013). The advancement of urbanization makes more people receive education, which is conducive to cultivating high-level talents for the green innovation system (Fan et al., 2017). Some scholars have also pointed out that urban agglomerations are experiencing the rapid development stage of new urbanization, which may positively or negatively impact green innovation (Ma et al., 2022). In this paper, the urbanization rate is selected as an indicator to evaluate the urbanization level. Based on this, we propose the following two different research hypotheses.
H3a. Urbanization level positively contributes to the GIE.
H3b. Urbanization level negatively inhibits the GIE.
“The Pollution Paradise Hypothesis” states that developed countries tend to relocate high-energy-consuming and high-polluting industries to developing countries, which may lead to lower efficiency in green innovation in developing countries (Yue et al., 2016). However, some scholars have pointed out that introducing foreign capital has strengthened the competition among enterprises, which helps enterprises carry out innovative research and improve technological efficiency. In this paper, we choose the share of real foreign investment in GDP to measure the degree of openness of each city to the outside world. Based on this, we propose the following two different research hypotheses.
H4a. Foreign direct investment positively contributes to GIE.
H4b. Foreign direct investment utilization negatively inhibits GIE.
Government spending on science and technology is critical in supporting green innovation. While businesses are the main drivers of green innovation, practice shows that governments can address issues such as lack of funding for research and development and pollution that the corporations cannot solve. In this paper, we select each city’s science and technology expenditure to measure the science and technology level. Based on this, we put forward the following research hypotheses.
H5. Science and technology level positively contributes to the GIE.
Suitable environmental regulations can help enhance resource use efficiency and encourage firms to innovate technologically (Porter and van der Linde, 1995). However, research by Slater and Angel, (2000) suggests that environmental regulations may cause firms to face higher costs, which may inhibit the development of green innovation. In this paper, we transform the integrated solid waste utilization rate, the rate of non-hazardous waste disposal, and the rate of centralized sewage treatment into a composite indicator of environmental regulation by applying the entropy power method. Based on this, we propose the following two different research hypotheses.
H6a. Environmental regulation positively contributes to GIE.
H6b. Environmental regulation negatively inhibits the GIE.
SO2 is considered one of the significant sources of air pollution, which causes acid rain, deteriorates air quality, and harms natural ecosystems. This pollution adversely affects GIE. In this paper, we select urban industrial SO2 emissions to measure the level of SO2 emissions in each city. Based on this, we propose the following research hypotheses.
H7. SO2 emissions negatively inhibit GIE.
Areas with high vegetation cover usually have more ecosystem services and pay more attention to ecological sustainability, which indicates that the government and enterprises have more awareness of green development and are conducive to promoting the GIE. In this paper, we select the green coverage rate of urban built-up areas to measure the vegetation coverage rate of each city. Based on this, we put forward the following research hypotheses.
H8. Vegetation cover positively contributes to GIE.
In the DEA model, the data envelope replaces the traditional production function. Mathematical planning methods are used to measure the relative productivity of decision-making units to determine whether they are located on the “frontier” of the production set. Unexpected super-efficiency SBM modeling allows for effective decision-making unit comparisons and takes into account the fact that cities generate unexpected outputs such as “three wastes” during the innovation process. Making measurement outcomes more closely aligned with the nature of green innovation. However, Tone does not give a computational formula for the super-efficient SBM model that includes unexpected outputs. So in this paper, referring to the study of Xu et al., (2022), we construct the super-efficient SBM model that includes unexpected outputs:
It satisfies the following constraints:
where:
The theoretical basis of the ML index is the environmental technical feasibility set and the directional distance function (Chambers et al., 1996). Compared with the traditional Malmquist index, the ML index can measure not only the expected output that is beneficial to socioeconomic development, but also the unexpected output due to environmental pollution and resource constraint (Wu and Dong, 2015). The basic idea of the ML index calculation is as follows: firstly, the production frontier of the model under environmental constraints is constructed by DEA method. Secondly, the distance between each decision unit and the production frontier surface is calculated by using the directional distance function. Finally, based on the directional distance function and the mixed directional distance function, the ML index is calculated in two periods.
Assuming that the input-output of the
In the equation:
The range of values for the ML index is generally between 0 and infinity. ML greater than 1 indicates an improvement in total factor productivity; ML less than 1 indicates a decline in total factor productivity; ML equals 1 indicates no change in total factor productivity. EC refers to the comparison between the actual input quantity in period
The Tobit model was proposed by James, (1958) in 1958. It is mainly used to solve statistical analysis problems in the presence of truncated data. Since the efficiency values measured by the super-efficient SBM model in this paper are limited to 0 to 2, they belong to the “restricted dependent variable.” The regression results may have severe bias and inconsistency if the OLS method is used. According to the related knowledge, the Tobit model can fully consider the imperfection of the truncated data and can well capture the real distributional characteristics behind the data. Therefore, the Tobit model is widely used by scholars in dealing with the regression problem of “restricted dependent variable” (Guo et al., 2020). Thus, this paper constructs the Tobit model to investigate the influencing factors of GIE. The model equations are as follows: The model equations are as follows:
In the equation:
From an economic point of view, the essential elements of certain production activities are labor and capital. Innovation activity is a complex process with the participation of multiple subjects and the interaction of various factors. Green innovation should promote innovation output growth with economic benefits, reduce pollution, and realize the unity of creation and green. Given this, this paper’s indicators for measuring GIE include three main categories: inputs, expected outputs, and unexpected outputs. The selection of input indicators draws on a study by Liao and Li, (2022) that included labor, capital, and energy: The number of R&D personnel in industrial enterprises is chosen to characterize the labor force. Industrial enterprises’ R&D internal expenditure and fixed capital stock are used to indicate capital input. Drawing on Chen et al., (2018), we use the perpetual inventory method to account for the capital stock in each city of the three major urban agglomerations while deflating R&D internal expenditures to constant 2010 prices. Borrowing from Yang et al., (2022). We chose the electricity consumption indicator to characterize the energy input of the whole society. The expected output is considered from 3 aspects: economic, technical, and environmental. Referring to the studies of Yang et al., (2022) and Zhang et al., (2021), the following indicators were selected: Economic output is measured by the GDP of each city and deflated by the GDP deflator using 2010 as the base period. Technological output is measured by the number of patents granted. The green coverage of built-up areas in each city measured environmental output. The unexpected outputs mainly examine the negative environmental impact, measured by industrial wastewater emissions, industrial SO2 emissions, and volume of industrial soot (dust) emissions (Liu et al., 2021). The input-output indicator system of GIE in the three major urban agglomerations and the descriptive statistics of each indicator are shown in Table 1.
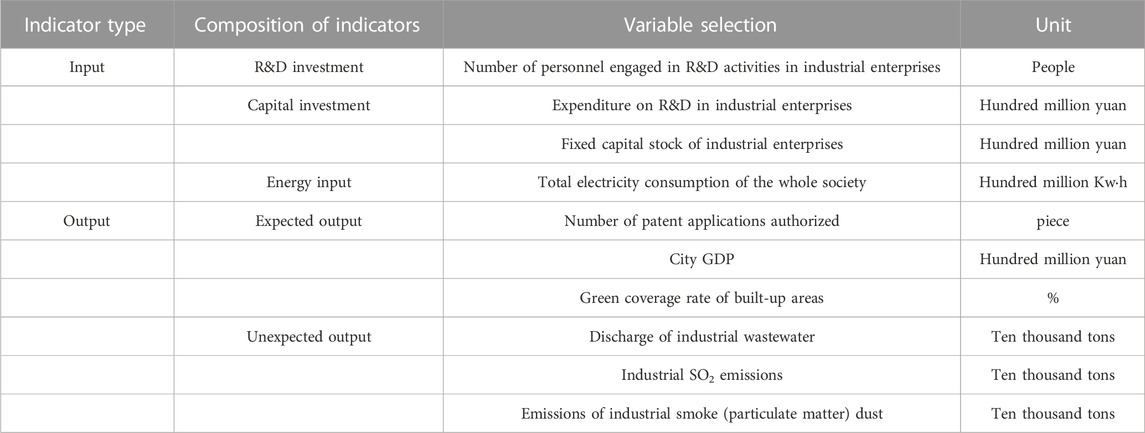
TABLE 1. GIE evaluation index system.
Drawing on previous studies and considering data availability and accuracy, we selected eight influencing factors, and the hypotheses on the direction of the influence of each influencing factor on the GIE have been made in the previous section. The treatment of indicators is shown in Table 2.
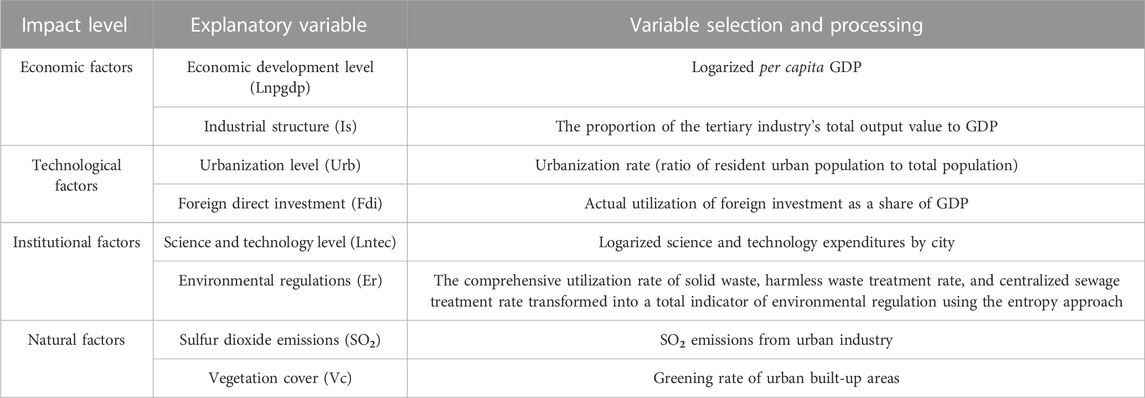
TABLE 2. Selection and treatment of explanatory variables for Tobit models.
In this paper, we selected the BTH, YRD, and PRD urban agglomerations as the research subjects. Based on the scope of the division of urban agglomerations by the State Council, in the process of data collection, we found that some cities, such as Wenzhou, Jinhua, Wuxi, Yancheng, Taizhou, Hengshui, Chizhou, Zhoushan, etc., had excessive missing data on the R&D indicators of industrial enterprises above the scale. Shenzhen showed abnormal results in the calculation of efficiency values. To ensure the accuracy of the research results, we decided to exclude these cities. For the study, we selected forty representative cities in the three major urban agglomerations. In response to environmental issues, the 12th and 13th Five-Year Plan have introduced a series of policy measures to support green innovation and sustainable development. We need to study the effects of the five development concepts of “innovation, coordination, greenness, openness, and sharing,” which were first proposed in 2015, both before and after the reform. Therefore, we take 2015 as the center, go back 5 years, and extend back 5 years, which is a long enough period of 11 years to capture the trends and changes in GIE in the long term. In 2020, China proposes to achieve carbon peaking by 2030 and carbon neutrality by 2060, goals that make clear China’s commitment to climate change and sustainable development. Studying the data from 2010 to 2020 can help provide some input for realizing this commitment. Therefore, this paper takes 2010 as the study’s starting point, and the period is 2010–2020. Table 3 shows the scope of the studied cities.
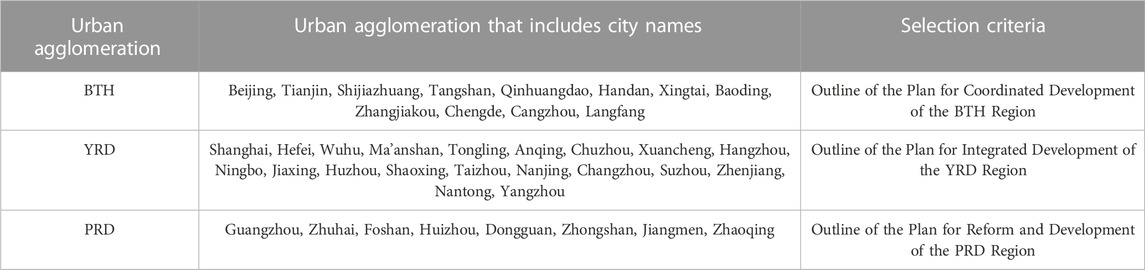
TABLE 3. Selection of cities and basis for selection.
Considering the data’s availability and accuracy, the data for various input-output indicators of the super-efficiency SBM model are sourced from the “China City Statistical Yearbook,” “China Statistical Yearbook,” provincial statistical yearbooks, and report on China’s national economic and social development. As for the variables in the Tobit regression model, the GIE is calculated in this study. The per capita GDP, the proportion of the tertiary industry, foreign direct investment, GDP, scientific and technological expenditure, the total utilization rate of solid waste, the harmless treatment rate of garbage, and the centralized treatment rate of wastewater are obtained from the “China City Statistical Yearbook.” For data not disclosed in the city statistical yearbooks, information is gathered from provincial statistical yearbooks and statistical bulletins. The urbanization rate indicators for each city are obtained from the Wind database and statistical bulletins. In the case of missing data, interpolation methods and mean imputation are applied based on the actual circumstances to calculate the missing values.
According to the unexpected super-efficiency SBM model and GIE evaluation index system, we use Matlab software to measure the GIE of sample cities from 2010 to 2020, and the results are shown in Table 4.
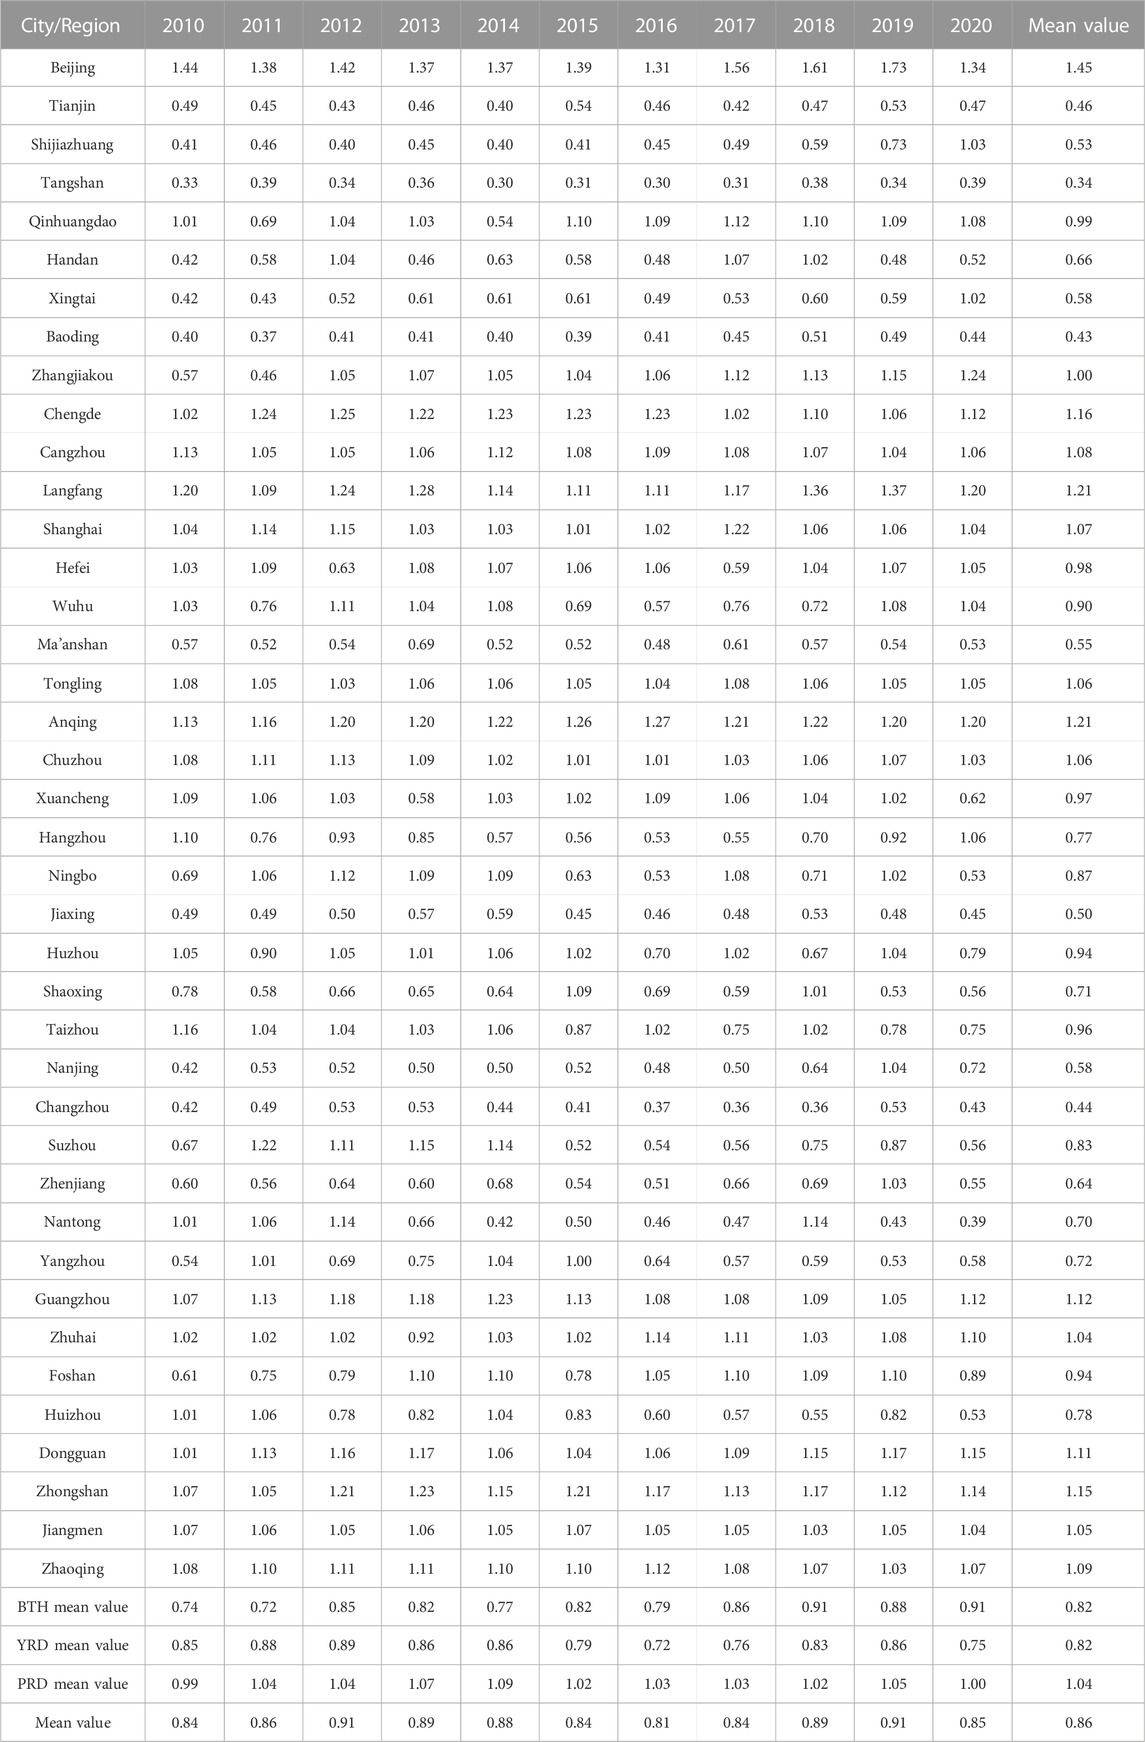
TABLE 4. The results of GIE measurement for various cities from 2010 to 2020.
To facilitate a comparison of the trends of GIE in the three major urban agglomerations and the differences between regions. In this paper, the trend graphs are presented according to four sections, namely, the three major urban agglomerations as a whole, the BTH urban agglomeration, the YRD urban agglomeration, and the PRD urban agglomeration, respectively, as shown in Figure 2. Except for 2020, which is affected by the epidemic, the overall GIE rose from 0.84 in 2010 to 0.91 in 2019, an improvement of 7%. It shows a stable growth trend, a positive environment for green innovation, and steady progress in green innovation capacity. Due to variations in economic and technological levels among different cities, there are evident inter-cluster and intra-cluster differences in GIE within each urban cluster. Based on the trend, we can divide it into two phases. In 2010–2015, the PRD urban agglomeration had the highest level of GIE, followed by the YRD and BTH. In 2015–2020, the PRD urban agglomeration remained in the lead, followed by the BTH and YRD. The efficiency value of the PRD urban agglomeration has been at a high level, ranging from 0.99 to 1.09, with an average growth rate of 1%. The growth has been relatively slow, and the changes in the GIE of the cities in the cluster have also been relatively small. Generally, the PRD region is driven by policies such as the “12th Five-Year Plan for Green Manufacturing Technology Development” and green finance from 2010 to 2020. The PRD region has actively promoted the innovation development strategy and stepped up green innovation. They formed a new industrial development model with green innovation as the main driving force. The GIE of the BTH urban agglomeration was 0.74 in 2010 and reached 0.91 in 2020, with an average growth rate of 1.7%. The most significant growth rate compared to other urban agglomerations. This indicates that green innovation resources in the BTH urban agglomeration were appropriately allocated and utilized during the study period. The GIE of the YRD urban agglomeration fluctuates between 0.72 and 0.89, which is at a low level. The GIE values for 2011–2014 show an increasing trend compared to 2010. The YRD region promoted rationalization of industrial structure in 2015–2016, possibly due to the impact of supply-side structural reforms, and the region is in an experimental stage, leading to a slight decline in GIE. The effect of the reforms was evident by 2017, with the GIE in the YRD region improving. Each city increased development efforts in 2017–2019 to steadily grow GIE. In 2020, the GIE of the YRD urban agglomeration was significantly reduced compared to the BTH and PRD urban agglomerations due to the epidemic’s impact. The possible reason is that the YRD urban agglomeration is relatively backward in industry. Its green innovation level is more vulnerable to the effects of the external environment.
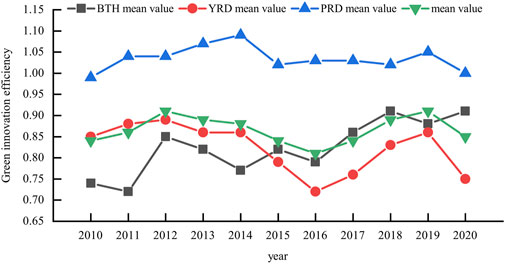
FIGURE 2. Trend chart of GIE for three major urban agglomerations from 2010 to 2020.
To further analyze the dynamic evolution of GIE over time in the three major urban agglomerations. ML index and its decomposition of technical efficiency change index (EC) and technology progress index (TC) were measured, and the intrinsic relationship between them is ML = EC* TC. Tables 5, 6 show the ML index of GIE and its decomposition for 40 cities in the three major urban agglomerations and each urban agglomeration from 2010 to 2020, respectively.
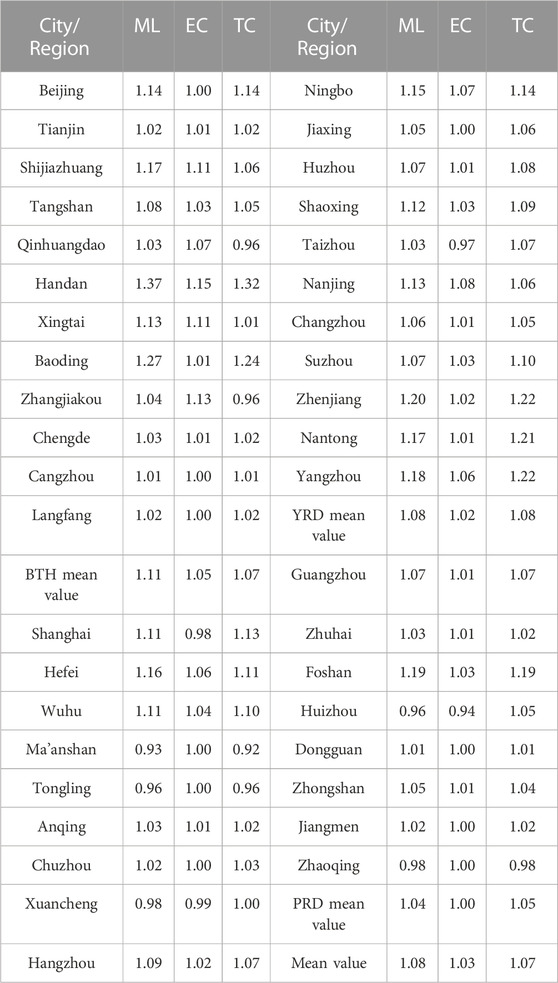
TABLE 5. ML index and its decomposition of annual average GIE for 40 cities in the three major urban agglomerations from 2010 to 2020.
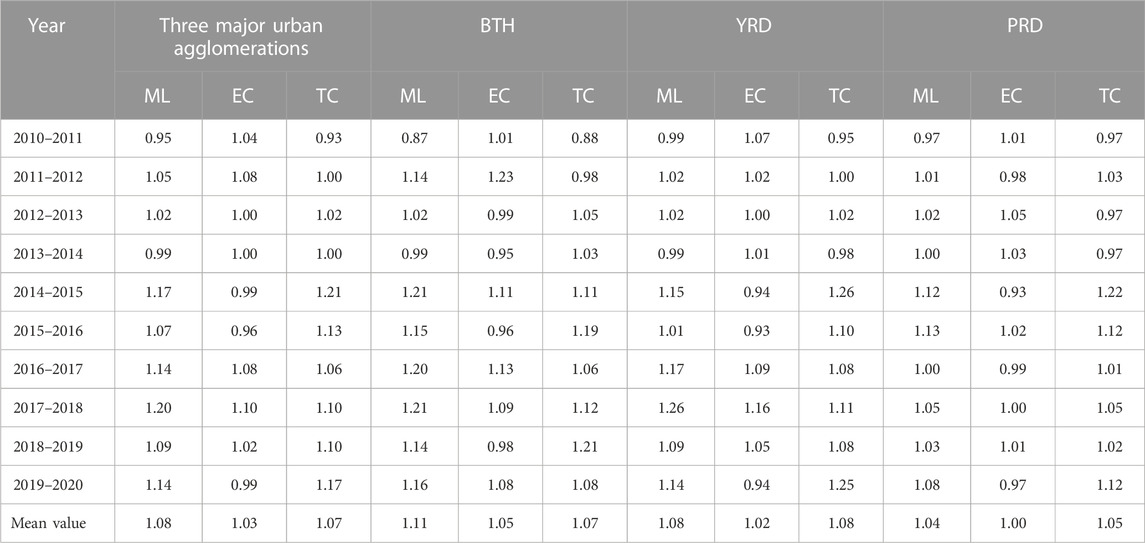
TABLE 6. ML index and its decomposition of GIE for various urban agglomerations from 2010 to 2020.
As seen from Table 6, the GIE of the three major urban agglomerations in 2010–2020 is greater than 1 in the ML index in all years except for 2010–2011 and 2013–2014, and the average value is 1.08. Indicates that the overall GIE of the three major urban agglomerations is developing well, with an average annual growth rate of 8 percent. The further decomposition of the ML index yields an average growth rate of 7% for the TC index and 3% for the EC index. Technological progress and technical efficiency together lead to an increase in GIE, and technological progress has a greater impact than technical efficiency. Its convergence with the movement of the ML index is also higher, as shown in Figure 3.
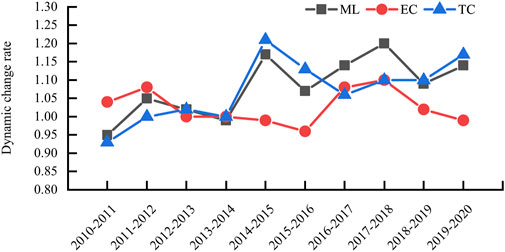
FIGURE 3. Decomposition of the ML index of overall GIE of the three major urban agglomerations from 2010 to 2020.
In terms of urban agglomerations, the ML indexes of GIE in the BTH, YRD, and PRD regions are 1.11, 1.08, and 1.04, respectively, for 2010–2020. They are showing a pattern of BTH being larger than the YRD and the YRD being more extensive than the PRD. Indicates that BTH has the fastest growth rate in GIE, followed by the YRD and the PRD. As shown by the EC and TC indices of each urban agglomeration, technological progress contributes the most to improving GIE in urban agglomerations, and the contribution of technical efficiency is relatively small. After 2014–2015, the ML and TC indices are greater than 1 for all urban agglomerations, but there are cases where the EC index is less than 1, indicating a regression in technical efficiency. There is no effective balance between resource endowment and utilization of technological research and development in each urban agglomeration (Li et al., 2016), and there is a situation in which technical efficiency lags behind technological progress. For example, the YRD and PRD in 2014–2015 and 2019–2020, and BTH in 2015–2016 and 2018–2019. The changes in the EC and TC indices for urban agglomerations in these years differ by more than 10%. Suppose urban agglomerations do not consider technical efficiency and enhance the GIE purely through technological progress. In that case, it will be more costly, and the effect will be short-lived. The ML index and its decomposed EC and TC indices are shown in Figures 4–6 for a more precise depiction of the dynamic efficiency trends. Figure 4 shows that the EC index of the BTH urban agglomeration shows a stable and fluctuating trend, and the TC index and ML index show a fluctuating and increasing movement. From Figures 5, 6, it can be seen that the convergence of TC and ML indices is higher in the YRD and PRD urban agglomerations.
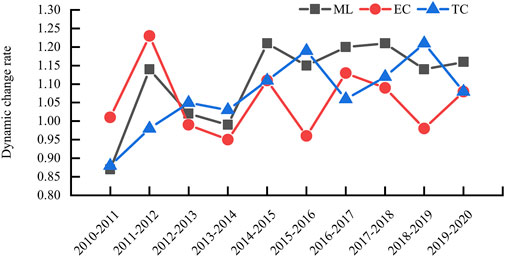
FIGURE 4. Decomposition of ML index of GIE in BTH urban agglomeration from 2010 to 2020.
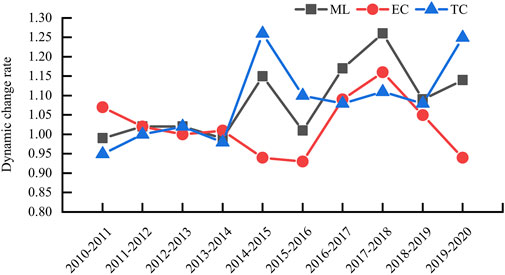
FIGURE 5. Decomposition of ML index of GIE in YRD urban agglomeration from 2010 to 2020.
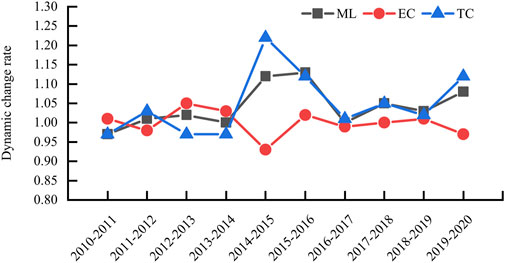
FIGURE 6. Decomposition of ML index of GIE in PRD urban agglomeration from 2010 to 2020.
As shown in Table 5, 35 of the 40 cities have an annual average ML index greater than 1, indicating that most cities have made different progress in GIE. Figure 7 shows that the greater progress is mainly located in the BTH region, and the efficiency values of the cities in the PRD region have not risen much. While Qinhuangdao, Zhangjiakou, Shanghai, and Taizhou ML indexes are all greater than 1, GIE is increasing. However, the TC indexes of Qinhuangdao and Zhangjiakou are less than one, and the EC indexes of Shanghai and Taizhou are less than one. During the study period, the ML indexes of Maanshan, Tongling, Xuancheng, Huizhou, and Zhaoqing were all less than 1, and the dynamic GIE showed a decreasing trend. To investigate the reasons for this, we find that the EC index of Maanshan is one, and the TC index is 0.92. The decline in the dynamic GIE is mainly affected by technological progress. The EC indexes of Xuancheng and Huizhou are 0.99 and 0.94, respectively, and the TC indexes are 1 and 1.05, respectively. The decline in the dynamic of GIE is mainly affected by technical efficiency. The EC index of Tongling and Zhaoqing are both 0.99, and the TC index is 0.96 and 0.98, respectively. The decline in the dynamic of GIE is affected by both technical efficiency and technology progress. Based on the above analysis, we believe that Qinhuangdao, Zhangjiakou, and Maanshan regions suffer from insufficient learning of new green innovation technologies and losing innovative talents. Shanghai, Taizhou, Xuancheng, and Huizhou have problems with irrational resource allocation and weak technological innovation. Tongling and Zhaoqing have technical efficiency and technology progress problems, and the issues of technology progress are more prominent. As a result, the region has a downward trend in GIE. The existence of diminishing marginal efficiency in certain cities in the YRD and PRD is further demonstrated by the ML index.
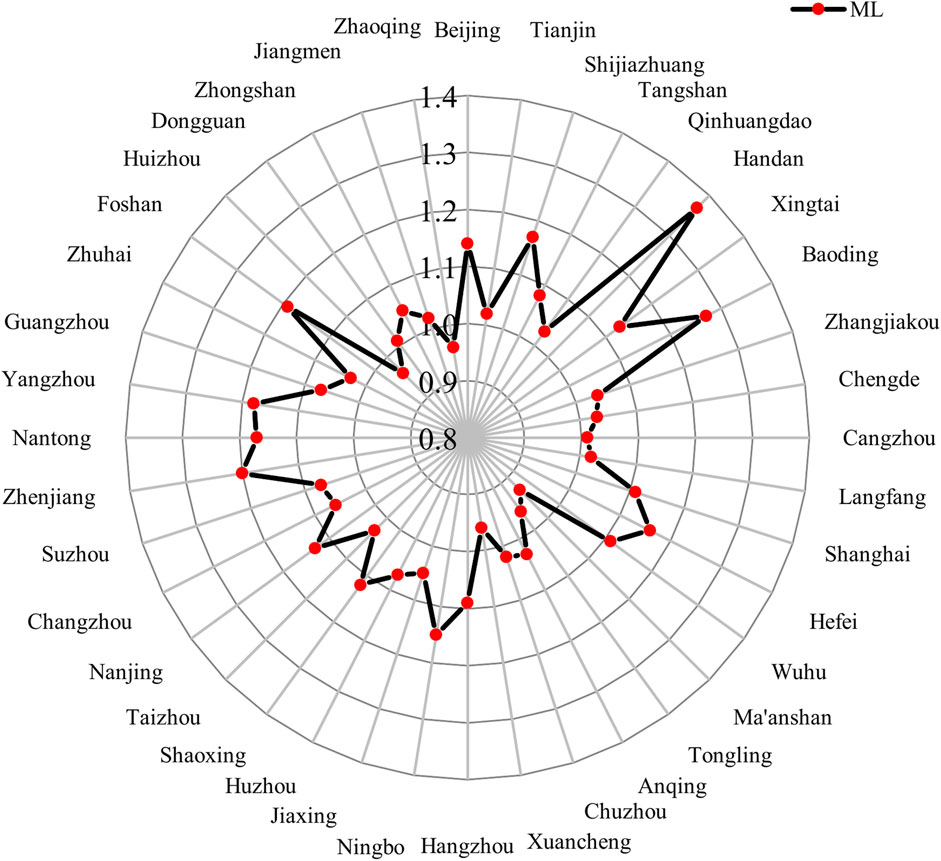
FIGURE 7. ML index for cities in the three major urban agglomerations from 2010 to 2020.
In the above section, we have analyzed the current situation of green innovation in the three major urban agglomerations and found regional variability in the GIE of the urban agglomerations. And what the reasons leading to the differences are, which is worthy of our in-depth study. We have already understood the trend of GIE at the micro level. This section will explore the influencing factors of GIE at the macro level. Based on the panel data of 40 cities from 2010 to 2020, the Tobit regression model was calculated using Stata17.0 software. The results are shown in Table 7.
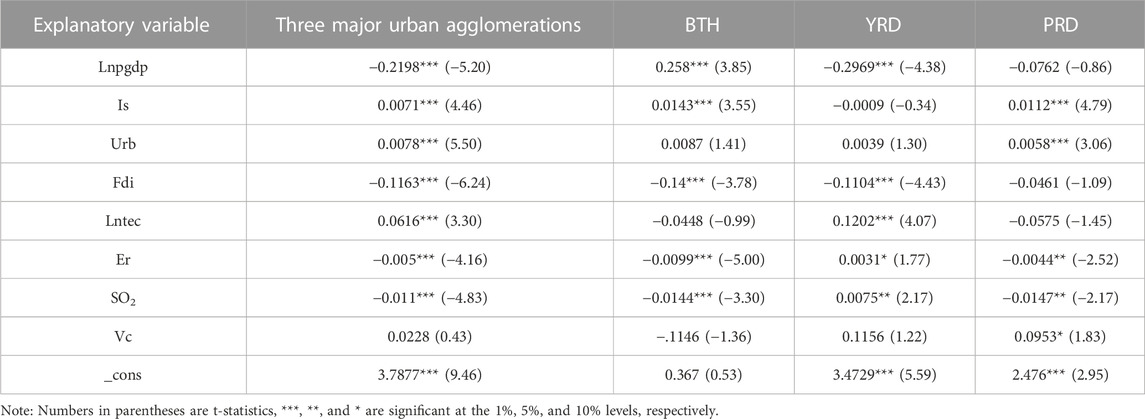
TABLE 7. Regression results of the Tobit model.
According to the results of the Tobit regression, there is apparent spatial variability among different urban agglomerations, which is analyzed as follows.
The regression result of economic development level is different from hypothesis H1. It is negatively correlated with GIE, with a regression coefficient of −0.2198, and passed the 1% significance test. It shows that the economic development level inhibits the improvement of GIE. The regression coefficient is significantly positive in BTH, negative in the YRD, and negative but insignificant in the PRD. This is because rent-seeking behavior is likely to occur when the regional economic development level is high, diverting funds that should be used for scientific and technological research and development to other areas (Baumol, 1996). Moreover, the economic development model of the YRD is dominated by heavy industrial manufacturing, which generates a large amount of pollutants in the production process, and there is a contradiction between economic development and the environment. The regression results of industrial structure verified the hypothesis of H2. It is positively correlated with GIE, with a regression coefficient of 0.0071, and passed the 1% significance test. It shows that industrial structure promotes GIE. The regression coefficient is negative but insignificant in the YRD, while it is significantly positive in the BTH and PRD. The reason for this is that although the BTH region has a concentration of industrialization, it also shows the relatively more developed characteristics of high-tech industries, and this diversity of industrial structure encourages the development of regional industrial production in a greener direction. The PRD urban agglomeration is dominated by labor-intensive industries, with a high proportion of tertiary industries, which are low-pollution and high-efficiency, helping to promote green innovation. The YRD, on the other hand, focuses more on traditional manufacturing industries, with high resource consumption, high emissions, and low efficiency, which is not conducive to promoting green innovation.
The regression result of the urbanization level verifies the hypothesis of H3a. It positively correlates with GIE, with a regression coefficient of 0.0078 and passing the 1% significance test. It shows that the urbanization level promotes the improvement of GIE. The regression coefficient is significantly positive in the PRD but not in the BTH and YRD. The reason is that the PRD urban agglomerations are geographically close and belong to the same provincial administrative region, which is conducive to coordination and management and promotes improving urbanization quality to a certain extent. On the other hand, the BTH and YRD urban agglomerations have a wide radius, which makes the urbanization process more complicated and the rate of urbanization challenging to control, which is not conducive to the formation of high-quality urbanization. The regression result of the level of foreign investment verifies the hypothesis of H4b, which is significantly negatively correlated with GIE, with a regression coefficient of −0.1163 and passing the 1% significance test. It shows that the level of foreign investment inhibits the improvement of GIE. The BTH and YRD urban agglomerations have a higher intensity of foreign investment. Still, due to the shorter time of opening up to the outside world and the lack of relevant experience, there exists a tendency to focus on the introduction of foreign investment without considering the quality, which may lead to the fact that they become a “pollution refuge” for foreign enterprises. On the other hand, the PRD urban agglomeration has accumulated experience in opening up to the outside world earlier due to its favorable geographical location, and the negative impact of foreign investment on the region is therefore not significant.
The regression results of the science and technology level verified the hypothesis of H5. It has a significant positive correlation with GIE, with a regression coefficient of 0.0616, and passed the 1% significance test. It shows that the science and technology level promote improving GIE. The regression coefficient is significantly positive in the YRD but insignificant in the BTH and PRD. The reason is that the YRD joins the three major urban agglomerations, and this change of role stimulates the vitality of R&D personnel, the government helps enterprises overcome the problem of insufficient R&D funds, and the synergy of human and material resources accelerates the transformation of scientific research results (Liu et al., 2021). BTH is relatively weak in economic strength among the three major urban agglomerations, and funds for science and technology research and development are mainly concentrated in Beijing, with insufficient investment in science and technology in other cities. The PRD urban agglomeration has a high degree of openness to the outside world and fierce competition among enterprises, which may be more concerned about short-term economic benefits, and S&T expenditures are used to research and develop other technologies with high rates of return, rather than investing in long-term green innovation projects. The regression result of environmental regulation verifies the hypothesis of H6b. It has a significant negative correlation with GIE, with a regression coefficient of −0.005 and passing the 1% significance test. It indicates that environmental regulation inhibits the improvement of GIE. The regression coefficient is significantly negative in the BTH and PRD and positive in the YRD. Since the YRD joined the three major urban agglomerations, the environmental management policy framework is still imperfect, and there is room for improving the marginal benefits of ecological improvement (Lu et al., 2022). The overly strict environmental regulation in the BTH and PRD urban agglomerations brings additional pollution management costs to enterprises. It takes up their R&D funds for energy-saving technologies, adversely affecting GIE.
The regression results of SO2 emissions verified the hypothesis of H7. It has a significant negative correlation with GIE, with a regression coefficient of −0.011, and passed the 1% significance test. It shows that SO2 emissions inhibit the improvement of GIE. The regression coefficient is significantly negative in the BTH and PRD and positive in the YRD. The BTH region is typically dominated by heavy industry and manufacturing, leading to higher SO2 emissions. In contrast, the YRD region may have implemented more appropriate environmental regulations and control measures to control the emission of pollutants. The regression results for vegetation cover are different from hypothesis H8. The regression results show that the effect of vegetation cover on green innovation is insignificant. Race something to its source is because vegetation cover’s positive impact on green innovation in the BTH and YRD urban agglomerations may take longer to emerge, and regression analyses usually only capture short-term associations. The vegetation cover in the PRD urban agglomeration may have already interacted with other factors and contributed to the GIE.
The results of this paper show that there is apparent spatial variability in GIE among the urban agglomerations of BTH, YRD, and PRD. The GIE changes from the development pattern of “PRD > YRD > BTH” to the development pattern of “PRD > BTH > YRD.” The result is similar to the findings of Li and Liu, (2019). By tracing the development history of the urban agglomerations, we find some possible explanations. The PRD urban agglomeration is dominated by light industry, and Guangdong Province, as a pioneer of China’s reform and opening up, has a long history of international exchange and cooperation and has accumulated rich experience in opening up to the outside world. The region has a relatively well-developed regulatory policy system for foreign investment, effectively preventing the problem of “pollution shelters” that may arise after introducing foreign investment. By 2020, the green coverage rate of the built-up areas in the PRD Region will reach 45.95%, with high urbanization quality. The PRD urban agglomeration is known for its abundant dynamism and broad openness and is a leader in energy use and green technologies. As a result, the region’s green innovation level is relatively high. The YRD urban agglomeration is dominated by secondary industries, with the development of strategic emerging and modern service industries lagging. The YRD is an early city circle in China; its GDP is much higher than that of the PRD and BTH. However, its per capita GDP is lower than that of the PRD, which may, to a certain extent, make people focus more on improving the quality of life rather than considering the green development of the environment. At the same time, there is an imbalance in the development of the YRD. Under the role of administrative barriers in the region, it is difficult to avoid the problems of competition for resources, projects, funds, and so on, which will affect the improvement of the overall level of green innovation in the region. However, during the 13th Five-Year Plan period, BTH has achieved remarkable results in the implementation of the five development concepts and has made significant progress in coordinated development, transport integration, ecological, environmental protection, and industrial upgrading, which creates opportunities and impetus for a sustainable, green and high-end product of the BTH region, Thus a shift occurs where the GIE of the BTH urban agglomeration is higher than that of the YRD urban agglomeration.
According to the regression results, we find that industrial structure, urbanization level, and science and technology level facilitate the overall GIE of the three major urban agglomerations. This indicates that the policies implemented in China regarding industrial structure transformation, high-quality urbanization development, and increasing scientific and technological investment in R&D institutions play an important facilitating role in promoting the development of green innovation. The higher the share of the tertiary industry in the economy, the more it contributes to achieving sustainable economic growth. Fan et al., (2021) also confirmed this view in their study. However, in his research, Feng and Wang, (2019) pointed out that neglecting heterogeneous industrial restructuring would harm green innovation. The transformation stage of the industrial structure will inevitably encounter problems and challenges, but in the long run, it will promote green development. In addition, increased levels of urbanization can introduce factors that are powerful for technological development through agglomeration effects, similar to the study by Carlino et al., (2007). However, Dong et al., (2022) pointed out in their research that urbanization is a double-edged sword, and rapid population growth may lead to various urban problems, such as traffic congestion. Therefore, the urbanization process requires the government to actively mobilize members of society to participate in and strengthen urban management and make full use of the opportunity urbanization brings. Increased government spending on science and technology can boost the R&D incentives of enterprises, universities, and research institutes. It eases the shortage of funds for R&D subjects in the R&D process, reduces the innovation risk of enterprises, and improves the efficiency of science and technology innovation. This fact was also verified in the study of Zeng et al., (2021). Organizations can invest S&T expenditures in constructing research laboratories, technology incubators, and other infrastructures to provide venues and resources for S&T innovation and support the promotion of green innovation.
The economic development level, foreign direct investment, environmental regulations, and SO2 emissions have an inhibitory effect on improving the overall GIE of the three urban agglomerations. To a certain extent, this suggests that the existing economic development model, foreign investment management tools, and environmental regulatory policies have some irrationality, thus hindering the development of green innovation. Deng et al., (2022) pointed out that economic development is the basis for promoting green development. The international community widely recognizes the development of a green and low-carbon economy as an effective way to address global climate change (Wu et al., 2023). However, some fast-growing economies may be overly dependent on traditional energy sources and industries, and these conventional industries may inhibit the development of green innovation to a certain extent. Hence, the combination of high-tech and traditional industries is critical. Some studies have pointed out that higher economic growth will increase public concern for the environment, and the increase in general care for the environment will help encourage more people to participate in environmental governance, which is conducive to achieving the goal of sustainable development (Ma, 2023). Our study confirms the existence of the “pollution refuge” hypothesis in the three major urban agglomerations. The introduction of foreign capital brings advanced technology to China but also occupies the innovation resources of enterprises. Domestic firms will form a certain degree of technological dependence on foreign firms, inhibiting their innovation ability, which is less conducive to the development of green innovation in China. This view is supported by the findings of Fan et al., (2021). However, Lu et al., (2022) and Liu et al., (2021) point out that opening up to the outside world is conducive to promoting technological exchange and cooperation among enterprises, enhancing their independent innovation ability, and thus facilitating the improvement of GIE. We consider introducing foreign investment a potential advantage in developing green innovation, provided that we establish clear policies on raising and regulating foreign investment. Overly stringent environmental regulations increase the costs that firms spend on pollution control, which crowds out innovation funds and leads to a decline in firms’ innovation capacity. This result is confirmed in the studies of Li and Du, (2021) and Wang et al., (2020). In contrast to the findings of Porter and van der Linde, (1995) and Yang et al., (2020). Who argued that environmental regulation can have a significant incentive effect to stimulate innovation capacity. Not only can they effectively compensate for the increased compliance costs of enterprises due to the development of green technologies, but also promote enterprises to optimize the allocation of innovation resources further and improve the level of green innovation. However, Zhang et al., (2020) study points out that mandatory environmental regulations are not conducive to green innovation growth, and market-oriented and voluntary environmental regulations can promote GIE. The inhibitory effect of SO2 emissions and the effect of vegetation cover were not significant, which was similar to the findings of Bao et al., (2022) in their study of the influencing factors in the YRD region. High SO2 emissions can lead to stricter environmental regulations and supervision, increasing company compliance costs. As the international community focuses more and more on sustainable development goals, high SO2 emissions can limit financing and market opportunities, so adopting cleaner energy sources and using sulfur-reducing equipment are essential to greening your business. Although vegetation cover does not significantly affect green innovation, there are interactions between it and other relevant factors. For example, increasing vegetation cover can improve the quality of the urban environment and attract more highly qualified people. This will increase the technological R&D capacity of the region. Therefore, improving the GIE by increasing greening and developing vertical greening is also crucial.
Through the discussion, we found that the findings of this paper are both the same and different from the existing studies. The differences may be due to the differences in research methodology, indicator selection, research themes, and country backgrounds. In addition, this paper draws on the research of Bao et al., (2022), which explores the influence of natural factors on GIE and broadens the indicator system of existing influencing factors in the three major urban agglomerations. Existing studies have paid less attention to the spatial and temporal evolution of GIE and the influencing mechanism of the three major urban agglomerations. In comparison, this paper pays more attention to the spatial and temporal evolution of GIE and the influencing mechanism of the three major urban agglomerations, which helps to re-examine the green innovation development of the three major urban agglomerations. The analyses show that the green innovation of the three major urban agglomerations in China has certain spatial variability, and the direction and degree of their influencing factors are also different.
Notably, the study found that the economic development level has the most significant negative impact on GIE. Sustained economic growth may not necessarily lead to an increase in GIE, and the reason for this is related to the imbalance and over-polarization of the economic environment in the YRD. The development imbalance is mainly manifested in the fact that the economic development of Anhui Province is still at a low level, far behind Shanghai, Jiangsu, and Zhejiang. Moreover, Anhui is in the middle and late stages of industrialization, undertaking the transfer of high-energy-consuming and high-polluting industries from Jiangsu, Zhejiang, and Shanghai, exacerbating the conflict between economic growth and the environment. Therefore, it is significant for the YRD to change its economic development into a green and low-carbon development mode.
This article explores the differences and influencing factors of GIE in the three major urban agglomerations. Although we have made discoveries, there is still room for further improvement. Firstly, since city data is not readily available, the input-output and influencing factor indicators constructed in this paper may have omissions. In future studies, researchers need to supplement indicators for measuring the GIE. Secondly, although this paper analyzed the influencing factors, it should have considered the spatial correlation between cities. Researchers can further explore the spatiotemporal characteristics and evolutionary dynamics of GIE by employing spatial econometric models. Lastly, this study only focused on the three major urban agglomerations in the eastern coastal region. In future research, researchers can further expand the scope of the study to include urban agglomerations such as the Shandong Peninsula and conduct a more comprehensive analysis.
During the study period, the number of cities with “effective” GIE in BTH increased, the number of cities with “effective” GIE in the YRD decreased, and the PRD was stable. In addition, the polarization of GIE levels between cities is prominent, with the maximum value of GIE in BTH being 1.73 and the minimum value being 0.3. The YRD’s maximum GIE value is 1.27, and the minimum value is 0.36. The maximum value of GIE in the PRD is 1.23, and the minimum value is 0.53. This shows a significant imbalance in the green innovation development of BTH, YRD, and PRD urban agglomerations, and the GIE value of some cities fluctuates between effective and ineffective. This imbalance is more prominent in the YRD urban agglomeration, and to some extent, green innovation in the YRD urban agglomeration has been neglected to a certain extent in the process of urban development, and part of the resource allocation management is ineffective, which hinders the development of green innovation.
Based on the decomposition results of the ML index, this study finds that technical efficiency and technological progress together lead to the dynamic improvement of GIE. If there is asynchrony, it will constrain the stable growth of GIE to a certain extent. The ML index of 35 out of 40 cities is greater than 1, which means that the government’s allocation and management of green innovation resources are gradually improving, and the efficient use and intensive management of all kinds of resources have been realized to a certain extent. More cities in the YRD urban agglomeration show an asynchrony between technical efficiency and technological progress, which limits the improvement of GIE. Moreover, the ML index of three cities, Maanshan, Tongling, and Xuancheng, is less than 1, with negative growth in GIE, indicating that it is difficult to steadily improve the GIE of these cities, which requires special attention from the government.
According to the regression results of the Tobit model, industrial structure, urbanization level, and technology level have a significant positive impact on the GIE of the three major urban agglomerations. The economic development level, utilization of foreign investment, environmental regulation, and SO2 emissions have a negative impact on GIE. This suggests that China is making good progress in implementing industrial structure transformation, urbanization, and support for science and technology innovation and can continue to deepen these policy approaches. Sustained economic growth may not necessarily lead to an increase in the level of green innovation in the three major urban agglomerations. Suppose the three major urban agglomerations stick to the current economic development model and ignore the damage that economic growth causes to the environment. In that case, there is a high probability that rapid economic growth will constrain green and innovative development. The introduction of foreign investment brings industries that are highly polluting and emit high emissions. Governments need to balance the attraction of foreign investment with environmental objectives to ensure that the introduction of foreign investment does not adversely affect the environment and sustainable development. Stricter environmental regulations can cause firms to invest more in compliance costs than green innovation, reducing the amount of money available for research and development.
Firstly, the PRD can continue optimizing its development based on the existing industrial restructuring and urbanization policies. At the same time, the PRD is more adversely affected by environmental regulations and may consider formulating market-oriented or voluntary environmental regulations to encourage enterprises to take the initiative to take environmental protection actions. The YRD, on the other hand, urgently needs to transform its existing economic model into a green and low-carbon development and to promote the deep integration of information technology, intelligence, digitalization, etc., with industrialization. At the same time, it is necessary to improve the policy of foreign investment introduction, establish an effective screening mechanism, and strengthen the environmental constraints and environmental supervision on the innovation process of foreign-funded enterprises. BTH should also improve its policy on foreign investment introduction and consider formulating market-oriented or voluntary environmental regulations. Industrial enterprises in the BTH urban agglomeration should adopt cleaner energy and more advanced combustion technologies and install flue gas desulphurization equipment to reduce SO2 emissions.
Secondly, in view of the significant differences in the GIE among cities, the three major urban agglomerations need to share their experiences to promote collaborative creation and green development in the region. Knowledge sharing and technology transfer among cities should be enabled through seminars and exchange programs. Give full play to the demonstration role of Beijing, Zhangjiakou, Chengde, Cangzhou, Langfang, Shanghai, Tongling, Anqing, Chuzhou, Guangzhou, Zhuhai, Dongguan, Zhongshan and Jiangmen within this urban agglomeration. Encourage enterprises to innovate on their own, give full play to the role of the main body of industry, academia, and research, and create an open and efficient platform for the transformation of innovation results. Maanshan, Tongling, Xuancheng, Huizhou, and Zhaoqing need to attract high-tech talents to settle in their cities using settlement policies and social security, increase investment in science and technology, build platforms for innovation and cooperation, and gradually realize the transformation of innovation results. Considering regional differences and administrative barriers, the government must unify the regulatory system.
Thirdly, from the perspective of the three major urban agglomerations, local governments can take advantage of the momentum of the new industrial revolution to promote the intelligent development of enterprises and the integration of high-tech and traditional industries to realize the transformation of the economic development model to a green and low-carbon economy. They can also raise public awareness of environmental protection through publicity and education. The government should provide financial incentives and tax reductions to encourage and guide enterprises to develop in green and high-value-added industries. Help and support small and micro enterprises to adapt to the new industrial environment. Encourage enterprises to engage in international cooperation, attract foreign investment and global technology, and promote the internationalization and upgrading of the industrial structure. The key is to improve policies for the introduction of foreign investment and to establish effective screening mechanisms and environmental monitoring. The Government can increase its support for science and technology by reducing taxes, providing tax incentives for research and development, and reducing innovation risks. Establish and support a science and technology entrepreneurship ecosystem, including incubators, accelerators, and investment institutions, to promote business growth and innovation. The government should ensure rational land use, reduce land waste, encourage efficient land use, and promote high-level urban development patterns. Industrial enterprises should control SO2 emissions by improving resource utilization, using clean energy, and advanced waste treatment equipment. The government should select appropriate tree species for planting, increase the area of green space, encourage green design, etc., to increase vegetation coverage.
Publicly available datasets were analyzed in this study. This data can be found here: http://cnki.nbsti.net/CSYDMirror/area/Yearbook/Single/N2020050229?z=D26.
SY: Conceptualization, Formal Analysis, Investigation, Methodology, Resources, Software, Validation, Writing–original draft. QF: Conceptualization, Data curation, Formal Analysis, Funding acquisition, Investigation, Methodology, Resources, Validation, Writing–review and editing. YJ: Formal Analysis, Methodology, Supervision, Validation, Visualization, Writing–review and editing.
The authors declare financial support was received for the research, authorship, and/or publication of this article. This research was funded by the National Natural Science Foundation of China, grant number: 11701513.
The authors declare that the research was conducted in the absence of any commercial or financial relationships that could be construed as a potential conflict of interest.
All claims expressed in this article are solely those of the authors and do not necessarily represent those of their affiliated organizations, or those of the publisher, the editors and the reviewers. Any product that may be evaluated in this article, or claim that may be made by its manufacturer, is not guaranteed or endorsed by the publisher.
Bao, H., Teng, T., Hu, S., and Ding, J. (2022). Spatial differentiation and influencing factors of urban green innovation efficiency in Yangtze River Delta. Resour. Environ. Yangtze Basin 31 (2), 273–284. (In Chinese). doi:10.11870/cjlyzyyhj202202002
Baumol, W. J. (1996). Entrepreneurship: productive, unproductive, and destructive. J. Bus. Ventur. 11 (1), 3–22. doi:10.1016/0883-9026(94)00014-X
Carlino, G. A., Chatterjee, S., and Hunt, R. M. (2007). Urban density and the rate of invention. J. Urban Econ. 61 (3), 389–419. doi:10.1016/j.jue.2006.08.003
Chambers, R. G., Fāure, R., and Grosskopf, S. (1996). Productivity growth in APEC countries. Pac. Econ. Rev. 1 (3), 181–190. doi:10.1111/j.1468-0106.1996.tb00184.x
Chen, K., Kou, M., and Fu, X. (2018). Evaluation of multi-period regional R&D efficiency: an application of dynamic DEA to China's regional R&D systems. Omega 74, 103–114. doi:10.1016/j.omega.2017.01.010
Cheng, Y., Shao, T., Lai, H., Shen, M., and Li, Y. (2019). Total-factor eco-efficiency and its influencing factors in the Yangtze River Delta urban agglomeration, China. Int. J. Environ. Res. Public Health 16 (20), 3814. doi:10.3390/ijerph16203814
Clark, T. A. (2013). Metropolitan density, energy efficiency and carbon emissions: multi-attribute tradeoffs and their policy implications. Energy Policy 53, 413–428. doi:10.1016/j.enpol.2012.11.006
Cui, Z., and Wang, F. (2023). The spatiotemporal dynamic and spatial spillover effect of green finance efficiency in China: analysis based on super-SBM model and spatial Durbin model. Environ. Sci. Pollut. Res. 30 (25), 67040–67058. doi:10.1007/s11356-023-27004-2
Deng, M., Chen, J., Tao, F., Zhu, J., and Wang, M. (2022). On the coupling and coordination development between environment and economy: a case study in the Yangtze River Delta of China. Int. J. Environ. Res. Public Health 19 (1), 586. doi:10.3390/ijerph19010586
Dinda, S. (2004). Environmental Kuznets curve hypothesis: a survey. Ecol. Econ. 49 (4), 431–455. doi:10.1016/j.ecolecon.2004.02.011
Dong, X., Fu, W., Yang, Y., Liu, C., and Xue, G. (2022). Study on the evaluation of green technology innovation efficiency and its influencing factors in the central plains city cluster of China. Sustainability 14 (17), 11012. doi:10.3390/su141711012
Fan, F., Lian, H., Liu, X., and Wang, X. (2021). Can environmental regulation promote urban green innovation Efficiency? An empirical study based on Chinese cities. J. Clean. Prod. 287, 125060. doi:10.1016/j.jclepro.2020.125060
Fan, J., Ren, Y., and Yu, X. (2017). An analysis of the mechanism between population urbanization and regional green EconomicEfficiency-based on stochastic frontier analysis model. J. Macro-quality Res. 5 (04), 52–65. doi:10.13948/j.cnki.hgzlyj.2017.12.005
Feng, C., and Wang, M. (2019). The heterogeneity of China's pathways to economic growth, energy conservation and climate mitigation. J. Clean. Prod. 228, 594–605. doi:10.1016/j.jclepro.2019.04.326
Fussler, C., and James, P. (1996). Driving eco-innovation: a breakthrough discipline for innovation and sustainability. Lanham, MD, USA: Pitman Publishing.
Guo, Y., Hu, Y., Shi, K., and Bilan, Y. (2020). Valuation of water resource green efficiency based on SBM–TOBIT panel model: case study from henan province, China. Sustainability 12 (17), 6944. doi:10.3390/su12176944
Guo, J., and Li, J. (2021). Efficiency evaluation and influencing factors of energy saving and emission reduction: an empirical study of China’s three major urban agglomerations from the perspective of environmental benefits. Ecol. Indic. 133, 108410. doi:10.1016/j.ecolind.2021.108410
He, J., Lau, W. T., and Liu, Y. (2023). Innovative production efficiency in Chinese high-tech industries during the 13th five-year plan: evidence from a three-stage DEA model. Green Low-Carbon Econ. doi:10.47852/bonviewGLCE3202910
Hu, B., Yuan, K., Niu, T., Zhang, L., and Guan, Y. (2022). Study on the spatial and temporal evolution patterns of green innovation efficiency and driving factors in three major urban agglomerations in China—based on the perspective of economic geography. Sustainability 14 (15), 9239. doi:10.3390/su14159239
James, T. (1958). Estimation of relationships for limited dependent variables. Econometrica 26 (1), 24–36. doi:10.2307/1907382
Lee, K.-H., and Min, B. (2015). Green R&D for eco-innovation and its impact on carbon emissions and firm performance. J. Clean. Prod. 108, 534–542. doi:10.1016/j.jclepro.2015.05.114
Li, G., Li, X., and Huo, L. (2023). Digital economy, spatial spillover and industrial green innovation efficiency: empirical evidence from China. Heliyon 9 (1), e12875. doi:10.1016/j.heliyon.2023.e12875
Li, J., and Du, Y. (2021). Spatial effect of environmental regulation on green innovation efficiency: evidence from prefectural-level cities in China. J. Clean. Prod. 286, 125032. doi:10.1016/j.jclepro.2020.125032
Li, J., Li, Z., and Li, C. (2016). Empirical study on green innovation efficiency of cities --- evidence from city clusters in the middle reaches of the Yangtze River. J. Jiangxi Univ. Finance Econ. (6), 3–16. (In Chinese). doi:10.13676/i.cnki.cn36-1224/f.2016.06.001
Li, J., and Liu, Z. (2019). Spatial differences in green total factor productivity and influencing factors in three major urban clusters in China. Soft Sci. 33 (02), 61–64. doi:10.13956/j.ss.1001-8409.2019.02.13
Liao, B., and Li, L. (2022). Urban green innovation efficiency and its influential factors: the Chinese evidence. Environ. Dev. Sustain. 25, 6551–6573. doi:10.1007/s10668-022-02316-4
Liu, C., Gao, X., Ma, W., and Chen, X. (2020). Research on regional differences and influencing factors of green technology innovation efficiency of China’s high-tech industry. J. Comput. Appl. Math. 369, 112597. doi:10.1016/j.cam.2019.112597
Liu, C., Sun, W., Li, P., Zhang, L., and Li, M. (2023). Differential characteristics of carbon emission efficiency and coordinated emission reduction pathways under different stages of economic development: evidence from the Yangtze River Delta, China. J. Environ. Manag. 330, 117018. doi:10.1016/j.jenvman.2022.117018
Liu, P., Zhang, L., Tarbert, H., and Yan, Z. (2021). Analysis on spatio-temporal characteristics and influencing factors of industrial green innovation efficiency—from the perspective of innovation value chain. Sustainability 14 (1), 342. doi:10.3390/su14010342
Long, R., Guo, H., Zheng, D., Chang, R., Na, S., and Lv, Z. (2020). Research on the measurement, evolution, and driving factors of green innovation efficiency in Yangtze River Economic Belt: a super-SBM and spatial durbin model. Complexity 2020, 1–14. doi:10.1155/2020/8094247
Lu, C., Chen, M., and Tian, G. (2022). Spatial-temporal evolution and influencing factors of urban green innovation efficiency in China. J. Environ. Public Health 2022, 1–12. doi:10.1155/2022/4047572
Ma, L., Hong, Y., Chen, X., and Quan, X. (2022). Can green innovation and new urbanization Be synergistic development? Empirical evidence from Yangtze River Delta city group in China. Sustainability 14 (10), 5765. doi:10.3390/su14105765
Ma, X. (2023). Environmental regulation and public environmental concerns in China: a new insight from the difference in difference approach. Green Low-Carbon Econ. doi:10.47852/bonviewGLCE3202868
Miao, C., Duan, M., Zuo, Y., and Wu, X. (2021). Spatial heterogeneity and evolution trend of regional green innovation efficiency--an empirical study based on panel data of industrial enterprises in China's provinces. Energy Policy 156, 112370. doi:10.1016/j.enpol.2021.112370
Peng, W., Yin, Y., Kuang, C., Wen, Z., and Kuang, J. (2021a). Spatial spillover effect of green innovation on economic development quality in China: evidence from a panel data of 270 prefecture-level and above cities. Sustain. Cities Soc. 69, 102863. doi:10.1016/j.scs.2021.102863
Peng, Y., Fan, Y., and Liang, Y. (2021b). A green technological innovation efficiency evaluation of technology-based SMEs based on the undesirable SBM and the malmquist index: a case of Hebei province in China. Sustainability 13 (19), 11079. doi:10.3390/su131911079
Peng, H., Shen, N., Ying, H., and Wang, Q. (2021c). Can environmental regulation directly promote green innovation behavior? based on situation of industrial agglomeration. J. Clean. Prod. 314, 128044. doi:10.1016/j.jclepro.2021.128044
Porter, M. E., and van der Linde, C. (1995). Toward a new conception of the environment-competitiveness relationship. J. Econ. Perspect. 9 (4), 97–118. doi:10.1257/jep.9.4.97
Shengrong, L., and Liangwen, L. (2019). The dynamic effect of international R&D capital technology spillovers on the efficiency of green technology innovation. Sci. Res. Manag. 40 (3), 21. doi:10.19571/i.cnki.1000-2995.2019.03.003
Slater, J., and Angel, I. T. (2000). The impact and implications of environmentally linked strategies on competitive advantage: a study of Malaysian companies. J. Bus. Res. 47 (1), 75–89. doi:10.1016/S0148-2963(98)00053-8
Tone, K. (2001). A slacks-based measure of efficiency in data envelopment analysis. Eur. J. operational Res. 130 (3), 498–509. doi:10.1016/S0377-2217(99)00407-5
Tone, K. (2002). A slacks-based measure of super-efficiency in data envelopment analysis. Eur. J. Operational Res. 143 (1), 32–41. doi:10.1016/S0377-2217(01)00324-1
Wang, M., Zhang, H., Dang, D., Guan, J., He, Y., and Chen, Y. (2023). Fiscal decentralization, local government environmental protection preference, and regional green innovation efficiency: evidence from China. Environ. Sci. Pollut. Res. Int. 30 (36), 85466–85481. doi:10.1007/s11356-023-28391-2
Wang, N., Zhu, Y., and Yang, T. (2020). The impact of transportation infrastructure and industrial agglomeration on energy efficiency: evidence from China’s industrial sectors. J. Clean. Prod. 244, 118708. doi:10.1016/j.jclepro.2019.118708
Wu, C. Q., and Dong, X. (2015). Research on time and space disparities of total factor energy efficiency in the Yangtze River Economic Belt under the constrained environment. Resour. Environ. Yangtze Basin 24, 1646–1653. (In Chinese). doi:10.11870/cjlyzyyhj201510005
Wu, Z., Zhao, Y., and Zhang, N. (2023). A literature survey of green and low-carbon economics using natural experiment approaches in top field journal. Green Low-Carbon Econ. doi:10.47852/bonviewGLCE3202827
Xu, J., Wang, H., and Tang, K. (2022). The sustainability of industrial structure on green eco-efficiency in the Yellow River Basin. Econ. Analysis Policy 74, 775–788. doi:10.1016/j.eap.2022.04.002
Xu, X., and Zhou, Y. (2021). Efficiency evaluation of green innovation in Chinese eight comprehensive economic areas based on three-stage malmquist index. Pol. J. Environ. Stud. 30 (3), 2863–2875. doi:10.15244/pjoes/129970
Yan, Y., Li, J., Xu, Y., and Zhang, Y. (2021). Research on industry difference and convergence of green innovation efficiency of manufacturing industry in China based on super-SBM and convergence models. Math. Problems Eng. 2021, 1–12. doi:10.1155/2021/4013468
Yang, H., Lu, F., and Zhang, F. (2020). Exploring the effect of producer services agglomeration on China’s energy efficiency under environmental constraints. J. Clean. Prod. 263, 121320. doi:10.1016/j.jclepro.2020.121320
Yang, T., Zhou, K., and Zhang, C. (2022). Spatiotemporal patterns and influencing factors of green development efficiency in China's urban agglomerations. Sustain. Cities Soc. 85, 104069. doi:10.1016/j.scs.2022.104069
Yang, Y. (2023). The impact of green finance and resource tax policy on regional energy efficiency based on the non-desired output super-efficiency SBM-tobit model. Sustainability 15 (14), 11438. doi:10.3390/su151411438
Yue, S., Yang, Y., and Hu, Y. (2016). Does foreign direct investment affect green growth? Evidence from China’s experience. Sustainability 8 (2), 158. doi:10.3390/su8020158
Zeng, J., Škare, M., and Lafont, J. (2021). The co-integration identification of green innovation efficiency in Yangtze River Delta region. J. Bus. Res. 134, 252–262. doi:10.1016/j.jbusres.2021.04.023
Zhang, J., Kang, L., Li, H., Ballesteros-Pérez, P., Skitmore, M., and Zuo, J. (2020). The impact of environmental regulations on urban Green innovation efficiency: the case of Xi'an. Sustain. Cities Soc. 57, 102123. doi:10.1016/j.scs.2020.102123
Zhang, R., Tai, H., Cheng, K.-T., Cao, Z., Dong, H., and Hou, J. (2021). Analysis on evolution characteristics and dynamic mechanism of urban green innovation network: a case study of Yangtze River Economic Belt. Sustainability 14 (1), 297. doi:10.3390/su14010297
Zhang, Y., Chen, H., and He, Z. (2022). Regional green innovation efficiency and dynamic evolution of Chinese industrial enterprises: a three-stage super-efficiency DEA method based on cooperative game. Environ. Sci. Pollut. Res. Int. 29 (59), 89387–89410. doi:10.1007/s11356-022-21682-0
Zhao, N., Liu, X., Pan, C., and Wang, C. (2021). The performance of green innovation: from an efficiency perspective. Socio-Economic Plan. Sci. 78, 101062. doi:10.1016/j.seps.2021.101062
Zhao, T., Zhou, H., Jiang, J., and Yan, W. (2022). Impact of green finance and environmental regulations on the green innovation efficiency in China. Sustainability 14 (6), 3206. doi:10.3390/su14063206
Zhou, J., and Shao, M. (2023). Evaluation of green innovation efficiency in Chinese provincial regions under high-quality development and its influencing factors: an empirical study based on hybrid data envelopment analysis and multilevel mixed-effects Tobit models. Sustainability 15 (14), 11079. doi:10.3390/su151411079
Keywords: green innovation efficiency, super-efficient SBM model, ML index, Tobit model, urban agglomeration
Citation: Ying S, Fang Q and Ji Y (2023) Research on green innovation efficiency measurement and influencing factors in the three major coastal urban agglomerations in China. Front. Environ. Sci. 11:1276913. doi: 10.3389/fenvs.2023.1276913
Received: 14 August 2023; Accepted: 05 October 2023;
Published: 19 October 2023.
Edited by:
Faik Bilgili, Erciyes University, TürkiyeReviewed by:
Mahmood Ahmad, Shandong University of Technology, ChinaCopyright © 2023 Ying, Fang and Ji. This is an open-access article distributed under the terms of the Creative Commons Attribution License (CC BY). The use, distribution or reproduction in other forums is permitted, provided the original author(s) and the copyright owner(s) are credited and that the original publication in this journal is cited, in accordance with accepted academic practice. No use, distribution or reproduction is permitted which does not comply with these terms.
*Correspondence: Yanting Ji, eWFudGluZy5qaUB6dXN0LmVkdS5jbg==
Disclaimer: All claims expressed in this article are solely those of the authors and do not necessarily represent those of their affiliated organizations, or those of the publisher, the editors and the reviewers. Any product that may be evaluated in this article or claim that may be made by its manufacturer is not guaranteed or endorsed by the publisher.
Research integrity at Frontiers
Learn more about the work of our research integrity team to safeguard the quality of each article we publish.