 Yihan Hu
 Xu Yue
 Chenguang Tian1
 Hao Zhou
- 1School of Environmental Science and Engineering, Nanjing University of Information Science and Technology (NUIST), Nanjing, China
- 2Climate Change Research Center, Institute of Atmospheric Physics, Chinese Academy of Sciences, Beijing, China
Wetlands act as an important natural source of global methane (CH4). The emission rate of wetland CH4 is jointly affected by climate change, carbon dioxide (CO2) fertilization, and wetland distribution. In this study, we implemented a wetland CH4 emission module into the Yale Interactive Biosphere (YIBs) model to quantify the spatiotemporal variations of global wetland CH4 emissions in 2001–2020. Site-level validations showed that the YIBs model reasonably captures the seasonality and magnitude of CH4 emissions at 28 out of 33 sites with significantly positive correlations and low relative biases. On the global scale, the YIBs predicts an annual mean wetland CH4 emission of 147.5 Tg yr−1 in 2000–2017, very close to the estimate of 147.9 Tg yr−1 from the ensemble of 13 process-based models. Global wetland CH4 emissions showed a positive trend of 0.74 Tg yr−2 in the past 2 decades, leading to an increase of 7.4 Tg yr−1 (5.2%) in 2008–2017 than 2000–2009. Climate change and CO2 fertilization accounted for over 70% of global wetland CH4 emission changes. Among them, the impact of CO2 grew steadily and became the dominant factor after the year 2008. The most significant changes in wetland CH4 emissions were located in the tropical regions following the perturbations in temperature that drives the ecosystem productivity. We found limited changes in CH4 emissions over high latitudes because of the moderate variations in wetland area fraction. The rise of wetland CH4 emissions poses an emerging threat to the global warming and likely escalates the tropospheric air pollutants.
1 Introduction
Atmospheric methane (CH4) is an important greenhouse gas (Fletcher and Schaefer, 2019) and precursor of tropospheric ozone (Staniaszek et al., 2022). The CH4 concentrations have been steadily increasing since the preindustrial period (Aben et al., 2017). Recent observations showed a CH4 rise of 267 ppb (16.2%) from 1984 to 2022 though with large interannual variations (Lan et al., 2022). Such increase of CH4 is mainly driven by the changes of emissions, especially from the anthropogenic sources that grew 26% during 1970–2012 (Turner et al., 2019). However, the natural emissions of CH4 also account for approximately 28% of the global CH4 emissions and made important contributions to the growth of atmospheric CH4 levels (Saunois et al., 2020).
The wetland CH4 emission is the largest component of natural sources (Koffi et al., 2020). Production of wetland CH4 involves complex biogeochemical processes and is highly sensitive to climatic and environmental perturbations. High temperature promotes CH4 emissions with a Q10 metric and further escalates emissions with a warming feedback (Liu et al., 2020; Rößger et al., 2022; Zhang et al., 2023). Precipitation usually increases wetland emissions by enlarging the area of waterbody and increasing the water table depth (Lunt et al., 2021; Zou et al., 2022), the latter of which may further increase the temperature sensitivity of CH4 emissions (Duval and Radu, 2018; Chen et al., 2021). The variation of wetland area caused by the shifts in precipitation and temperature patterns directly determine the area of wetland methane discharge (Kuhn et al., 2018; Zou et al., 2022). Increased CO2 concentration can lead to an increase in microbial biomass of methanogens by promoting the ecosystem productivity and the mineralization of soil organic matter (Liu et al., 2019; Yuan et al., 2021). The changes of these environmental factors modulate the spatiotemporal variations in the regional to global wetland CH4 emissions.
Different approaches have been applied to estimate global wetland CH4 emissions, including the top-down estimates of 155.5–218.6 Tg yr−1 using the inverse modeling and satellite-based observations (Ishizawa et al., 2016; Bergamaschi et al., 2018), as well as the bottom-up estimates of 100.1–183.2 Tg yr−1 with process-based models and site-level measurements (Zhu et al., 2015; Arora et al., 2018). Among these methods, the process-based models show advantages in predicting historical emissions and identifying the dominant drivers. Most models consider the biogeochemical processes such as production, oxidation, and transport for CH4 emissions (Wania et al., 2010; Nzotungicimpaye et al., 2021; Salmon et al., 2022). For example, the LPJ-WHyMe model reasonably captures the seasonal variations of CH4 emissions at seven sites by adding a root exudate pool with stratified root distribution to the major biogeochemical processes (Wania et al., 2010). The WETMETH model also considers the above processes with dynamic predictions of soil water table and inundation areas, and shows consistent spatial patterns with three upscaled flux measurements (Nzotungicimpaye et al., 2021). The ORCHIDEE model with the permafrost dynamics and optimized parameters can reasonably simulate methane emissions from the northern wetlands (Salmon et al., 2022).
In addition to the above-mentioned individual simulations, the recent estimates with 13 models predicted natural wetland CH4 emissions of 101–179 Tg yr−1 on the global scale during 2000–2017 (Saunois et al., 2020). These models were driven with the same meteorology and boundary conditions, so as to minimize the modeling uncertainties due to the forcing data. However, they prescribed the wetland net primary productivity (NPP) and ignored the CO2 fertilization effects to the changes in substrate availability. As a result, the multi-model ensemble average suggests a very limited trend in wetland CH4 emissions for 2000–2017 (Saunois et al., 2020), which are inconsistent with the fast growth of atmospheric CH4 levels (Lan et al., 2022) and the recent increase of wetland emissions (Shaw et al., 2022). Furthermore, the drivers of the changes in wetland CH4 emissions were not explored.
In this study, we implemented a process-based wetland CH4 emissions scheme into the well-established Yale Interactive terrestrial Biosphere (YIBs) model (Yue and Unger, 2015). We evaluate the simulated wetland emissions against in situ measurements and the multi-model ensemble averages. The model is then driven with year-to-year CO2 concentrations, meteorological parameters, and wetland extent to predict global wetland CH4 emissions during 2000–2020. We perform sensitivity experiments to quantify the contributions of individual factors to the trends in CH4 emissions. With these model configurations, we attempt to depict the spatiotemporal variations of wetland CH4 emissions and identify their dominant drivers in the past two decades.
2 Methods and data
2.1 YIBs vegetation model
We use the YIBs model as the framework for wetland CH4 emissions. The YIBs is a vegetation model that simulates carbon fluxes with prognostic leaf area index (LAI) and tree height (Yue and Unger, 2015). The model applies the Michaelis-Menten enzyme-kinetics scheme for leaf photosynthesis (Farquhar et al., 1980) and the two-leaf canopy radiative transfer scheme for light partitioning (Spitters et al., 1986). The gross primary productivity (GPP) is calculated by the integration of leaf photosynthesis along the LAI. The litterfall drives the carbon transitions among soil pools and the heterotrophic respiration (Rh). The accumulation of soil carbon provides substrate for the wetland CH4 emissions. Simulated GPP and LAI have been validated against site-level and satellite-based observations (Yue et al., 2015). The YIBs model has joined the vegetation model intercomparison project since 2020 and showed reasonable performance in the simulation of major carbon metrics including GPP, LAI, vegetation biomass, soil carbon and so on (Friedlingstein et al., 2020).
2.2 Wetland CH4 emission module
We implement a process-based wetland CH4 emission module into the YIBs with major biogeochemical processes, including production, oxidation, and transportation of CH4. In the wetland areas, the production of CH4 is calculated based on soil conditions (including soil temperature and pH) and the amount of carbon that is distributed for methanation, following the CH4-related module in the TRIPLEX-GHG model (Zhu et al., 2014). The decomposition of organic matter is regulated by redox acceptors. Under anaerobic conditions, the presence of high organic substrates restricts the redox potential, controlling the decomposition rate of organic carbon and the emissions ratio of CH4 and carbon dioxide. The Rh during anaerobic decomposition processes is derived as the remaining portion after subtracting net ecosystem productivity (NEP) from net primary productivity (NPP). The rate of CH4 oxidation is computed using a Michaelis-Menten kinetic relationship that is dependent on temperature and CH4 concentrations in the corresponding soil layer (Dunfield et al., 1993). The transportation of CH4 from soil to atmosphere is composed of three pathways including diffusion, ebullition, and plant-mediated transportation. The diffusion of CH4 follows the Fick’s law with the dependence on soil properties (soil texture, tortuosity and water content) and CH4 concentration gradient between different soil layers (Walter and Heimann, 2000). The ebullition of CH4 is triggered if the CH4 concentration exceeds 750 μmol L−1 (Zhu et al., 2014). The plant-mediated transportation, which provides an impactful way to divert CH4 from soil to atmosphere, is calculated based on the same aerenchyma factor of plants as those equations used in the TRIPLEX-GHG model (Zhu et al., 2014).
2.3 Data for simulations and validations
We use the meteorological variables from the MERRA-2 reanalysis (Gelaro et al., 2017) to drive the YIBs model. The surface variables include air temperature, specific humidity, solar radiation, air pressure, and wind speed. The soil variables include soil temperature and soil moisture at six vertical layers. All these variables are interpolated to the horizontal resolution of 1° × 1° at the hourly time step. The year-to-year global mean atmospheric CO2 concentrations are adopted from the protocol data for the input4MIPs (https://esgf-node.llnl.gov/projects/input4mips/).
For the wetland CH4 scheme, we used the monthly global wetland extent dataset of WAD2M (Zhang Z. et al., 2021) derived from remote sensing and the soil pH map of SoilGrids250m dataset (Hengl et al., 2017) from the International Soil Reference and Information Centre. Other gridded soil parameters (e.g., particle composition, soil porosity) are obtained from the ISLSCP II Global Gridded Soil Characteristics dataset (Scholes et al., 2011) generated by the International Satellite Land-Surface Climatology Project.
We use site-level measurements from the FLUXNET-CH4 network (Delwiche et al., 2021) to validate the simulated CH4 emissions. The monthly CH4 fluxes are collected from all the available 33 sites with at least 3 years length of period. We also use the multi-model output from 13 bottom-up models and 9 top-down approaches to assess the simulated wetland emissions during 2000–2017. To facilitate the comparison, we separate the global land into 18 regions following the definitions in Saunois et al. (2020) (Figure 1).
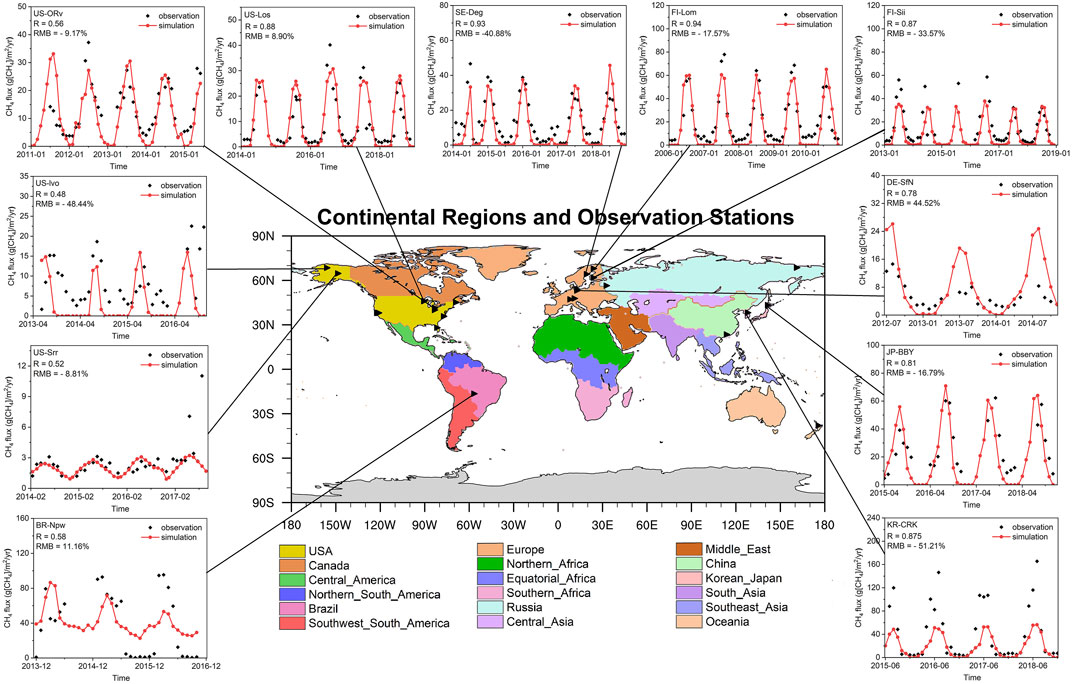
FIGURE 1. The distribution of 18 continental regions and the comparisons of site-level CH4 emissions between observations (black points) and simulations (red lines) at 11 sites from the FLUXNET—CH4 network. The statistics for all sites are listed in Supplementary Table S1.
2.4 Simulations
We perform four simulations to depict the spatiotemporal variations of wetland CH4 emissions (Table 1). The BASE run is forced with year-to-year meteorology, wetland extent, and CO2 concentrations during 2000–2020. Three “FIX” sensitivity experiments are conducted to distinguish the impacts of the changes in climate (CLIM), wetland area (WET), and CO2 fertilization effects (CO2) on CH4 emissions. For each of these runs, all the forcings are the same as BASE run except that a specific forcing is fixed at the year 2000. The differences between the BASE and “FIX” runs indicate the contributions of changes in climate (BASE—FIXCLIM), wetland (BASE—FIXWET), and CO2 (BASE—FIXCO2) to the global wetland CH4 emissions. For all simulations, the hourly meteorology is applied from 1900 to 2020 with the cycling of 2000 meteorology for the 1900–2000 period, which is used for the model spin up.
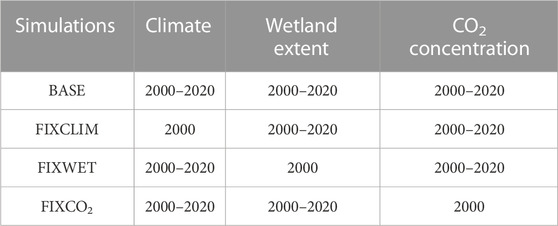
TABLE 1. Summary of sensitivity experiments.
3 Result
3.1 Model evaluations and comparisons
We first evaluate the simulated CH4 emissions at FLUXNET-CH4 sites (Figure 1). For the selected sites around the world, the YIBs model in general captures the seasonality of CH4 emissions with the peak values in summer period. Among the total of 33 sites, simulations show significantly positive correlation coefficients (R) at 28 sites and reasonable relative mean biases (RMB) of −50%–50% at 23 sites (Supplementary Table S1). Emissions are usually higher nearby the tropical rainforest but lower in the semi-arid regions such as western United States. For the Amazon rainforest with dense vegetation, the non-flooded trees can absorb CH4 from the soil through their roots, transport the gas through vascular systems to stems, and release it into the air subsequently (Gauci et al., 2021). The model fails to capture the CH4 emissions at some sites. For example, simulated CH4 fluxes are negatively correlated with a high RMB of 186% against measurements at site US-Snd. However, this site is within the same grid as US-Sne and US-Srr where the YIBs model yields reasonable emissions. A similar case could be found at US-Twt, US-Tw1, and US-Tw4 where the simulations share the same values due to the vicinity of sites but observations exhibit large deviations. As a result, the missing of site-specific parameters (such as vegetation types, soil characteristics) may in part cause the modeling biases at these sites.
We then compare the simulated global wetland CH4 emissions with other estimates (Supplementary Table S2). On average, the emissions estimated by process-based models are 19.1% lower than those using the top-down approaches. Compared to the ensemble of 13 bottom-up models, the YIBs shows lower value of −2.1% in 2000–2009 and the higher estimate of 1.6% in 2008–2017. For the ensemble mean of models, limited differences are found between the two periods likely because of the omission of CO2 fertilization effects on the wetland NPP (Saunois et al., 2020). However, for individual models, either positive (7 out of 13), negative (2 out of 13), or mild (4 out of 13) trends are predicted because of their varied representations of climatic impacts on CH4 emissions. A similar conclusion is achieved with the nine top-down approaches utilizing the WAD2M wetland dataset. The maximum increases in CH4 emissions between the two decades are predicted at 3.6% for the top-down and 5.2% for the bottom-up methods, respectively. The predicted trend of 5.2% with the YIBs model is at the high end of other estimates, though our simulations consider the CO2 fertilization effect.
We compare the simulated trend of wetland CH4 emissions with the top-down inversion (Zhang Y. et al., 2021) from the Greenhouse gases Observing Satellite (GOSAT). The growth rate of natural wetland CH4 in the YIBs model shows increased emissions after the year 2010 (Supplementary Figure S1A). The simulated trend of 12.09% matches that of 12.29% from the posterior data of GOSAT, which shows a much larger interannual variability than the simulations. Such year-to-year variations are difficult to reproduce as the prior data fail to capture both the interannual perturbations and the long-term trend. Furthermore, we compare the simulated interannual variations with the results of LPJ model (Zhang et al., 2023) driven by meteorological fields from either Climatic Research Unit (CRU) or MERRA-2 reanalyses (Supplementary Figure S1B). The growth rates obtained from different meteorological fields exhibit a maximum deviation of up to 11.62%. Using the same meteorological field of MERRA2, the moderate difference of 2.03% is achieved between the simulations of YIBs and LPJ models. Such discrepancy is lower than the differences caused by the varied meteorological fields.
We divide global land into 18 regions (Figure 1) where the simulated wetland CH4 emissions are compared to the values from multiple models and approaches (Figure 2). Comparing the results from different approaches, the assessment of natural wetland CH4 emissions by bottom-up models tends to be lower than that of top-down approaches in most regions (Supplementary Figure S2A). Similar to other bottom-up models, the YIBs model yields lower emission estimates in multiple regions compared to the top-down models especially over the Canada, Brazil, and Southeast Asia regions. On average, the simulated CH4 emissions match the medians of multiple models with a high R2 of 0.77, though the former is in general lower than the latter estimates (Supplementary Figure S2B).
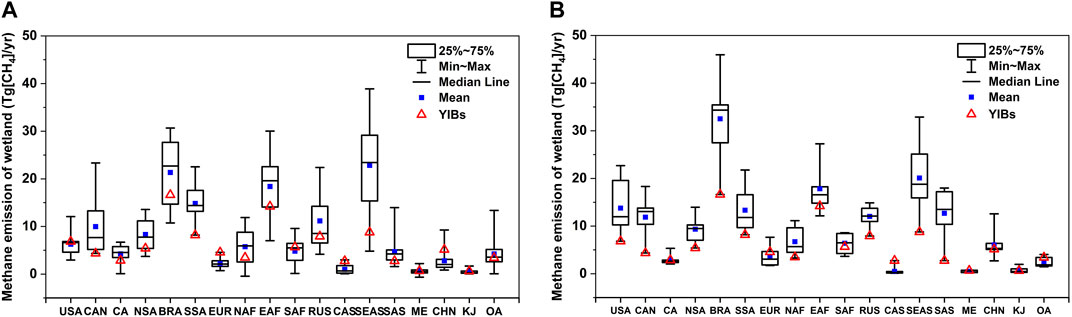
FIGURE 2. Comparisons of wetland CH4 emissions at 18 regions averaged for 2000–2017 between simulations and the estimates by (A) 13 bottom-up approaches and (B) 9 top-down approaches. For each boxplot, the central black solid line indicates the median, and the blue solid square shows the ensemble mean of all approaches. The top and bottom edges represent the 25th and 75th percentiles, respectively, with the whiskers representing the data range. The results of YIBs are shown in red triangles.
In all the 18 regions, YIBs model yields reasonable wetland CH4 emissions with differences of −15.2 Tg yr−1 ∼ 2.54 Tg yr−1 from the multi-model ensemble medians. For comparison of top-down models and bottom-up models, both methods show the same top two emitters in Brazil and Southeast Asia, though the top-down approach predicts much higher emissions in Brazil than the latter region. The YIBs also yields the largest wetland CH4 emissions in Brazil, but underestimates the emissions in Southeast Asia by 56.82%–63.37% compared to the multi-model ensemble mean. The median assessments of CH4 emissions from the third-largest natural wetland region in Africa by bottom-up models, top-down approaches, and YIBs model are relatively close, ranging from 14.21 to 18.72 Tg yr−1. However, there is a relatively significant divergence among different models in the assessments over high-emission regions, like Brazil, Southeast Asia and Equatorial Africa. We also found large inter-model variability in Canada and Russia though the emissions are much lower than the tropical region, which is likely associated with the varied sensitivity to climatic drivers among different models and approaches (Saunois et al., 2020). In most regions, the performance of the YIBs model is relatively close to the intermediate levels of other bottom-up models. However, it yields significantly higher assessment of emissions in Central Asia compared to most models, though it does not exceed the maximum values among the other 13 bottom-up models. The discrepancies underscore the substantial uncertainty in the current assessment of natural wetland CH4 emissions, primarily attributed to the complex biogeochemical and ecological processes involved in the processes. The variations among models in different processes may further magnify the differences in the final emission estimates. In future researches, more observations are required to validate the simulated CH4 emissions from natural wetlands in different regions.
3.2 Spatiotemporal variation in wetland CH4 emissions
The wetland CH4 emissions show distinct spatial and seasonal variations (Figure 3). Large emissions are located in the tropics (23.5°S–23.5°N), contributing 69.22% to the global total amount due to the optimal hydrothermal conditions and the adequate supply of substrate. The secondary hotspots are found in the temperate (23.5°N–60°N) regions of the Northern Hemisphere, which accounts for 24.32% of the global amount (Figure 3A). These centers become the strongest in the boreal summer (Figure 3B), when the high temperature promotes CH4 emission rate and expand the wetland extent. The total global emissions in summer (from June to August) reach 50.2 Tg, accounting for 33.8% of the annual total amount. In contrast, limited emissions are predicted over the northern mid-high latitudes in boreal winter because of the low temperature and seasonally frozen ground. For this season, most of global wetland CH4 emissions are confined in the tropical regions, leading to 45% lower emissions compared to the summertime on the global scale.
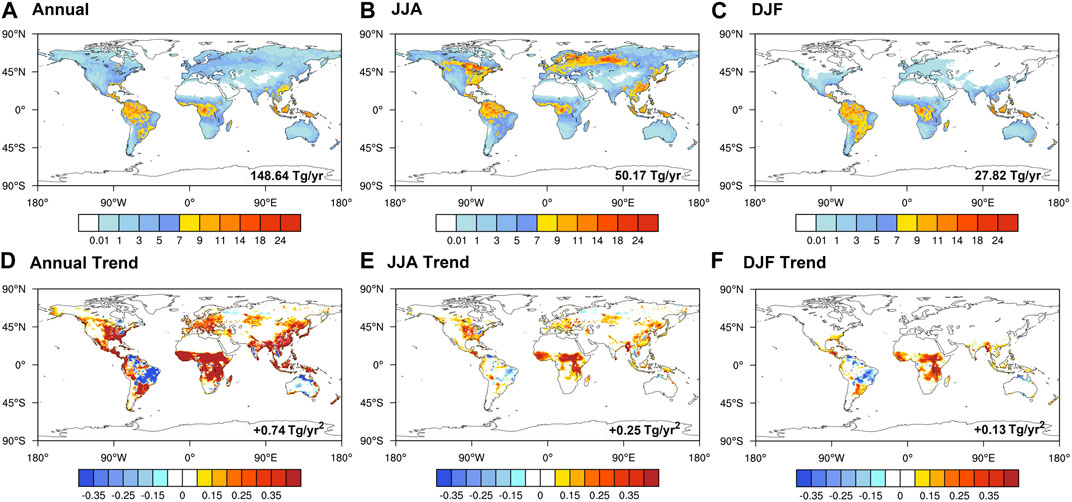
FIGURE 3. The (top) mean (mg [CH4] m−2 day−1) and (bottom) trend (mg [CH4] m−2 day−1 yr−1) of CH4 emissions from wetland for (A,D) whole year (B,E), June-August, and (C,F) December–February in 2001–2020. The global total values are shown on each panel.
We further assess the trend of wetland CH4 emissions during 2001–2020. Over the global grids with baseline emissions of at least 1 mg m−2 day−1, 1.47% show significant increase in the past two decades. The most significant enhancement is located at the tropical Africa, eastern Asia, and eastern United States. (Figure 3D). The increase of CH4 emissions in tropical Africa persist all year round, while those in Asia and US are more evident in boreal summer (Figures 3E, F). Meanwhile, large reduction is predicted over eastern South America, where the baseline emissions (Figure 3A) are low due to the moderate supply of substrate from grassland. Such regional decline is more evident in boreal winter (Figure 3F). On the global scale, the positive trend in summer almost doubles that in winter.
3.3 Drivers of the trends in wetland CH4 emissions
We isolate the contributions of climate change, CO2 fertilization, and wetland extent to the trend of CH4 emissions during 2001–2020 (Figure 4). Among these factors, the changes of wetland area show limited impacts while the other two factors cause large variabilities in CH4 emissions (Figure 4A). For 2001–2008, the negative effects of climate change play the dominant role in regulating the total trend. However, after the year 2008, the impact of CO2 fertilization is becoming more important year by year, accounting for 67.84% of the total changes in CH4 emissions during 2010–2020 (Figure 4B). For the FIXCO2 simulation, the average wetland CH4 emissions are predicted to be 143.47 Tg yr−1 in 2000–2009 and 143.26 Tg yr−1 in 2008–2017. As a result, the YIBs model yields limited changes in wetland CH4 emissions between the 2 decades, close to the estimate by the ensemble of 13 process-based models without the CO2 fertilization effects (Supplementary Table S2).
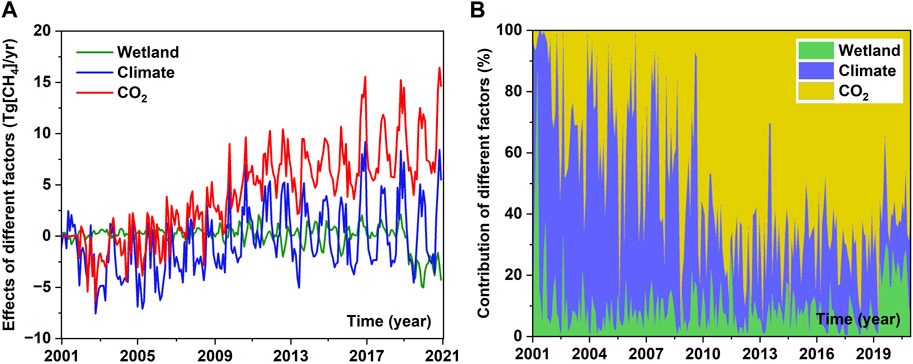
FIGURE 4. The (A) variations of wetland CH4 emissions and (B) contributions of three key driving factors including wetland extent, climate change, and CO2 fertilization during 2001–2020. The contribution percentages for individual factors are derived based on the absolute changes from baseline simulation caused by prescribing the specific factor.
We further identify the spatial distribution of wetland CH4 changes induced by different factors (Figure 5). Climate change alone exerts strong impacts in tropical regions with CH4 reductions in South America, South Africa, and Australia, but increased emissions in central Africa (Figure 5A). There are some moderately positive changes in CH4 emissions induced by climate at the middle latitudes of Northern Hemisphere. The positive and negative changes are offsetting each other, leading to a limited contribution of −0.12 Tg yr−1 by climate change during 2001–2020. CO2 fertilization causes widespread enhancement in CH4 emissions especially over the tropical regions (Figure 5B). The changes in wetland area cause patchy responses in CH4 emissions with moderate reductions in South America and central Africa (Figure 5C).
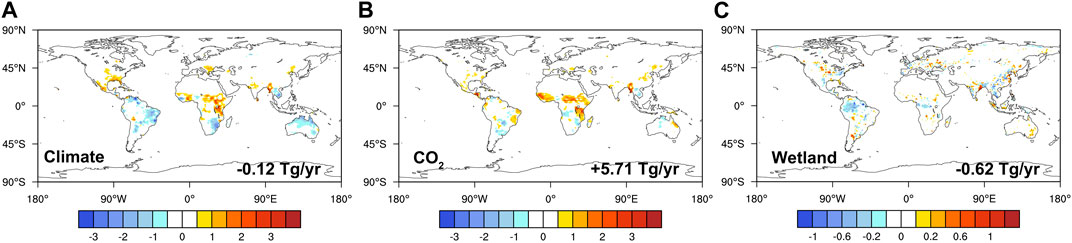
FIGURE 5. The mean differences in wetland CH4 emissions (Units: mg[CH4] m−2 day−1) between simulations with all forcing (BASE) and that with fixed (A) climate (FIXCLIM), (B) CO2 (FIXCO2) and (C) wetland extent (FIXWET) during 2001–2020.
In anaerobic environments, the rate of organic carbon decomposition and the release ratio of carbon dioxide to methane are constrained by the presence of high organic matter substrates. Climate change decreases Rh in South America, South Africa, and Australia (Figure 6A), because increased temperature (Figure 6C) inhibits plant photosynthesis in the tropical regions (Piao et al., 2013). In contrast, the slight cooling over Sahel and central Africa promotes the regional Rh (Figure 6A) and the consequent wetland CH4 emissions (Figure 5A). Solar radiation shows widespread reductions except over Indonesia and Australia (Figure 6D). However, the effect of radiation change on Rh is secondary to that of temperature, as the warming-induced inhibition overweighs the benefit of increased radiation in Indonesia and Australia (Figure 6A). The CO2 fertilization effect causes increases in Rh globally (Figure 6B), leading to significant enhancement of wetland CH4 emissions. (Figure 5B).
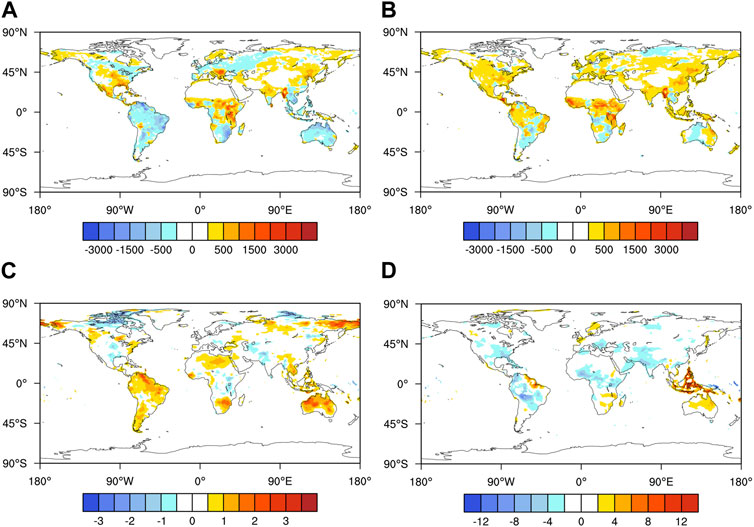
FIGURE 6. The trend of heterotrophic respiration (Units: mg[C] m−2 day−1) induced by (A) climate change and (B) CO2 fertilization, as well as the trend in (C) temperature (Units: °C) and (D) solar radiation (Units: W m−2) during 2001–2020.
4 Conclusion and discussion
We implemented a wetland CH4 emission module into the YIBs vegetation model and validated its performance against available measurements and estimates. Simulated wetland CH4 emissions matched observations with reasonable seasonality at 28 out of 33 sites. The model also yielded similar global wetland CH4 emissions compared to the ensemble of 13 process-based models. We performed sensitivity experiments to identify the spatiotemporal variations of wetland CH4 emissions and the associated drivers from 2001 to 2020. The results showed that the interannual variation of atmospheric CO2 and meteorological conditions predominantly drive the changes in global wetland CH4 emissions, with their combined contributions exceeding 70% in each month during the research period. The role of CO2 fertilization grew gradually and became the dominant factor after 2008. The attribution analyses indicated that the changes of wetland CH4 emissions followed the changes in Rh, with widespread enhancement by CO2 fertilization effects but patchy responses to climate change mainly following the trend of temperature.
Previous studies also revealed the strong impacts of CO2 fertilization on wetland CH4 emissions. For example, Yuan et al. (2021) suggested that increased CO2 could promote the concentration of dissolved organic carbon (DOC) and acetate by enhancing ecosystem productivity and the mineralization of soil organic matter. This, in turn, leads to an increase in the microbial biomass of methanogens, ultimately resulting in enhanced CH4 emissions. However, some recent estimates ignored the CO2 fertilization effect in their simulations. For example, the observation-constrained study by Koffi et al. (2020) showed enhanced wetland CH4 emissions of 50%–80% at the end of 21st century without considering CO2 fertilization effect. The multi-model ensemble estimates by Saunois et al. (2020) also neglected the CO2 fertilization and achieved limited trends in wetland CH4 emissions for the recent two decades. We expect that the increasing rates of wetland CH4 emissions are likely underestimated in above studies as the role of CO2 fertilization becomes more dominant over the long-term period.
Many studies have emphasized the influences of climatic factors on wetland CH4 emissions. Liu et al. (2020) highlighted the important role of air temperature, which affects CH4 production directly through Q10 factors and indirectly by altering both NPP and wetland inundation area fraction. We also found that temperature accounts for most of climate-driven changes in CH4 emissions through modulating ecosystem NPP (Figure 6). Furthermore, Chen et al. (2021) observed a positive correlation between wetland water level and temperature sensitivity in CH4 emissions, though this relationship is not incorporated in our model. Zhang et al. (2023) compared the impacts of temperature and precipitation, and found that precipitation dominates the variability of CH4 emissions in some tropical regions as rainfall alter the wetland extent. However, we prescribed the area of wetland in our simulations and constrained the effects of precipitation to some extent. Despite these discrepancies, we also found that the perturbations of tropical CH4 dominates the global wetland emissions as concluded by Zhang et al. (2023).
In this study, we found limited changes of wetland CH4 emissions at high latitudes. The melting permafrost in boreal regions of the Northern Hemisphere is expected to become a crucial source in the future, as projected by the Coupled Model Intercomparison Project (Canadell et al., 2021). However, there is considerable disagreement regarding the assessment of the impact of permafrost melting on CH4 emissions. Zhang et al. (2017) estimated that CH4 emissions could reach 347.8 Tg yr−1 by the end of the 21st century under the RCP8.5 scenario taking into account the wetland expansion from permafrost melting. Nonetheless, the inversion-constrained estimation showed much lower CH4 emissions under the same climate change scenario (Koffi et al., 2020). Furthermore, Salmon et al. (2022) found that bottom-up models tend to overestimate CH4 emissions in northern peatland sites in the model calibrations. These studies revealed the large uncertainties in estimating wetland CH4 emissions due to the permafrost dynamics in process-based models. It should be noted that global wetland area distributions derived from satellite retrievals may also deviate from the actual conditions. The retrievals are influenced by the accuracy of prior data (Xi et al., 2022) and it is challenging to adequately validate retrieval results in regions lacking ground-based observations. Additionally, the low surface reflectance features such as limestone deposits may lead to overestimations of inundation levels in certain areas (Jensen and Mcdonald, 2019). Non-wetland areas in dynamic dataset with an inundation index of 0 do not necessarily imply the absence of wetlands. These limitations of the wetland area dataset may introduce uncertainties into our assessment of the global variations in wetland CH4 emissions. Despite these uncertainties, we revealed an increasing tendency of wetland CH4 emissions due to the joint effects of CO2 fertilization and climate change in the past two decades. Such trend likely persists under global warming and poses an emerging threat to both climate and air quality.
Data availability statement
The original contributions presented in the study are included in the article/Supplementary Material, further inquiries can be directed to the corresponding author.
Author contributions
YH: Conceptualization, Data curation, Methodology, Writing–original draft, Writing–review and editing. XY: Conceptualization, Data curation, Methodology, Writing–original draft, Writing–review and editing, Funding acquisition. CT: Data curation, Investigation, Writing–review and editing. HZ: Data curation, Investigation, Writing–review and editing. WF: Data curation, Investigation, Writing–review and editing. XZ: Data curation, Investigation, Writing–review and editing. YZ: Data curation, Investigation, Writing–review and editing. YC: Data curation, Investigation, Writing–review and editing.
Funding
The authors declare financial support was received for the research, authorship, and/or publication of this article. This study was jointly supported by the National Natural Science Foundation of China (grant no. 42293323) and Natural Science Foundation of Jiangsu Province (grant no. BK20220031).
Acknowledgments
The authors thank the NASA for the MERRA-2 reanalysis datasets and ISLSCP II Global Gridded Soil Characteristics dataset, the ISRIC for SoilGrids 250m datasets, the ESGF for input4MIPs, the FLUXNET-CH4 community for methane observation data, and Zhang et al. for WAD2M dataset.
Conflict of interest
The authors declare that the research was conducted in the absence of any commercial or financial relationships that could be construed as a potential conflict of interest.
Publisher’s note
All claims expressed in this article are solely those of the authors and do not necessarily represent those of their affiliated organizations, or those of the publisher, the editors and the reviewers. Any product that may be evaluated in this article, or claim that may be made by its manufacturer, is not guaranteed or endorsed by the publisher.
Supplementary material
The Supplementary Material for this article can be found online at: https://www.frontiersin.org/articles/10.3389/fenvs.2023.1275742/full#supplementary-material
References
Aben, R., Barros, N., Donk, E., Frenken, T., Hilt, S., Kazanjian, G., et al. (2017). Cross continental increase in methane ebullition under climate change. Nat. Commun. 8, 1682. doi:10.1038/s41467-017-01535-y
Arora, V. K., Melton, J. R., and Plummer, D. (2018). An assessment of natural methane fluxes simulated by the CLASS-CTEM model. Biogeosciences 15, 4683–4709. doi:10.5194/bg-15-4683-2018
Bergamaschi, P., Karstens, U., Manning, A. J., Saunois, M., Tsuruta, A., Berchet, A., et al. (2018). Inverse modelling of European CH4 emissions during 2006–2012 using different inverse models and reassessed atmospheric observations. Atmos. Chem. Phys. 18, 901–920. doi:10.5194/acp-18-901-2018
Canadell, J. G., Scheel Monteiro, P., Costa, M. H., Cotrim da Cunha, L., Cox, P. M., Eliseev, A. V., et al. (2021). “Global carbon and other biogeochemical cycles and feedbacks,” in Climate change 2021: the physical science basis. Contribution of working group I to the sixth assessment report of the intergovernmental panel on climate change. V. Masson-Delmotte, P. Zhai, A. Pirani, S. L. Connors, C. Péan, S. Bergeret al. (Cambridge, United Kingdom and New York, NY, USA: Cambridge University Press), 673–816. doi:10.1017/9781009157896.001
Chen, H., Xu, X., Fang, C., Li, B., and Nie, M. (2021). Differences in the temperature dependence of wetland CO2 and CH4 emissions vary with water table depth. Nat. Clim. Change 11, 766–771. doi:10.1038/s41558-021-01108-4
Delwiche, K. B., Knox, S. H., Malhotra, A., Fluet-Chouinard, E., McNicol, G., Feron, S., et al. (2021). FLUXNET-CH4: a global, multi-ecosystem dataset and analysis of methane seasonality from freshwater wetlands. Earth Syst. Sci. Data 13, 3607–3689. doi:10.5194/essd-13-3607-2021
Dunfield, P., knowles, R., Dumont, R., and Moore, T. R. (1993). Methane production and consumption in temperate and subarctic peat soils: response to temperature and pH. Soil Biol. biochem. 25, 321–326. doi:10.1016/0038-0717(93)90130-4
Duval, T. P., and Radu, D. D. (2018). Effect of temperature and soil organic matter quality on greenhouse-gas production from temperate poor and rich fen soils. Ecol. Eng. 114, 66–75. doi:10.1016/j.ecoleng.2017.05.011
Farquhar, G. D., Von Caemmerer, S., and Berry, J. A. (1980). A biochemical model of photosynthetic CO2 assimilation in leaves of C3 species. Planta 149, 78–90. doi:10.1007/BF00386231
Fletcher, S. E. M., and Schaefer, H. (2019). Rising methane: a new climate challenge. Science 364, 932–933. doi:10.1126/science.aax1828
Friedlingstein, P., O’Sullivan, M., Jones, M. W., Andrew, R. M., Hauck, J., Olsen, A., et al. (2020). Global carbon budget 2020. Earth Syst. Sci. Data 12, 3269–3340. doi:10.5194/essd-12-3269-2020
Gauci, V., Figueiredo, V., Gedney, N., Pangala, S. R., Stauffer, T., Weedon, G. P., et al. (2021). Non-flooded riparian Amazon trees are a regionally significant methane source. Philos. Trans. R. Soc. Math. Phys. Eng. Sci. 380, 20200446. doi:10.1098/rsta.2020.0446
Gelaro, R., McCarty, W., Suárez, M. J., Todling, R., Molod, A., Takacs, L., et al. (2017). The modern-era retrospective analysis for research and applications, version 2 (MERRA-2). J. Clim. 30, 5419–5454. doi:10.1175/JCLI-D-16-0758.1
Hengl, T., Jesus, J. M., Heuvelink, G. B. M., Gonzalez, M. R., Kilibarda, M., Blagotić, A., et al. (2017). SoilGrids250m: global gridded soil information based on machine learning. PLOS ONE 12, e0169748. doi:10.1371/journal.pone.0169748
Ishizawa, M., Mabuchi, K., Shirai, T., Inoue, M., Morino, I., Uchino, O., et al. (2016). Inter-annual variability of summertime CO2 exchange in Northern Eurasia inferred from GOSAT XCO2. Environ. Res. Lett. 11, 105001. doi:10.1088/1748-9326/11/10/105001
Jensen, K., and Mcdonald, K. (2019). Surface water microwave product series version 3: a near-real time and 25-year historical global inundated area fraction time series from active and passive microwave remote sensing. IEEE Geosci. Remote Sens. Lett. 16, 1402–1406. doi:10.1109/LGRS.2019.2898779
Koffi, E. N., Bergamaschi, P., Alkama, R., and Cescatti, A. (2020). An observation-constrained assessment of the climate sensitivity and future trajectories of wetland methane emissions. Sci. Adv. 6, eaay4444. doi:10.1126/sciadv.aay4444
Kuhn, M., Lundin, E. J., Giesler, R., Johansson, M., and Karlsson, J. (2018). Emissions from thaw ponds largely offset the carbon sink of northern permafrost wetlands. Sci. Rep. 8, 9535. doi:10.1038/s41598-018-27770-x
Lan, X., Thoning, K. W., and Dlugokencky, E. J. (2022). Global monitoring laboratory - carbon cycle greenhouse gases. Available at: https://gml.noaa.gov/ccgg/trends_ch4/(Accessed June 7, 2023).
Liu, L., Zhuang, Q., Oh, Y., Shurpali, N. J., Kim, S., and Poulter, B. (2020). Uncertainty quantification of global net methane emissions from terrestrial ecosystems using a mechanistically based biogeochemistry model. J. Geophys. Res. Biogeosciences 125. doi:10.1029/2019JG005428
Liu, Y., Piao, S., Gasser, T., Ciais, P., Yang, H., Wang, H., et al. (2019). Field-experiment constraints on the enhancement of the terrestrial carbon sink by CO2 fertilization. Nat. Geosci. 12, 809–814. doi:10.1038/s41561-019-0436-1
Lunt, M. F., Palmer, P. I., Lorente, A., Borsdorff, T., Landgraf, J., Parker, R. J., et al. (2021). Rain-fed pulses of methane from East Africa during 2018–2019 contributed to atmospheric growth rate. Environ. Res. Lett. 16, 024021. doi:10.1088/1748-9326/abd8fa
Nzotungicimpaye, C.-M., Zickfeld, K., MacDougall, A. H., Melton, J. R., Treat, C. C., Eby, M., et al. (2021). WETMETH 1.0: a new wetland methane model for implementation in Earth system models. Geosci. Model Dev. 14, 6215–6240. doi:10.5194/gmd-14-6215-2021
Piao, S., Sitch, S., Ciais, P., Friedlingstein, P., Peylin, P., Wang, X., et al. (2013). Evaluation of terrestrial carbon cycle models for their response to climate variability and to CO2 trends. Glob. Change Biol. 19, 2117–2132. doi:10.1111/gcb.12187
Rößger, N., Sachs, T., Wille, C., Boike, J., and Kutzbach, L. (2022). Seasonal increase of methane emissions linked to warming in Siberian tundra. Nat. Clim. Change 12, 1031–1036. doi:10.1038/s41558-022-01512-4
Salmon, E., Jégou, F., Guenet, B., Jourdain, L., Qiu, C., Bastrikov, V., et al. (2022). Assessing methane emissions for northern peatlands in ORCHIDEE-PEAT revision 7020. Geosci. Model Dev. 15, 2813–2838. doi:10.5194/gmd-15-2813-2022
Saunois, M., Stavert, A. R., Poulter, B., Bousquet, P., Canadell, J. G., Jackson, R. B., et al. (2020). The global methane budget 2000–2017. Earth Syst. Sci. Data 12, 1561–1623. doi:10.5194/essd-12-1561-2020
Scholes, R. J., Eric, B. D. C., Collatz, F. G. H., Meeson, B. W., Los, S. O., and Landis, D. R. (2011). Data from: ISLSCP II global gridded soil characteristics. USA: ORNL DAAC Oak Ridge Tenn. doi:10.3334/ORNLDAAC/1004
Shaw, J. T., Allen, G., Barker, P., Pitt, J. R., Pasternak, D., Bauguitte, S. J.-B., et al. (2022). Large methane emission fluxes observed from tropical wetlands in Zambia. Glob. Biogeochem. Cycles 36, e2021GB007261. doi:10.1029/2021GB007261
Spitters, C. J. T., Toussaint, H. A. J. M., and Goudriaan, J. (1986). Separating the diffuse and direct component of global radiation and its implications for modeling canopy photosynthesis Part I. Components of incoming radiation. Agric. For. Meteorol. 38, 217–229. doi:10.1016/0168-1923(86)90060-2
Staniaszek, Z., Griffiths, P. T., Folberth, G. A., O’Connor, F. M., Abraham, N. L., and Archibald, A. T. (2022). The role of future anthropogenic methane emissions in air quality and climate. Npj Clim. Atmos. Sci. 5, 21–28. doi:10.1038/s41612-022-00247-5
Turner, A. J., Frankenberg, C., and Kort, E. A. (2019). Interpreting contemporary trends in atmospheric methane. Proc. Natl. Acad. Sci. 116, 2805–2813. doi:10.1073/pnas.1814297116
Walter, B. P., and Heimann, M. (2000). A process-based, climate-sensitive model to derive methane emissions from natural wetlands: application to five wetland sites, sensitivity to model parameters, and climate. Glob. Biogeochem. Cycles 14, 745–765. doi:10.1029/1999GB001204
Wania, R., Ross, I., and Prentice, I. C. (2010). Implementation and evaluation of a new methane model within a dynamic global vegetation model: LPJ-WHyMe v1.3.1. Geosci. Model Dev. 3, 565–584. doi:10.5194/gmd-3-565-2010
Xi, Y., Peng, S., Ducharne, A., Ciais, P., Gumbricht, T., Jimenez, C., et al. (2022). Gridded maps of wetlands dynamics over mid-low latitudes for 1980–2020 based on TOPMODEL. Sci. Data 9, 347. doi:10.1038/s41597-022-01460-w
Yuan, F., Wang, Y., Ricciuto, D. M., Shi, X., Yuan, F., Hanson, P. J., et al. (2021). An integrative model for soil biogeochemistry and methane processes. II: warming and elevated CO2 effects on peatland CH4 emissions. J. Geophys. Res. Biogeosciences 126, e2020JG005963. doi:10.1029/2020JG005963
Yue, X., and Unger, N. (2015). The Yale Interactive terrestrial Biosphere model version 1.0: description, evaluation and implementation into NASA GISS ModelE2. Geosci. Model Dev. 8, 2399–2417. doi:10.5194/gmd-8-2399-2015
Yue, X., Unger, N., and Zheng, Y. (2015). Distinguishing the drivers of trends in land carbon fluxes and plant volatile emissions over the past 3 decades. Atmos. Chem. Phys. 15, 11931–11948. doi:10.5194/acp-15-11931-2015
Zhang, Y., Jacob, D. J., Lu, X., Maasakkers, J. D., Scarpelli, T. R., Sheng, J.-X., et al. (2021a). Attribution of the accelerating increase in atmospheric methane during 2010–2018 by inverse analysis of GOSAT observations. Atmos. Chem. Phys. 21, 3643–3666. doi:10.5194/acp-21-3643-2021
Zhang, Z., Fluet-Chouinard, E., Jensen, K., McDonald, K., Hugelius, G., Gumbricht, T., et al. (2021b). Development of the global dataset of wetland area and dynamics for methane modeling (WAD2M). Earth Syst. Sci. Data 13, 2001–2023. doi:10.5194/essd-13-2001-2021
Zhang, Z., Poulter, B., Feldman, A. F., Ying, Q., Ciais, P., Peng, S., et al. (2023). Recent intensification of wetland methane feedback. Nat. Clim. Change 13, 430–433. doi:10.1038/s41558-023-01629-0
Zhang, Z., Zimmermann, N. E., Stenke, A., Li, X., Hodson, E. L., Zhu, G., et al. (2017). Emerging role of wetland methane emissions in driving 21st century climate change. Proc. Natl. Acad. Sci. 114, 9647–9652. doi:10.1073/pnas.1618765114
Zhu, Q., Liu, J., Peng, C., Chen, H., Fang, X., Jiang, H., et al. (2014). Modelling methane emissions from natural wetlands by development and application of the TRIPLEX-GHG model. Geosci. Model Dev. 7, 981–999. doi:10.5194/gmd-7-981-2014
Zhu, Q., Peng, C., Chen, H., Fang, X., Liu, J., Jiang, H., et al. (2015). Estimating global natural wetland methane emissions using process modelling: spatio-temporal patterns and contributions to atmospheric methane fluctuations. Glob. Ecol. Biogeogr. 24, 959–972. doi:10.1111/geb.12307
Keywords: wetland, methane, climate change, CO2 fertilization, YIBs model
Citation: Hu Y, Yue X, Tian C, Zhou H, Fu W, Zhao X, Zhao Y and Chen Y (2023) Identifying the main drivers of the spatiotemporal variations in wetland methane emissions during 2001–2020. Front. Environ. Sci. 11:1275742. doi: 10.3389/fenvs.2023.1275742
Received: 10 August 2023; Accepted: 12 October 2023;
Published: 25 October 2023.
Edited by:
Zhiyuan Hu, Sun Yat-sen University, ChinaReviewed by:
Xiao Lu, Sun Yat-sen University, ChinaZhenzhong Zeng, Southern University of Science and Technology, China
Copyright © 2023 Hu, Yue, Tian, Zhou, Fu, Zhao, Zhao and Chen. This is an open-access article distributed under the terms of the Creative Commons Attribution License (CC BY). The use, distribution or reproduction in other forums is permitted, provided the original author(s) and the copyright owner(s) are credited and that the original publication in this journal is cited, in accordance with accepted academic practice. No use, distribution or reproduction is permitted which does not comply with these terms.
*Correspondence: Xu Yue, eXVleHVAbnVpc3QuZWR1LmNu