
94% of researchers rate our articles as excellent or good
Learn more about the work of our research integrity team to safeguard the quality of each article we publish.
Find out more
ORIGINAL RESEARCH article
Front. Environ. Sci., 05 February 2024
Sec. Atmosphere and Climate
Volume 11 - 2023 | https://doi.org/10.3389/fenvs.2023.1272155
This article is part of the Research TopicCrucial Air Quality, Atmospheric Environment, and Climate Change in Low- and Middle-Income CountriesView all 8 articles
 Adil Dilawar1,2
 Baozhang Chen1,2,3*Zia Ul-Haq4
 Shahbaz Ali2,5Meer Muhammad Sajjad1,2
 Fang Junjun1,2Twekel M. Gemechu1,2
 Man Guo6Hamza Dilawar7Huifang Zhang1,2
 Zheng Zicheng1,2Ehtisham Lodhi8,9
Evaluating the potential impacts of land use and land cover change (LULCC) and climate change on air pollution is crucial to unravel the driving forces and mechanisms behind changes in air quality. A multi-faceted approach was adopted, including a land change model (LCM) and Mann–Kendall (MK) test, to evaluate the transition of land cover type, changes in climate, and atmospheric pollutants during 2004–2021 in Pakistan. Moreover, a multiscale geographically weighted regression (MGWR) model and a mathematical model were used to assess the potential contribution of LULCC and climate dynamics to atmospheric pollution. It was revealed that during 2004, croplands covered an area of 9.72 × 10⁴ mile2, accounting for 38% of the total area. However, the area of the croplands increased to 10.1 × 10⁴ mile2, accounting for 40% of the total area in 2021. The MK test showed that the north and west–south regions significantly experienced air pollution, with the increasing trend for nitrogen dioxide (NO2) and sulfur dioxide (SO2) being 0.89× 10¹⁵ molecules/cm2 per year and 0.54 DU/year, respectively. For climate variability, mean precipitation (Precp) and mean surface pressure (SP) showed a prominent increasing trend, with a maximum value of 1 mm/year and 0.01 Kpa/year, respectively. The mean temperature maximum (Tmax) showed an increasing and decreasing trend, with the highest value of 0.28°C/year and 0.08°C/year, respectively. In the context of contribution, the conversion of cropland to grasslands increased the trend for SO2 concentrations. The highest increasing trend of 1.5 DU for ozone (O3) was found due to conversion of grasslands to shrublands. Additionally, regional climate played a significant role in making air pollution stagnant across the country. Precp and wind speed (WS) contributed significantly in escalating NO2 concentrations in Pakistan, while Precp contributed most (0.004 DU) to increasing SO2 concentrations. For O3, the most influential climate factor was Precp. These results on a long-term temporal scale demonstrated how maintaining climate variability through comprehensive land use management can help improve ambient air quality in Pakistan.
Air pollution is one of the most serious environmental threats to both human health and the world’s economies (Sánchez-Triana et al., 2014). It has also been regarded as one of the growing environmental problems in South Asian developing countries, such as Pakistan. Since 1990, massive land use and land cover change (LULCC), urbanization, rapid industrialization, and economic development have improved in Pakistan (Ali et al., 2022). Pakistan is the second fastest-growing country showing rapid urbanization and a steep record of growth in industries such as the energy and transportation sectors. It is the 33rd largest country in the world, with a population of more than 207.8 million.
Urban areas are the densest for anthropogenic activities, and maximum air pollutant concentrations accumulate in the atmosphere. During the last two decades, transportation and industrial emissions have been the major air pollution contributors in Pakistan (Shahid et al., 2015); however, a new significant contributor has emerged—fossil fuel consumption in thermal power plants (Alkon et al., 2019). Similarly, in major cities of South Asia, air pollutant concentrations are significantly deteriorating the ambient air quality and human health in the metropolitan cities of Pakistan (Pilarczyk et al., 2019; Fatmi et al., 2020). The population in the urban centers is highly exposed to the effects of air pollution. Among all the air pollutants, particulate matter (PM) with an aerodynamic diameter of approximately 2.5 µm (PM2.5) has been regarded as extremely harmful to human health. Long-term exposure to high concentrations of PM2.5 dramatically increases health problems such as cardiovascular diseases, lung cancer, and respiratory problems. The health burden of exposure to PM2.5 concentrations on an annual basis is higher than 10 μg/m3. However, this threshold value was set by the WHO. According to the WHO, PM and nitrogen dioxide (NO2) concentrations were higher than the threshold value (Colbeck et al., 2010), and a higher mortality rate due to air pollution was noted, with 200 mortalities for a population of 100,000 in Pakistan. The concentrations of sulfur dioxide (SO2) increased by 78% from 2005 to 2016 in Pakistan (Jabeen and Khokhar, 2019).
The solid and liquid particles suspended in the air are very complex and are known as atmospheric aerosols (Leonardi et al., 2020). The main sources of air pollution in Pakistan are power plants, transportation, petroleum factories, refineries, and increasing industries. The northeast region of Pakistan has severe air pollutant concentrations due to the industrial zone (Tabinda et al., 2020; Malhi et al., 2022), and likewise, India has stagnant pollution over Chandigarh, Bathinda, Amritsar, and Nangal cities (Raja et al., 2010). Different studies explored the air pollution situation in different areas of Pakistan with limited objectives. Lahore is the second most polluted city in Pakistan. A study by Lodhi et al. (2009) explored the PM2.5 concentrations across Lahore from 2005 to 2006. It showed that road dust (18%), primary industrial emissions (26%), and secondary aerosols (51%) contributed to severe PM2.5 in Lahore (Lodhi et al., 2009). Alam et al. (2014) revealed that PM10 concentrations varied between 254 and 555 during March 2010 in Lahore (Alam et al., 2014). Urban air pollution mainly consists of SO2, NO2, ozone (O3), and a mixture of carbon monoxide (CO), volatile organic matter, and suspended particulate matter (SPM) (Kaliyaperumal and Sharma, 2021; Joshi, 2023). These air pollutants are emitted from the combustion of fuel in industries and vehicles. In urban areas, photochemical oxidants including NO2 and O3 are the major concern among air pollutants because they are capable of deteriorating the environment and human health, respectively (Maring et al., 2023; Norazrin et al., 2023). NO2 plays the role of primary pollutants in atmospheric chemistry in the formation of secondary pollutants such as nitrate aerosols, peroxyacetyl nitrate (PAN), and tropospheric O3 (Sun et al., 2018; Feng et al., 2020). These pollutants reduce visibility in the atmosphere by absorbing radiation and have the potential to enforce global warming by unbalancing the radiation budget.
The climate of Earth is undergoing substantial change, mainly due to anthropogenic activities. Climate change is a worldwide phenomenon that has become more obvious in the last three decades (Destek and Sarkodie, 2019; Tang, 2019). There has been increasing interest in examining the impacts of climate change, which is a global phenomenon. As reported by the Fifth Assessment Report from the Intergovernmental Panel on Climate Change (IPCC), global land and ocean temperatures increased by 0.85 C between 1880 and 2012 (Ira, 2018). Air pollution is a prime concern across the globe due to human activities and adverse meteorological conditions (Kumari and Toshniwal, 2020; Agarwal et al., 2021). Climate change and air pollution are intrinsically linked. Radiative forcing (RF) induced the present-day atmospheric and climate system perturbation due to changes in different atmospheric pollutants (Christensen et al., 2022). In the context of climate change, air pollutants are perturbing the amount of incoming sunlight that is absorbed or reflected by the atmosphere. They have significant impacts on climate change. Anthropogenic emissions are contributing to adverse meteorological conditions (Fu et al., 2021).
Moreover, air pollutants alter the surface climate including the precipitation and temperature patterns (Falloon and Betts, 2010). Ramanathan et al. (2005) and Sillmann et al. (2017) studied the impact of aerosols on precipitation pattern changes and concluded that air pollutants significantly alter the precipitation pattern, including the monsoon cycle, across the world (Sillmann et al., 2017; Gautam et al., 2022).
Anthropogenic activities such as the release of greenhouse gases (GHGs), aerosols, and changes in land use have altered the Earth’s radiative balance and albedo. LULCC has the power to influence external forces on the atmosphere as well as natural and anthropogenic emissions of air particles. In addition, it affects the formation, migration, and movement of primary and secondary air pollutants (Zhou et al., 2016). Previously, the relationship between air pollution variation and land cover changes was investigated, revealing that urban expansion and cultivated land are increasing PM2.5, while forests serve as a contributing factor in reducing PM2.5 (Superczynski and Christopher, 2011; Zou et al., 2016; Lu et al., 2020; Xu et al., 2021; Ding et al., 2022). Generally, LULCC has shown that an urbanized environment, such as high-density buildings, contributes to increasing atmospheric pollutant concentrations, but low-density buildings are taking part in significantly reducing the atmospheric pollutant concentrations (Jiang et al., 2023). The northern region of Pakistan exhibited a long-term trend in the intensification of regional climate in tropical regions because of extreme deforestation in the area, which indicates the importance of vegetation cover in regulating aerosols and climate interactions from 1980 to 2018 (Chakraborty and Lee, 2019).
Pakistan has the highest urban population in South Asia, at 36.4%, surpassing that of Bangladesh, at 35.1% (Pasha, 2018). The uncontrolled expansion and densification of urban areas can disrupt the balance between impervious surfaces and green spaces, leading to the emergence of the surface urban heat island (SUHI) effect. This phenomenon is frequently observed in modern cities worldwide, contributing to the broader issue of global urban heat islands (UHIs) (Sadik-Zada and Gatto, 2022). The meteorological characteristics of an area undergo degradation due to urbanization, resulting in increasing air temperatures, reducing rainfall, increasing relative humidity, and increasing energy consumption (Arshad et al., 2019; Dilawar et al., 2021a; Dilawar et al., 2021b; Ali et al., 2020; Ali et al. 2021; Ali et al. 2023; Dilawar et al., 2021c). Riaz et al. (2014) revealed that Lahore’s urban land area increased from 33.28% (58,977 ha) in 1972 to 55.97% (99,173 ha) in 2009, accompanied by a proportional decrease in green cover during the same timeframe (Riaz et al., 2014). Similar LULCC patterns were also observed in studies by Bhatti et al. (2015) and Akhtar et al. (2020). These substantial transitions in Lahore’s urban landscape led to a significant increase in the average surface temperature in summer by 0.7 C and an annual temperature rise of 0.021 C from 1981 to 2013 (Arshad et al., 2022). Humbal et al. (2023) investigated anthropogenic influences on urban climate by emphasizing the impact of urbanization on the land surface temperature (LST) pattern in Pakistan (Humbal et al., 2023). Dilawar et al. (2021a) extended the study to evaluate the influence of urbanization on the SUHI in six major cities of the Punjab province in Pakistan. The findings consistently revealed a decline in vegetation cover at the expense of urbanization in all cities, contributing to a noticeable increase in SUHI over time (Dilawar et al., 2021a).
The occurrence of stagnant air pollution episodes in Pakistan shows that there is still a gap in understanding the driving factors of air pollution. In the current study, we focused on two prominent drivers: LULCC and climatic factors. To know how differently they affect air pollution changes, we aim to gain insights into their distinct contributions. There is a significant need to explore the impact of LULCC and climatic factors on air pollution dynamics, particularly in Pakistan. However, there is still a lack of a comprehensive methodology framework to investigate the association of air pollution with LULCC and regional climate variables. Developing such a framework is essential for effective air pollution control and management in Pakistan. Therefore, this study aims to bridge this gap and provide important insights into the complex relationships between air pollution and driving factors such as LULCC and climate change. It would be helpful to understand the human contribution toward the increase in air pollution and develop sustainable cities and the environment. To fully understand the air pollution control mechanisms and apply the policies adequately, it would be helpful to clarify the challenges associated with it. The current study comprehensively estimates the potential impacts of LULCC and regional climate change on air pollution variations during 2004–2021 in Pakistan by covering the following objectives:
1. To identify the long-term variability of air pollutants and evaluate the comprehensive changes in air pollution severity
2. To determine the long-term trend of climate factors (precipitation, surface pressure, wind speed, temperature minimum, and temperature maximum) in compliance with pollution control
3. To evaluate the land use transitions during 2004–2021
4. To compute the potential impacts of LULCC and regional climate dynamics on air pollution patterns over the past two decades at the national level in Pakistan.
Pakistan is situated in South Asia and is located north of the equator at ranges of 23.5◦N–37◦N and 61◦E−77◦E, respectively (Figure 1). It covers an area of approximately 796,096 km2 and has a population >212 million. According to Koppen ¨ and Geiger’s classification, the climate of Pakistan is semi-arid and sub-tropical, having four seasons, namely, winter (December–February), spring (March–May), summer (June–August), and autumn (September–November). Approximately 60% of the total annual rainfall is received by the country due to the summer monsoon cycle. The variant topography, along with its complex climate, makes Pakistan a unique region for the study of the spatial and temporal distributions of aerosol patterns (Alam et al., 2016). Pakistan’s gross domestic product (GDP) was at US$ 488 billion in terms of purchasing power parity (PPP). Since 1990, an industrial revolution has led to an increase in Pakistan’s annual energy requirements. At the same time, the significant expansion of economic activities caused GHG emissions, deteriorating the local air quality. In line with the priorities of many developing countries, the Government of Pakistan has predominantly concentrated on achieving self-sufficiency in food production, meeting energy demands, and addressing the challenge of rapid population growth. This focus has taken precedence over initiatives aimed at reducing emissions or mitigating environmental hazards. Furthermore, the government unveiled the National Environmental Policy (NEP) in 2005 as part of its efforts toward sustainable development (MOE, 2005).
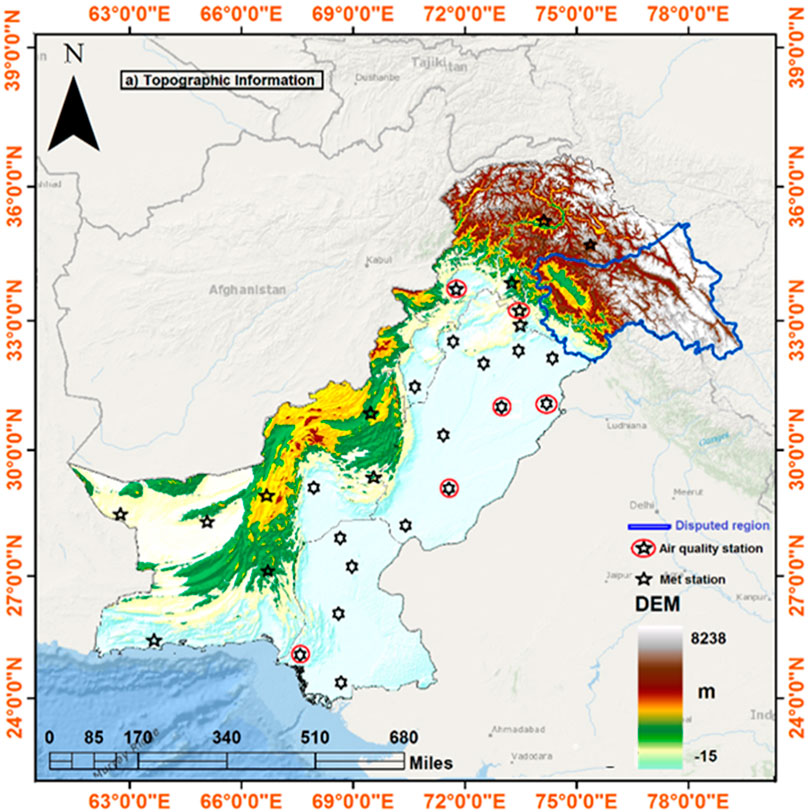
Figure 1. Study area with topographic information.
In the context of remedial measures, the Environmental Kuznets Curve (EKC) has gained significant attention (Sadik-Zada and Gatto, 2023). This hypothesis establishes a connection between economic growth and changes in environmental pollution (Sadik-Zada and Ferrari, 2020). The hypothesis is that as economy levels initially increase, there is a tendency for deterioration in environmental conditions due to the multiplication of economic activities, leading to more pollution (Sadik-Zada and Gatto, 2021). However, once income levels and economic growth reach a certain level, the environment begins to improve. This observed trend in the public and economy is understood as an inverted U-shaped relationship, which is known as the EKC hypothesis. It is noteworthy that the EKC is considered a long-term phenomenon in the context of Pakistan (Rauf et al., 2018). Interestingly, among various explanatory variables, population density is a major contributor to environmental degradation in Pakistan. Hence, controlling population growth is recognized as a crucial factor (Ahmed et al., 2012).
Because of the spatial scarcity of a consistent distribution of site stations, accurate assessment of air pollution and meteorological factor distribution and their relationships is challenging in Pakistan. Under certain conditions, satellite and reanalysis data provide a significant opportunity to assess these phenomena. Many studies explored the long-term variation of air pollutants and their interaction with climate factors using Ozone Monitoring Instrument (OMI) satellite data. OMI was used for a variety of studies, for example, to study the relationship between air pollutants (NO2, O3, SO2, and CO) and meteorological factors over Bangladesh (Rahman et al., 2022) and to analyze the NO2 and SO2 trends (Duncan et al., 2013). Aura and Terra satellite-based OMI (https://giovanni.gsfc.nasa.gov/, accessed on 12 September 2022) measured data of four air pollutants, namely, aerosol optical depth (AOD representing PM), NO2, SO2, and O3 (Lamsal et al., 2021). ERA-Interim and its new version ERA5 datasets are global reanalysis data simulated by the European Center for Medium-Range Weather Forecasts (ECMWF). These reanalysis datasets include many climate state variables and provide ideal data for investigating climate changes and improving water resource policies (Muñoz-Sabater et al., 2021). For example, the hydrological regime of the Gilgit Basin was studied using ERA5 in Pakistan (Nazeer et al., 2022). Five meteorological parameters (Precp, SP, WS, Tmax, and Tmin) were obtained from the Fifth Generation (ERA5) ECMWF atmospheric reanalysis data (https://www.ecmwf.int/en, accessed on 28 September 2022) (Lees et al., 2021; Assamnew and Mengistu Tsidu, 2023), as provided in Table 1. Moreover, the Moderate-Resolution Imaging Spectroradiometer (MODIS) land cover with 500 m resolution is available from 2000 to 2020 (Sulla-Menashe and Friedl, 2018). However, these datasets have the potential for mapping LULCCs and the comprehensive evolution of transitions among the major land use classes in the present study area. Therefore, the present study adopted the application of long-term high-resolution RS data and multifaceted methodologies to monitor the dynamics in major land cover classes, regional climate variability, and air pollution distribution over Pakistan.
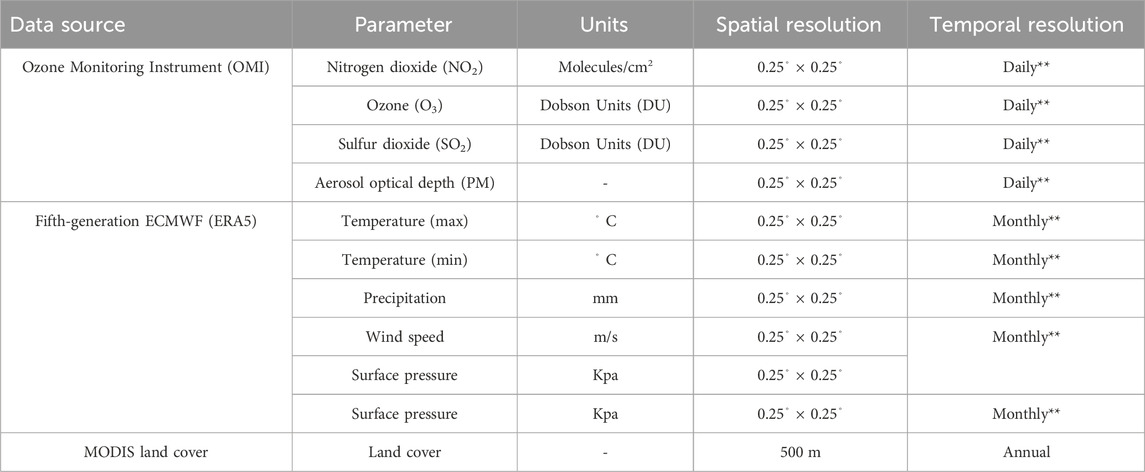
Table 1. Detailed information on data used in the current study. Note: ** Data were averaged into annual values.
In the present study, we have used two statistical approaches (non-parametric) to determine whether meteorological factors and air pollution have an increasing, decreasing, or no trend. The Mann–Kendall (MK) test was employed to identify the trends in meteorological factors and air pollutants. These techniques were widely used to analyze the climate and air pollution parameters in particular.
The aforementioned air pollution and meteorological data were evaluated to detect the spatial–temporal variation over Pakistan using two methods: a non-parametric MK test and Sen’s slope, which were calculated for the negative and positive magnitude of trends to find the slope value to detect the trend changes in meteorological factors and air pollutants in Pakistan. The MK test was used for the inhomogeneous time-series data to illustrate the spatial and temporal patterns, and the Zmk test statistic was used (Mann, 1945). The following mathematical equations were used to calculate the MK statistics V(S), S, and standardized test statistics Z:
where n is the length of time, tp is the tied value for the pth value, and q is the number of tied values, while Xi and Xj are the data values in chronological order. In the current study, the significance of the trend was tested at the Z-critical value of 1.96 with a significance level of 0.05. The null hypothesis of no trend must satisfy the condition if −1.96 > ZMK >1.96.
Markov chain analysis is usually used for the cross-tabulation using the LCM to quantify the change in each land cover type in mile2, gains, and losses between 2004 and 2021. It is mainly helpful to observe the transition potential between the initial and final states as well as the transition trends between the land-use states. To simulate the land-use change, the Markov chain model generates the transfer matrix and transition probability matrix. The Markov model can be mathematically described as follows:
where ‘S’ represents the different states of land use at time t, S (t+1) is the land use state at time t+1, and the transition probability for the next stage will be
where
The MGWR model was extensively used in this study to evaluate the influence and contribution of LULCC and climate factors on air pollutants at the national scale in Pakistan. MGWR modeling is a type of regression modeling with geographically varying parameters, which is different from conventional regression modeling, and it is developed to obtain a higher performance in geographical analysis. In general, the MGWR model can be expressed by the following equation (Fotheringham et al., 2017; Li et al., 2020).
where APi is the dependent variable at the location i;
where
To calculate the spatial relation between the LULCC and air pollutant concentrations, the variations of air pollutants were calculated on each grid. The land change model was used to analyze the comprehensive land transition during 2004–2020. The most affected land cover classes were nominated based on their pixel values. An MGWR analysis was used to obtain the overall characteristics of LULCC and air pollution dynamics. Analysis was performed using a spatial analysis tool based on R_Studio.
The climatic impact of air pollution can be assessed using the following comprehensive differential Eq. 10.
Let air pollutants (
This equation represents the proportion of the variance in air pollutants, which is explained by climate parameters alone after controlling for the other climatic variables in the model. The contribution of the
In other words, the contribution of
The current study presented the spatiotemporal characteristics of climate variables and air pollutants from 2004 to 2021 through the OMI and ERA5 satellite data. To know the spatial characteristics, we performed a trend analysis on the average annual concentrations of air pollutants from 2004 to 2021. It was observed that PM, NO2, SO2, and O3 show heterogeneous trends across the study area. Figure 2 represents the most prominent increasing trend for the PM, which was 0.68 per year. It is caused by anthropogenic emissions associated with economic growth, including traffic flow and urbanization. The highest increasing trend for PM was recorded in central and southern regions of Pakistan. PM concentrations decreased in the north and central southeast regions of Pakistan, with the highest decreasing trend of 0.55. The main metropolitan cities of Pakistan experience spells of air pollution episodes.
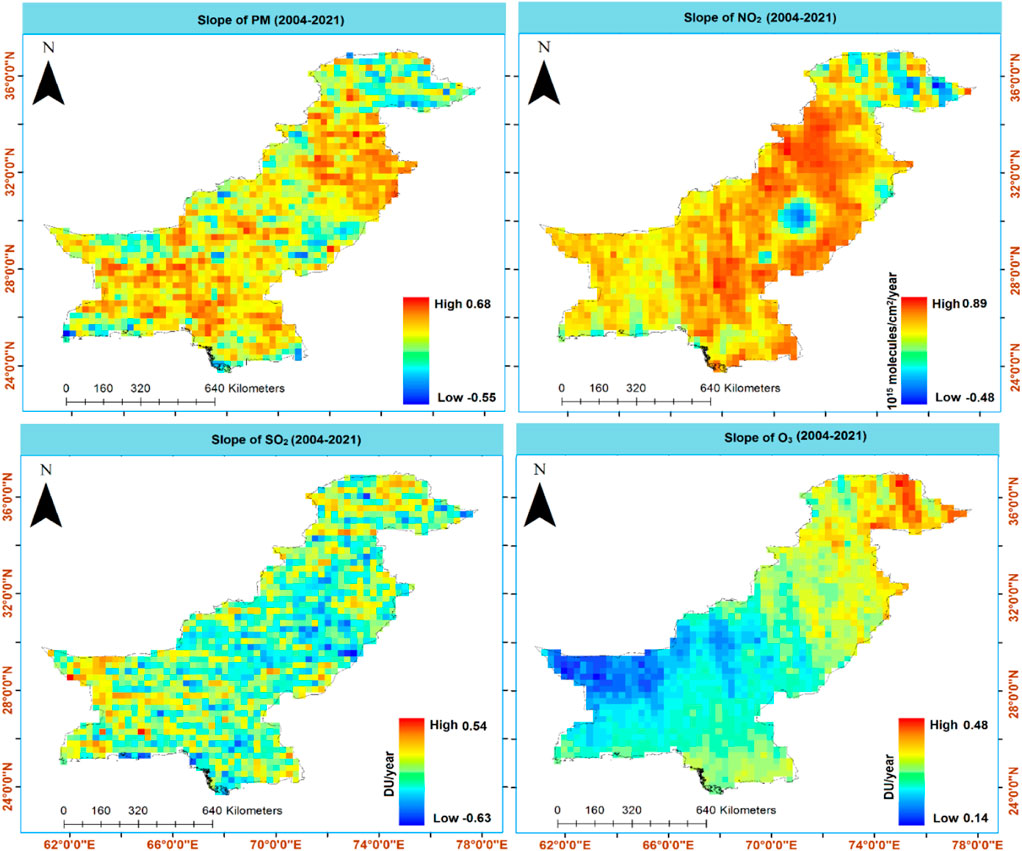
Figure 2. Trends in air pollutants over Pakistan during 2004–2021.
In the case of NO2 and SO2, the increasing trend was 0.89 × 10 15 molecules/cm2 per year and 0.54 DU/year during 2004–2021, respectively. Most parts of Pakistan are facing an increasing trend of NO2 emissions, but the highest increasing trend was found in the central, southcentral, and southeast regions of Pakistan. On the other hand, the north and particular parts of south Punjab showed a decreasing trend, and the highest decreasing trend was recorded at 0.48 × 10 15 molecules/cm2 per year for NO2 in Pakistan.
The SO2 spatial variation showed a mixed trend across the country but represented a clear increasing trend over Lahore city, Punjab, and the west–south region of Pakistan. Most of the areas in Pakistan showed a decreasing trend in SO2 emissions during 2004–2021. In the case of O3 trend concentrations, there were visible increasing and decreasing patterns over Pakistan. In addition, the north and west-south regions experienced the highest increasing and highest decreasing trends per year, respectively. The central region had a medium level of increasing O3 concentrations. According to the significance of the trend results, p-values were computed at 0.05 significance levels for all air pollutants during 2004–2021. The p-value showed a significant increasing trend of PM across the country. Similarly, the increasing and decreasing trends of other pollutants were highly significant over most of the study region, as illustrated in Figure 3, whereas a mixed trend of p-value variation was observed for SO2 and O3.
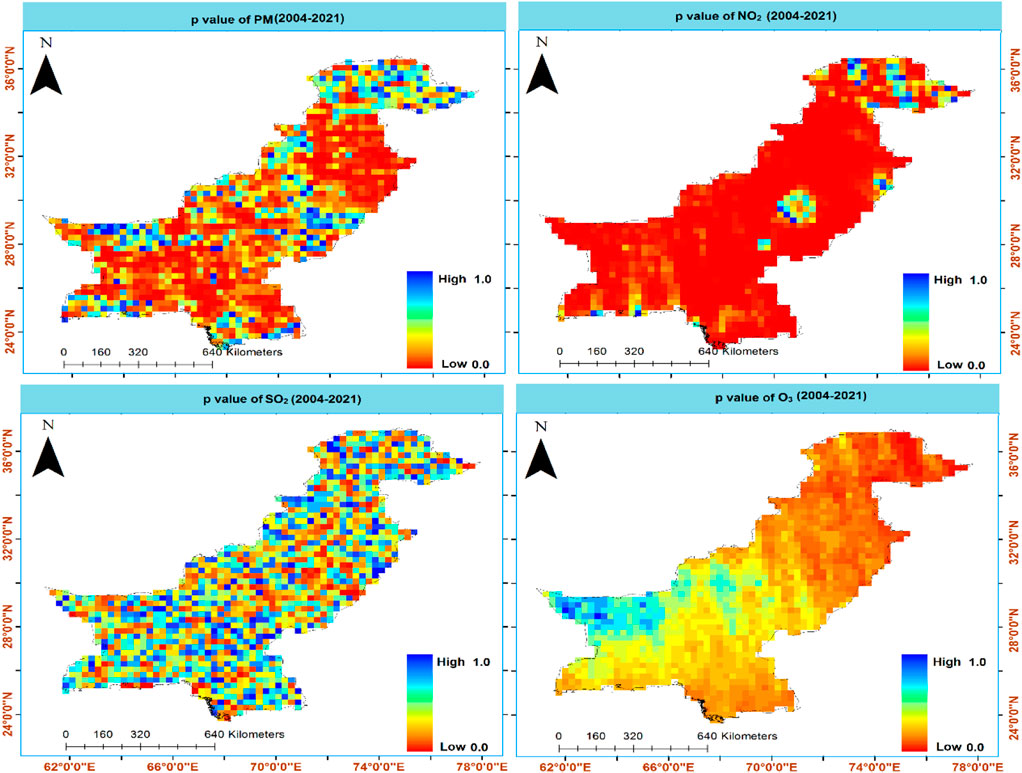
Figure 3. P-value of air pollutants over Pakistan during 2004–2021. Note: Mann–Kendall p-value at 95% confidence (p < 0.05).
As shown in Table 2, in 2004, the mainland type in Pakistan was shrublands, the area of which was 8.12 × 10⁴ mile2, accounting for 32% of the total area, followed by grasslands and croplands, accounting for 24.02% and 38.32%, respectively. Urban areas covered 3.5 × 10⁴ mile2, accounting for 1.3% of the total area. The areas of barren lands were very high, accounting for just 85%. In 2021, farmlands covered the second-largest area, and their area increased to 8.74 × 10⁴ mile2, accounting for 34.49% of the total area. The area of grasslands decreased by 5.9 × 10⁴ mile2, accounting for 23.48% of the total area, and became the third-largest land type. The area of croplands and urban lands increased, accounting for 40% and 1.4%, and their proportion increased to 9.56% and 9%, respectively.
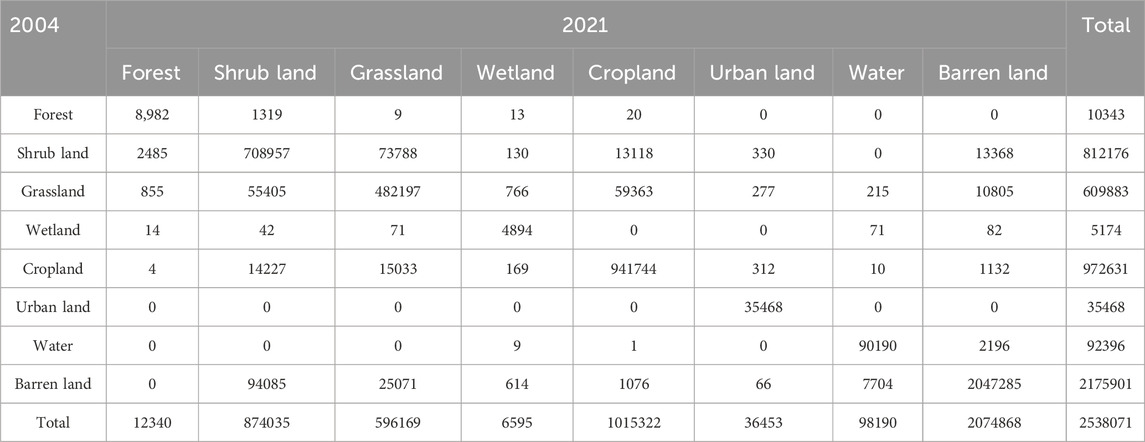
Table 2. Transitional matrix square per mile during 2004–2021.
From the perspective of land being converted from one type to another, there was a large conversion of shrublands to other land types, roughly 10.32 × 10⁴ mile2. Grasslands, croplands, and barren lands underwent significant amounts of change, accounting for 71%, 12.77%, and 12.95% of the total converted area, respectively. On the other hand, the other land types that were converted to shrublands accounted for 16.65 × 10⁴ mile2, which significantly increased the total area of shrublands. Grasslands were mainly converted to other land types such as shrublands, croplands, barren lands, and urban. The sources of grasslands were mainly shrublands, croplands, and barren lands. It was seen that the number of grasslands converted to other types and those converted to grasslands were nearly equivalent in total area. Croplands were converted to another major land type, roughly 3.0 × 10⁴ mile2. Shrublands, grasslands, urban lands, and barren lands underwent a visible amount of changes, accounting for 46%, 48%, 1%, and 3.6%, respectively. The main conversion sources of urban land were shrublands, grasslands, croplands, and barren lands, and the total conversion area was 0.98 × 10⁴ mile2, which was caused by rapid urbanization.
The relationship between the air pollutant dynamics and the different LULCC types was investigated using a spatial analysis tool. The results (Table 3) indicate that for all LULCC types, the mean air pollutant concentrations significantly increased from 2004 to 2021. During the study period, all types of land cover were increased, except barren land. In addition, shrublands and grasslands had the largest increase rates. Urban lands had the lowest increase rate among all lands. The increase trends indicate that the air pollution situation worsened during the study period. The increasing standard deviations (SDs) show that the spatial difference in air pollutant concentrations has increased. Indeed, the whole study area suffers from serious air pollution. Furthermore, we have analyzed the major land cover shifts based on their area during 2004–2021 across Pakistan and considered them for further analysis, as shown in Figure 4. In 2004, grasslands had the highest mean PM concentrations, although those of the barren lands had the second-highest mean value. Moreover, the urban area has the third-highest concentration among the selected land covers.
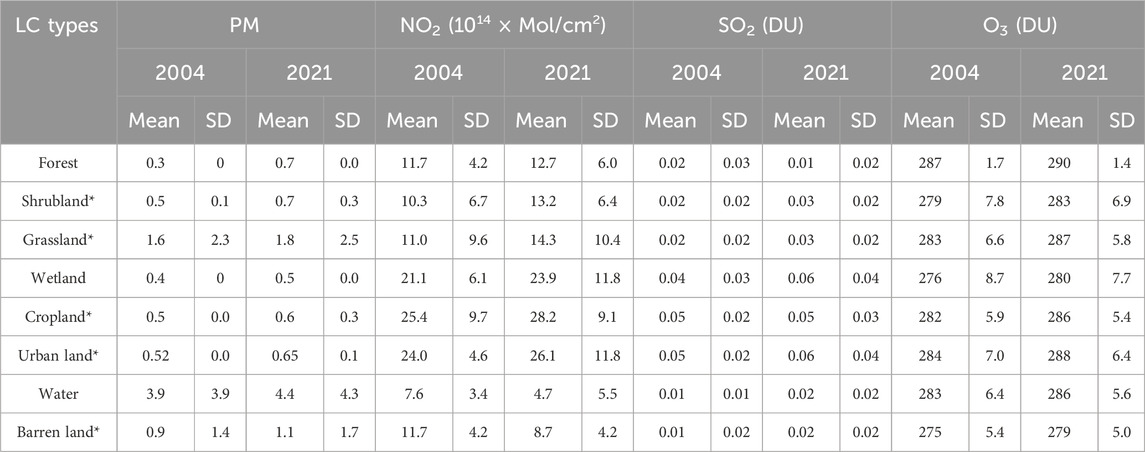
Table 3. Air pollutant concentrations of different LC types. Note: * major classes were used for analysis. SD, standard deviation.
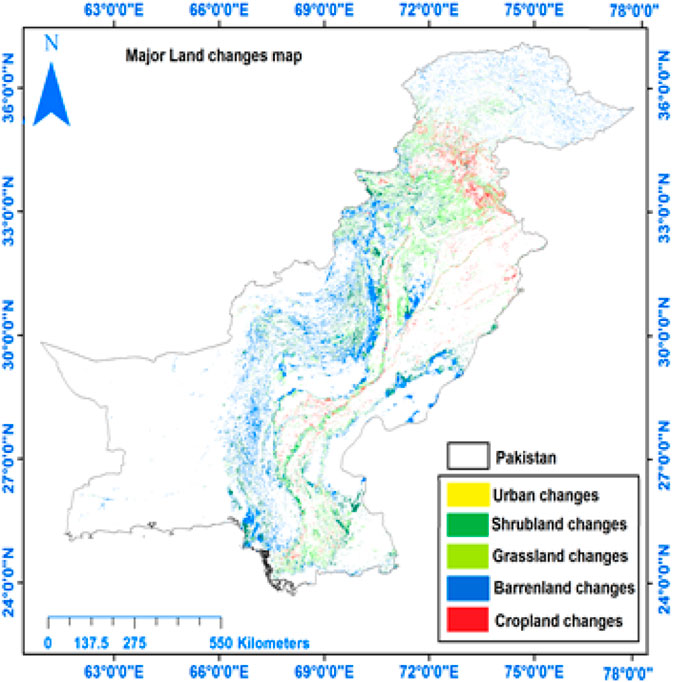
Figure 4. Major changes in land cover during 2004–2021 in Pakistan.
In 2021, the mean PM concentrations in the grasslands and barren lands were still high. The PM concentrations in the shrublands were still the third highest. In the case of NO2, croplands had the highest mean NO2 value, and urban lands had the second-highest mean value in 2004. The grasslands showed the third-highest mean value for NO2 concentrations. In 2021, croplands had the highest mean value, and urban land had the second-highest mean value. In addition, the NO2 concentrations of grassland had the third-highest mean value. The mean NO2 concentrations in the grasslands were 11.7, the third highest. In both years, the order of NO2 concentrations for the different LULCC types was the same: croplands > urban > grasslands, meaning that certain LULCC types had an important influence on the NO2 concentrations. However, the order of O3 concentrations for the different LULCC types was the same in both years: urban > grasslands > croplands > shrublands > barren lands, showing that the LULCC types greatly influenced the O3 concentrations.
We only considered the other five land types (shrublands, grasslands, croplands, urban, and barren lands) to ascertain the influence of the LULCC types on the air pollutant dynamics. As discussed above, air pollutant concentrations considerably increased from 2004 to 2021 for all land types, which indicated that pollutant concentrations would increase in non-LULCC areas. The increase was mainly caused by increased pollution levels, not by LULCC. This may affect our analysis. To avoid this disturbance, the variation range of pollutant concentrations in non-LULCC areas was calculated first (Table 4) and set as the reference variation range when analyzing the air pollutant concentration variation in the LULCC areas.
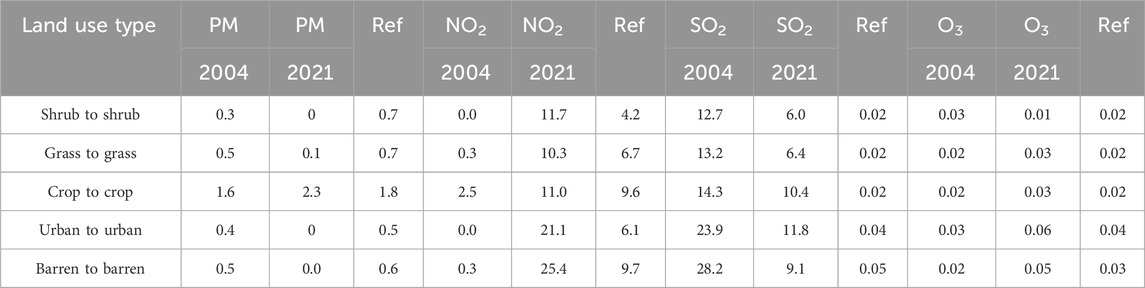
Table 4. Dynamic air pollutant concentrations for non-LULCC types.
As shown in Table 4, the PM dynamics in response to different LULCC transitions showed two opposing variations with increasing and decreasing trends. The largest increase was for barren lands converted to croplands, while the largest decline was for barren lands converted to wetlands. In the case of PM concentrations, six transitions showed a decreasing trend, with a range from 0.6 to 0.1 (Figure 5). Moreover, there was a decreasing trend in the conversion of grasslands to barren lands and wetlands, while croplands converting to grasslands and barren lands converting to grasslands also showed a negative trend. When barren lands were converted to shrublands and urban lands, PM concentrations increased to their highest values as per the PM trend. In addition, increasing trends were seen when grasslands were converted to urban, wetlands, and shrublands. Moreover, some land change transitions showed no trend, such as shrublands to barren lands and shrublands to grasslands.
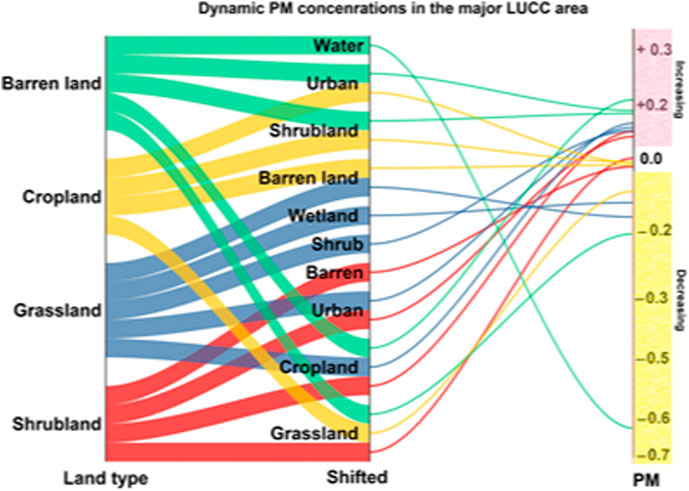
Figure 5. Land change transition vs. PM dynamics per year during 2004–2021.
Herein, NO2 and LULCC data were used to explore the air pollutant dynamics. An MGWR model is a spatial method that is used for detailed analysis. It concluded that all the land use transitions supported an increase in the NO2 trend during 2004–2021. The NO2 dynamics in response to different LULCC transitions showed an increasing trend only. The largest increase was for croplands converted to barren lands, urban lands, and grasslands, while the lowest increasing trend was for barren lands converted to wetlands, urban land, shrublands, croplands, and grasslands. In the case of NO2 concentrations, eighteen transitions occurred, and all of them contributed to increasing NO2 concentrations. Transitions from croplands and barren lands showed the highest increasing and lowest increasing trend, respectively (Figure 6). Moreover, conversions of grassland and shrublands to other land types showed a medium increasing trend in NO2 concentrations. The highest and lowest increasing trends were 0.026 and 0.0035 DU, respectively.
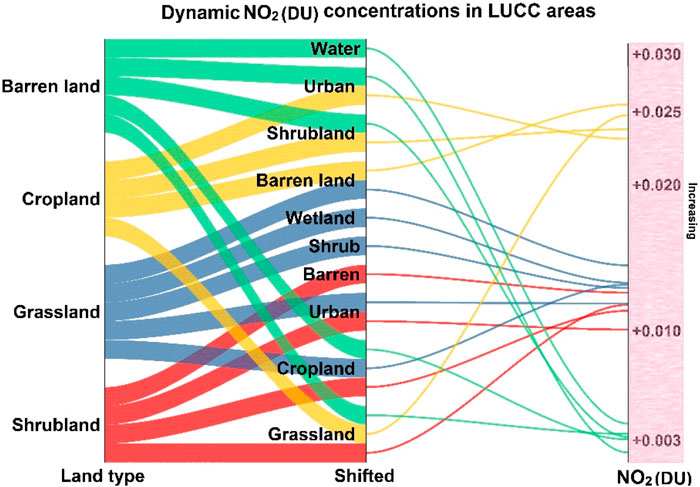
Figure 6. Land change transition vs. NO2 dynamics per year during 2004–2021.
As shown in Figure 7, the SO2 dynamics in response to different LULCC transitions showed two opposing variations with increasing and decreasing trends. The largest increase was for grassland converted to shrublands with a magnitude of 0.02 DU, while the largest decrease was for barren lands converted to croplands with a magnitude of 0.01 DU.
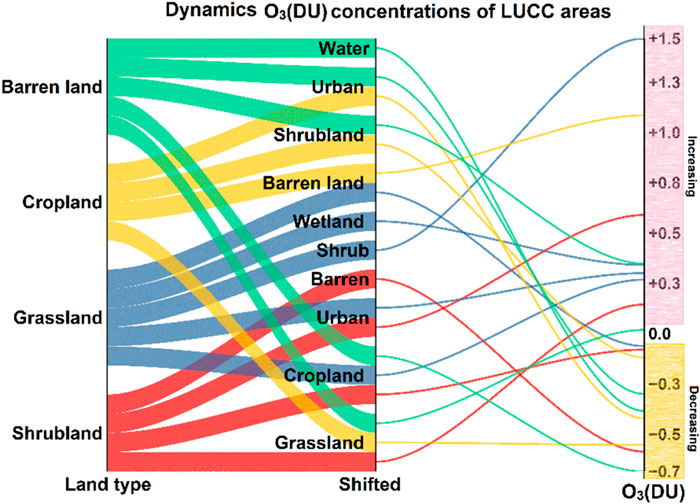
Figure 7. Land change transition vs. SO2 dynamics per year during 2004–2021.
In the case of SO2 concentrations, nine transitions showed a decreasing trend, with a range from 0.0 to 0.01 (Figure 7). Moreover, conversion of cropland to grasslands and that of barren lands to urban lands showed the second-highest increasing and lowest decreasing trend, respectively. Some land change transitions showed no trend, such as barren lands to shrublands and barren lands to grasslands. All transitions took part in increasing and decreasing the SO2 concentrations, with a range from 0.02 to 0.01 DU in magnitude.
The largest increase was for grasslands converted to shrublands, while the highest decreasing trend was for barren lands converted to croplands, with trend values of 1.5 DU and 0.7 DU, respectively. In the case of O3 concentrations, the majority of transitions took part in increasing O3 concentrations. Some of the transitions showed no trend, such as barren lands to grasslands and grasslands to barren lands. Moreover, conversions of grassland and barren lands to other lands showed a medium increasing trend (0.4 DU) for O3 concentrations. The highest increasing and decreasing trends were 1.5 DU and 0.7 DU, respectively. O3 and LULCC data were used to explore the air pollutant dynamics. An MGWR spatial method was used for detailed analysis, as shown in Figure 8. It resulted in all the land use transitions supporting an increasing trend for the O3 concentrations, while the rest of the half supported a decreasing trend for O3 concentrations during 2004–2021. The transitions that were escalating the O3 concentrations ranged in magnitude from 0 to 0.6 DU. Only two transitions accounted for the highest positive trend, with values of 1.5 and 1.2 DU. In the case of reducing the O3 concentrations, major land cover transitions contributed to the decrease in O3 concentrations within the range of 0.3–0.7 DU.

Figure 8. Land change transitions vs. O3 dynamics per year during 2004–2021.
Figure 9 shows the spatial variation of the trend for the climatic parameters, including Precp, SP, WS, Tmax, and Tmin. In general, the trend was increasing for all parameters across the study region. Precp showed a prominent increasing trend in the central and southern parts of Pakistan, with a maximum value of 1 mm per year. On the other hand, precipitation showed a decreasing trend in the north of Pakistan, with a maximum decreasing value of 18 mm per year. The SP showed a maximum increasing trend of 0.01 per year while decreasing by 0.0038 Kpa per year. The maximum increasing trend was observed in the northern region of Pakistan, while the decreasing trend was observed in the central region of Pakistan. The WS trend was also increased but was prominent in the north, central south, southeast, and southwest parts of Pakistan, where its value increased by 0.04 m/s per year during 2004–2021. However, a prominent decreasing trend was found along the central and some points in the southern regions and showed a maximum decreasing value of 0.02 m/s per year in Pakistan.
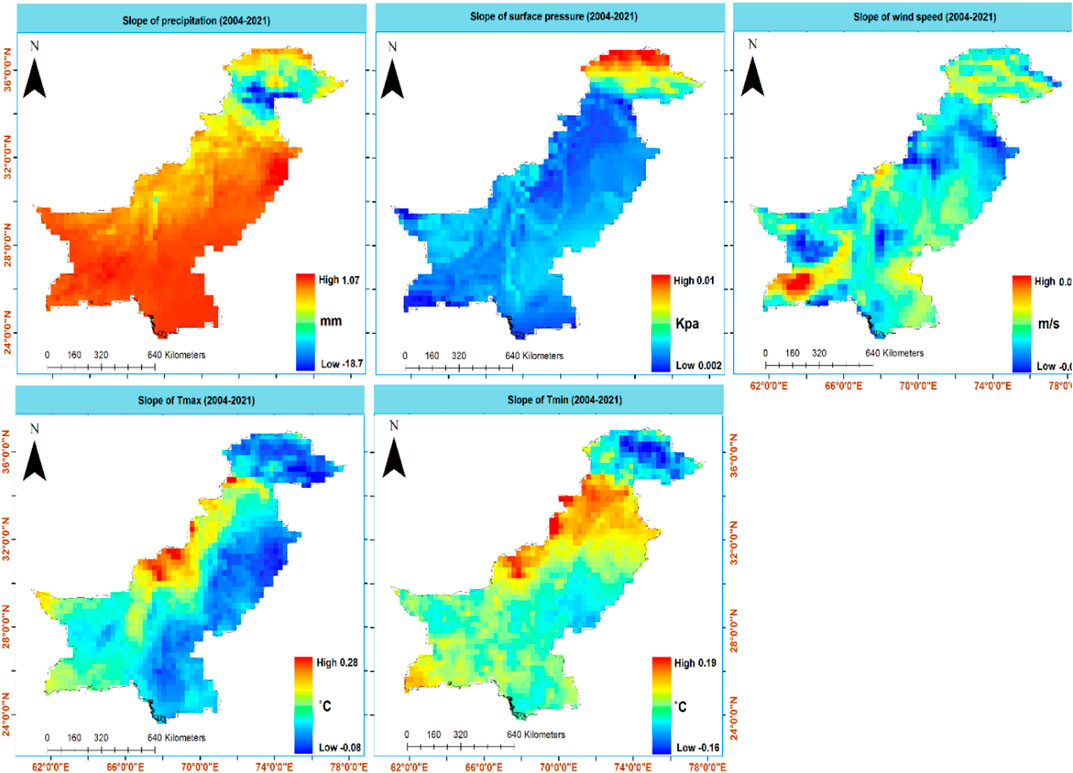
Figure 9. Trends in climatic variables during 2004–2021 for Pakistan.
In the case of Tmax, the trend was increasing and decreasing in the west and south along the border with Afghanistan, with the highest increasing value being 0.28°C/year and the decreasing value being 0.08°C/year. Generally, the Tmax was reduced in most parts of the country, as shown in Figure 9. The maximum decreasing and increasing trends for Tmin were 0.16°C/year and 0.19°C/year during 2004–2021, respectively. The northern, central, and southern regions of Pakistan have been exposed to increasing Tmin during the last 20 years. The trend variation in all parameters including Precp, SP, WS, Tmax, and Tmin was highly significant at p < 0.05 across the study area.
The impact and contribution analysis of air pollutants was investigated using the MGWR model and mathematical models. Using the output from the differential equations, we performed a spatial distribution analysis on the outputs from the differential equations to investigate the influence of climate on air pollution concentrations in Pakistan.
The spatial characteristics of contribution of climate to air pollutant (PM) patterns for the period 2004–2021 are represented in Figure 10. Higher positive values showed a greater influence on increasing PM in Pakistan. For example, Precp had a positive contribution in most parts of the country, except the northern region. The positive relationship means Precp contributed to the increase in PM, reaching its highest value of 10 by changing the per-unit Precp. On the contrary, a mixed decreasing contribution was shown, but in the northern region, Precp caused a decrease in PM pollution with a maximum value of −12 by unit change in the Precp amount in Pakistan. In the case of SP and WS contributions, their contribution patterns were almost the same. SP affected the PM concentrations significantly more than WS. Both SP and WS showed a decreasing contribution of PM pollution in the northern region, with the highest values of −0.33 and −0.04, respectively. In contrast, SP and WS supported the PM concentrations in most parts of the country, with maximum positive contributions of 0.40 and 0.01, respectively. Tmax and Tmin positively contributed to the increase in PM concentrations, particularly in the central region of Pakistan.
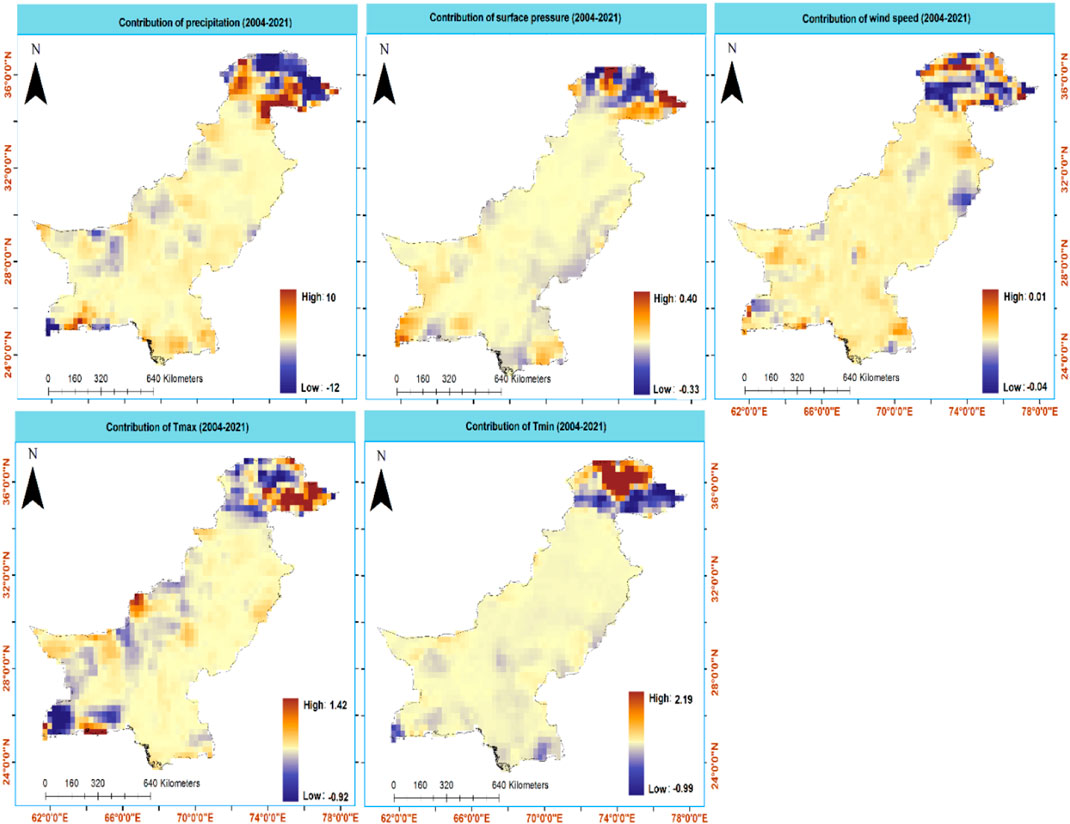
Figure 10. Contribution of climatic factors to PM pattern changes over Pakistan during 2004–2021.
Moreover, Tmin affected PM concentrations more than Tmax across Pakistan.
Figure 11 shows the spatially interpolated geographical climate factor’s contribution to air pollutants (NO2). In the case of Precp, the south, north, northwest, and central north regions in Pakistan indicated the positive contribution of NO2 concentrations, while the south-central part showed a negative or decreasing trend with NO2. Higher positive values showed an increase in NO2 concentrations in Pakistan. NO2 concentrations were increased by 0.19 × 10 15 molecules/cm2 per year for every unit change unit in Precp while reducing the NO2 to 0.08 × 10 15 molecules/cm2 per year across the country. For example, SP had significant positive and negative contributions, ranging from 0.01–0.007, indicating that NO2 concentrations were increased by 0.007 × 10¹⁵ molecules/cm2 per year and reduced by 0.01 × 10 15 molecules/cm2 per year for every unit change in SP. NO2 and WS had a positive contribution in most parts of the country, except in a small portion of the central region of Pakistan. The positive relationship means WS contributed to an increase of 0.11 × 10 15 molecules/cm2 per year and a decrease of 0.08 × 10 15 molecules/cm2 per year by changing the unit WS. Tmax showed a decreasing contribution to NO2 concentrations in most parts of Pakistan. The highest decrease in NO2 concentrations was 0.007 × 10 15 molecules/cm2 per year while increase was 0.11 × 10 15 molecules/cm2 per year by the change in unit Tmax. In the central region, Tmax changes increase NO2 concentrations. The relationship between Tmin and NO2 concentrations showed an increasing and decreasing trend, but most regions of Pakistan showed a decreasing trend with NO2 concentrations. In the north and south parts of Pakistan, unit change in Tmin caused a sharp decline in NO2 concentrations by 0.03 × 10¹⁵ molecules/cm2 per year. The relationship was not clear in the central region of Pakistan from 2004 to 2021.
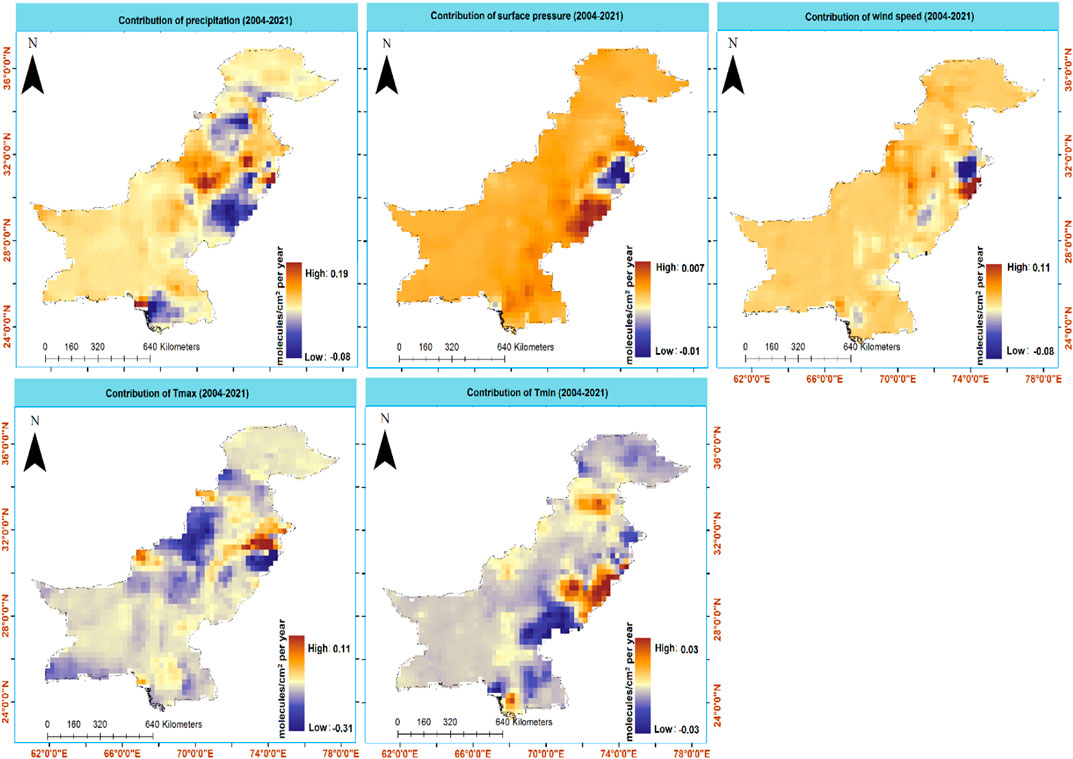
Figure 11. Contribution of climatic factors to NO2 (1015 × molecules/cm2 per year) pattern changes over Pakistan.
Figure 12 shows spatial maps of the contribution of climate factors to changing air pollution SO2 over Pakistan during 2004–2021. The contribution of SO2 and Precp was found to be increasing in the north, south, and central west regions of the study area, with a maximum contribution value of 0.004 DU, where the central, south, and southeast regions contributed negatively, with a maximum contribution value of −0.006 DU. The contribution relationship of SO2 with SP and WS showed an increasing and decreasing trend throughout Pakistan, with the highest increasing values of 0.005 DU for SP and 0.003 DU for WS except for the small areas in the central east and central south, with a maximum decreasing contribution of −0.0005 DU for SP and −0.0003 DU for WS during 2004–2021. The contribution relationship of SO2 and Tmax was increasing in most regions of Pakistan, with maximum values of 0.02 DU, whereas it had a decreasing association in the west central region, with the highest decreasing value of −0.006 DU. Moreover, Tmin and SO2 showed an increasing contribution relationship across most parts of the country, although there is a decreasing contribution relationship in small parts of the central south region of Pakistan. Overall, we concluded that Precp and WS were the most influential climate parameters for the SO2 concentrations across Pakistan, with the highest contribution values of 0.004 DU and 0.003 DU, respectively.
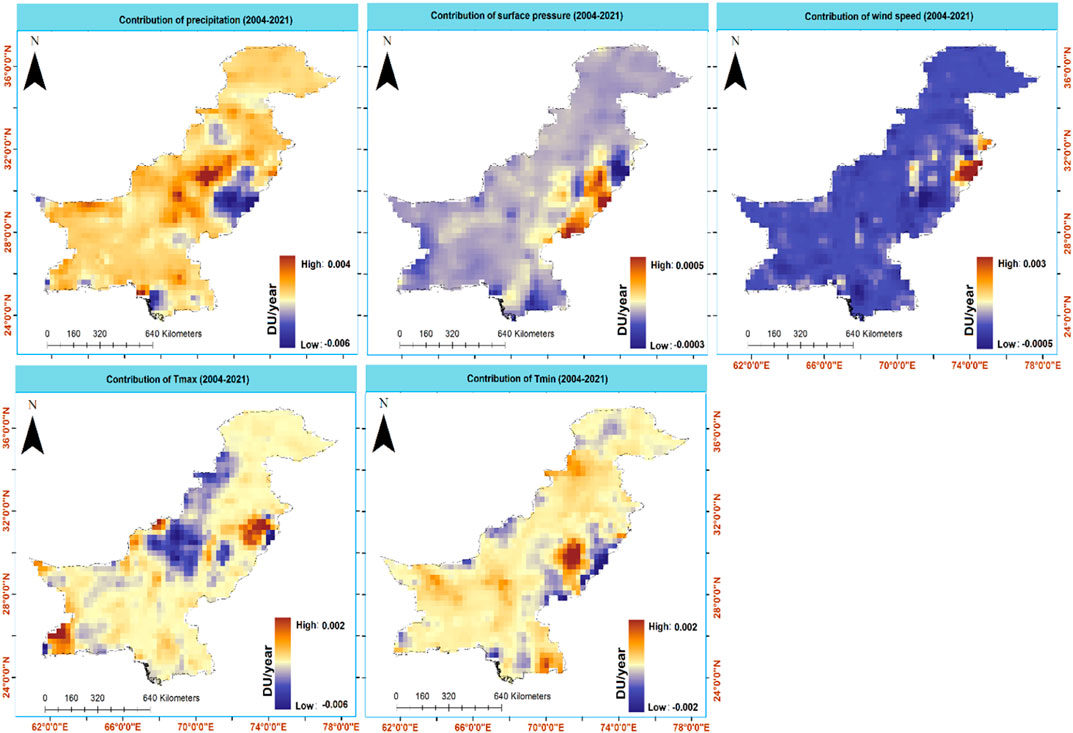
Figure 12. Contribution of climatic factors to SO2 (DU per year) pattern changes over Pakistan.
Figure 13 indicates the spatial pattern of the contribution relationship between O3 and climatic variables in Pakistan during 2004–2021. The north, south, and north-central regions of the country showed a positive association between O3 and Precp, with maximum increasing values of 0.21 DU, whereas the central and south–north regions indicated a decreasing contribution relationship, with the highest decreasing value of 0.29. The association between O3 and SP was homogenous in most parts of the country and showed positive values all over the country, with a maximum value of 0.01 DU and a minimum value of 0.002 DU. A contribution relationship between O3 and WS was observed with a maximum increasing trend value of 0.11 DU in small parts of the central part; north and south regions showed a decreasing contribution with a maximum value of 0.03 DU across the country. The contribution relationship between O3 and Tmax indicated that most parts of the country showed an increasing contribution, except a small part of southwest and central east with maximum increasing contribution values of 0.18 DU, while the maximum decreasing value was 0.55 DU. Tmin showed an altogether opposite contribution relationship with O3 to relations with Tmax.
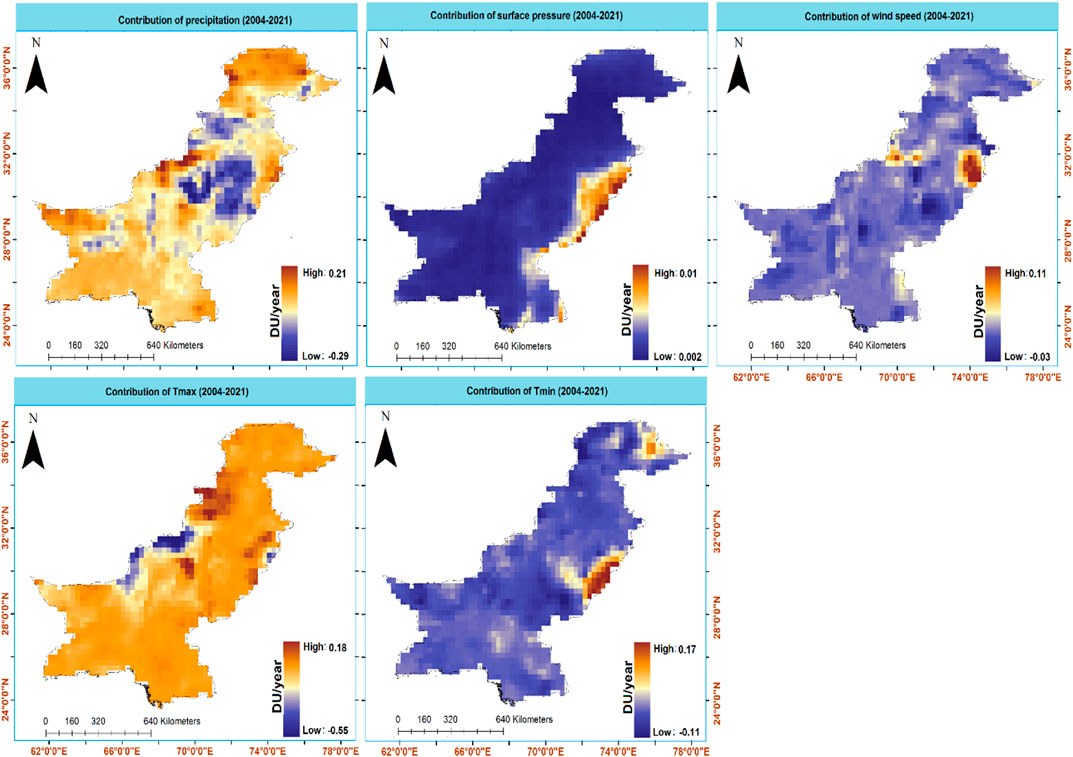
Figure 13. Contribution of climatic factors to O3 (Du/year) pattern changes over Pakistan.
The west–north, central, and south regions of the country indicated an increasing contribution relationship, with a maximum value of 0.17, whereas the small area in the east–north, and southcentral regions had a decreasing contribution relationship, with the highest decreasing contribution value of 0.11 DU. In general, a comparison of the contribution between O3 and meteorological factors revealed that Precp was the most influential variable, followed by Tmax with the maximum contribution of 0.21 DU and 0.18 DU, respectively.
In the current study, we have analyzed the LULCC, climate variability, and air pollution variation from 2004 to 2021 using satellite remote sensing and ground station data over Pakistan. The most prominent increasing trend for the PM was 0.68 per year. The entire population of Pakistan has been highly exposed to PM concentrations for many years (Bilal et al., 2021). It is caused by anthropogenic emissions associated with economic growth, including traffic flow and urbanization (Luo et al., 2021). PM concentrations decreased in the north and central southeast regions of Pakistan, with the highest decreasing trend at 0.55. In the case of NO2 and SO2, the increasing trend was 0.89 × 10 15 molecules/cm2 per year and 0.54 DU/year during 2004–2021. Most parts of Pakistan are facing an increasing trend of NO2 emissions, but the highest increasing trend was found in the central, southcentral, and southeast regions of Pakistan (Rana et al., 2019). Transportation, industries, and urban areas are contributing to the increase in NO2 emissions in Pakistan (Pervaiz et al., 2020). NOx emission reduction from power plants and vehicle emissions has been focused on because both on- and off-road vehicles significantly contribute to increasing air pollution, and multiple studies revealed a significant correlation between increasing air pollution and vehicle traffic (Huang et al., 2018; Jamali et al., 2020).
The SO2 spatial variation showed a mixed trend across the country but showed a clear increasing trend over Lahore city, Punjab, and west–south region of Pakistan. Bilal et al. (2021) revealed that tropospheric NO2 and SO2 concentrations are high over Lahore, Punjab, Pakistan (Bilal et al., 2021). Previously, it was observed that column densities of SO2 are higher in major cities like Lahore, Pakistan (Jabeen and Khokhar, 2019). In the case of O3 trend concentrations, visible increasing and decreasing patterns were observed over Pakistan. In addition, the north region and west–south region experienced the highest increase (Zeb et al., 2019) and the highest decreasing trend per year, respectively.
LCM, MGWR, and proposed mathematical models have been used to determine the degree of contribution of LULCC and climatic factors to air pollution dynamics. Recently, a study used a simple GWR model based on their coefficients to describe the relationship between the two parameters in Bangladesh (Rahman et al., 2022). The complex topography conditions, intensive LULCC, and variant meteorological conditions during the past 20 years have affected the relationship with significant heterogeneity in Pakistan. We used the land change model to comprehensively study the LULCC during 2004–2021 and computed the spatial relationship on geographic variant location by considering the non-uniform effect of the surrounding element through MGWR. Second, the effect of climatology on air pollution was calculated by integrating the MGWR-based spatial variability relation with the differential equation-based contribution analysis during 2004–2021 over Pakistan.
In all LULCC types, the mean air pollutant concentrations significantly increased from 2004 to 2021, and the same results were found in Alam et al. (2015). All land cover types were increased except for barren lands. In addition, shrublands and grasslands had the largest increasing rates (Fan et al., 2020). Urban lands had the lowest increasing rate among all lands. The increasing trends indicate that the air pollution situation worsened during the study period. The increasing SDs mean that the spatial difference in air pollutant concentrations has increased. Indeed, the whole study area is facing a serious air pollution situation.
As shown in Table 2, in 2004, the mainland type in Pakistan was shrublands, whose area was 8.12 × 10⁴ mile2, accounting for 32% of the total area, followed by grasslands and croplands, accounting for 24.02% and 38.32%, respectively. Urban lands covered 3.5 × 10⁴ mile2, accounting for 1.3% of the total area. In 2021, although shrublands covered the second-largest area, their area increased to 8.74 × 10⁴ mile2, accounting for 34.49% of the total area. The area of grasslands decreased by 5.9 × 10⁴ mile2, accounting for 23.48% of the total area, and became the third-largest land type. The area of croplands and urban lands increased, accounting for 40% and 1.4%, respectively, and their proportion increased to 9.56% and 9%, respectively. The main conversion sources of urban lands were shrublands, grasslands, croplands, and barren lands, and the total conversion area was 0.98 × 10⁴ mile2, which was caused by rapid urbanization. PM concentrations increased to their highest values in the PM trend. In addition, increasing trends were observed when grasslands were converted to urban land, wetlands, and shrublands. Urban development changed the grasslands, and forestlands contributed to a dramatic increase in PM2.5 (Zhou et al., 2022). Moreover, some land cover transitions showed no trend, such as shrublands to barren lands and shrublands to grasslands. For NO2 concentrations, land transitions from croplands and barren lands showed the highest increasing and lowest increasing trends, respectively. In the case of SO2 concentrations, conversion of croplands to grasslands and that of barren lands to urban lands showed the second-highest increasing and lowest decreasing trends, respectively. The largest increasing trend was for grasslands converted to shrublands (Stavi, 2019), while the highest decreasing trend was for barren lands converted to croplands with the trend values of 1.5 DU and 0.7 DU for O3. Tian et al. (2012) studied the responses of the ecosystem and revealed that O3 concentrations are increased by increasing the shrublands (Tian et al., 2012).
In general, the trend was increasing for all parameters across the study region.
In the context of the climatic factor’s contribution, Precp showed a prominent increasing trend in the central and southern parts of Pakistan, with a maximum value of 1 mm per year. A study by Ahmad et al. (2017) concluded that the annual mean precipitation in Pakistan is increasing (Ahmed et al., 2018). The higher wind speed transported the large amounts of moisture that caused increased rainfall across the country. SP showed the maximum increasing trend of 0.01 per year while decreasing by 0.0038 Kpa per year, respectively. The WS trend was also increased but prominent in the north, central-south, southeast, and southwest parts of Pakistan (Ullah et al., 2022), where its increase was 0.04 m/s per year during 2004–2021. In the case of Tmax, the trend increased and decreased across the region, with the highest increase being 0.28°C/year and highest decrease being 0.08°C/year. The maximum decreasing and increasing trends for Tmin were 0.16°C/year and 0.19°C/year, respectively. The findings of the trend analysis showed geographical variation because of the impact of monsoon climate changes (Safdar et al., 2021).
The positive relationship means Precp contributed to the increase in PM, reaching its highest value of 10 by changing the per-unit Precp. The precipitation increases the PM because it forms rain droplets that act as PM (Lou et al., 2017). Both SP and WS showed a decreasing contribution of PM pollution in the northern region, with the highest values of −0.33 and −0.04, respectively. Hossain et al. (2021) found that maximum wind speed causes a decrease in the average concentrations of air pollutants (Hossain et al., 2021). Low wind speed causes stagnant pollution episodes, while the WS transports the pollutants. Tmax and Tmin positively contributed to the increase in the PM concentrations, particularly in the central region of Pakistan (Syed et al., 2021). Moreover, Tmin is most affected by PM concentrations than by Tmax across Pakistan.
NO2 concentrations were increased by 0.19 × 10 15 molecules/cm2 per year for every unit change in Precp while reducing the NO2 concentrations to 0.08 × 10 15 molecules/cm2 per year across the country. SP had significant positive and negative contributions, ranging from −0.01 to 0.007, while WS had positive contributions in most parts of the country, except in a small portion of the central region of Pakistan. The highest decreasing contribution in NO2 concentrations was 0.007 × 10 15 molecules/cm2 per year by the change in unit Tmax. The relationship between Tmin and NO2 concentrations had an increasing and decreasing trend in major regions of Pakistan. In general, Precp and WS contributed to increasing the NO2 concentration over Pakistan. Meteorological conditions are significantly worsening the air pollutant concentrations, and it was concluded that wind speed played a role in increasing the NO2 concentrations (Syed et al., 2021). Overall, we concluded that Precp and WS were the most influential climatic parameters for the SO2 concentrations across Pakistan, with the highest contribution values of 0.004 DU and 0.003 DU, respectively. In general, a comparison of the contribution between O3 and meteorological factors revealed that Precp was the most influential variable, followed by Tmax with the maximum contribution of 0.21 DU and 0.18 DU, respectively.
There are many contributors to the air pollution dynamics in the study region. Among them, the two most likely factors are LULCC and climate factors. The potential impact evaluation of LULCC and climate on air pollution variation provides effective information about air pollution driving forces and mechanisms. The current study evaluates Pakistan’s land use changes, regional climate variations, and air pollution changes from 2004 to 2021. The MK test and MGWR model were integrated with the differential equation model to assess the contribution of each parameter and how they are taking part in changing the pollution in Pakistan. It was assessed that the most prominent increasing trend for the PM was 0.68 per year. For NO2 and SO2, the increasing trend was 0.89 × 10 15 molecules/cm2 per year and 0.54 DU/year during 2004–2021. O3 concentrations showed visible increasing and decreasing patterns over Pakistan: the north and west–south regions were experiencing the highest increase. In 2004, the shrublands, with an area of 8.12 × 10⁴ mile2, accounted for 32% of the total area; although the area increased to 8.74 × 10⁴ mile2, it accounted for 34.49% of the total area. The main conversion sources of urban lands were shrublands, grasslands, croplands, and barren lands, and the total conversion area was 0.98 × 10⁴ mile2, which was caused by rapid urbanization.
During 2021, increasing trends indicated that the air pollution situation worsened during the study period. Increasing trends for PM were seen when grasslands were converted to urban lands, wetlands, and shrublands. Moreover, some land change transitions showed no trend, such as shrublands to barren lands and shrublands to grasslands. SO2 concentrations in conversion of croplands to grasslands show the highest increasing trend. The largest increase was for grasslands converted to shrublands, with a trend value of 1.5 DU for O3. The regional climate played a very important role in making air pollution stagnant across the country. The positive relationship means Precp contributed to the increase in PM, reaching its highest value of 10 when changing the per-unit Precp. In general, Precp and WS contributed highly to increasing NO2 concentrations in Pakistan. Precp in SO2 concentrations across Pakistan had the highest contribution values (0.004 DU). For O3, the most influential climate factor was Precp.
Based on the results, we concluded that the dynamics of air pollution in Pakistan are significantly and inextricably linked with changes in land cover and meteorological variables. The type of pollutants and geographical region can explain the effects of land surface conditions and weather parameters on air pollution. These results, on a long-term temporal scale, comprehensively evaluate how climate variability and LULCC are altering ambient air quality in Pakistan. The current study can aid in determining the relevant key stakeholders and directing attention toward the best strategy for environmental protection and management. These useful insights may be beneficial for policymakers to develop suitable guidelines and regulations for preventing air pollution and keeping an eye on Pakistan’s air quality. It is encouraged to carry out more research on the interconnections between pollutants and climate variability by combining finer spatial and temporal resolution data with the intensity of anthropogenic activities and environmental governance activities. Furthermore, Pakistan has different climate zones, so there is a need to consider them to analyze the impact assessment of climatic parameters on air pollution across the zones. Second, the potential land use scenarios should be considered, including the effects of rapid urbanization and industrialization on air pollution episodes. Understanding the effects of land use management on variability in air pollution in Pakistan is still inadequate. It will help achieve the SDGs as recommended by the United Nations.
The original contributions presented in the study are included in the article; further inquiries can be directed to the first and corresponding author.
AD: conceptualization, formal analysis, investigation, methodology, software, validation, visualization, writing–original draft, and writing–review and editing. BC: conceptualization, methodology, writing–review and editing, funding acquisition, project administration, resources, and supervision. ZU-H: formal analysis and writing–review and editing. SA: data curation and writing–review and editing. MS: data curation and writing–review and editing. FJ: data curation and writing–review and editing. TG: data curation, formal analysis, and writing–review and editing. MG: data curation, formal analysis, and writing–review and editing. HD: formal analysis and writing–review and editing. HZ: data curation and writing–review and editing. ZZ: writing–review and editing. EL: formal analysis and writing–review and editing.
The author(s) declare that financial support was received for the research, authorship, and/or publication of this article. This research was funded by the National Natural Science Foundation of China (41771114) and the Innovation Project of LREIS (No. KPI005).
The authors declare that the research was conducted in the absence of any commercial or financial relationships that could be construed as a potential conflict of interest.
All claims expressed in this article are solely those of the authors and do not necessarily represent those of their affiliated organizations, or those of the publisher, the editors, and the reviewers. Any product that may be evaluated in this article, or claim that may be made by its manufacturer, is not guaranteed or endorsed by the publisher.
Agarwal, N., Meena, C. S., Raj, B. P., Saini, L., Kumar, A., Gopalakrishnan, N., et al. (2021). Indoor air quality improvement in COVID-19 pandemic: review. Sustain. Cities Soc. 70, 102942. doi:10.1016/j.scs.2021.102942
Ahmed, K., and Long, W. (2012). "Environmental Kuznets curve and Pakistan: an empirical analysis." , 1: 4–13. doi:10.1016/s2212-5671(12)00003-2
Ahmed, K., Shahid, S., and Nawaz, N. (2018). Impacts of climate variability and change on seasonal drought characteristics of Pakistan. Atmos. Res. 214, 364–374. doi:10.1016/j.atmosres.2018.08.020
Akhtar, M., Zhao, Y., Gao, G., Gulzar, Q., Hussain, A., and Samie, A. (2020). "Assessment of ecosystem services value in response to prevailing and future land use/cover changes in Lahore, Pakistan." , 1(1): 37–47. doi:10.1016/j.regsus.2020.06.001
Ahmad, N., Du, L., Lu, J., Wang, J., Li, H-Z., and Hashmi, M. Z. (2017). Modelling the CO2 emissions and economic growth in Croatia: is there any environmental Kuznets curve?. Energy 123, 164–172.
Alam, K., Mukhtar, A., Shahid, I., Blaschke, T., Majid, H., Rahman, S., et al. (2014). Source apportionment and characterization of particulate matter (PM10) in urban environment of Lahore. Aerosol Air Qual. Res. 14 (7), 1851–1861. doi:10.4209/aaqr.2014.01.0005
Alam, K., Rahman, N., Khan, H. U., Haq, B. S., and Rahman, S. (2015). Particulate matter and its source apportionment in Peshawar, Northern Pakistan. Aerosol Air Qual. Res. 15 (2), 634–647. doi:10.4209/aaqr.2014.10.0250
Alam, K., Shaheen, K., Blaschke, T., Chishtie, F., Khan, H. U., and Haq, B. S. (2016). Classification of aerosols in an urban environment on the basis of optical measurements. Aerosol Air Qual. Res. 16 (10), 2535–2549. doi:10.4209/aaqr.2016.06.0219
Ali, M., Kirikkaleli, D., Sharma, R., and Altuntaş, M. (2022). The nexus between remittances, natural resources, technological innovation, economic growth, and environmental sustainability in Pakistan. Environ. Sci. Pollut. Res. 29 (50), 75822–75840. doi:10.1007/s11356-022-21228-4
Ali, S., and Sang, Y. F. (2023). Implementing rainwater harvesting systems as a novel approach for saving water and energy in flat urban areas. Sustain. Cities Soc. 89, 104304. doi:10.1016/j.scs.2022.104304
Ali, S., Zhang, S., and Chandio, F. A. (2021). Impacts of rainfall change on stormwater control and water saving performance of rainwater harvesting systems. J. Environ. Manage. 280, 111850. doi:10.1016/j.jenvman.2020.111850
Ali, S., Zhang, S., and Yue, T. (2020). Environmental and economic assessment of rainwater harvesting systems under five climatic conditions of Pakistan. J. Clean. Prod. 259, 120829. doi:10.1016/j.jclepro.2020.120829
Alkon, M., He, X., Paris, A. R., Liao, W., Hodson, T., Wanders, N., et al. (2019). Water security implications of coal-fired power plants financed through China's Belt and Road Initiative. Energy Policy 132, 1101–1109. doi:10.1016/j.enpol.2019.06.044
Arshad, A., Zhang, W., Zaman, M. A., Dilawar, A., and Sajid, Z. (2019). Monitoring the impacts of spatio-temporal land-use changes on the regional climate of city Faisalabad, Pakistan. Ann. GIS 25 (1), 57–70. doi:10.1080/19475683.2018.1543205
Arshad, S., Ahmad, S. R., Abbas, S., Asharf, A., Siddiqui, N. A., and Islam, Z. u. (2022). Quantifying the contribution of diminishing green spaces and urban sprawl to urban heat island effect in a rapidly urbanizing metropolitan city of Pakistan. Land use policy 113, 105874. doi:10.1016/j.landusepol.2021.105874
Assamnew, A. D., and Mengistu Tsidu, G. (2023). Assessing improvement in the fifth-generation ECMWF atmospheric reanalysis precipitation over East Africa. Int. J. Climatol. 43 (1), 17–37. doi:10.1002/joc.7697
Bhatti, S. S., Tripathi, N. K., Nitivattananon, V., Rana, I. A., and Mozumder, C. (2015). A multi-scale modeling approach for simulating urbanization in a metropolitan region. Habitat Int. 50, 354–365. doi:10.1016/j.habitatint.2015.09.005
Bilal, M., Mhawish, A., Nichol, J. E., Qiu, Z., Nazeer, M., Ali, M. A., et al. (2021). Air pollution scenario over Pakistan: characterization and ranking of extremely polluted cities using long-term concentrations of aerosols and trace gases. Remote Sens. Environ. 264, 112617. doi:10.1016/j.rse.2021.112617
Chakraborty, T., and Lee, X. (2019). Land cover regulates the spatial variability of temperature response to the direct radiative effect of aerosols. Geophys. Res. Lett. 46 (15), 8995–9003. doi:10.1029/2019gl083812
Christensen, M. W., Gettelman, A., Cermak, J., Dagan, G., Diamond, M., Douglas, A., et al. (2022). Opportunistic experiments to constrain aerosol effective radiative forcing. Atmos. Chem. Phys. 22 (1), 641–674. doi:10.5194/acp-22-641-2022
Colbeck, I., Nasir, Z. A., and Ali, Z. (2010). The state of ambient air quality in Pakistan—a review. Environ. Sci. Pollut. Res. 17, 49–63. doi:10.1007/s11356-009-0217-2
D Behera, M., Borate, S. N., Panda, S. N., Behera, P. R., and Roy, P. S. (2012). Modelling and analyzing the watershed dynamics using Cellular Automata (CA)–Markov model–A geo-information based approach. J. earth Syst. Sci. 121 (4), 1011–1024. doi:10.1007/s12040-012-0207-5
Destek, M. A., and Sarkodie, S. A. (2019). Investigation of environmental Kuznets curve for ecological footprint: the role of energy and financial development. Sci. Total Environ. 650, 2483–2489. doi:10.1016/j.scitotenv.2018.10.017
Dilawar, A., Chen, B., Arshad, A., Guo, L., Ehsan, M. I., Hussain, Y., et al. (2021a). Towards understanding variability in droughts in response to extreme climate conditions over the different agro-ecological zones of Pakistan. Sustainability 13 (12), 6910. doi:10.3390/su13126910
Dilawar, A., Chen, B., Guo, L., Liu, S., Shafeeque, M., Arshad, A., et al. (2021b). Evaluation the WRF model with different land surface schemes: heat wave event simulations and its relation to pacific variability over coastal region, karachi, Pakistan. Karachi, Pak. 13 (22), 12608. doi:10.3390/su132212608
Dilawar, A., Chen, B., Trisurat, Y., Tuankrua, V., Arshad, A., Hussain, Y., et al. (2021c). Spatiotemporal shifts in thermal climate in responses to urban cover changes: a-case analysis of major cities in Punjab, Pakistan. Geomat. Nat. Hazards Risk 12 (1), 763–793. doi:10.1080/19475705.2021.1890235
Ding, Y., Feng, H., Zou, B., and Ye, S. (2022). Contribution isolation of LUCC impact on regional PM2.5 air pollution: implications for sustainable land and environment management. Front. Environ. Sci. 10, 3. doi:10.3389/fenvs.2022.825732
Duncan, B. N., Prados, A. I., Lamsal, L. N., Liu, Y., Streets, D. G., and Gupta, P. (2014). Satellite data of atmospheric pollution for US air quality applications: Examples of applications, summary of data end-user resources, answers to FAQs, and common mistakes to avoid. Atmos. Environ. 94, 647–662.
Falloon, P., and Betts, R. (2010). Climate impacts on European agriculture and water management in the context of adaptation and mitigation—the importance of an integrated approach. Sci. total Environ. 408 (23), 5667–5687. doi:10.1016/j.scitotenv.2009.05.002
Fan, Z., Bai, R., and Yue, T. (2020). Scenarios of land cover in Eurasia under climate change. J. Geogr. Sci. 30, 3–17. doi:10.1007/s11442-020-1711-1
Fatmi, Z., Ntani, G., and Coggon, D. (2020). Levels and determinants of fine particulate matter and carbon monoxide in kitchens using biomass and non-biomass fuel for cooking. Int. J. Environ. Res. Public Health 17 (4), 1287. doi:10.3390/ijerph17041287
Feng, B., Sun, C., Zhao, W., and Zhang, S. (2020). A theoretical investigation on the atmospheric degradation of the radical: reactions with NO, NO2, and NO3. Environ. Sci. Process. Impacts 22 (7), 1554–1565. doi:10.1039/d0em00112k
Fotheringham, A. S., Yue, H., and Li, Z. (2019). Examining the influences of air quality in China’s cities using multi-scale geographically weighted regression. Transactions in GIS 23 (6), 1444–1464.
Fu, Y., Gao, H., Liao, H., and Tian, X. (2021). Spatiotemporal variations and uncertainty in crop residue burning emissions over North China plain: implication for atmospheric CO2 simulation. Remote Sens. 13 (19), 3880. doi:10.3390/rs13193880
Gautam, S., Elizabeth, J., Gautam, A. S., Singh, K., and Abhilash, P. (2022). Impact assessment of aerosol optical depth on rainfall in Indian rural areas. Aerosol Sci. Eng. 6 (2), 186–196. doi:10.1007/s41810-022-00134-9
Hossain, M. S., Ahmed, S., and Uddin, M. J. (2021). Impact of weather on COVID-19 transmission in south Asian countries: an application of the ARIMAX model. Sci. Total Environ. 761, 143315. doi:10.1016/j.scitotenv.2020.143315
Huang, Q., Cai, X., Wang, J., Song, Y., and Zhu, T. (2018). Climatological study of the Boundary-layer air Stagnation Index for China and its relationship with air pollution. Atmos. Chem. Phys. 18 (10), 7573–7593. doi:10.5194/acp-18-7573-2018
Humbal, A., Chaudhary, N., and Pathak, B. (2023). Urbanization trends, climate change, and environmental sustainability. Climate change and urban environment sustainability. Springer, 151–166.
Ira, S. (2018). Modeling of land surface temperature (LST) and normalized difference vegetation index (NDVI) in Nepal: 2000-2015. Pattani Campus: Prince of Songkla University.
Jabeen, Z., and Khokhar, M. F. (2019). Extended database of SO2 column densities over Pakistan by exploiting satellite observations. Atmos. Pollut. Res. 10 (3), 997–1003. doi:10.1016/j.apr.2019.01.009
Jamali, S., Klingmyr, D., and Tagesson, T. (2020). Global-scale patterns and trends in tropospheric NO2 concentrations, 2005–2018. Remote Sens. 12 (21), 3526. doi:10.3390/rs12213526
Jiang, R., Xie, C., Man, Z., Afshari, A., and Che, S. (2023). LCZ method is more effective than traditional LUCC method in interpreting the relationship between urban landscape and atmospheric particles. Sci. total Environ. 869, 161677. doi:10.1016/j.scitotenv.2023.161677
Joshi, N. (2023). “Dust pollution and plants: a case study of Mumbai, Maharashtra, India,” Plant metabolites under environmental stress. Apple Academic Press, 85–115.
Kaliyaperumal, M., and Sharma, I. (2021). “Air pollution: causes, effects and control of pollutants,” Basic concepts in environmental biotechnology. London, England: CRC Press, 11–22.
Kumar, S., Radhakrishnan, N., and Mathew, S. (2014). Land use change modelling using a Markov model and remote sensing. Geomatics, Nat. Hazards Risk 5 (2), 145–156. doi:10.1080/19475705.2013.795502
Kumari, P., and Toshniwal, D. (2020). Impact of lockdown on air quality over major cities across the globe during COVID-19 pandemic. Urban Clim. 34, 100719. doi:10.1016/j.uclim.2020.100719
Lamsal, L. N., Krotkov, N. A., Vasilkov, A., Marchenko, S., Qin, W., Yang, E. S., et al. (2021). Ozone Monitoring Instrument (OMI) Aura nitrogen dioxide standard product version 4.0 with improved surface and cloud treatments. Atmos. Meas. Tech. 14 (1), 455–479. doi:10.5194/amt-14-455-2021
Lees, E., Bousquet, O., Roy, D., and Bellevue, J. L. d. (2021). Analysis of diurnal to seasonal variability of Integrated Water Vapour in the South Indian Ocean basin using ground-based GNSS and fifth-generation ECMWF reanalysis (ERA5) data. Q. J. R. Meteorological Soc. 147 (734), 229–248. doi:10.1002/qj.3915
Leonardi, A., Ricker, H. M., Gale, A. G., Ball, B. T., Odbadrakh, T. T., Shields, G. C., et al. (2020). Particle formation and surface processes on atmospheric aerosols: a review of applied quantum chemical calculations. Int. J. Quantum Chem. 120 (20), e26350. doi:10.1002/qua.26350
Li, K., Jacob, D. J., Liao, H., Zhu, J., Shah, V., and Shen, L. (2019). A two-pollutant strategy for improving ozone and particulate air quality in China. Nature Geoscience 12 (11), 906–910.
Lodhi, A., Ghauri, B., Khan, M. R., Rahman, S., and Shafique, S. (2009). Particulate matter (PM2.5) concentration and source apportionment in Lahore. J. Braz. Chem. Soc. 20, 1811–1820. doi:10.1590/s0103-50532009001000007
Lou, C., Liu, H., Li, Y., Peng, Y., Wang, J., and Dai, L. (2017). Relationships of relative humidity with PM2.5 and PM10 in the yangtze river delta, China. Environ. Monit. Assess. 189, 582–616. doi:10.1007/s10661-017-6281-z
Lu, D., Xu, J., Yue, W., Mao, W., Yang, D., and Wang, J. (2020). Response of PM2.5 pollution to land use in China. J. Clean. Prod. 244, 118741. doi:10.1016/j.jclepro.2019.118741
Luo, Y., Shen, J., Chen, A., Tao, Q., Li, Q., White, P. J., et al. (2021). Loss of organic carbon in suburban soil upon urbanization of Chengdu megacity, China. Sci. Total Environ. 785, 147209. doi:10.1016/j.scitotenv.2021.147209
Malhi, H., Ahmed, I., Nawaz, R., Ahmed, A., and Nasir, A. (2022). "Assessment of attributable proportion of particulate matter (PM2. 5 and PM10) to different mortalities in Lahore city, Pakistan."
Mann, H. (1945). Nonparametric tests against trend. Econ. J. Econom. Soc. 13, 245–259. doi:10.2307/1907187
Maring, T., Kumar, S., Jha, A. K., Kumar, N., and Pandey, S. P. (2023). Airborne particulate matter and associated heavy metals: a review. Macromolecular Symposia. Wiley Online Library.
MOE (2005). National environmental policy 2005. Islamabad, Pakistan: Ministry of Environment (MOE), Government of Pakistan.
Muñoz-Sabater, J., Dutra, E., Agustí-Panareda, A., Albergel, C., Arduini, G., Balsamo, G., et al. (2021). ERA5-Land: a state-of-the-art global reanalysis dataset for land applications. Earth Syst. Sci. Data 13 (9), 4349–4383. doi:10.5194/essd-13-4349-2021
Nazeer, A., Maskey, S., Skaugen, T., and McClain, M. E. (2022). Simulating the hydrological regime of the snow fed and glaciarised Gilgit Basin in the Upper Indus using global precipitation products and a data parsimonious precipitation-runoff model. Sci. total Environ. 802, 149872. doi:10.1016/j.scitotenv.2021.149872
Norazrin, R., Hamid, H. A., and Yahaya, A. S. (2023). “Boosted Regression Tree (BRT) model for PM10 concentrations prediction in Malaysia,” in IOP Conference Series: Earth and Environmental Science (Penang, Malaysia: IOP Publishing).
Pasha, H. A. (2018). Growth and inequality in Pakistan. Pakistan: Friedrich-Naumann-Stiftung für die Freiheit.
Pervaiz, S., Javid, K., Khan, F. Z., Zahid, Y., and Akram, M. A. N. (2020). Preliminary assessment of air during COVID-19 lockdown: an unintended benefit to environment. Environ. Nat. Resour. J. 18 (4), 363–375. doi:10.32526/ennrj.18.4.2020.35
Pilarczyk, M., Węglowski, B., and Nord, L. O. (2019). A comprehensive thermal and structural transient analysis of a boiler’s steam outlet header by means of a dedicated algorithm and FEM simulation. Energies 13 (1), 111. doi:10.3390/en13010111
Rahman, M. M., Shuo, W., Zhao, W., Xu, X., Zhang, W., and Arshad, A. (2022). Investigating the relationship between air pollutants and meteorological parameters using satellite data over Bangladesh. Remote Sens. 14 (12), 2757. doi:10.3390/rs14122757
Raja, S., Biswas, K. F., Husain, L., and Hopke, P. K. (2010). Source apportionment of the atmospheric aerosol in Lahore, Pakistan. Water, air, soil Pollut. 208, 43–57. doi:10.1007/s11270-009-0148-z
Ramanathan, V., Chung, C., Kim, D., Bettge, T., Buja, L., and Kiehl, J. T. (2005). Atmospheric brown clouds: impacts on South Asian climate and hydrological cycle. Proc. Natl. Acad. Sci. 102 (15), 5326–5333.
Rana, A., Parvez, S., Ul-Haq, Z., Batool, S., Chaudhary, M., Mamhood, K., et al. (2019). Anthropogenic, biogenic and pyrogenic emission sources and atmospheric formaldehyde (HCHO) and nitrogen dioxide (NO2) columns over different landuse/landcovers of South Asia. Ecol. Env. Res. 17, 10989–11015. doi:10.15666/aeer/1705_1098911015
Rauf, A., Liu, X., Amin, W., Ozturk, I., Rehman, O. U., and Hafeez, M. (2018). Testing EKC hypothesis with energy and sustainable development challenges: a fresh evidence from belt and road initiative economies. Environ. Sci. Pollut. Res. 25, 32066–32080. doi:10.1007/s11356-018-3052-5
Riaz, O., Ghaffar, A., and Butt, I. (2014). Modelling land use patterns of Lahore (Pakistan) using remote sensing and GIS. 14(1): 24–30.
Sadik-Zada, E. R., and Ferrari, M. J. S. (2020). Environmental policy stringency, technical progress and pollution haven hypothesis. Sustainability 12 (9), 3880. doi:10.3390/su12093880
Sadik-Zada, E. R., and Gatto, A. J. S.-E. P. S. (2021). The puzzle of greenhouse gas footprints of oil abundance. Socioecon. Plann. Sci. 75, 100936. doi:10.1016/j.seps.2020.100936
Sadik-Zada, E. R., and Gatto, A. (2022). “Vulnerability to the urban heat islands effect in the Global North and the Global South: assessment of the drivers and mitigation strategies,” Global urban heat island mitigation. Elsevier, 29–45.
Sadik-Zada, E. R., and Gatto, A. (2023). Grow First, Clean Up Later? Dropping Old Paradigms and Opening Up New Horizons of Sustainable Development. Sustainability 15(4), 3595.
Safdar, F., Khokhar, M. F., Din, M. I. U., Siddiqui, G. F., and Khattak, W. (2021). Spatial trends of maximum and minimum temperatures in different climate zones of Pakistan by exploiting ground-based and space-borne observations. Int. J. Glob. Warming 24 (3-4), 365–382. doi:10.1504/ijgw.2021.116715
Sánchez Triana, E., Enriquez, S., Afzal, J., Nakagawa, A., and Khan, A. (2014). Cleaning Pakistan’s air: policy options to address the cost of outdoor air pollution. Washington DC: The World Bank.
Sang, L., Zhang, C., Yang, J., Zhu, D., and Yun, W. (2011). Simulation of land use spatial pattern of towns and villages based on CA–Markov model. Math. Comput. Model. 54 (3-4), 938–943. doi:10.1016/j.mcm.2010.11.019
Shahid, M. Z., Hong, L., Yu-Lu, Q., and Shahid, I. (2015). Source sector contributions to aerosol levels in Pakistan. Atmos. Ocean. Sci. Lett. 8 (5), 308–313. doi:10.3878/AOSL20150049
Sillmann, J., Stjern, C. W., Myhre, G., and Forster, P. M. (2017). Slow and fast responses of mean and extreme precipitation to different forcing in CMIP5 simulations. Geophys. Res. Lett. 44 (12), 6383–6390. doi:10.1002/2017gl073229
Stavi, I. (2019). Wildfires in grasslands and shrublands: a review of impacts on vegetation, soil, hydrology, and geomorphology. Water 11 (5), 1042. doi:10.3390/w11051042
Sulla-Menashe, D., Friedl, M. A., Woodcock, C., and Melaas, E. K. (2018). ABoVE: peak greenness for Canadian boreal forest from Landsat 5 TM imagery, 1984-2011. Oak Ridge, Tennessee: ORNL DAAC. doi:10.3334/ORNLDAAC/1587
Sun, J., Li, Z., Xue, L., Wang, T., Wang, X., Gao, J., et al. (2018). Summertime C1-C5 alkyl nitrates over Beijing, northern China: spatial distribution, regional transport, and formation mechanisms. Atmos. Res. 204, 102–109. doi:10.1016/j.atmosres.2018.01.014
Superczynski, S. D., and Christopher, S. A. (2011). Exploring land use and land cover effects on air quality in Central Alabama using GIS and remote sensing. Remote Sens. 3 (12), 2552–2567. doi:10.3390/rs3122552
Syed, A., Zhang, J., Moniruzzaman, M., Rousta, I., Omer, T., Ying, G., et al. (2021). Situation of urban mobility in Pakistan: before, during, and after the COVID-19 lockdown with climatic risk perceptions. Atmosphere 12 (9), 1190. doi:10.3390/atmos12091190
Tabinda, A. B., Ali, H., Yasar, A., Rasheed, R., Mahmood, A., and Iqbal, A. (2020). Comparative assessment of ambient air quality of major cities of Pakistan. Mapan 35, 25–32. doi:10.1007/s12647-019-00335-7
Tang, K. H. D. (2019). Climate change in Malaysia: trends, contributors, impacts, mitigation and adaptations. Sci. Total Environ. 650, 1858–1871. doi:10.1016/j.scitotenv.2018.09.316
Tian, H., Chen, G., Zhang, C., Liu, M., Sun, G., Chappelka, A., et al. (2012). Century-scale responses of ecosystem carbon storage and flux to multiple environmental changes in the southern United States. Ecosystems 15, 674–694. doi:10.1007/s10021-012-9539-x
Ullah, I., Ma, X., Yin, J., Saleem, F., Syed, S., Omer, A., et al. (2022). Observed changes in seasonal drought characteristics and their possible potential drivers over Pakistan. Int. J. Climatol. 42 (3), 1576–1596. doi:10.1002/joc.7321
Xu, W., Jin, X., Liu, M., Ma, Z., and Zhou, Y. (2021). Analysis of spatiotemporal variation of PM2.5 and its relationship to land use in China. Atmos. Pollut. Res. 12 (9), 101151. doi:10.1016/j.apr.2021.101151
Zeb, N., Khokhar, M. F., Pozzer, A., and Khan, S. A. (2019). Exploring the temporal trends and seasonal behaviour of tropospheric trace gases over Pakistan by exploiting satellite observations. Atmos. Environ. 198, 279–290. doi:10.1016/j.atmosenv.2018.10.053
Zhou, D., Zhang, L., Huang, D., and Zhu, C. (2016). Climate–vegetation control on the diurnal and seasonal variations of surface urban heat islands in China. Environ. Res. Lett. 11 (7), 074009. doi:10.1088/1748-9326/11/7/074009
Zhou, W., Yu, W., Qian, Y., Han, L., Pickett, S. T., Wang, J., et al. (2022). "Beyond city expansion: multi-scale environmental impacts of urban megaregion.
Keywords: land use and land cover change, land change model, atmospheric pollution, climate change, multiscale geographically weighted regression
Citation: Dilawar A, Chen B, Ul-Haq Z, Ali S, Sajjad MM, Junjun F, Gemechu TM, Guo M, Dilawar H, Zhang H, Zicheng Z and Lodhi E (2024) Evaluating the potential footprints of land use and land cover and climate dynamics on atmospheric pollution in Pakistan. Front. Environ. Sci. 11:1272155. doi: 10.3389/fenvs.2023.1272155
Received: 03 August 2023; Accepted: 26 December 2023;
Published: 05 February 2024.
Edited by:
Sirapong Sooktawee, Ministry of Natural Resources and Environment, ThailandReviewed by:
Elkhan Richard Sadik-Zada, Ruhr University Bochum, GermanyCopyright © 2024 Dilawar, Chen, Ul-Haq, Ali, Sajjad, Junjun, Gemechu, Guo, Dilawar, Zhang, Zicheng and Lodhi. This is an open-access article distributed under the terms of the Creative Commons Attribution License (CC BY). The use, distribution or reproduction in other forums is permitted, provided the original author(s) and the copyright owner(s) are credited and that the original publication in this journal is cited, in accordance with accepted academic practice. No use, distribution or reproduction is permitted which does not comply with these terms.
*Correspondence: Baozhang Chen, YmFvemhhbmcuY2hlbkBpZ3NucnIuYWMuY24=
Disclaimer: All claims expressed in this article are solely those of the authors and do not necessarily represent those of their affiliated organizations, or those of the publisher, the editors and the reviewers. Any product that may be evaluated in this article or claim that may be made by its manufacturer is not guaranteed or endorsed by the publisher.
Research integrity at Frontiers
Learn more about the work of our research integrity team to safeguard the quality of each article we publish.