 Cheng Che†
 Suhui Li
 Qi Yin
 Qing Li
 Xin Geng
- School of Economics and Management, China University of Petroleum (East China), Qingdao, China
The sustainable development process faces two major challenges: income inequality and carbon emissions. However, there is no definitive conclusion regarding the relationship between income inequality and carbon emissions. In addition, for developed and developing countries, the impact might vary. From an international perspective, the present study examines the correlation between income inequality and carbon emissions utilizing panel data from 65 countries (32 developed and 33 developing countries) spanning from 1990 to 2019. The simultaneous quantile regression (SQR) results show that the impact of income inequality on carbon emissions varies slightly between countries with various income levels. The positive impact of income inequality on carbon emissions is significant for both developed and developing countries, indicating that an uneven income distribution can worsen environmental quality, but the impact is more significant for developed countries. Therefore, it is integral for the global world to take measures to alleviate the income gap to achieve Sustainable Development Goals (SDGs). In addition to income growth, developed countries also need to focus on income equity to reach green development.
1 Introduction
Sustainable development is undoubtedly a pressing issue concerned by the global community. To simultaneously address economic, social, and environmental challenges, the global community is actively seeking ways to implement sustainability strategies (Lu et al., 2020; Fernandes et al., 2022). In 2015, the United Nations introduced 17 Sustainable Development Goals (SDGs) that contribute to initiatives on areas of relevance to people and Earth, calling on all stakeholders to participate in the quest for integrated sustainability (Maher and Buhmann, 2019). The areas of relevance cover subsistence and poverty reduction, protection of the planet, the wellbeing of people toward a better life, the promotion of world peace and social equity, and the realization of the goals of the agenda through friendship and cooperation among nations (The United Nations Brazil, 2015). In July 2023, top United Nations officials warned that the world was instable for attaining SDGs before 2030 (The United Nations (U.N.), 2023), revealing the importance and urgency of achieving SDGs.
Both income disparity and climate degradation pose a major threat to achieving SDGs. As for inequality, although sub-Saharan African countries have made efforts to alleviate poverty, nearly half of the countries in the region are burdened by hunger and poverty (Maji, 2019). Furthermore, Sub-Saharan Africa’s Gini coefficient is close to 0.5, higher than that of any other developing country, indicating very serious problems of inequality (Bhorat and Naidoo, 2019). According to the World Inequality Report 2022, there is a great deal of income inequality between countries. Currently, the top 10 percent of the world’s population holds over 50 percent of the world’s wealth, while more than half of the world’s poorest people own less than 10 percent of the world’s wealth. In addition, intranational inequality is significant. The average income disparity within countries has almost doubled, from 8.5 to 15 percent, separating the wealthiest 10 percent of the population from the poorest 50 percent of the population (The World Inequality Database, 2022). No better reminder of the urgency of addressing income inequality exists than the aforementioned data.
Increasing temperatures, higher sea levels, extreme weather events, and infectious diseases are all closely correlated with increased carbon emissions. Global energy consumption was predicted to increase annual carbon dioxide emissions to over 35 gigatons by 2021, further exacerbating global warming (Ritchie et al., 2020). The Special Report on Climate Change and Soils by the Intergovernmental Panel on Climate Change asserted that the only way to maintain warming well below 2°C is to reduce emissions from all sectors of the economy (Shukla et al., 2019). To control carbon emissions, nations worldwide have actively made corresponding action plans. In September 2019, 60 countries made a national commitment under the United Nations Framework Convention on Climate Change to achieve zero carbon emissions by 2050 (Iyer et al., 2017; Kuyper et al., 2018; Wamsler et al., 2020; Xu and He, 2022). In 2021, China committed to fully implement the new philosophy of development and strive to achieve the goals of carbon peaking and carbon neutrality (The State Council of the People’s Republic of China, 2021). It can be noted that the world has acknowledged the necessity and importance of equitable income distribution and carbon reduction; thus, there is a pressing impetus for action to reduce income disparity and carbon emissions. However, to take appropriate steps, we have to explore the correlation between income disparity and carbon emissions.
In terms of research on the relationship between income inequality and carbon emissions, some studies are available in the literature; more details are provided in Section 2. Most studies selected either a specific country group, like the OECD (Hailemariam et al., 2019), G20 (Chen et al., 2020), and G7 (Uddin et al., 2020), or a certain country, like the United States (Jorgenson et al., 2017), Turkey (Demir et al., 2019), and China (Chen et al., 2017; Bai et al., 2020), as their research objects. However, the selected subjects were too narrowly focused, and only fewer studies took a global view, covering different categories of countries; hence, it is hard to find out the heterogeneity among different countries. Regarding research methodology, most scholars employed the mean regression method (Grunewald et al., 2017; Knight et al., 2017; Mader, 2018; Xu and Wei, 2023), but fewer studies questioning the effectiveness of this method exist.
In view of the shortcomings of existing studies, we select 65 countries as the study objects, including 32 developed countries and 33 developing countries, and apply the simultaneous quantile approach in exploring the relationship between income inequality and carbon emissions from 1990 to 2019 by panel data. Our study further examine the effects of income inequality on carbon emission levels and estimate the heterogeneity on different income countries, which will extend relevant studies on income inequality, carbon emissions, and economic growth. At the same time, the application of simultaneous quantile regression (SQR) makes our study different from those employing former linear regression, which can provide variable changes in detail and give a methodological reference to future research.
The remainder of this article is organized as follows: Section 2 provides a review of the extant literature. Section 3 introduces the research model and the variables employed. Section 4 presents and analyzes the empirical results. Finally, Section 5 outlines the conclusions and possible policy implications.
2 Literature review
Current research on income inequality and carbon emissions covers two main areas: theoretical studies and empirical studies.
2.1 Theoretical studies
On the theoretical side, three types of theories are applied to explain the association between income inequality and carbon emissions. The first is power-weighted social choice, developed by Boyce (1994), one of the first political economists to assess the relationship between income distribution and environmental degradation. He believes that the distribution of social wealth between the wealthy and impoverished classes in society will largely determine ecological destruction. Since the wealthy are more affluent in income, they are more powerful and influential in environmental decision-making, which leads to higher levels of emissions. The second can be attributed to the theory of individual economic behavior. Bowles and Park (2005) argued that income inequality may lead to longer working hours due to the Veblen effect. Veblen (2009) holds that people are inclined to show off their social status and wealth, which leads to conspicuous consumption. As a result of extra-long working hours and consumer conspicuousness, energy consumption and carbon emissions have increased (Jorgenson et al., 2017). The third theory is the marginal propensity to emit theory, which holds that the amount of carbon emissions depends on the distribution of income. Declining income inequality is usually accompanied by more carbon emissions, leading to environmental degradation (Demir et al., 2019). While the aforementioned theories offer distinct perspectives, all of them could serve to comprehend the diverse impact of the relationship between income inequality and the emissions (Liu et al., 2019).
2.2 Empirical studies
On the empirical side, scholars have conducted studies on the relationship between income inequality and carbon emissions through different sampling scales, time horizons, research methodologies, and empirical models. The opinions can be mainly summarized into four streams. The first group believes that income inequality has a positive impact on carbon emissions. Knight et al. (2017) utilized a longitudinal two-way fixed-effects model to examine the connection between income inequality and carbon emissions, and the results of the study showed that for high-income countries, there is a significant positive relationship between income inequality and carbon emissions. In a study on the Next Eleven (N-11) countries, Padhan et al. (2019) applied the panel cointegration methodology and came to a similar conclusion. Baloch et al. (2020) found that increasing income inequality in 40 sub-Saharan African countries increases carbon dioxide emissions. The effect was also confirmed for China (Liu et al., 2019), Turkey (Uzar and Eyuboglu, 2019), and the United States (Baek and Gweisah, 2013; Jorgenson et al., 2017).
The second view contradicts the first by arguing that income disparity is negatively associated with carbon emissions. Using CO2 emissions as the dependent variable, Ravallion et al. (2000) found that increasing inequalities can cause increasing carbon emissions, both within and across countries. Nico et al. (2001) suggested a negative association between income disparity and emissions from 1961 to 1985 based on the EKC framework. Similar conclusions were also made by other scholars (Hübler, 2017; Liu et al., 2018; Demir et al., 2019; Huang and Duan, 2020).
The third view concludes that the association between income inequality and carbon emissions varies with income class or specific research objects. Coondoo and Dinda (2008) employed the panel data regression and concluded that income inequality can reduce carbon emissions in the United States, Asia, and Europe, but the opposite is true in Africa. Grunewald et al. (2017) discovered that, when income levels are high, a larger income disparity can lead to increased carbon emissions, but the opposite is true at low- and middle-income levels. In addition, there are scholars who have found that the effect of income disparity on carbon emissions is adverse for low- and middle-income countries, although it is mildly beneficial for countries above a certain income level (Mahalik et al., 2018; Uddin et al., 2020).
Lastly, a number of researchers argue that income inequality has an insignificant influence on carbon emissions. Policardo (2014) utilized panel data from transitional countries as well as two pollution indices, suggesting no noticeable effect on the relationship between income inequality and carbon emissions. Likewise, Wolde-Rufael and Idowu (2017) also revealed that the effect was not significant for India and China. Jorgenson et al. (2017) discovered an inconsequential association between Gini and carbon emissions through a heterogeneous panel that included 120 countries, with Mader (2018) confirming this finding.
Although scholars have extensively researched the correlation between income inequality and carbon emissions, there are still some shortcomings to be improved. First, the existing studies selected OECD, G20, N-11, G7, sub-Saharan African countries, or certain countries like the United States, China, and Turkey, as their research objects. However, there are few studies pinpointing different categorical countries, which cannot find the heterogeneity of different countries. Second, scholars mainly used the traditional mean regression to test the correlation between income inequality and carbon emissions, which requires the normal distribution of the data. Nevertheless, normal distribution is so ideal that it can nearly be shown in real situations. Hence, the standard deviation regression may cause some imprecise results and invalid conclusions.
On account of the aforementioned limitations, we try to make contributions to the following two aspects: on one hand, we choose 65 countries as our research objects, including 32 developed countries and 33 developing countries, which not only cover two kinds of income-level countries but also ensures that the amount is approximately the same for countries at different income levels. As a result, our data can better represent income inequality. On the other hand, in addition to traditional ordinary least squares (OLS) regression, we employ the simultaneous quantile method in our research, which contributes to the exploration of the heterogeneity of carbon emissions influenced by income inequality in different income-level countries, ensuring relatively precise results and effective conclusions.
3 Research models and variable descriptions
3.1 Regression models
3.1.1 Ordinary least squares regression model
First, to figure out how income inequality affects carbon emissions, OLS regression is used to estimate the following equation:
where i denotes the country and t represents the year. CO2 is the explained variable used to represent carbon emissions per capita. Income equality is denoted by the post-tax Gini coefficient (gini), which is our main explanatory variable. Other variables, including economic growth (lngdp), energy consumption (lnenergyc), urbanization (urban), foreign direct investment (fdi), economic structure (gdp2), international trade openness (trade), and research and development expenditure (rd), are controlled in model (1). In addition, some variables are logarithmized, aiming to eliminate the effect of heteroscedasticity. The quadratic terms are used to test the EKC hypothesis. α0 is a constant term, while ε is a random error term.
3.1.2 Quantile regression model
Although OLS regression can provide the effect of independent variable’s mean change on carbon emissions, it cannot depict the distribution regularity of carbon emissions affected by income inequality. Mosteller and Tukey (1977) pointed out that OLS curves can only display minor differences in the dependent variable’s mean resulting from marginal changes in the independent variable. To present more complete information about the independent variables, we should further depict the regression plots accompanying each quartile. Since mean regression is an incomplete regression on only one distribution, it can only provide partial information about the different dispersions. Therefore, a quantile regression must be employed to comprehensively and precisely explore the likely correlation between income inequality and carbon emissions.
In quantile regression, the regression coefficient is the conditional quantile of the dependent variable y from a given regression variable. It can be described as
In comparison, quantile regression has the following advantages over OLS regression: first, OLS is not robust to the regression of non-normally distributed deviations; nonetheless, quantile regression has the property of being insensitive to outliers, which makes the regression results stabler. Second, whereas conventional OLS regression focuses only on mean changes, quantile regression reveals the whole condition distribution of the dependent variable. Therefore, it captures the behaviors of the dependent variable more specifically. Third, unlike OLS regression, quantile regression does not require the assumption that the residuals belong to the same distribution across the conditional quartiles and is thus able to estimate the coefficients of the dependent variable’s marginal distribution at different quantiles. Altogether, the assumption of quantile regression is relatively looser, and the results are more robust and realistic.
The quantile regression is modelled as follows:
Here, y represents carbon emissions per capita, x denotes the explanatory variables, covering the post-tax and other control variables. β is the coefficient to be estimated, and µ is the residual variable. Quantθ(yit | xit) signifies the θ-conditional quantile of yit conditional on xit. In fact, quantile estimation is to obtain βθ by solving the following equation:
In other words, by giving a weight to the positive error term θ and a weight to the negative error term 1 − θ, the error weighted sum of the minimization is found. As θ increases sequentially across 0 and 1, the conditioned representation of y is obtained as a function of x.
3.2 Variable descriptions and data sources
3.2.1 Variable descriptions
We denote our dependent variable by the magnitude of carbon dioxide emissions per capita. Income inequality is the main explanatory variable, measured by the post-tax Gini coefficient, taking values between 0 and 1. The maximum 1 means that all income is owned by one person and indicates that income disparity is the worst; conversely, the ideal situation is when the value reaches 0, which denotes that income distribution is completely equal. Economic growth (lngdp) is a key factor influencing carbon emissions, gauged by gross domestic product (GDP) per capita. The square term is introduced into the model to examine the EKC hypothesis and to explore whether an inverse U-shaped relationship exists between economic growth and per capita carbon emissions (Stern, 2004; Mader, 2018).
Energy consumption (lnenergyc) calculates the oil equivalent per capita, which is a potential factor affecting the carbon emissions per capita. Oil is a type of fossil fuel, whose use can produce carbon dioxide. Safar (2022) introduced energy use as a control variable in his study of the relationship between income inequality and carbon emissions. Similarly, we follow his research and introduce energy consumption (lnenergyc) and its squared term (lnenergy2) as control variables. The squared term is mainly used to find out if a reverse U-shaped correlation exists between energy consumption and carbon emissions.
Urbanization (urban) as well as its square term (urban2) is incorporated into our model. The percentage of urban residents in the total population is defined as urbanization. Typically, in the early stages, the urban population is considered to consume more than the rural population, resulting in more carbon emissions. At the same time, urbanization is frequently accompanied by augmented levels of productivity, the advancement of tertiary industries, and infrastructure upgrades. As a result, there may be a quadratic association between urbanization and carbon emissions (Bank, 2012; Wan and Wang, 2014).
Foreign direct investment (fdi) has the ability to impact carbon emissions via “pollution haven” and “pollution halo” effects. The initial impact transpires when energy-intensive firms move to countries with less restrictive environmental regulations, consequently leading to the occurrence of local environmental pollution (Antweiler et al., 2001). This effect fosters the amelioration of the local environment and can be primarily attributed to the influx of foreign capital, which brings advanced knowledge and technology (Antweiler et al., 2001).
Economic structure (gdp2) is defined as the proportion of the manufacturing industry in GDP, reflecting the importance of the manufacturing industry, which is more energy-intensive than the tertiary sector. It is, therefore, expected to be positively correlated with carbon emissions (Feng et al., 2009; Veblen, 2009; Aller et al., 2015; Balogh and Jámbor, 2017; Grunewald et al., 2017; Bai et al., 2020; Aller et al., 2021; Xu et al., 2021).
International trade openness (trade) is expressed as the ratio of exports and imports to GDP. With reference to Antweiler et al. (2001), trade affects environmental degradation mainly through scale, technology, and configuration responses. The scale effect is the environmental degradation caused by the increase in trade openness as the economy expands. Technology spillovers from trade occur through the diffusion of knowledge resulting from the exchange of goods between nations. This transmission of technology can range from explicit transfer through formal educational mechanisms to implicit acquisition through learning-by-doing. Compositional effects are linked to countries’ competitive strengths in the fields of “green” and “foul” sectors with respect to international integration and specialization. Furthermore, it was proved that trade openness could exert a positive effect on income inequality (Ullah et al., 2020), so trade openness might work on carbon emissions through income inequality. Therefore, it is necessary to control the effect of international trade openness on carbon emissions.
Research and development expenditures (rd) are calculated as research spending in percent of GDP. There may be a non-linear relationship between research and development expenditures and carbon outputs. On the one hand, the increase in research and development expenditures can increase productivity, and productivity growth, especially green productivity, facilitates the improvement of environmental quality (Newman and Kenworthy, 1989). On the other hand, expanding production scale and upgrading equipment can increase carbon emission intensity at the beginning of research and development expenditures.
3.2.2 Data sources
Our research data cover 65 countries, including 32 developed countries and 33 developing countries, from 1990 to 2019. The post-tax Gini coefficient data are obtained from Solt’s SWIID (Solt, 2019), which provides a standardization of the data to guarantee coherence and applicability for cross-national studies. The dataset has a bigger sampling size and more recent observations than the World Bank’s World Development Indicators (WDI). Furthermore, it also covers the pre-tax and post-tax Gini coefficients. We choose post-tax Gini coefficients in our study to better examine the impact of social disparity on carbon emissions. In addition, we obtained data for dependent and control variables, both from the WDI database.
4 Empirical results and analyses
According to the results from Stata 17, we carry out our empirical analyses on statistical results, regression results, and robustness check.
4.1 Descriptive analyses
Descriptive statistics for the variables are presented in Table 1. Skewness is used to measure the degree to which a symmetrical distribution deviates. When a skewness value is greater than 0, it indicates a right deviation distribution. In the same way, a skewness value smaller than 0 represents a left-skew distribution. Table 1 shows that three variables, lngdp, urban, and lnenergyc, are left-biased, while other variables indicate a right-biased distribution. The kurtosis measures how much the population distribution peaks. Generally, 0 is a dividing point, which exactly shows the normal distribution. Minus values indicate a flat distribution, while positive values indicate a steep distribution (Chen et al., 2020). Table 1 shows that all variables are more steeply skewed than normal. The Jarque–Bera test examines whether a variable has a normal distribution (Jarque, 2011). Evidence in Table 1 shows that all variables reject the null hypothesis, indicating they are non-normally distributed.
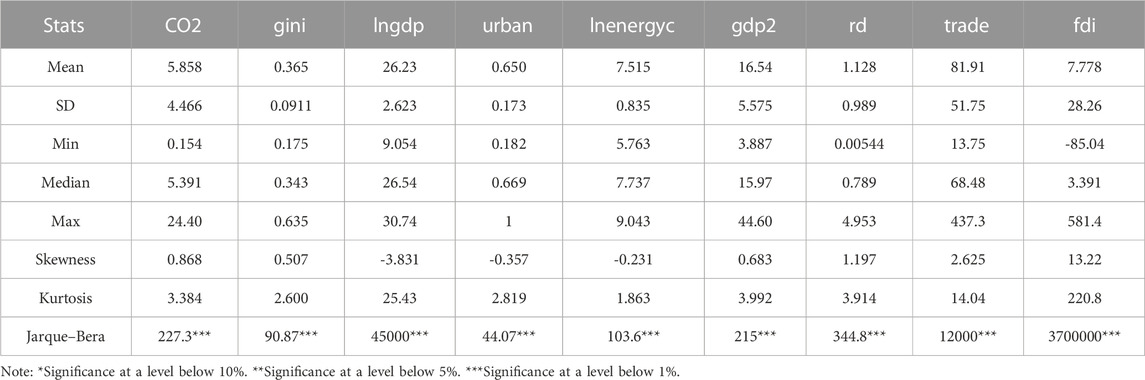
TABLE 1. Descriptive statistics of variables.
Furthermore, a scatter plot is shown in Figure 1, which describes both the post-tax Gini coefficients and carbon emissions per capita of 65 countries from 1990 to 2019. The missing data are not included. Figure 1 illustrates the overall carbon distributions of various countries in distinct post-tax Gini coefficients. Obviously, there are some extreme values for both variables. Taking Russian Federation as an example for the developed country, its carbon emissions can reach a peak of more than 24 metric tons per capita in a single year. Meanwhile, as a developing country, South Africa has the biggest post-tax Gini coefficient among 65 countries, even above 0.6. The existence of extremities precisely clarifies the rationality of the employment of the quantile regression method. In addition, Figure 1 also illustrates a basic law: most developed nations exhibit lower post-tax Gini coefficients and higher carbon emissions than developing countries.
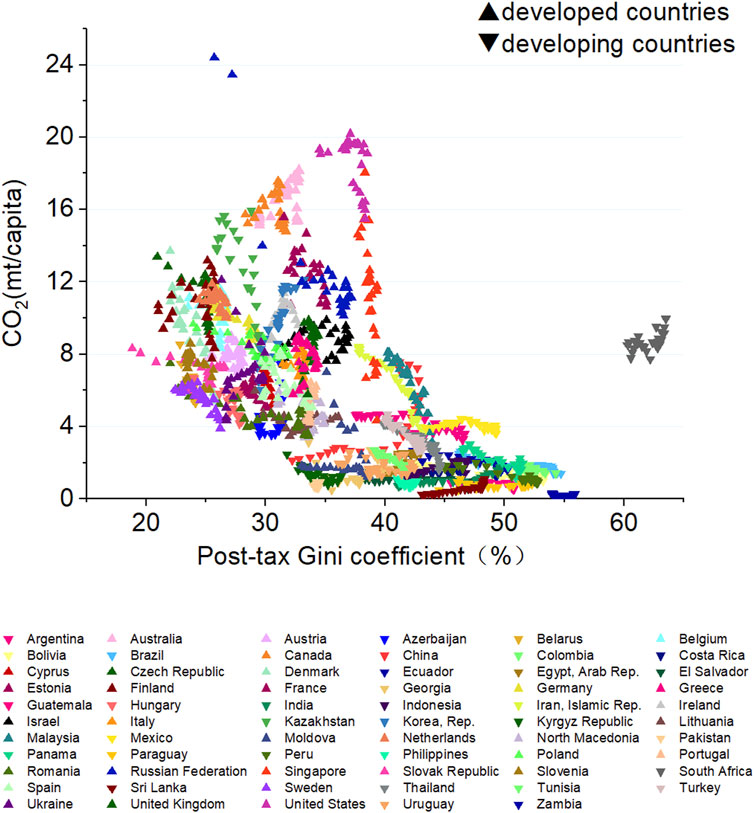
FIGURE 1. Post-tax Gini coefficient vs. per capita CO2 emissions in 65 countries over 1990–2019.
4.2 Regression results
Table 2 displays the findings of the regression analysis. The initial and subsequent columns showcase the outcomes of the OLS regression and the SQR, respectively. The listed results of OLS regression are mainly for comparisons and references. Meanwhile, in order to further figure out how income disparity affects carbon emissions, we depict the OLS regression and SQR curves in Figure 2 so as to explore the coefficient changes in different explanatory variables. In Figure 2, the x-axis displays the carbon emissions’ distribution, and the y-axis displays the size of each contributing factor. Horizontal dashed curves show OLS regression results and their 95 percent credible intervals. Bold solid rows indicate SQR estimates for different quantile points, with shadowed areas indicating the associated 95% confidence intervals. Whether the significance level test is passed depends on the confidence interval. If the interval does not contain 0, the significance level test is satisfying. Hübler (2017) noted that estimates of absolute magnitudes (i.e., 0.05 and 0.95) are susceptible to a number of extremes, so they should be considered seriously. The process of calculating the standard errors from the bootstrap was carried out by repeating 1000 samples using Stata 17.

TABLE 2. OLS and simultaneous regression results.
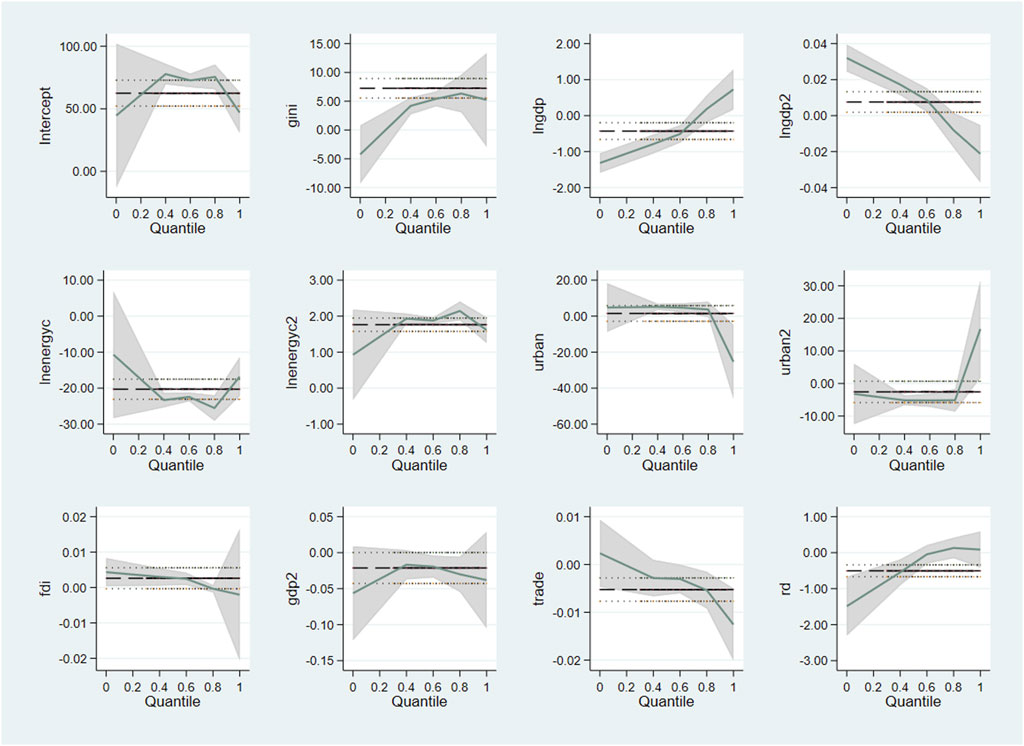
FIGURE 2. OLS and simultaneous quantile regression results.
According to the regression results shown in Table 2 and Figure 2, we provide the following explanations: first, income inequality has a significant positive association with per capita carbon emissions in all quartiles. At the 0.8 quantile, increasing post-tax Gini coefficients contribute the most to carbon emissions per capita. It indicates that the increasing effect is suitable for both developing and developed countries. For developed nations, the detrimental impact is amplified, underscoring the need to prioritize not just economic growth but also efforts toward income inequality reduction as a means of curtailing carbon emissions. Our findings are in line with several prior studies (Zhang and Zhao, 2014; Hao et al., 2016; Balezentis et al., 2020; Chen et al., 2020; Xu et al., 2022a), indicating that the promotion of equity in income distribution contributes to the mitigation of carbon emissions. However, Liu as well as some scholars hold the view that worsening income inequality can facilitate environmental quality (Liu et al., 2019; Huang and Duan, 2020), which is opposite to our view. In addition, the OLS regression results listed in Table 2 show that income disparity is significantly positively associated with carbon emissions, and the estimated regression coefficients of the post-tax Gini coefficient on per capita carbon emissions are significantly larger than the quantile regression coefficients, which suggest that the OLS-estimated impact of income disparity may be overestimated.
Next, the impact of economic growth on carbon emissions is discussed. In Table 2, on the one hand, we can find that GDP per capita significantly negatively affects carbon emissions per capita at all quantiles (except the 0.8 quantile), indicating economic growth is conducive to green development. At the highest quantile (0.8 quantile), the GDP per capita coefficient is not significant but positive, indicating that the increase in carbon emissions with an increase in economic development is not significant. In addition, the OLS regression analysis indicates a significant negative correlation between GDP per capita and carbon emissions per capita. Obviously, OLS regression slightly exaggerates the contribution of economic growth to carbon reduction. However, on the other hand, we find a significant and positive correlation between the square of GDP per capita and carbon emissions at 0.2, 0.4, and 0.6 quantiles, indicating a negative impact on economic growth. At the upper quantile (0.8 quantile), a clear negative association exists between the square of GDP per capita and carbon emissions, suggesting that higher income levels help reduce carbon emissions. Meanwhile, the OLS regression results indicate a significant positive impact of quadratic GDP per capita on carbon emissions, without any negative effect on carbon emissions in the top quantile.
In summary, the relationship between GDP and carbon emissions displays a non-linear pattern that varies across various stages and sizes of the economy. When income levels exceed a critical level, economic growth can ameliorate environmental degradation to some extent or curb environmental improvement. In detail, for developing countries, the effect of economic growth on carbon emissions seems like a U shape, which is basically consistent with the conclusions of Hao et al. (2016) who reported a U-shaped relationship between income per capita and carbon emissions per capita whereas an inverted U-shaped relationship for developed countries, which is consistent with previous carbon emissions studies based on the EKC hypothesis (Luo et al., 2016; Hailemariam et al., 2019). In addition, studies that hold economic growth can accelerate carbon emissions in one country also exist, such as Iqbal et al. (2022).Therefore, for a specific country’s certain stage, the influence might vary and should be treated prudently. In particular, we also note that the adverse impact of economic growth is weaker than its beneficial impact on developing countries. This is probably because economic growth can contribute to green innovation. This, in turn, can significantly aid in reducing carbon emissions in developing nations.
Finally, the impact of other controlling variables is discussed. First, energy consumption as well as its quadratic component is discussed. Based on our findings, the impact of energy consumption on carbon emissions is substantially negative at all quantiles, which is consistent with OLS regression results, meaning that more energy consumption boosts the decrease in carbon emissions. As for the reason, we suppose technological innovation may play a critical role in this mechanism, contributing to cleaner disposal of wastes. Still, when we introduce the quadratic component of energy consumption into the model, quantile regression and OLS regression results reverse dramatically, showing that quadratic energy consumption per capita can affect carbon emissions significantly and positively. It demonstrates that when energy consumption exceeds a certain value, the environment can be deteriorated. As a result, there may be a U-shaped nexus between energy use and carbon emissions.
Next, for urbanization and its quadratic component, at all quantiles, it is proven that a clear positive correlation exists between urbanization and carbon emissions, and the effect coefficient is relatively stable. However, when we square the urbanization, it is found that there is a significantly negative effect between quadratic urbanization and carbon emissions at all quantiles, and the effect coefficient is still very stable. Therefore, the EKC hypothesis accepts the presence of an inverted U-shaped correlation between urbanization and carbon emissions, which is supported by investigations conducted by ADB, Wan and Wang (2014), Wan et al. (2022) , Xu et al. (2022b), and Bank (2012). However, the results of OLS regression of urbanization or its quadratic component are not significant, which is an indication of its low explanatory power.
Third, foreign direct investment is proven to be significantly and positively associated with carbon emissions at all quantiles except for the 0.8 quantile, and the effect diminishes as foreign direct investment increases, i.e., the significance confidence level of the 0.2 and 0.4 quantiles is much higher than that of the 0.6 quantile. In other words, compared with developed countries, foreign direct investment has a greater impact on carbon emissions in developing countries than in developed countries. However, the results of the OLS regression show a notable positive association between foreign direct investment and carbon emissions, somewhat accentuating the impact of fdi on carbon emissions. Similarly, Shah et al. (2022) also proved that a huge foreign investment inflow can adversely affect environmental quality.
Fourth, in our research, gdp2 represents the proportion of the manufacturing industry to GDP, which is used to describe the economic structure. Based on our results, we can find that the economic structure is significantly and negatively related to carbon emissions at all quantiles, and OLS regression shows a similar result, indicating that as the manufacturing industry develops, carbon emissions will decrease. We suppose this may also be related to green production in the manufacturing industry. The production of renewable resources can contribute to the melioration of environmental quality. Furthermore, the outcomes of both OLS and quantile regression analyses reveal that international trade openness significantly contributes to the reduction of carbon emissions, which is in agreement with Zhu et al. (2016) ,which posited that international trade has a positive impact on mitigating the deterioration of the environment in ASEAN countries.
Last, we explore the impact of research and development expenditures, finding that it is significantly and negatively correlated with carbon emissions by OLS regression. However, our quantile regression results show that only at the low quantiles (0.2 and 0.4 quantiles), research and development expenditures can significantly and negatively affect carbon emissions, suggesting that for developing countries, the increase in research and development expenditures can benefit carbon reduction. Obviously, OLS regression has not precisely grasped the impact of coefficient changes in research and development expenditures on carbon emissions in the long term.
Overall, comparing each equation’s pseudo-R2, it can be clearly seen that the fit of the equations increases with the conditional quantile, which indicates that the quantile regression model developed in this paper has strong explanatory power.
4.3 Robustness check
To further assess the robustness of the quantile regression model, we conduct robustness tests using the following three methods.
First, we use generalized quantile regression (GQR) by Powell (2020) to further analyze the data. The estimates of GQR are listed in Table 3. According to the GQR results, the marginal impact of the post-tax coefficient is significantly positive at all quantiles, which coincides with the results of the SQR analysis. Therefore, our results are robust to different quantile regression approaches.
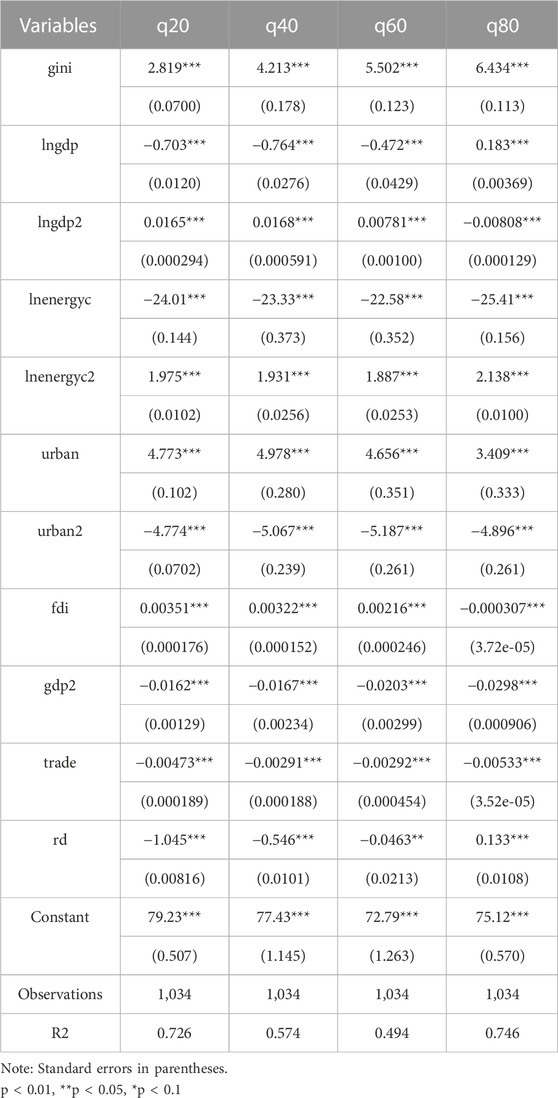
TABLE 3. Generalized quantile regression results.
Second, we change the expression of income inequality with the Gini index sourced from the World Bank to check whether the effect of income equality on carbon emissions is affected by the measurement of our main explanatory variable. Then, OLS regression and SQR are carried out, and the results are shown in Table 4. By comparing with Table 2, the significance of income inequality is consistent with that of Table 2, which proves the robustness of our model.
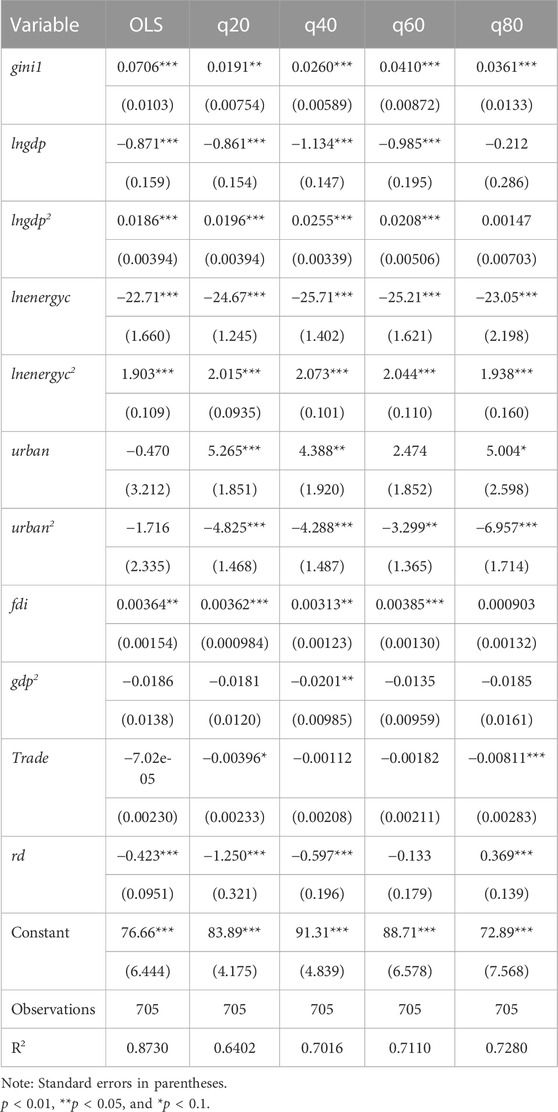
TABLE 4. OLS and simultaneous regression results using the Gini index from the World Bank.
Finally, in order to test whether there are any omitted variables disturbing our results, we introduce a potential control variable into our model. Table 5 shows the estimates when the potential control variable, population, is included in the model. It is clear that the impact of coefficient of income inequality on carbon emissions still follows a similar trend to the original model. Therefore, our results are robust in the aforementioned three checks.
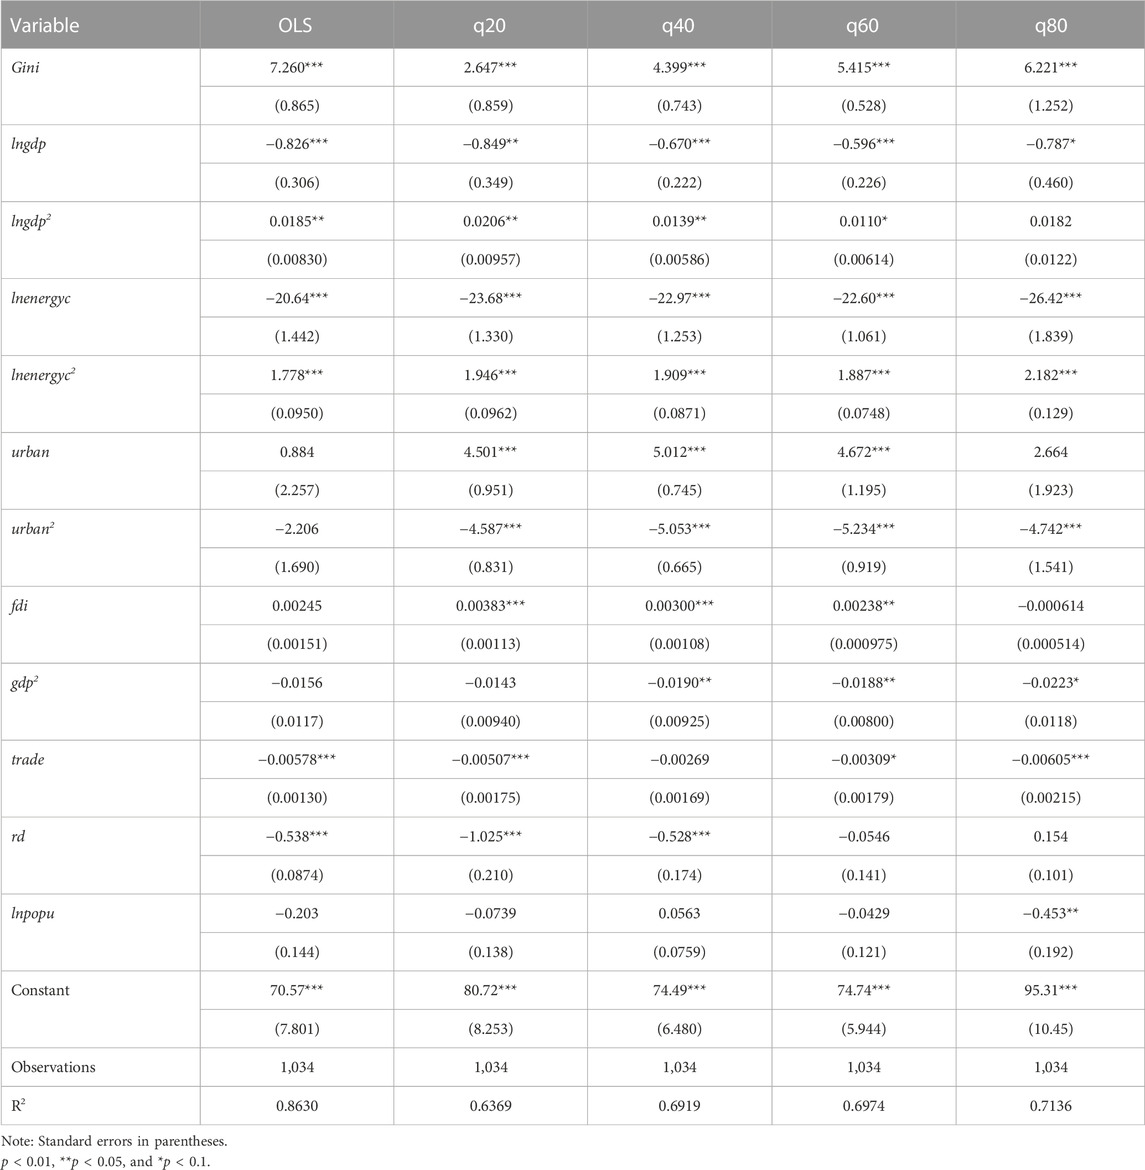
TABLE 5. OLS and simultaneous regression results adding “population” into the model.
5 Conclusion and implications
Amid the rising global concern for environmental protection, specifically regarding carbon emissions, researchers are increasingly investigating the factors linked to carbon emissions. In the past few years, scholars have increasingly recognized the importance of the gap in income distribution and have begun to study the impact of income inequality on carbon emissions. Given the differences in research samples, methodologies, and time spans, there is no consistent conclusion to date. Informed by previous research, we analyzed a panel of data from 65 countries (32 developed and 33 developing countries) for the period 1990–2019 to investigate the impact of income inequality on carbon emissions. Meanwhile, we focus on the diverse impact of income inequality on carbon emissions, so SQR is mainly utilized to obtain empirical results, overcoming the limitation that OLS cannot reflect the heterogeneity at different carbon emission quantiles.
The results of the SQR indicate a small degree of diversity in the impact of income inequality on carbon emissions across countries at different stages of development. The impact of income inequality on carbon emissions is significantly positive in both developing and developed countries, indicating an uneven income distribution can worsen environmental quality, and the impact is more significant for developed countries. Furthermore, there exists a non-linear correlation between economic expansion and carbon pollution. This relationship fluctuates across various levels of economic growth and at varying degrees of economic development. In developing countries, the favorable consequences of economic growth are stronger than the detrimental consequences. The effect of economic growth is like a U shape for developing countries whereas an inverted U shape for developed countries.
For other variables, we also draw some interesting conclusions. The U-shaped correlation exists between energy consumption and carbon emissions, while the inverted U-shaped correlation exists between urbanization and carbon emissions. The detrimental impact of foreign direct investment on the environment is significant and weak in all quantiles (except the 0.8 quartile) and is more pronounced in developing countries. The influence of economic structure and openness to international trade on carbon emissions is significantly negative in all quartiles. Research and development expenditures only in low quantiles can significantly and negatively affect carbon emissions. For developing countries, the increase in research and development expenditures leads to carbon reduction.
Based on our empirical findings, we offer the following insights: first, our study demonstrated that uneven income distribution can definitely worsen environmental quality, and this effect is more significant in developed countries. As a result, it is integral for the world, especially developed countries, to take measures to alleviate the income gap for achieving SDGs. To reach rationality in income distribution, countries should establish and perfect the social security system and the tax system as well as extend the coverage of the social security system to the poor areas and vulnerable groups and rationalize the tax system based on individuals’ income levels. In addition, corresponding policies and documents should be formulated to strengthen social relief, optimize social welfare, and pay attention to the lives of vulnerable groups. It is essential to strengthen legislation to ensure the legal rights of the poor and vulnerable groups. Through these measures, inequality in income distribution will be gradually alleviated, thus fulfilling the win–win goals of a harmonious society and sustainable development.
Second, economic growth showed a non-linear relationship with carbon emissions. In different economic development stages and different economic scales, the effect varies. As a matter of fact, every country is an emitter in the world; thus, all the countries and their people should establish the concept of sustainable development. In every stage, countries should try to reach a trade-off between economic development and environmental quality and always remember that the path of pollution first and treatment later is not desirable. In the process of economic development, countries and individuals should care for the surrounding environment; for instance, disposing of nuclear waste water is very harmful to the sea and, thus, should be forbidden and spurned.
Third, carbon emissions can be affected by energy consumption, which reminds the global community to promote energy efficiency and exploit new sources of energy. Clean and renewable resources are required to be promoted widely, especially in relatively vulnerable regions in order to facilitate environmental protection (Shah et al., 2023).
Fourth, given urbanization’s inverted U-shaped effect on carbon emissions, countries need to promote balanced development of cities of different sizes to facilitate the realization of the beneficial effects of urbanization. The concept of sustainable urban and environmental development should be established. The urbanization process should be the intensification process of land use and the industrialization process of transformation of agricultural land into urban land. Whether the size of a city is appropriate should be measured in terms of various aspects of urban economic benefits and environmental and ecological benefits. Whether the scale of a city is appropriate should be measured in terms of various aspects of urban economic benefits and environmental and ecological benefits. In addition, people should establish the development concept of urbanization and modernization, grasp the view of the overall development of the city and region as well as town and countryside, and realize the long-term goal of urban and rural integration.
Fifth, since foreign direct investment can worsen our environment, it is necessary for the global community, especially developing countries, to formulate relevant schemes to focus on environmental protection in the process of foreign investment. Shah et al. (2022) demonstrated that it is necessary for the government to reinforce policy directions when increasing the inflow of foreign investment. Sixth, priority on manufacturing industry development can contribute to reducing carbon emissions, especially the production of renewable resources.
Lastly, developing countries should expand their research and development expenditures and put emphasis on the development of scientific research and education. In the field of scientific research and education, more conducive policies should be adopted to encourage scholars and excellent talents to breed advanced technologies that are environmentally friendly and to foster environmental technical expertise. In this way, developing countries will be able to cultivate high-caliber human resources and advanced technologies to better build environmentally friendly societies.
Data availability statement
The raw data supporting the conclusion of this article will be made available by the authors, without undue reservation.
Author contributions
CC: conceptualization, supervision, and writing–review and editing. SL: data analysis, visualization, and writing–review and editing. QY: visualization and writing–review and editing. QL: writing–review and editing. XG: conceptualization and writing–review and editing. HZ: formal analysis and writing–review and editing.
Funding
The author(s) declare that no financial support was received for the research, authorship, and/or publication of this article.
Conflict of interest
The authors declare that the research was conducted in the absence of any commercial or financial relationships that could be construed as a potential conflict of interest.
Publisher’s note
All claims expressed in this article are solely those of the authors and do not necessarily represent those of their affiliated organizations, or those of the publisher, the editors and the reviewers. Any product that may be evaluated in this article, or claim that may be made by its manufacturer, is not guaranteed or endorsed by the publisher.
Supplementary material
The Supplementary Material for this article can be found online at: https://www.frontiersin.org/articles/10.3389/fenvs.2023.1271457/full#supplementary-material
References
Aller, C., Ductor, L., and Grechyna, D. (2021). Robust determinants of CO2 emissions. Energy Econ. 96, 105154. doi:10.1016/j.eneco.2021.105154
Aller, C., Ductor, L., and Herrerias, M. J. (2015). The world trade network and the environment. Energy Econ. 52, 55–68. doi:10.1016/j.eneco.2015.09.008
Antweiler, W., Copeland, B. R., and Taylor, M. S. (2001). Is Free Trade Good for the Environment? Am. Econ. Rev. 91, 877–908. doi:10.1257/aer.91.4.877
Baek, J., and Gweisah, G. (2013). Does income inequality harm the environment? empirical evidence from the United States. Energy Policy 62, 1434–1437. doi:10.1016/j.enpol.2013.07.097
Bai, C., Feng, C., Yan, H., Yi, X., Chen, Z., and Wei, W. (2020). Will income inequality influence the abatement effect of renewable energy technological innovation on carbon dioxide emissions? J. Environ. Manage. 264, 110482. doi:10.1016/j.jenvman.2020.110482
Balezentis, T., Liobikiene, G., Streimikiene, D., and Sun, K. (2020). The impact of income inequality on consumption-based greenhouse gas emissions at the global level: A partially linear approach. J. Environ. Manage. 267, 110635. doi:10.1016/j.jenvman.2020.110635
Baloch, M. A., Khan, S. U., Ulucak, Z. S., and Ahmad, A. (2020). Analyzing the relationship between poverty, income inequality, and CO(2) emission in Sub-Saharan African countries. Sci. Total Environ. 740, 139867. doi:10.1016/j.scitotenv.2020.139867
Balogh, J. M., and Jámbor, A. (2017). Determinants of CO2 Emission: A Global Evidence. Int. J. Energy Econ. Policy 7 (5), 217–226.
Bank, A. D. (2012). Key Indicators for Asia and the pacific 2012. Mandaluyong City: Asian Development Bank.
Bhorat, H., and Naidoo, K. (2019). “Drivers of inequality in the context of the growth-poverty-inequality nexus in africa: An overview of key issues,” in Income inequality trends in sub-saharan Africa. Editors H. Bhorat, and K. Naidoo (online: UN-iLibrary), 52–73.
Bowles, S., and Park, Y. (2005). Emulation, Inequality, and Work Hours: Was Thorsten Veblen Right? Econ. J. 115 (507), F397–F412. doi:10.1111/j.1468-0297.2005.01042.x
Boyce, J. K. (1994). Inequality as a cause of environmental degradation. Ecol. Econ. 11 (3), 169–178. doi:10.1016/0921-8009(94)90198-8
Chen, J., Cheng, S., and Song, M. (2017). Decomposing inequality in energy-related CO2 emissions by source and source increment: The roles of production and residential consumption. Energy Policy 107, 698–710. doi:10.1016/j.enpol.2017.05.003
Chen, J., Xian, Q., Zhou, J., and Li, D. (2020). Impact of income inequality on CO(2) emissions in G20 countries. J. Environ. Manage. 271, 110987. doi:10.1016/j.jenvman.2020.110987
Coondoo, D., and Dinda, S. (2008). Carbon dioxide emission and income: A temporal analysis of cross-country distributional patterns. Ecol. Econ. 65 (2), 375–385. doi:10.1016/j.ecolecon.2007.07.001
Demir, C., Cergibozan, R., and Gök, A. (2019). Income inequality and CO2 emissions: Empirical evidence from Turkey. Energy Environ. 30 (3), 444–461. doi:10.1177/0958305x18793109
Feng, K., Hubacek, K., and Guan, D. (2009). Lifestyles, technology and CO2 emissions in China: A regional comparative analysis. Ecol. Econ. 69 (1), 145–154. doi:10.1016/j.ecolecon.2009.08.007
Fernandes, A. J. C., Rodrigues, R. G., and Ferreira, J. J. (2022). National innovation systems and sustainability: What is the role of the environmental dimension? J. Clean. Prod. 347, 131164. doi:10.1016/j.jclepro.2022.131164
Grunewald, N., Klasen, S., Martínez-Zarzoso, I., and Muris, C. (2017). The Trade-off Between Income Inequality and Carbon Dioxide Emissions. Ecol. Econ. 142, 249–256. doi:10.1016/j.ecolecon.2017.06.034
Hailemariam, A., Dzhumashev, R., and Shahbaz, M. (2019). Carbon emissions, income inequality and economic development. Empir. Econ. 59 (3), 1139–1159. doi:10.1007/s00181-019-01664-x
Hao, Y., Chen, H., and Zhang, Q. (2016). Will income inequality affect environmental quality? Analysis based on China's provincial panel data. Ecol. Indic. 67, 533–542. doi:10.1016/j.ecolind.2016.03.025
Huang, Z., and Duan, H. (2020). Estimating the threshold interactions between income inequality and carbon emissions. J. Environ. Manage. 263, 110393. doi:10.1016/j.jenvman.2020.110393
Hübler, M. (2017). The inequality-emissions nexus in the context of trade and development: A quantile regression approach. Ecol. Econ. 134, 174–185. doi:10.1016/j.ecolecon.2016.12.015
Iqbal, K., Hassan, S. T., Wang, Y., Shah, M. H., Syed, M., and Khurshaid, K. (2022). To Achieve Carbon Neutrality Targets in Pakistan: New Insights of Information and Communication Technology and Economic Globalization. Front. Environ. Sci. 9. doi:10.3389/fenvs.2021.805360
Iyer, G. C., Ledna, C., Clarke, L., Edmonds, J. A., Mcjeon, H., Kyle, P. G., et al. (2017). Measuring progress from nationally determined contributions to mid-century strategies. Nat. Clim. Chang. 7, 871–874. doi:10.1038/s41558-017-0005-9
Jarque, C. (2011). “Jarque-Bera Test,” in International encyclopedia of statistical science (Berlin, Heidelberg: Springer), 701–702.
Jorgenson, A., Schor, J., and Huang, X. (2017). Income Inequality and Carbon Emissions in the United States: A State-level Analysis, 1997–2012. Ecol. Econ. 134, 40–48. doi:10.1016/j.ecolecon.2016.12.016
Knight, K. W., Schor, J. B., and Jorgenson, A. K. (2017). Wealth Inequality and Carbon Emissions in High-income Countries. Soc. Curr. 4 (5), 403–412. doi:10.1177/2329496517704872
Kuyper, J., Schroeder, H., and Linnér, B.-O. (2018). The Evolution of the UNFCCC. Annu. Rev. Environ. Resour. 43 (1), 343–368. doi:10.1146/annurev-environ-102017-030119
Liu, Q., Wang, S., Zhang, W., and Li, J. (2018). Income distribution and environmental quality in China: A spatial econometric perspective. J. Clean. Prod. 205, 14–26. doi:10.1016/j.jclepro.2018.09.090
Liu, Q., Wang, S., Zhang, W., Li, J., and Kong, Y. (2019). Examining the effects of income inequality on CO2 emissions: Evidence from non-spatial and spatial perspectives. Appl. Energy 236, 163–171. doi:10.1016/j.apenergy.2018.11.082
Lu, M.-T., Tsai, J.-F., Shen, S.-P., Lin, M.-H., and Hu, Y.-C. (2020). Estimating sustainable development performance in the electrical wire and cable industry: Applying the integrated fuzzy MADM approach. J. Clean. Prod. 277, 122440. doi:10.1016/j.jclepro.2020.122440
Luo, G., Weng, J.-H., Zhang, Q., and Hao, Y. (2016). A reexamination of the existence of environmental Kuznets curve for CO2 emissions: evidence from G20 countries. Nat. Hazards 85 (2), 1023–1042. doi:10.1007/s11069-016-2618-0
Mader, S. (2018). The nexus between social inequality and CO2 emissions revisited: Challenging its empirical validity. Environ. Sci. Policy 89, 322–329. doi:10.1016/j.envsci.2018.08.009
Mahalik, M. K., Mallick, H., Padhan, H., and Sahoo, B. (2018). Is skewed income distribution good for environmental quality? A comparative analysis among selected BRICS countries. Environ. Sci. Pollut. Res. Int. 25 (23), 23170–23194. doi:10.1007/s11356-018-2401-8
Maher, R., and Buhmann, K. (2019). Meaningful stakeholder engagement: Bottom-up initiatives within global governance frameworks. Geoforum 107, 231–234. doi:10.1016/j.geoforum.2019.06.013
Maji, I. K. (2019). Impact of clean energy and inclusive development on CO2 emissions in sub-Saharan Africa. J. Clean. Prod. 240, 118186. doi:10.1016/j.jclepro.2019.118186
Mosteller, F., and Tukey, J. W. (1977). Data analysis and regression: A second course in statistics. New York: Pearson.
Newman, P. W. G., and Kenworthy, J. R. (1989). Gasoline Consumption and Cities. J. Am. Plann. Assoc. 55 (1), 24–37. doi:10.1080/01944368908975398
Nico, H., Abay, M., and Erwin, B. (2001). Income inequality and the environment: aggregation bias in environmental Kuznets curves. Ecol. Econ. 38 (3), 359–367. doi:10.1016/S0921-8009(01)00171-9
Padhan, H., Haouas, I., Sahoo, B., and Heshmati, A. (2019). What matters for environmental quality in the Next Eleven Countries: economic growth or income inequality? Environ. Sci. Pollut. Res. 26, 23129–23148. doi:10.1007/s11356-019-05568-2
Policardo, L. (2014). Is Democracy Good for the Environment? Quasi-Experimental Evidence from Regime Transitions. Environ. Resour. Econ. 64 (2), 275–300. doi:10.1007/s10640-014-9870-0
Ravallion, M., Heil, M., and Jalan, J. (2000). Carbon emissions and income inequality. Oxf. Econ. Pap. 52 (4), 651–669. doi:10.1093/oep/52.4.651
Safar, W. (2022). Income inequality and CO2 emissions in France: Does income inequality indicator matter? J. Clean. Prod. 370, 133457. doi:10.1016/j.jclepro.2022.133457
Shah, M. H., De Chun, H., Wang, Y., Ullah, I., Hassan, S. T., Fareed, Z., et al. (2023). Analyzing Nexus between Economic Complexity, Renewable Energy, and Environmental Quality in Japan: A New Evidence from QARDL Approach. Int. J. Energy Res. 2023, 1–14. doi:10.1155/2023/1683231
Shah, M. H., Salem, S., Ahmed, B., Ullah, I., Rehman, A., Zeeshan, M., et al. (2022). Nexus Between Foreign Direct Investment Inflow, Renewable Energy Consumption, Ambient Air Pollution, and Human Mortality: A Public Health Perspective From Non-linear ARDL Approach. Front. Public Health 9, 814208. doi:10.3389/fpubh.2021.814208
Shukla, P., Skea, J., Calvo Buendia, E., Masson-Delmotte, V., Pörtner, H.-O., Roberts, D., et al. (2019). “IPCC, 2019: Climate Change and Land: an IPCC special report on climate change, desertification, land degradation, sustainable land management, food security, and greenhouse gas fluxes in terrestrial ecosystems,” in An IPCC special report on climate change, desertification, land degradation, sustainable land management, food security, and greenhouse gas fluxes in terrestrial ecosystems.
Solt, F. (2019). SWIID version 8.1. https://fsolt.org/swiid/. Measuring Income Inequality Across Countries and Over Time: The Standardized World Income Inequality Database
Stern, D. I. (2004). The Rise and Fall of the Environmental Kuznets Curve. World Devel 32 (8), 1419–1439. doi:10.1016/j.worlddev.2004.03.004
The state council of the people's republic of China (2021). China maps path to carbon peak, neutrality under new development philosophy. Available: https://www.gov.cn/zhengce/2021-10/24/content_5644613.htm (Accessed October 24, 2021).
The United Nations Brazil, (2015). The Sustainable Development Goals in Brazil. Available: https://brasil.un.org/pt-br (Accessed May 13, 2015).
The United Nations (U.N.) (2023). Halfway to 2030, world ‘nowhere near’ reaching Global Goals, UN warns. Available: https://news.un.org/en/story/2023/07/1138777 (Accessed July 17, 2023).
The World Inequality Database (2022). World inequality Report 2022. Cambridge: Harvard University Press.
Uddin, M. M., Mishra, V., and Smyth, R. (2020). Income inequality and CO2 emissions in the G7, 1870–2014: Evidence from non-parametric modelling. Energy Econ. 88, 104780. doi:10.1016/j.eneco.2020.104780
Ullah, I., Xuefeng, Q., Shah, M. H., Rehman, A., Ali, S., and Ahmed, Z. (2020). Forecasting Wages Inequality in Response of Trade Openness in Pakistan: An Artificial Neural Network Approach. Singap. Econ. Rev., 1–16. doi:10.1142/s0217590820500058
Uzar, U., and Eyuboglu, K. (2019). The nexus between income inequality and CO2 emissions in Turkey. J. Clean. Prod. 227, 149–157. doi:10.1016/j.jclepro.2019.04.169
Wamsler, C., Schäpke, N., Fraude, C., Stasiak, D., Bruhn, T., Lawrence, M., et al. (2020). Enabling new mindsets and transformative skills for negotiating and activating climate action: Lessons from UNFCCC conferences of the parties. Environ. Sci. Policy 112, 227–235. doi:10.1016/j.envsci.2020.06.005
Wan, G., and Wang, C. (2014). Unprecedented Urbanisation in Asia and Its Impacts on the Environment. Aust. Econ. Rev. 47 (3), 378–385. doi:10.1111/1467-8462.12076
Wan, G., Wang, C., Wang, J., and Zhang, X. (2022). The income inequality-CO2 emissions nexus: Transmission mechanisms. Ecol. Econ. 195, 107360. doi:10.1016/j.ecolecon.2022.107360
Wolde-Rufael, Y., and Idowu, S. O. (2017). Income distribution and CO2 emission: A comparative analysis for China and India. Sust. Energ. Rev 74, 1336–1345. doi:10.1016/j.rser.2016.11.149
Xu, X., and He, Y. (2022). Blockchain application in modern logistics information sharing: a review and case study analysis. Prod. Plan. Control, 1–15. doi:10.1080/09537287.2022.2058997
Xu, X., Lin, Z., Li, X., Shang, C., and Shen, Q. (2022a). Multi-objective robust optimisation model for MDVRPLS in refined oil distribution. Int. J. Prod. Res. 60 (22), 6772–6792. doi:10.1080/00207543.2021.1887534
Xu, X., Liu, W., and Yu, L. (2022b). Trajectory prediction for heterogeneous traffic-agents using knowledge correction data-driven model. Inf. Sci. 608, 375–391. doi:10.1016/j.ins.2022.06.073
Xu, X., Wang, C., and Zhou, P. (2021). GVRP considered oil-gas recovery in refined oil distribution: From an environmental perspective. Int. J. Product. Econ. 235, 108078. doi:10.1016/j.ijpe.2021.108078
Xu, X., and Wei, Z. (2023). Dynamic pickup and delivery problem with transshipments and LIFO constraints. Comput. Ind. Eng. 175, 108835. doi:10.1016/j.cie.2022.108835
Zhang, C., and Zhao, W. (2014). Panel estimation for income inequality and CO2 emissions: A regional analysis in China. Appl. Energy 136, 382–392. doi:10.1016/j.apenergy.2014.09.048
Keywords: income inequality, carbon emissions, quantile regression, developed countries, developing countries
Citation: Che C, Li S, Yin Q, Li Q, Geng X and Zheng H (2023) Does income inequality have a heterogeneous effect on carbon emissions between developed and developing countries? Evidence from simultaneous quantile regression. Front. Environ. Sci. 11:1271457. doi: 10.3389/fenvs.2023.1271457
Received: 03 August 2023; Accepted: 28 September 2023;
Published: 19 October 2023.
Edited by:
Elias T. Ayuk, Independent Researcher, GhanaReviewed by:
Maham Furqan, Oregon State University, United StatesMuhammad Haroon Shah, Wuxi University, China
Copyright © 2023 Che, Li, Yin, Li, Geng and Zheng. This is an open-access article distributed under the terms of the Creative Commons Attribution License (CC BY). The use, distribution or reproduction in other forums is permitted, provided the original author(s) and the copyright owner(s) are credited and that the original publication in this journal is cited, in accordance with accepted academic practice. No use, distribution or reproduction is permitted which does not comply with these terms.
*Correspondence: Suhui Li, UzIyMDgwMDA5QHMudXBjLmVkdS5jbg==
†These authors have contributed equally to this work and share first authorship