 Woo O’Reilly
 Danswell Starrs
94% of researchers rate our articles as excellent or good
Learn more about the work of our research integrity team to safeguard the quality of each article we publish.
Find out more
POLICY AND PRACTICE REVIEWS article
Front. Environ. Sci. , 13 November 2023
Sec. Freshwater Science
Volume 11 - 2023 | https://doi.org/10.3389/fenvs.2023.1270247
This article is part of the Research Topic Environmental Citizen Studies in Freshwater Science View all 8 articles
Citizen science is a powerful force for scientific enquiry, allowing volunteers to collect data over broader spatial and temporal scales than could be achieved using traditional methods. Many citizen science programs, however, have suffered from a lack of confidence in the data due to a range of both real and perceived issues, resulting in low recognition and a lack of data uptake by researchers and policymakers. This in turn can threaten the very existence of citizen science programs that are dependent on external funding. In this paper, we explore the shift to a ‘science-first’ approach undertaken by a long-term citizen science program, Upper Murrumbidgee Waterwatch. The ‘science-first’ approach has enabled Upper Murrumbidgee Waterwatch to better partition and appropriately manage the program’s key areas of data collection, education and awareness raising. Moving towards a contributory typology, whilst recognising the positive elements that come with the original collaborative model, has enabled more strategic data collection and better data quality. This has resulted in greater data uptake in catchment management decision-making as well as secure, long-term funding for the program.
The origin of citizen science programs has been described as spanning a continuum with regards to their primary purpose (Bonney et al., 2009a). At one end, citizen science programs may have a ‘community science’ or a co-created origin, in which interested people come together to participate in a specific, often small-scale, program. In these instances, the primary goal may be non-systematic noting of specific phenomena or occurrences (e.g., species observations), due to a personal or social motivation (e.g., concern for nature; Phillips et al., 2019). At the other end of the continuum, citizen science programs may be established primarily to collect information and data, with the citizen science component a means of collecting data cost-effectively, across broad spatial and temporal scales (contributory typology; Bonney et al., 2009a). Such programs may have a specific question or hypothesis in mind, and a degree of centralised co-ordination. The application of clear scientific principles regarding data collection methods is also a feature. This typology typically focusses on outputs as the key objectives (e.g., publications, volume of data collected; Bonney et al., 2009b), but does not explicitly value the experience or motivations of the participants (Phillips et al., 2019) or offer participant opportunities beyond the contribution of data (Land-Zandstra et al., 2021).
In the middle of the continuum lies the collaborative typology (Bonney et al., 2009a). This has elements of the contributory typology (e.g., centralised and focussed question framing, development of hypotheses), but has a greater role for participants in shaping data collection methods, data analysis and dissemination (Bonney et al., 2009a). This typology may lend itself to greater levels of volunteer participation and experience (Bonney et al., 2009b; Land-Zandstra et al., 2021) and other desirable outcomes such as awareness-raising and education (Bonney et al., 2016; Peter et al., 2019). A potential risk is that greater inclusion of volunteer participation in program design and implementation may lead to increased perceptions of poor data quality and utility of citizen science data (e.g., Brown and Williams, 2019; Schacher et al., 2023). For example, greater autonomy in experimental approaches may result in systemic issues such as spatial and temporal bias (Callaghan et al., 2019; Schacher et al., 2023), low data accuracy and precision (Kosmala et al., 2016), which may result in distrust in citizen science data (Finlayson and Mitchell, 1999; Nascimento et al., 2018; Balázs et a. 2021). As such, citizen science programs with the collaborative typology may face a trade-off between the volunteer experience and managing real and perceived risks associated with data quality.
While smaller, co-created programs may exist with one-off project grants, larger, long-term programs (more often contributory or collaborative typology) can struggle to persist without substantial, ongoing funding. Such programs, typically with many participants, or collecting data over a wide geographic area, may have imbedded costs relating to sampling equipment, paid staff to help coordinate and support volunteers, as well as possible costs associated with implementing education and engagement activities (Tulloch et al., 2013; Capdevila et al., 2020). Programs receiving such funding, may need to adhere to a range of key performance indicators that span both objectives related to social engagement and education, as well as data collection (Bonney et al., 2009b; Kieslinger et al., 2017). While such a range of objectives can potentially broaden out the program’s appeal to different funding sources, this can lead to challenges in managing the perceptions from those who may view the trade-offs between community engagement and data quality unfavourably.
In the context of citizen science programs, a key challenge exists when a program must adapt to new or shifting priorities from funding bodies. Core issues, such as the legacy, value and purpose of a citizen science program may be challenged if a program must shift from, say, a co-created or collaborative model to operate with more similarities to a contributory program (Bonney et al., 2023). This may occur if demonstrating data uptake is a funding requirement and addressing real and perceived bias against citizen science data is required for that to be achieved.
In this paper we present the experience of the Upper Murrumbidgee Waterwatch program, and how it successfully shifted aspects of its citizen science program to meet new funding requirements. We describe its journey to improve data quality assurance and control processes and go from being an underutilised resource on the fringe to an integral source of catchment health information in local land management and policy.
The national Waterwatch program, established in 1992, was founded on the principles of participatory action research (Thomson, 2007; Bonney et al., 2020). Originally funded through the Australian Government’s Natural Heritage Trust, the program’s catchcry was ‘communities caring for catchments’ with its goal being to help the community understand, monitor, care for and sustainably manage their waterways (Waterwatch Australia Steering Committee, 2002). The national Waterwatch program had two core objectives that align closely with the collaborative typology: participatory learning for sustainability, and community-based monitoring (Thomson, 2007). Delivered nationally through a wide range of regional natural resource management bodies, non-government organisations, water authorities and local government, the program achieved significant engagement, with around 15,000 volunteers and 1,200 schools regularly participating in regional Waterwatch programs (Thomson, 2007). As part of its participatory learning objectives, the Waterwatch program delivered education through both in-class and outdoor activities throughout its 30 years, implemented through both primary and secondary curriculum. In addition to engagement through schools, the program was also heavily involved in community awareness initiatives. The objectives associated with education and awareness arose due to increased community concern for issues associated with environmental degradation and sustainability (Hansen and Bonney, 2022).
The second objective of the national Waterwatch program was to achieve community-based monitoring of waterway and catchment health (Waterwatch Australia Steering Committee, 2002; Thomson, 2007). Community-based monitoring for environmental change had been recognised as a significant opportunity to support ongoing environmental management while also raising awareness and public engagement (Boulton, 1999; Finlayson and Mitchell, 1999; Ladson et al., 1999). Nominated sites were monitored by volunteers with a water quality measurement kit for multiple physical/chemical water quality parameters (e.g., pH, electrical conductivity, dissolved oxygen and nutrients) and aquatic macro-invertebrate diversity (Waterwatch Australia Steering Committee, 2002). A range of quality assurance processes and guidance on data usage were also key elements of the national program. Despite these efforts, uptake and use of data from the national Waterwatch program was inconsistent and plagued with perceptions of poor quality and limited value (Hansen and Bonney, 2022). When national support for the Waterwatch program ceased in 2012, multiple regional Waterwatch programs folded, while others were maintained by state and territory funding, or contributions from water utilities, NGOs and community groups (Bonney et al., 2020).
Upper Murrumbidgee Waterwatch (also referred to a ‘ACT Waterwatch’) was established in the Australian Capital Territory (ACT) region in 1995 as part of a national Waterwatch program. Upper Murrumbidgee Waterwatch is focused on the upper Murrumbidgee River catchment, defined as all waters upstream of Burrinjuck Dam, New South Wales (S35.002, E148.584) with the exception of the Goodradigbee River catchment. In addition to the major city of Canberra, the predominant landuses within the catchment include urban and peri-urban development, agricultural (predominantly grazing) and nature conservation. The catchment area covered by the Upper Murrumbidgee Waterwatch program is approximately 11,400 km2 (Upper Murrumbidgee Waterwatch, 2015; Figure 1). Management of the program is split across five major subcatchment areas, each with a dedicated co-ordinator who is responsible for recruiting and training volunteers, managing equipment, and data quality control. A program facilitator oversees the whole program, and a data analyst provides support through data analysis, data quality assessments and research. Upper Murrumbidgee Waterwatch volunteers monitor a fixed site on a waterway by undertaking water quality measurements every month. Since 2013, bi-annual macro-invertebrate surveys have been conducted at ∼ 100 Waterwatch sites, primarily by the Upper Murrumbidgee Waterwatch program co-ordinators, with support from volunteers. In 2014, assessments of riparian condition, using the Rapid Appraisal of Riparian Condition (RARC) methodology (Jansen et al., 2005) were adopted, with every site being monitored biennially. Since commencing in 1995, there has been a steady increase in the amount of data collected annually across ∼230 sites in the upper Murrumbidgee River catchment (Figure 2).
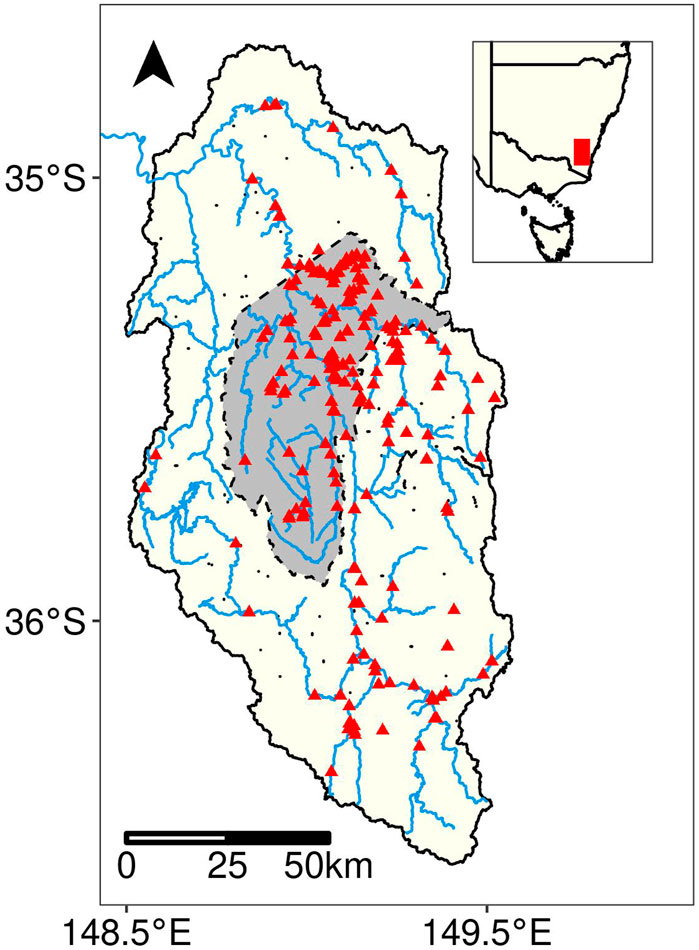
FIGURE 1. Map of upper Murrumbidgee River catchment. The Upper Murrumbidgee Waterwatch program monitoring sites are shown in red triangles. Australian Capital Territory shown in grey fill.
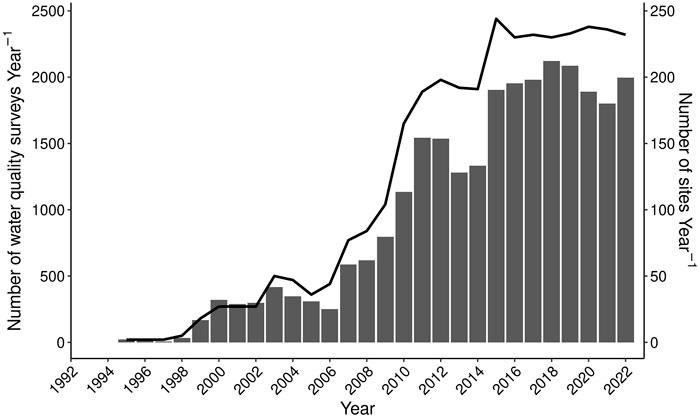
FIGURE 2. Timeline of growth in number of water quality surveys undertaken each year (bars) and number of sites monitored (line) each year by volunteers of the Upper Murrumbidgee Waterwatch program.
Leading up to 2013, national funding bodies were funnelling money through regional models and were becoming less supportive of the Waterwatch approach. The Upper Murrumbidgee Waterwatch program was receiving requests from regional funding advisers for evidence of the water quality data uptake as a case for continued support. While community groups used the data on an ad hoc basis, with some success stories of significant pollution events being detected by volunteers, there was little evidence of systematic use of data (Hansen and Bonney, 2022). In 2013, after nearly 20 years, the Australian Government ceased to fund any Waterwatch initiatives and Upper Murrumbidgee Waterwatch lost its core funding. It was clear that the program needed to improve confidence in potential funders and increase uptake in its data if the program was to continue.
Following the cessation of funds, Upper Murrumbidgee Waterwatch engaged the Institute for Applied Ecology, University of Canberra to review the strengths and weaknesses of Upper Murrumbidgee Waterwatch data. They were also asked to review the Catchment Health Indicator Program (CHIP), an annual report produced by Upper Murrumbidgee Waterwatch, which provides insight into the condition of the upper Murrumbidgee River catchment (Harrison et al., 2013).
The quality of citizen science data has been a long-running debate (Finlayson and Mitchell, 1999; Nicholson et al., 2002; Conrad and Hilchey, 2011; Aceves-Bueno et al., 2017; Stepenuck and Genskow, 2018; Brown and Williams, 2019). Issues with community-collected water quality and biodiversity data have been examined repeatedly (Fore et al., 2001; Nicholson et al., 2002; Loperfido et al., 2010; Dyer et al., 2014; Storey et al., 2016; Albus et al., 2020; Capdevila et al., 2020). In a similar vein, Harrison et al. (2013) compared Upper Murrumbidgee Waterwatch data to ‘professional data’ (including data from both the University of Canberra and ACT Government) collected by paid, professional staff. The report compared up to five parameters that were collected at the same riverine site =<10 days apart. It concluded that “…the Waterwatch database provides a good quality baseline dataset for assessing water quality in the ACT” and that where there has been “sufficiently regular collection of data, it is possible to use Waterwatch data in an early warning context”. While some differences were detected, these were mostly attributed to varying temporal scales or limitations of equipment (e.g., turbidity tubes not reading <9 NTU; Harrison et al., 2013). These findings were largely consistent with similar investigations that have examined the utility of data collected by community groups to inform catchment management (Nicholson et al., 2002; Loperfido et al., 2010; Loperfido et la. 2010; Storey et al., 2016; Nichols et al., 2017; Albus et al., 2020).
Harrison et al. (2013) also highlighted areas for improvement. For example, pH data was found to differ by up to 1.5 units compared to professionally collected data. An investigation into the equipment used by Upper Murrumbidgee Waterwatch indicated that the in use digital pH meters were not suitable for the purposes of monthly monitoring by volunteers due to being prone to sensor degradation and poor performance. As a solution, Upper Murrumbidgee Waterwatch switched to a simpler, cheaper method using litmus paper strips. A comparison between these ‘low-tech’ strips and the more sophisticated digital pH meters demonstrated that the strips were far more accurate than the probes and more reliable under field conditions. This demonstrated that the more expensive equipment is not always the most appropriate.
Quality Assurance and Quality Control (QAQC) processes and workshops were established early in the formation of the national Waterwatch program. The Upper Murrumbidgee Waterwatch program runs biannual workshops and volunteers are required to attend one of these per year. Volunteers test and record measurements of ‘mystery solutions’ produced in an analytical laboratory, to assess the accuracy of the combined water quality kits and user technique (sensu Loperfido et al., 2010). It would appear, however, that leading up to 2013, the implementation of the workshop had become the metric for data quality (e.g., a QC process was undertaken). The results from these workshops were never systematically reviewed to identify flaws in equipment, user technique or provide an assessment of measurement accuracy and precision. A review of historical records conducted in 2014, highlighted an ongoing issue with the pH meters that was supported by Harrison et al. (2013). This was not detected prior, despite years of assessing volunteers and equipment at workshops.
In 2014, Upper Murrumbidgee Waterwatch restructured these workshops and ensured that volunteer results were checked after the test was conducted and any issues troubleshooted immediately. For example, reagents in water quality measurement kits or batteries in digital probes may have needed replacing and then the volunteer would be asked to conduct the test again. A systematic approach to statistically analysing the data collected after each workshop was adopted, with a post-workshop report sent out to volunteers. This would show the volunteers how their collective results compared to the mystery solutions and reinforced key requirements regarding sampling technique. The outcome has been a more quantifiable measurement of results improving over time (Figure 3) and the volunteers anecdotally reporting greater confidence in their sampling.
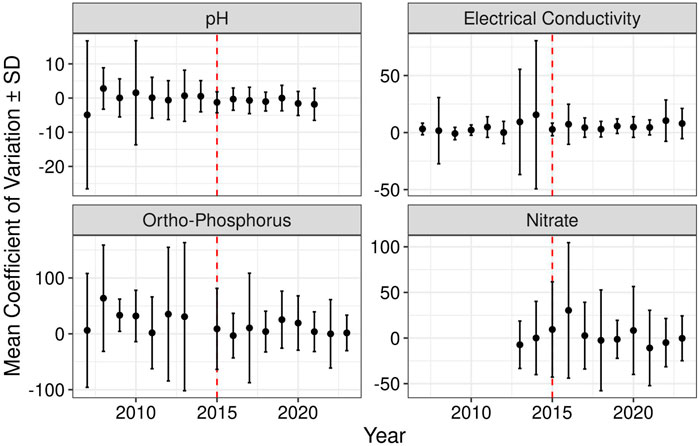
FIGURE 3. Mean coefficient of variation ±1 standard deviation (SD) by year for pH, electrical conductivity, ortho-phosphorus, and nitrate water quality parameters. Red dashed vertical line indicates when major reforms to the quality control workshop processes were enacted to improve accuracy and precision of water quality data collected by Upper Murrumbidgee Waterwatch volunteers.
The independent review by University of Canberra noted that Upper Murrumbidgee Waterwatch data was of the highest value where there was continuous data from a site for greater than three years (Harrison et al., 2013). The original national Waterwatch program encouraged community members to establish sites based on their own interests and needs. While this conveyed a sense of ownership from the public, it at times resulted in uneven coverage of the catchment. It also produced sites lacking continuous data as they may have only lasted as long as, for example, a single volunteer was monitoring on their private property. To address this, a review of all monitoring sites across the upper Murrumbidgee catchment was undertaken. This was not intended to close sites that were meaningful to the community or had active volunteers, but to allow for a systematic prioritisation over time. As a result of this review, additional monitoring sites were established in more pristine subcatchments, to improve overall coverage and give greater scope for analysing temporal variation in catchment health. At the time this was a contentious change, as it was seen as a major shift in the approach of the program by centralising control over new and existing monitoring sites. This has previously been described as the tension between efficiency and inclusiveness in citizen science programs (Bonney et al., 2023).
A key consideration regarding the uptake of data was around improving the accessibility and integrity of the Upper Murrumbidgee Waterwatch dataset. Before 2014, the data collected by volunteers from the Upper Murrumbidgee Waterwatch program were spread across four separate community groups, with varying degrees of public access. Some of the data still existed on hardcopy datasheets, having never been entered into a database. The data for the entire Upper Murrumbidgee Waterwatch program is now curated within the Atlas of Living Australia (ALA) - a national, publicly accessible biodiversity database platform (Belbin et al., 2021). The ALA houses over 30,000 data records from 350 Upper Murrumbidgee Waterwatch sites. Establishing a fit-for-purpose database solution for the program has been foundational to providing confidence in the data, and ensuring it is always highly accessible.
The other accessibility challenge was to turn the data into information that was digestible to a broad audience yet is detailed enough to be useful to catchment managers. The annual Upper Murrumbidgee Waterwatch CHIP report card, piloted in 2002, aimed at displaying a range of indicators such as water quality, aquatic macro-invertebrates, riparian vegetation condition assessments as well as groundcover and other broader landscapes uses (based on Walker and Reuters 1996). This ambitious approach proved unsustainable and by 2012, the CHIP was presenting only water quality at a coarse spatial scale, greatly limiting its ability to inform catchment managers. There was little interpretation provided, no guidance on issues driving water quality and no suggested areas for improvement.
The review undertaken by Harrison et al. (2013) recommended that some additional catchment health indicators be used rather than just water quality. Upper Murrumbidgee Waterwatch adapted the approach to focus on waterways (as opposed to land-use parameters) with water quality, aquatic macro-invertebrates (SIGNAL method; Chessman, 2003) and riparian vegetation (Rapid Appraisal of Riparian Condition method; Jansen et al., 2005) being chosen to provide a numerical health score. It was suggested that these scores would be displayed at a ‘reach’ scale, cutting up sections of rivers or individual wetlands, using a model similar to the Index of Stream Condition (Ladson et al., 1999). Harrison et al. (2013) recommended that these reaches would ideally contain two or more Waterwatch sites (to minimise site-level and participant-level effects) and be defined based on differing land uses and significant hydrological inputs. All the recommendations by Harrison et al. (2013) were adopted by 2015.
To produce a numerical score of catchment health, consideration was given to developing thresholds for water quality scores using non-Waterwatch data in upland rivers of the upper Murrumbidgee River catchment. Data was selected from sites with minimal degrees of environmental disturbance. This approach was adopted to establish a ‘reference condition’ (Armcanz, 2000). Thresholds for declining water quality were defined statistically by deviation away from reference condition. A minimum density of data within a reporting year was also established to reduce bias and maximise confidence in the catchment health scores being calculated. Reaches were then displayed in individual report cards with a table highlighting the results, a map, a photo, plus an interpretation of that year’s data (Figure 4).
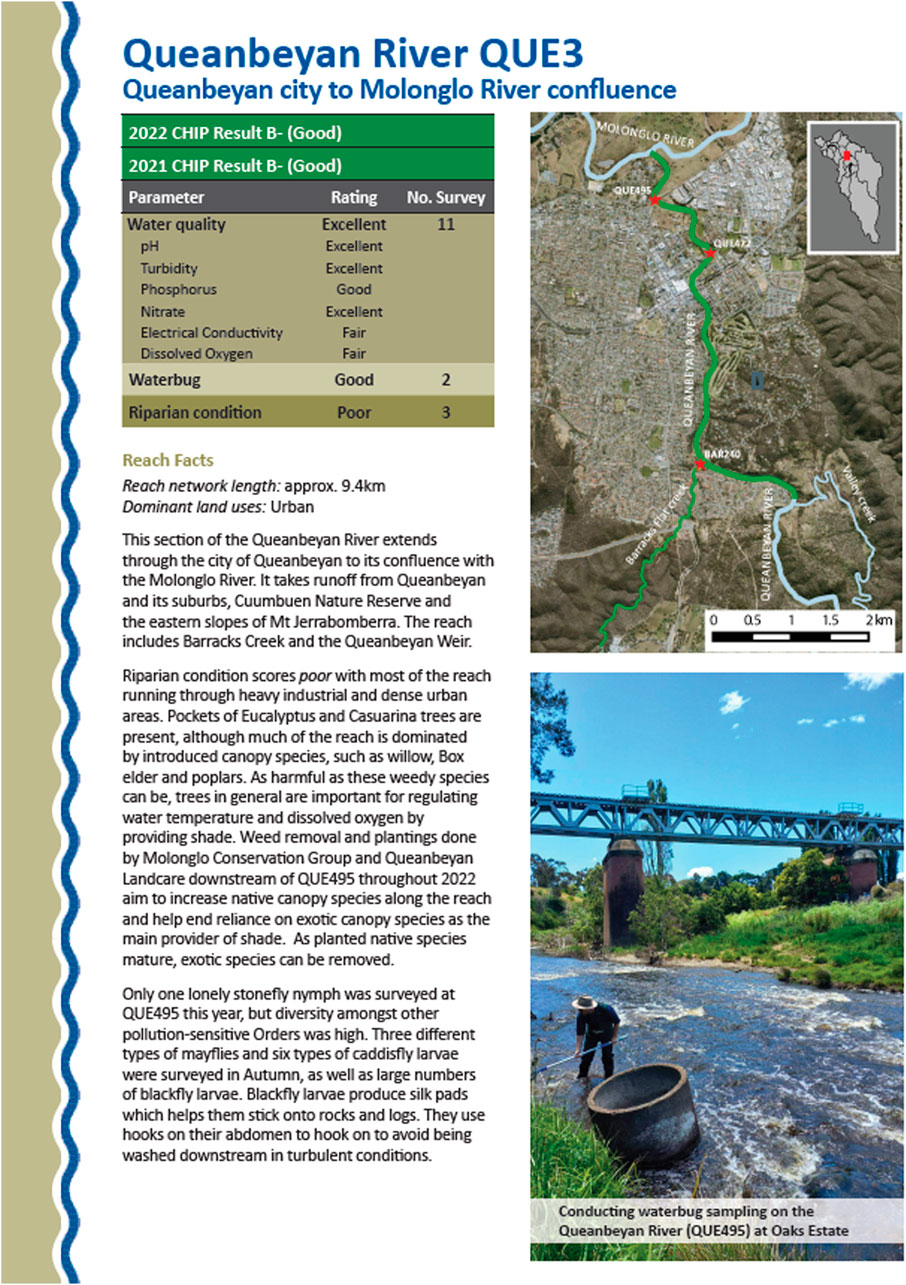
FIGURE 4. An example of one of 97 Catchment Health Indicator Program (CHIP) report cards from the 2022 report. Each report contains a summary of volunteer data, interpretation for the year’s results, as well as maps and photos of the sites and/or volunteers.
Upper Murrumbidgee Waterwatch has now produced eight CHIP reports (Upper Murrumbidgee Waterwatch, 2015; Upper Murrumbidgee Waterwatch, 2023). The report on condition in 2022 contained 97 report cards using 1992 water quality records, 192 aquatic macro-invertebrate surveys and 232 riparian condition assessments from 237 Waterwatch sites collected by over 200 Waterwatch volunteers and five staff (Upper Murrumbidgee Waterwatch, 2023). As well as the summarising the data and providing an assessment of catchment health, volunteer images are present throughout the document and they are encouraged to take photos and provide comments to be included in the report. Thus, the report also provides an opportunity to include and celebrate the community behind this important data source, highlighting aspects of the collaborative typology around community participation and engagement. The annual CHIP report is the main output of the Upper Murrumbidgee Waterwatch program and is a primary source of current information on catchment health in the upper Murrumbidgee catchment.
The CHIP report receives a range of media coverage on its release every year and Upper Murrumbidgee Waterwatch data now features in multiple community and government strategies and reports. These include.
• The current ACT Water Strategy (2014–2044) has an outcome titled: Improve water monitoring and analysis across the ACT and region. Here it highlights ‘Better integration of Waterwatch activities into a broader monitoring program’ as one of its actions (ACT Government, 2014).
• Within the ACT Government’s Environment Division, the Biodiversity, Research and Monitoring Program, the Aquatic and Riparian Ecosystems Monitoring Plan, Conservation Effectiveness Monitoring Program as well as the Integrated Water Monitoring Plan, all include Upper Murrumbidgee Waterwatch data to inform on catchment and aquatic ecosystem health and condition.
• The local water utility, Icon Water, is using Upper Murrumbidgee Waterwatch data as part of their three-year source water sanitation survey to determine the nature and extent of likely contaminants entering the catchments.
• The 2019 ACT State of Environment report featured Upper Murrumbidgee Waterwatch data prominently in a number of sections of the report (OCSE, 2019). Likewise, an assessment of the State of Urban Waterways in 2022 relied heavily on Upper Murrumbidgee Waterwatch data to inform on current condition and provide management recommendations on urban water management (OCSE, 2022).
• Upper Murrumbidgee Waterwatch data is regularly used in Environmental Impact Assessments, given its high spatial and temporal coverage (e.g., GHD, 2021).
Upper Murrumbidgee Waterwatch has provided advice to other citizen science programs and contributed to a number of academic outputs, as interest grows in the program’s success (Bonney et al., 2020; 2023; Hansen and Bonney, 2022). The spatial and temporal coverage of water quality data provided by the program is unmatched in the ACT region. Upper Murrumbidgee Waterwatch has successfully challenged preconceptions of citizen science, and its data has gone from being an underutilised resource on the fringe to an integral source of catchment health information for the ACT and region.
Following the cessation of funds from the Australian Government in 2013, funding for the Upper Murrumbidgee Waterwatch program has come predominantly from the ACT Government as well as some funds from the local water utility, Icon Water. The review by Harrison et al. (2013) was fundamental in securing funding for the Upper Murrumbidgee Waterwatch program. This financial security then enabled the refinement of the CHIP report which was key to ensuring data uptake and securing a strong business case for future funds. The continued support for a scientific officer position provided the resources to implement many of the recommendations of Harrison et al. (2013). Ensuring that data is fit-for-purpose and communicating this with policymakers and other data users, has been integral to the increase in uptake of Upper Murrumbidgee Waterwatch data. A review of a separate program, Waterwatch Victoria, highlighted limited resourcing, insufficient capabilities to interpret and communicate data at different scales, and the need to positive working relationships with waterway managers and policymakers, as three factors affecting their ability to effectively meet their objectives (Waterwatch Victoria, 2019). Bonney et al. (2023) further highlighted the challenges for ‘Mill Stream Waterwatch’ in getting acceptance of their data where both perceptions of quality and resources to invest in engaging with end users were not made available.
Ongoing funding was secured from ACT Government in 2020 to support program delivery, as well as ongoing funding for a citizen science data analyst. The role of the data analyst is to ensure ACT Government-funded citizen science programs (including Upper Murrumbidgee Waterwatch) have access to technical scientific support to aid both program design and data analysis. While this role is no longer solely dedicated to the Upper Murrumbidgee Waterwatch program, it does signal a broader appreciation for the value that citizen science data can contribute to policy and decision making in the ACT region, when collected, managed and analysed appropriately.
The national Waterwatch program began in 1992 with multiple objectives such as a strong emphasis on awareness raising and education, as well as the collection of data to inform catchment management. This approach has the hallmarks of the collaborative typology, defined by Bonney et al. (2009a). Volunteers, for example, were encouraged to choose a location that had relevance to them, and select the parameters they wished to measure (Waterwatch Victoria, 2000; Waterwatch Australia Steering Committee, 2002). The Upper Murrumbidgee Waterwatch program was established as part of the national program, however with the changes that have been implemented since 2013, Upper Murrumbidgee Waterwatch has shifted more towards the contributory typology, where a greater emphasis has been placed on data collection to inform decision making (Bonney et al., 2023).
While Upper Murrumbidgee Waterwatch has shifted to be more aligned with the contributory typology, it took the more successful aspects from the collaborative typology that helped to maintain volunteer experience and a sense of program ownership. For example, when Upper Murrumbidgee Waterwatch expanded into the Yass catchment, north of Canberra, sites were not purely chosen for their spatial relevance. Instead, staff had discussions with community groups and some sites were located where individual volunteers had concerns regarding pollution and wanted to investigate further. Upper Murrumbidgee Waterwatch also run workshops twice a year that include presentations or educational seminars on topics such as aquatic macro-invertebrate or plant identification. These opportunities can work to ensure volunteers feel valued for their contribution while improving their scientific confidence and monitoring skills. Such initiatives help to minimise the trade-offs between the two typologies and meet the multiple objectives of the program.
It is important to ensure that the different elements of a citizen science program be partitioned and appropriately managed in order to meet their objectives. Recognising there are trade-offs between these objectives, can also help to more effectively manage the risks. The national Waterwatch program promoted objectives of both participatory learning for sustainability and community-based monitoring (Thomson, 2007), however this potentially worked against it over the long term. The collection of data and the quality of that data, for example, had a varied scale right from beginning which aimed to accommodate the range of people collecting it and the multiple purposes it was collected for. The national Waterwatch manual (module 2), outlines a list of questions that volunteers could ask themselves when setting up their own monitoring plans. One question posed to volunteers was ‘What data quality do you want?‘, stating: “For groups with a focus on education and awareness raising, the quality of the data is secondary to the actual process of collecting it” (Waterwatch Australia Steering Committee, 2002). Centralisation and prioritisation towards collecting high quality data has contributed to loss of autonomy for Upper Murrumbidgee Waterwatch volunteers (e.g., they cannot choose where their monitoring site is located). This may be perceived as diminishing the volunteer experience, as greater consideration is given to program-level, or funding agency objectives (internal vs. external legitimacy; Bonney et al., 2023). Conversely, collecting high quality data has contributed to the long-term stability of the program, which otherwise would likely have collapsed once the national funding ceased - a fate shared by many of the regional Waterwatch programs.
Moving to a more contributory typology has not deterred volunteers from participating in the Upper Murrumbidgee Waterwatch program. In fact, the clear direction, greater data uptake and higher profile of the program has highlighted to volunteers that they are part of something bigger and that their efforts are making a positive difference to their waterways (Bonney et al., 2023). In shifting towards the contributory typology, Upper Murrumbidgee Waterwatch has not lost sight of the additional objectives around community education, participation and engagement. Rather, the primary focus on collecting data that can inform policy and management decisions can be a motivation and tangible benefit for participants (Phillips et al., 2019; Land-Zandstra et al., 2021). Through time, there has not been a significant loss or down-turn in volunteers, suggesting that shifting the primary objectives of the program have not had a deleterious impact on volunteer participation. This is evidenced by the stable number of sites monitored and volume of data collected annually (Figure 2). This reinforces that taking a strong, science-first approach coupled with an appreciation of the value of volunteer participation, can lead to both good data collection and strong volunteer engagement and retention through time.
Collecting Waterwatch data through schools had long been a significant component of the national program (Thomson, 2007). Upper Murrumbidgee Waterwatch, however, made the decision when funding was re-instated, to not engage schools for the purposes of data collection. Opinion is divided on the quality of data collected through schools, however a lack of quantification of this perceived issue further adds to the uncertainty. While schools are capable of producing good quality data, there are additional costs, limitations and risks involved that can potentially undermine the process and affect perceptions of data integrity. Primary school children, for example, cannot test all the required parameters due to chemicals associated with the kits, reducing the utility of data. There are many quality control risks associated with an entire class collecting data, and greater ongoing investment is required to find and train teachers who will champion the data collection. Many Waterwatch program coordinators would have witnessed sampling ceasing or data quality deteriorating once that ‘champion’ teacher had left the school. For example, an internal review of 20 years of data from the Streamwatch program (a sister program to Waterwatch based in Sydney, Australia), found that the number of errors in their schools-dominated dataset meant it was not suitable for a long-term analysis of stream health (Greg McDonald, pers. comm). Data from a smaller subset of adult Streamwatch volunteers, were, however, found to be more robust and amenable to providing cleaner, consistent signals for analysis. As recognised in the Waterwatch Victoria Data Confidence manual (Waterwatch Victoria, 2000), the primary focus of school children participating in data collection may not be the collection of data to inform decision makers, but rather the education opportunities and experience. The Waterwatch Victoria Data Confidence Framework guided a number of Data Confidence Plans for various regional Waterwatch programs (e.g., North Central Catchment Management Authority, 2008; North East Waterwatch Program, 2009). These plans gave varying advice about whether to include school-collected data in their official database or to recommend it purely for assignments and educational purposes. This inconsistent approach to school-collected data may exacerbate ongoing perceptions of citizen science data being of poor quality.
Since Upper Murrumbidgee Waterwatch partitioned the data collection and education components of the program, a range of educational initiatives have occurred. Staff have written education manuals for varying age groups accompanied by curriculum alignments to assist teachers. They also provide hands on classes in schools every week and will often conduct, and control the quality of, aquatic macro-invertebrate surveys while allowing students to assist in the identification. School engagement may have more citizen science elements too, such as providing students with a water quality kit and teaching them about experimental design and methods. This way they can come up with their own question such as ‘how effective are urban wetlands at improving water quality?’ which may deliver management outcomes and provide students with a valuable experience while not risking the real and perceived integrity of the dataset. In short, there are many other ways to involve and empower students to make a positive impact and connect to their local waterways that go beyond monthly water quality testing.
By partitioning and appropriately managing the key objectives of the Upper Murrumbidgee Waterwatch program, they are all given the recognition and value they deserve. The citizen science aspects may be considered the centrepiece of the Upper Murrumbidgee Waterwatch program, but it complements the education and engagement components to achieve better outcomes for our waterways. Education and community engagement are often undervalued and underfunded due in part to their ongoing nature and the difficulty in showing quantitative evidence of effect. In the case of Upper Murrumbidgee Waterwatch, once funding for data collection was secured, additional funds were sought and received to re-establish the program education activities. Packaging education and engagement initiatives together with high quality, well integrated catchment health data, is an effective way to achieve long term security for all key areas.
Distinguishing between the different program elements of data collection, education and awareness raising are key in order for Upper Murrumbidgee Waterwatch to clearly articulate what it is trying to achieve and being able to measure success. In the past, the implementation of the Waterwatch programs appeared to be the indicator of success (e.g., number of volunteers, amount of data collected and number of workshops conducted). Program coordinators are now recognising, however, that these are the engagement metrics, and emphasis on indicators such as data quality, coverage and density as well as conveying results and gauging data uptake are critical (Hansen and Bonney, 2022). More funding bodies should encourage an output-based approach to citizen science program design as this can support program adoption by the general public and aid in producing meaningful data (Bonney et al., 2009a; Brown and Williams, 2019). Explicit recognition of what is ‘fit-for-purpose’ and acknowledging the relative strengths and limitations of data can also address issues related to perceptions of poor data quality. Clearly establishing what questions you want to answer and ensuring the data collected is fit-for-purpose should be a primary focus of any citizen science program–regardless of whether they are co-created, collaborative or contributory models. Engaging the community on a particular issue as the primary objective, however, creates a risk of adopting an inappropriate program design. If community engagement is the primary objective, consideration should be given to less-labour intensive and cost-effective ways to engage community that do not involve collecting and analysing data. This is not to say that citizen science programs are not extremely effective at engagement; rather designing it as a science program first, will ensure the community engagement and education elements are based on a foundation of scientific integrity.
The centralised network structure of Upper Murrumbidgee Waterwatch was reviewed by Bonney et al. (2023) who said that ‘the program operates from a strong foundation of central and regional coordination that promotes high efficiency of activities’. Program integration with policymakers and management, enhances opportunities for data re-use and influencing outcomes, and this should be explicitly considered in assessing program success (Bonney et al., 2020). In the case of Upper Murrumbidgee Waterwatch, coordinators sit in community groups and work directly with the volunteers, while the regional facilitator, who oversees the whole program, and the data analyst position, both sit within government. These latter roles work with academics, policymakers and other government monitoring programs to promote and add value to the data and collaborate on a range of citizen science subprojects (e.g., monitoring of platypus and invasive carp populations). This allows the community-based staff greater freedom to support volunteers and help address any direct environmental concerns whilst working with the regional facilitator to affect change through government decision-makers. While concerns were raised about whether the program was too dependent on the success of the regional facilitator position (Bonney et al., 2023), the many linkages across multiple community, government and academic fields means that the Upper Murrumbidgee Waterwatch program has many more powerful allies than it once did. The ongoing integration of volunteer-collected data into government frameworks further enhances security for the program.
Citizen science programs of great longevity have long been celebrated (Bonney et al., 2009b). It is widely recognised that citizen science can fulfil multiple objectives reflecting both strong scientific principles and high quality data, while also providing avenues for community participation in science, education, awareness raising and engagement (Bonney et al., 2009b; Phillips et al., 2019; Land-Zandstra et al., 2021). The Upper Murrumbidgee Waterwatch program has successfully shifted towards a more contributory typology, whilst recognising the positive elements that come with the original collaborative model, to achieve data uptake from decision makers and meet the requirements of funding agencies. While there are challenges associated with the tensions that can arise from different approaches to citizen science (Bonney et al., 2023), the Upper Murrumbidgee Waterwatch program has successfully negotiated these hurdles and become a well-integrated, accepted source of data on catchment health in the region. The program now has secure, ongoing funding to support its activities and promotes the use of other citizen science data in a range of environmental monitoring programs. Considering the science first in a citizen science program will help to support the community engagement and education goals while strengthening data integrity, uptake and program security.
WO: Conceptualization, Writing–original draft, Writing–review and editing. DS: Conceptualization, Writing–original draft, Writing–review and editing.
Funding for the Upper Murrumbidgee Waterwatch program is graciously provided by the ACT Government and Icon Water.
We are grateful for the tireless efforts of the Upper Murrumbidgee Waterwatch program co-ordinators and scientific officers. In particular we would like to acknowledge those who helped shape and implement these reforms including: Antia Brademann, Martin Lind, Damon Cusack, Deb Kellock, Stephen Skinner, Bruno Ferronato, Jed Pearson, Rod Ubrihien and Isobel Booksmythe. We appreciate the discussions and insights from Greg McDonald and gratefully acknowledge the support of the National Waterwatch network. We also gratefully acknowledge the constructive feedback provided by two reviewers. Finally, we thank the many hundreds of Upper Murrumbidgee Waterwatch volunteers who have given their valuable time to look after their local waterways. This program could not exist without you.
The authors declare that the research was conducted in the absence of any commercial or financial relationships that could be construed as a potential conflict of interest.
All claims expressed in this article are solely those of the authors and do not necessarily represent those of their affiliated organizations, or those of the publisher, the editors and the reviewers. Any product that may be evaluated in this article, or claim that may be made by its manufacturer, is not guaranteed or endorsed by the publisher.
Aceves-Bueno, E., Adeleye, A. S., Feraud, M., Huang, Y., Tao, M., Yang, Y., et al. (2017). The accuracy of citizen science data: a quantitative review. Bull. Ecol. Soc. Am. 98 (4), 278–290. doi:10.1002/bes2.1336
Albus, K. H., Thompson, R., Mitchell, F., Kennedy, J., and Ponette-Gonza´Lez, A. G. (2020). Accuracy of long-term volunteer water monitoring data: a multiscale analysis from a statewide citizen science program. PLoS One 15 (1), e0227540. doi:10.1371/journal.pone.0227540
Armcanz, A. (2000). in The guidelines/Australian and New Zealand environment and conservation Council, agriculture and resource management Council of Australia and New Zealand (Canberra: Australian and New Zealand guidelines for fresh and marine water quality), 1.Australian and New Zealand guidelines for fresh and marine water quality.
Belbin, L., Wallis, E., Hobern, D., and Zerger, A. (2021). The Atlas of Living Australia: history, current state and future directions. Biodivers. Data J. 9, e65023. doi:10.3897/BDJ.9.e65023
Bonney, P., Murphy, A., Hansen, B., and Baldwin, C. (2020). Citizen science in Australia’s waterways: investigating linkages with catchment decision-making. Australas. J. Environ. Manag. 27 (2), 200–223. doi:10.1080/14486563.2020.1741456
Bonney, P. R., Hansen, B. D., and Baldwin, C. (2023). Citizen science and natural resource management: a social network analysis of two community-based water monitoring programs. Soc. Nat. Resour. 36, 600–621. doi:10.1080/08941920.2023.2183445
Bonney, R., Ballard, H., Jordan, R., Mccallie, E., Phillips, T., Shirk, J., et al. (2009a). Public participation in scientific research: defining the field and assessing its potential for informal science education. Washington DC: Center for Advancement of Informal Science Education CAISE.
Bonney, R., Cooper, C. B., Dickinson, J., Kelling, S., Phillips, T., Rosenberg, K. V., et al. (2009b). Citizen science: a developing tool for expanding science knowledge and scientific literacy. BioScience 59 (11), 977–984. doi:10.1525/bio.2009.59.11.9
Bonney, R., Phillips, T. B., Ballard, H. L., and Enck, J. W. (2016). Can citizen science enhance public understanding of science? Public Underst. Sci. 25 (1), 2–16. doi:10.1177/0963662515607406
Boulton, A. J. (1999). An overview of river health assessment: philosophies, practice, problems and prognosis. Freshw. Biol. 41 (2), 469–479. doi:10.1046/j.1365-2427.1999.00443.x
Brown, E. D., and Williams, B. K. (2019). The potential for citizen science to produce reliable and useful information in ecology. Conserv. Biol. 33 (3), 561–569. doi:10.1111/cobi.13223
Callaghan, C. T., Rowley, J. J. L., Cornwell, W. K., Poore, A. G. B., and Major, R. E. (2019). Improving big citizen science data: moving beyond haphazard sampling. PLoS Biol. 17 (6), e3000357. doi:10.1371/journal.pbio.3000357
Capdevila, A. S. L., Kokimova, A., Ray, S., Avellan, T., Kim, J., and Kirschke, S. (2020). Success factors for citizen science projects in water quality monitoring. Sci. Total Environ. 728, 137843. doi:10.1016/j.scitotenv.2020.137843
Chessman, B. C. (2003). New sensitivity grades for Australian river macroinvertebrates. Mar. Freshw. Res. 54, 95–103. doi:10.1071/MF02114
Conrad, C. C., and Hilchey, K. G. (2011). A review of citizen science and community-based environmental monitoring: issues and opportunities. Environ. Monit. Assess. 176 (1-4), 273–291. doi:10.1007/s10661-010-1582-5
Dyer, F., Harrison, E., Gruber, B., Nichols, S., Tschierschke, A., and O’reilly, W. (2014). in Waterwatch data quality: an opportunity to augment professionally collected data sets. Editors G. Vietz, I. D. Rutherfurd, and R. Hughes (Queensland: Townsville), 357–362.
Finlayson, C. M., and Mitchell, D. S. (1999). Australian wetlands: the monitoring challenge. Wetl. Ecol. Manag. 7, 105–112. doi:10.1023/a:1008437529037
Fore, L. S., Paulsen, K., and O'laughlin, K. (2001). Assessing the performance of volunteers in monitoring streams. Freshw. Biol. 46, 109–123. doi:10.1111/j.1365-2427.2001.00640.x
GHD (2021). Appendix F: lower Deep creek pond water quality and hydrology assessment. Canberra: GHD.
Hansen, B., and Bonney, P. (2022). Learning from successful long-term citizen science programs. Pac. Conserv. Biol. PC21065, 292–299. doi:10.1071/pc21065
Harrison, E., Dyer, F., Gruber, B., Nichols, S., and Tschierschke, A. (2013). ACT Waterwatch data review. Canberra: Institute for Applied Ecology, University of Canberra.
Jansen, A., Robertson, A., Thompson, L., and Wilson, A. (2005). Rapid appraisal of riparian condition: land and water Australia.
Kieslinger, B., Schäfer, T., Heigl, F., Dörler, D., Richter, A., and Bonn, A. (2017). The challenge of evaluation: an open framework for evaluating citizen science activities. SocArXiv. doi:10.31235/osf.io/enzc9
Kosmala, M., Wiggins, A., Swanson, A., and Simmons, B. (2016). Assessing data quality in citizen science. Front. Ecol. Environ. 14 (10), 551–560. doi:10.1002/fee.1436
Ladson, A. R., White, L. J., Doolan, J. A., Finlayson, B. L., Hart, B. T., Lake, P. S., et al. (1999). Development and testing of an Index of stream condition for waterway management in Australia. Freshw. Biol. 41 (2), 453–468. doi:10.1046/j.1365-2427.1999.00442.x
Land-Zandstra, A., Agnello, A., and Gültekin, Y. S. (2021). The science of citizen science. Editors K. Vohland, A. Land-Zandstra, L. Ceccaroni, L. Lemmens, J. Perelló, M. Pontiet al. (Cham: Springer).
Loperfido, J. V., Beyer, P., Just, C. L., and Schnoor, J. L. (2010). Uses and biases of volunteer water quality data. Environ. Sci. Technol. 44, 7193–7199. doi:10.1021/es100164c
Nascimento, S., Iglesias, J. M. R., Owen, R., Schade, S., and Shanley, L. (2018). Citizen science: innovation in open science, society and policy. Editors S. Hecker, M. Haklay, A. Bowser, Z. Makuch, J. Vogel, and A. Bonn (London: UCL Press).
Nichols, S. J., Barmuta, L. A., Chessman, B. C., Davies, P. E., Dyer, F. J., Harrison, E. T., et al. (2017). The imperative need for nationally coordinated bioassessment of rivers and streams. Mar. Freshw. Res. 68 (4), 599–613. doi:10.1071/mf15329
Nicholson, E., Ryan, J., and Hodgkins, D. (2002). Community data - where does the value lie? Assessing confidence limits of community collected water quality data. Water Sci. Technol. 45 (11), 193–200. doi:10.2166/wst.2002.0395
North Central Catchment Management Authority (2008). North central Waterwatch Data confidence plan. [Online] Available at: https://www.vic.waterwatch.org.au/resources/NC_DC_Plan_Oct_2008.pdf (Accessed July 27, 2023).
North East Waterwatch Program (2009). Data confidence plan. [Online] Available at: https://www.vic.waterwatch.org.au/resources/North_East_Final_Data_Confidence_Plan_09.pdf (Accessed July 27, 2023).
Office of the Commissioner for Sustainability and the Environment (2019). ACT state of the environment report 2019. Canberra: OCSE.
Office of the Commissioner for Sustainability and the Environment (2022). State of the lakes and waterways in the ACT. Canberra: OCSE.
Peter, M., Diekötter, T., and Kremer, K. (2019). Participant outcomes of biodiversity citizen science projects: a systematic literature review. Sustainability 11 (10), 2780. doi:10.3390/su11102780
Phillips, T. B., Ballard, H. L., Lewenstein, B. V., and Bonney, R. (2019). Engagement in science through citizen science: moving beyond data collection. Sci. Educ. 103 (3), 665–690. doi:10.1002/sce.21501
Reuter, D. (1998). Developing indicators for monitoring catchment health: the challenges. Aust. J. Exp. Agric. 38, 637–648. doi:10.1071/ea97141
Schacher, A., Roger, E., Williams, K. J., Stenson, M. P., Sparrow, B., and Lacey, J. (2023). Use-specific considerations for optimising data quality trade-offs in citizen science: recommendations from a targeted literature review to improve the usability and utility for the calibration and validation of remotely sensed products. Remote Sens. 15 (5), 1407. doi:10.3390/rs15051407
Stepenuck, K. F., and Kenskow, K. D. (2018). Characterizing the breadth and depth of volunteer water monitoring programs in the United States. Environ. Manag. 61, 46–57. doi:10.1007/s00267-017-0956-7
Storey, R. G., Wright-Stow, A., Kin, E., Davies-Colley, R. J., and Stott, R. (2016). Volunteer stream monitoring: do the data quality and monitoring experience support increased community involvement in freshwater decision making? Ecol. Soc. 21 (4), art32. doi:10.5751/es-08934-210432
Thomson, D. (2007). “Waterwatch – an integrated capacity building initiative,” in 5th Australian stream management conference. Editors A. L. Wilson, R. L. Dehaan, R. J. Watts, K. J. Page, K. H. Bowmer, and A. Curtis (Thurgoona, New South Wales, 395–400.
Tulloch, A. I. T., Possingham, H. P., Joseph, L. N., Szabo, J., and Martin, T. G. (2013). Realising the full potential of citizen science monitoring programs. Biol. Conserv. 165, 128–138. doi:10.1016/j.biocon.2013.05.025
Upper Murrumbidgee Waterwatch (2015). Catchment health indicator program 2014-15. Canberra: Upper Murrumbidgee Waterwatch.
Upper Murrumbidgee Waterwatch (2023). Catchment health indicator program: report card 2022. Canberra: Upper Murrumbidgee Waterwatch.
Waterwatch Australia Steering Committee (2002). Waterwatch Australia national technical manual. Canberra: Environment Australia.
Waterwatch Victoria (2000). Data confidence plan. [Online] Available at: https://www.vic.waterwatch.org.au/resources/Data_confidence_VIC_June_2000.pdf (Accessed July 24, 2023).
Keywords: Waterwatch, citizen science, data quality, water, bioassessment, catchment health
Citation: O’Reilly W and Starrs D (2023) Science citizen: shifting to a “science-first” approach and recognising the trade-offs between objectives in a long-term citizen science program. Front. Environ. Sci. 11:1270247. doi: 10.3389/fenvs.2023.1270247
Received: 31 July 2023; Accepted: 24 October 2023;
Published: 13 November 2023.
Edited by:
Igor Ogashawara, Leibniz-Institute of Freshwater Ecology and Inland Fisheries (IGB), GermanyReviewed by:
Jaume Piera, Spanish National Research Council (CSIC), SpainCopyright © 2023 O’Reilly and Starrs. This is an open-access article distributed under the terms of the Creative Commons Attribution License (CC BY). The use, distribution or reproduction in other forums is permitted, provided the original author(s) and the copyright owner(s) are credited and that the original publication in this journal is cited, in accordance with accepted academic practice. No use, distribution or reproduction is permitted which does not comply with these terms.
*Correspondence: Woo O’Reilly, d29vLm9yZWlsbHlAYWN0Lmdvdi5hdQ==
Disclaimer: All claims expressed in this article are solely those of the authors and do not necessarily represent those of their affiliated organizations, or those of the publisher, the editors and the reviewers. Any product that may be evaluated in this article or claim that may be made by its manufacturer is not guaranteed or endorsed by the publisher.
Research integrity at Frontiers
Learn more about the work of our research integrity team to safeguard the quality of each article we publish.